Article

Integrated Transcriptomic Analysis Reveals Molecular Mechanisms Underlying Albinism in Schima superba Seedlings

1
Guangxi Key Laboratory of Superior Timber Trees Resource Cultivation, Guangxi Zhuang Autonomous Region Forestry Research Institute, Nanning 530002, China
2
Masson Pine Engineering Technology Research Center of Guangxi, Nanning 530002, China
3
Key Laboratory of Central South Fast-Growing Timber Cultivation of Forestry Ministry of China, Nanning 530002, China
*
Author to whom correspondence should be addressed.
These authors contributed equally to this work and share first authorship.
Forests 2025, 16(8), 1201; https://doi.org/10.3390/f16081201
Submission received: 9 June 2025 / Revised: 16 July 2025 / Accepted: 18 July 2025 / Published: 22 July 2025
(This article belongs to the Special Issue Forest Tree Breeding: Genomics and Molecular Biology)

Abstract

The main objective of this study was to reveal the molecular mechanism of the albinism in Schima superba and to identify the related functional genes to provide theoretical support for the optimization of S. superba seedling nursery technology. Combining third-generation SMRT sequencing with second-generation high-throughput sequencing technology, the transcriptomes of normal seedlings and albinism seedlings of S. superba were analyzed and the sequencing data were functionally annotated and deeply resolved. The results showed that 270 differentially expressed transcripts were screened by analyzing second-generation sequencing data. KEGG enrichment analysis of the annotation information revealed that, among the photosynthesis-antenna protein-related pathways, the expression of LHCA3 and LHCB6 was found to be down-regulated in S. superba albinism seedlings, suggesting that the down-regulation of photosynthesis-related proteins may affect the development of chloroplasts in leaves. Down-regulated expression of VDE in the carotenoid biosynthesis leads to impaired chlorophyll cycling. In addition, transcription factors (TFs), such as bHLH, MYB, GLK and NAC, were closely associated with chloroplast development in S. superba seedlings. In summary, the present study systematically explored the transcriptomic features of S. superba albinism seedlings, screened out key genes with significant differential expression and provide a reference for further localization and cloning of the key genes for S. superba albinism, in addition to laying an essential theoretical foundation for an in-depth understanding of the molecular mechanism of the S. superba albinism. The genes identified in this study that are associated with S. superba albinism will be important targets for genetic modification or molecular marker development, which is essential for improving the cultivation efficiency of S. superba.

1. Introduction

Leaf bleaching is a widespread phenomenon in plants, mainly caused by a reduction in chlorophyll content, impairment of photosynthesis and abnormal chloroplast development. The underlying mechanisms are intricate, encompassing disruptions in hormonal balance, chloroplast biogenesis and chlorophyll biosynthesis. Albinism in woody plants has been reported in several cases. For instance, Areca catechu seedlings display a 0.2% incidence of streaked albinism leaves, which typically results in mortality within months [1]. Cocos nucifera albinism seedlings are unable to metabolize iron efficiently. Although partial rescue can be achieved through exogenous iron supplementation, these plants ultimately perish [2]. Delonix regia albinism seedlings survive for no more than 3 weeks before cotyledon degradation [3]. Similar phenotypes have also been observed in Artocarpus heterophyllus [4], Citrus reticulata [5] and Malus pumila [6].
Albinism is associated with several characteristics: (1) pigment deficiency, marked by a significant decrease in photosynthetic pigments; (2) chloroplast defects, including malformed ultrastructure (e.g., Cucumis sativus CsTIC21 mutants show vesicle loss [7]) or absence (Populus alba PtrDJ1C mutants [8]); (3) epidermal abnormalities, such as fewer trichomes and dysfunctional stomata [9].
Transcriptomic analyses have uncovered conserved molecular signatures. In Prunus salicina, albinism is related to the dysregulation of genes involved in chloroplast development and photosynthesis [10]. In Bambusa oldhamii albinos, genes related to light-harvesting (LHC, GUN4) and photosystem (Psa, Psb) are down-regulated [11]. In Camellia nanchuanica, albinism is driven by CsNYC1a-mediated chlorophyll degradation [12].
Schima superba (Theaceae) is an evergreen tree of great ecological and economic importance in southern China, growing at altitudes ranging from 150 to 1000 m. It is highly valued for its rapid growth, durable timber [13] and medicinal properties [9]. Extensive research has been conducted on its photosynthetic characteristics [14], growth [15], and ecology [16]. S. superba albinism seedlings are difficult to recognize in the early stages, as albinism symptoms are not easily detected at this stage. However, albinism symptoms can gradually worsen over the next few months, resulting in low survival rates of S. superba seedlings. However, there are no reports regarding albinism in this species. Here, we utilized full-length (PacBio SMRT) and Illumina RNA-seq to compare S. superba albinism and normal seedlings. By identifying differentially expressed genes (DEGs), we aimed to identify key genes associated with leaf albinism in S. superba. The results of the study lay a theoretical foundation for identifying and cloning the key genes responsible for albinism traits in S. superba and provide new insights into elucidating the molecular mechanism of albinism phenotype formation in S. superba.

2. Materials and Methods

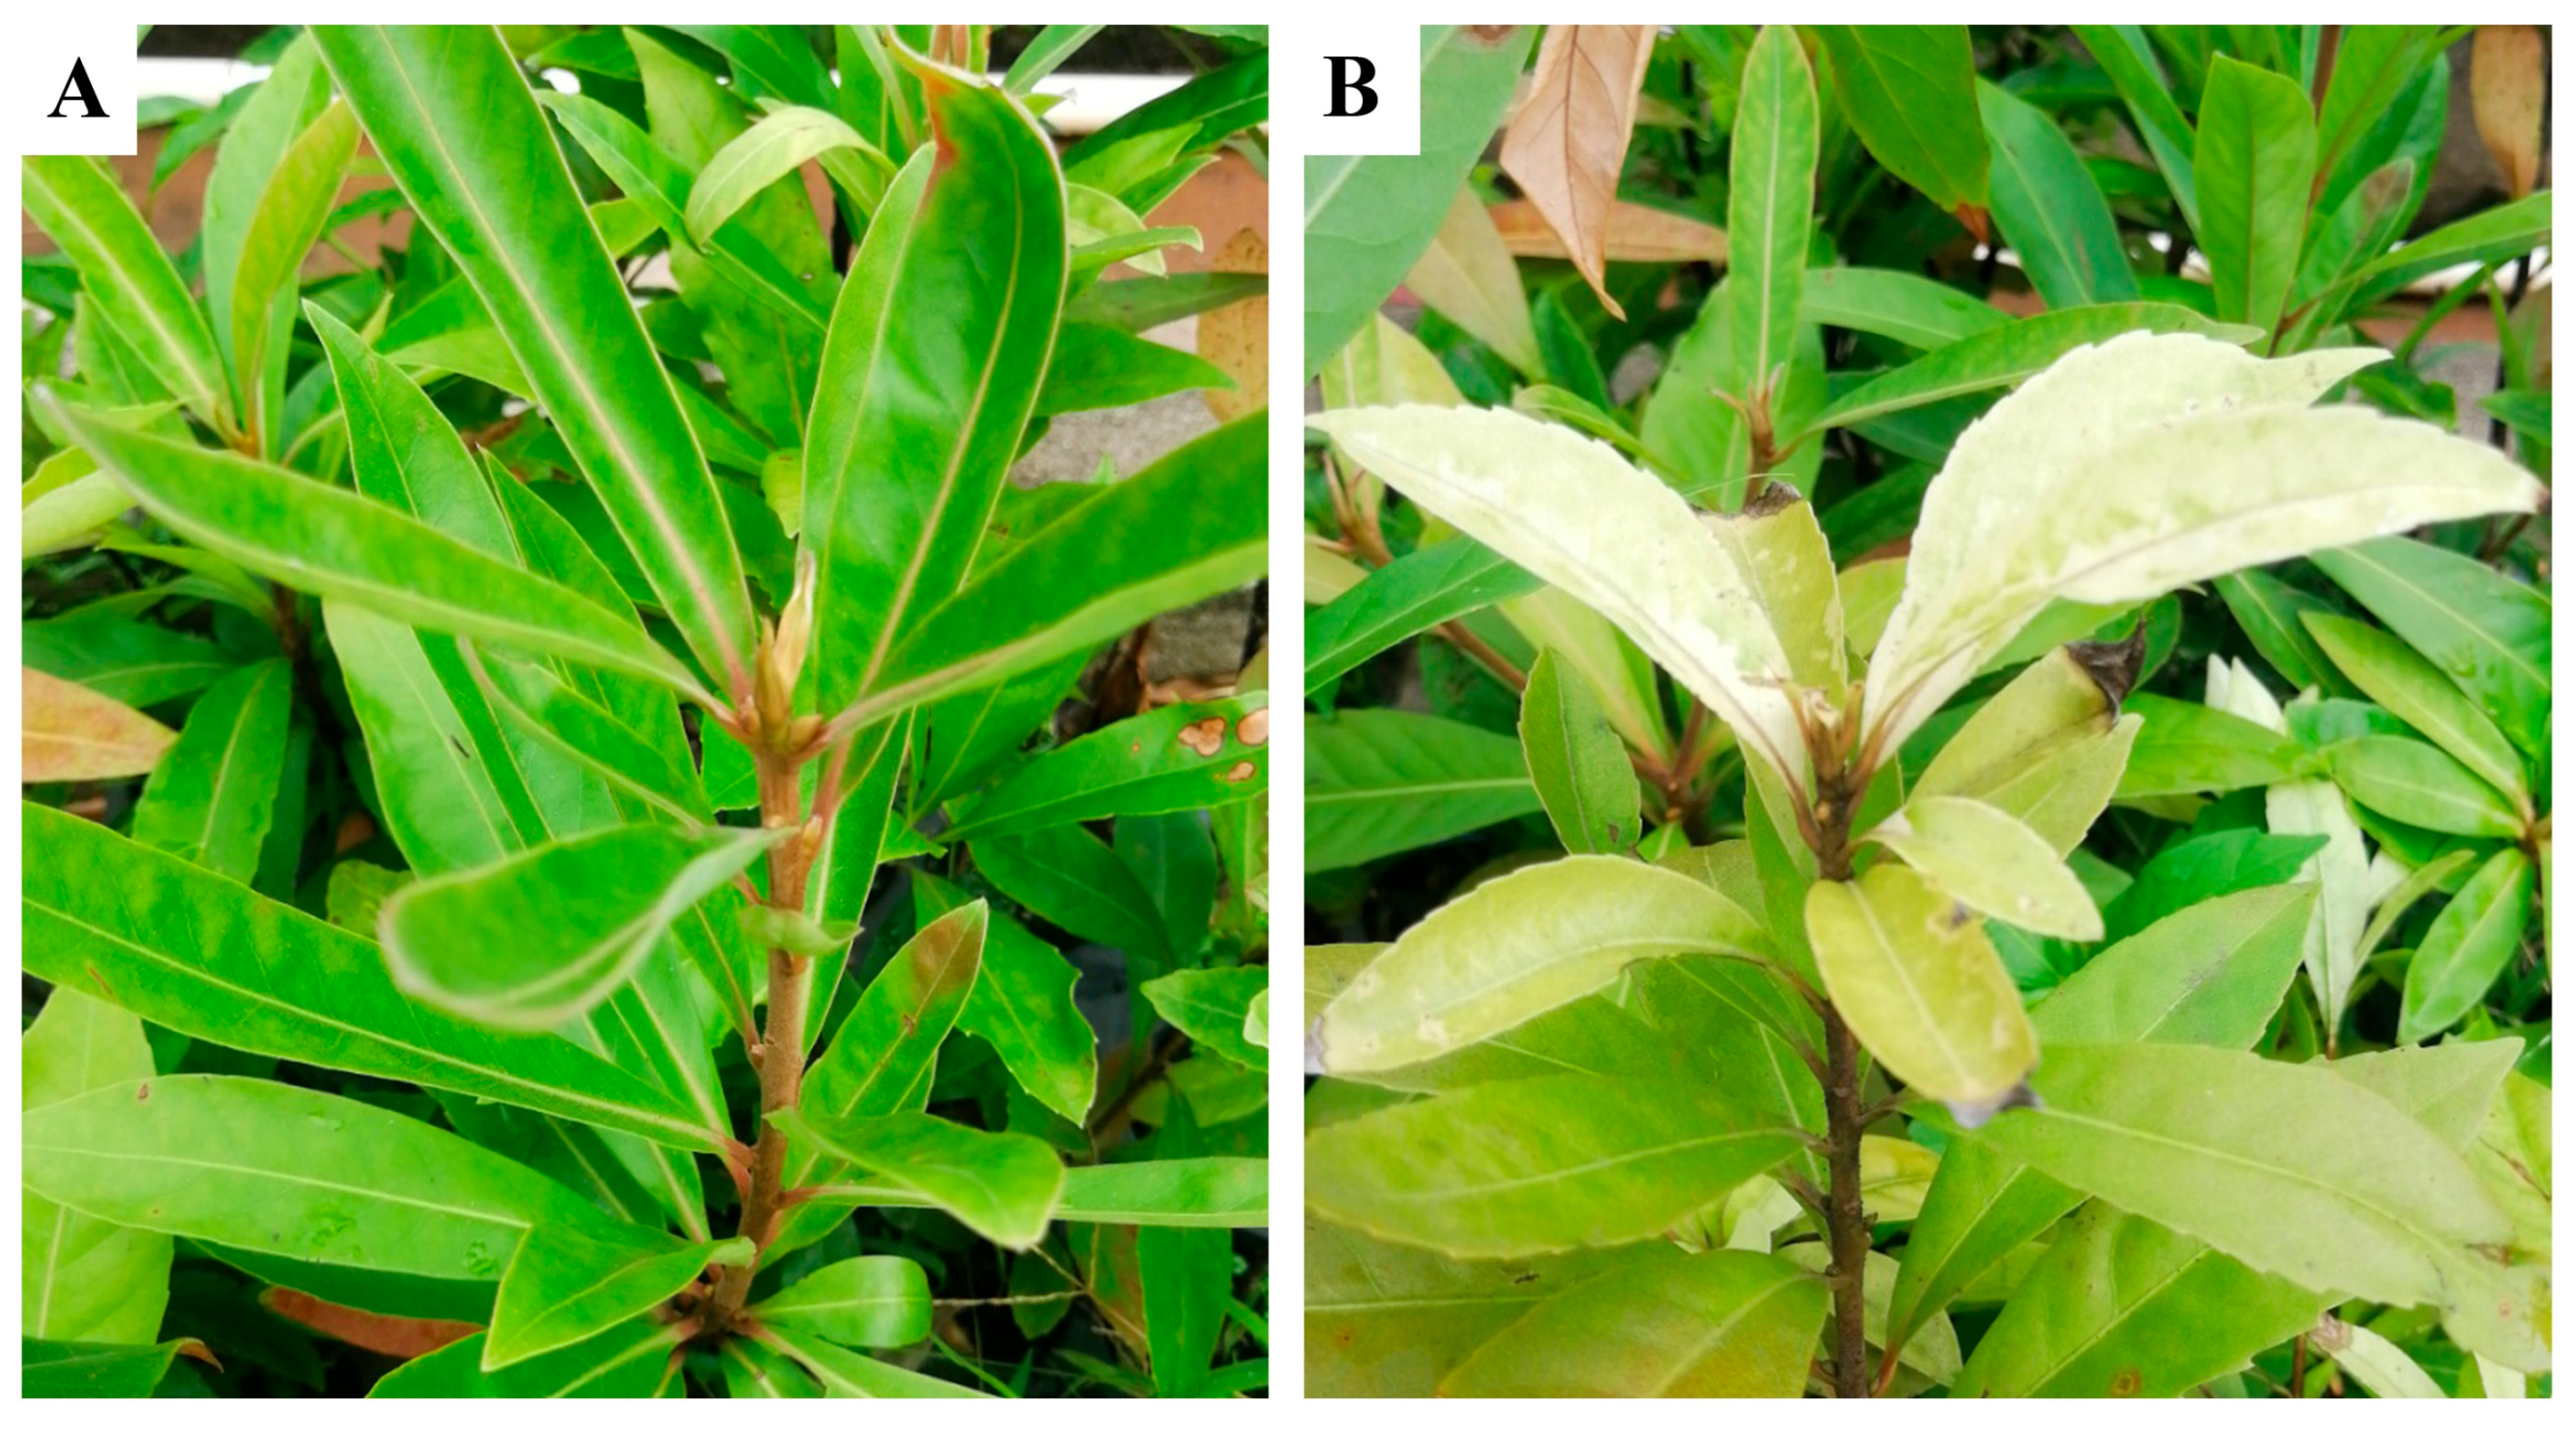
2.1. Plant Materials and Samplings

Annual S. superba seedlings cultivated in the experimental nursery of the Guangxi Masson Pine Engineering Center were selected as research materials. Both albinism and normal seedlings belong to Schima argentea. We observed a clear distinction in leaf color between normal and albinism seedlings of S. superba (Figure 1): the leaves of normal S. superba exhibited green, while those of albinism plants presented significantly white or light-green leaf color. Three normal seedlings and three albinism seedlings were selected. For normal seedlings, three to six mature functional leaves were collected from the middle and upper part of each seedling, and the sample was named CK. For albinism seedlings, three to six mature functional leaves were collected from the middle and upper part of each seedling, and the sample was named albinism. Immediately after collection, all samples were flash-frozen in liquid nitrogen and stored in a freezer at −80 °C. Subsequently, it was transported to the molecular laboratory of Beijing Novozymes Technology Co., Beijing, China.

2.2. Library Construction and Sequencing

Total RNA was extracted using the RNA Prep Pure Plant Kit (DP441, Tiangen, Beijing, China) according to the manufacturer’s protocol. RNA quality was assessed using a NanoDrop 2000 (Thermo Fisher Scientific, Waltham, MA, USA) and an Agilent 2100 (Agilent Technologies, Santa Clara, CA, USA). After quality assessment, the third-generation full-length transcriptome and the second-generation transcriptome were sequenced. For second-generation sequencing, six individual cDNA libraries were constructed from each biological sample and sequenced on the Illumina platform. For third-generation full-length transcriptome analysis, an equimolar pool of all six samples was used to construct a single SMRT bell library, which was subsequently sequenced on the PacBio Sequel platform [17].

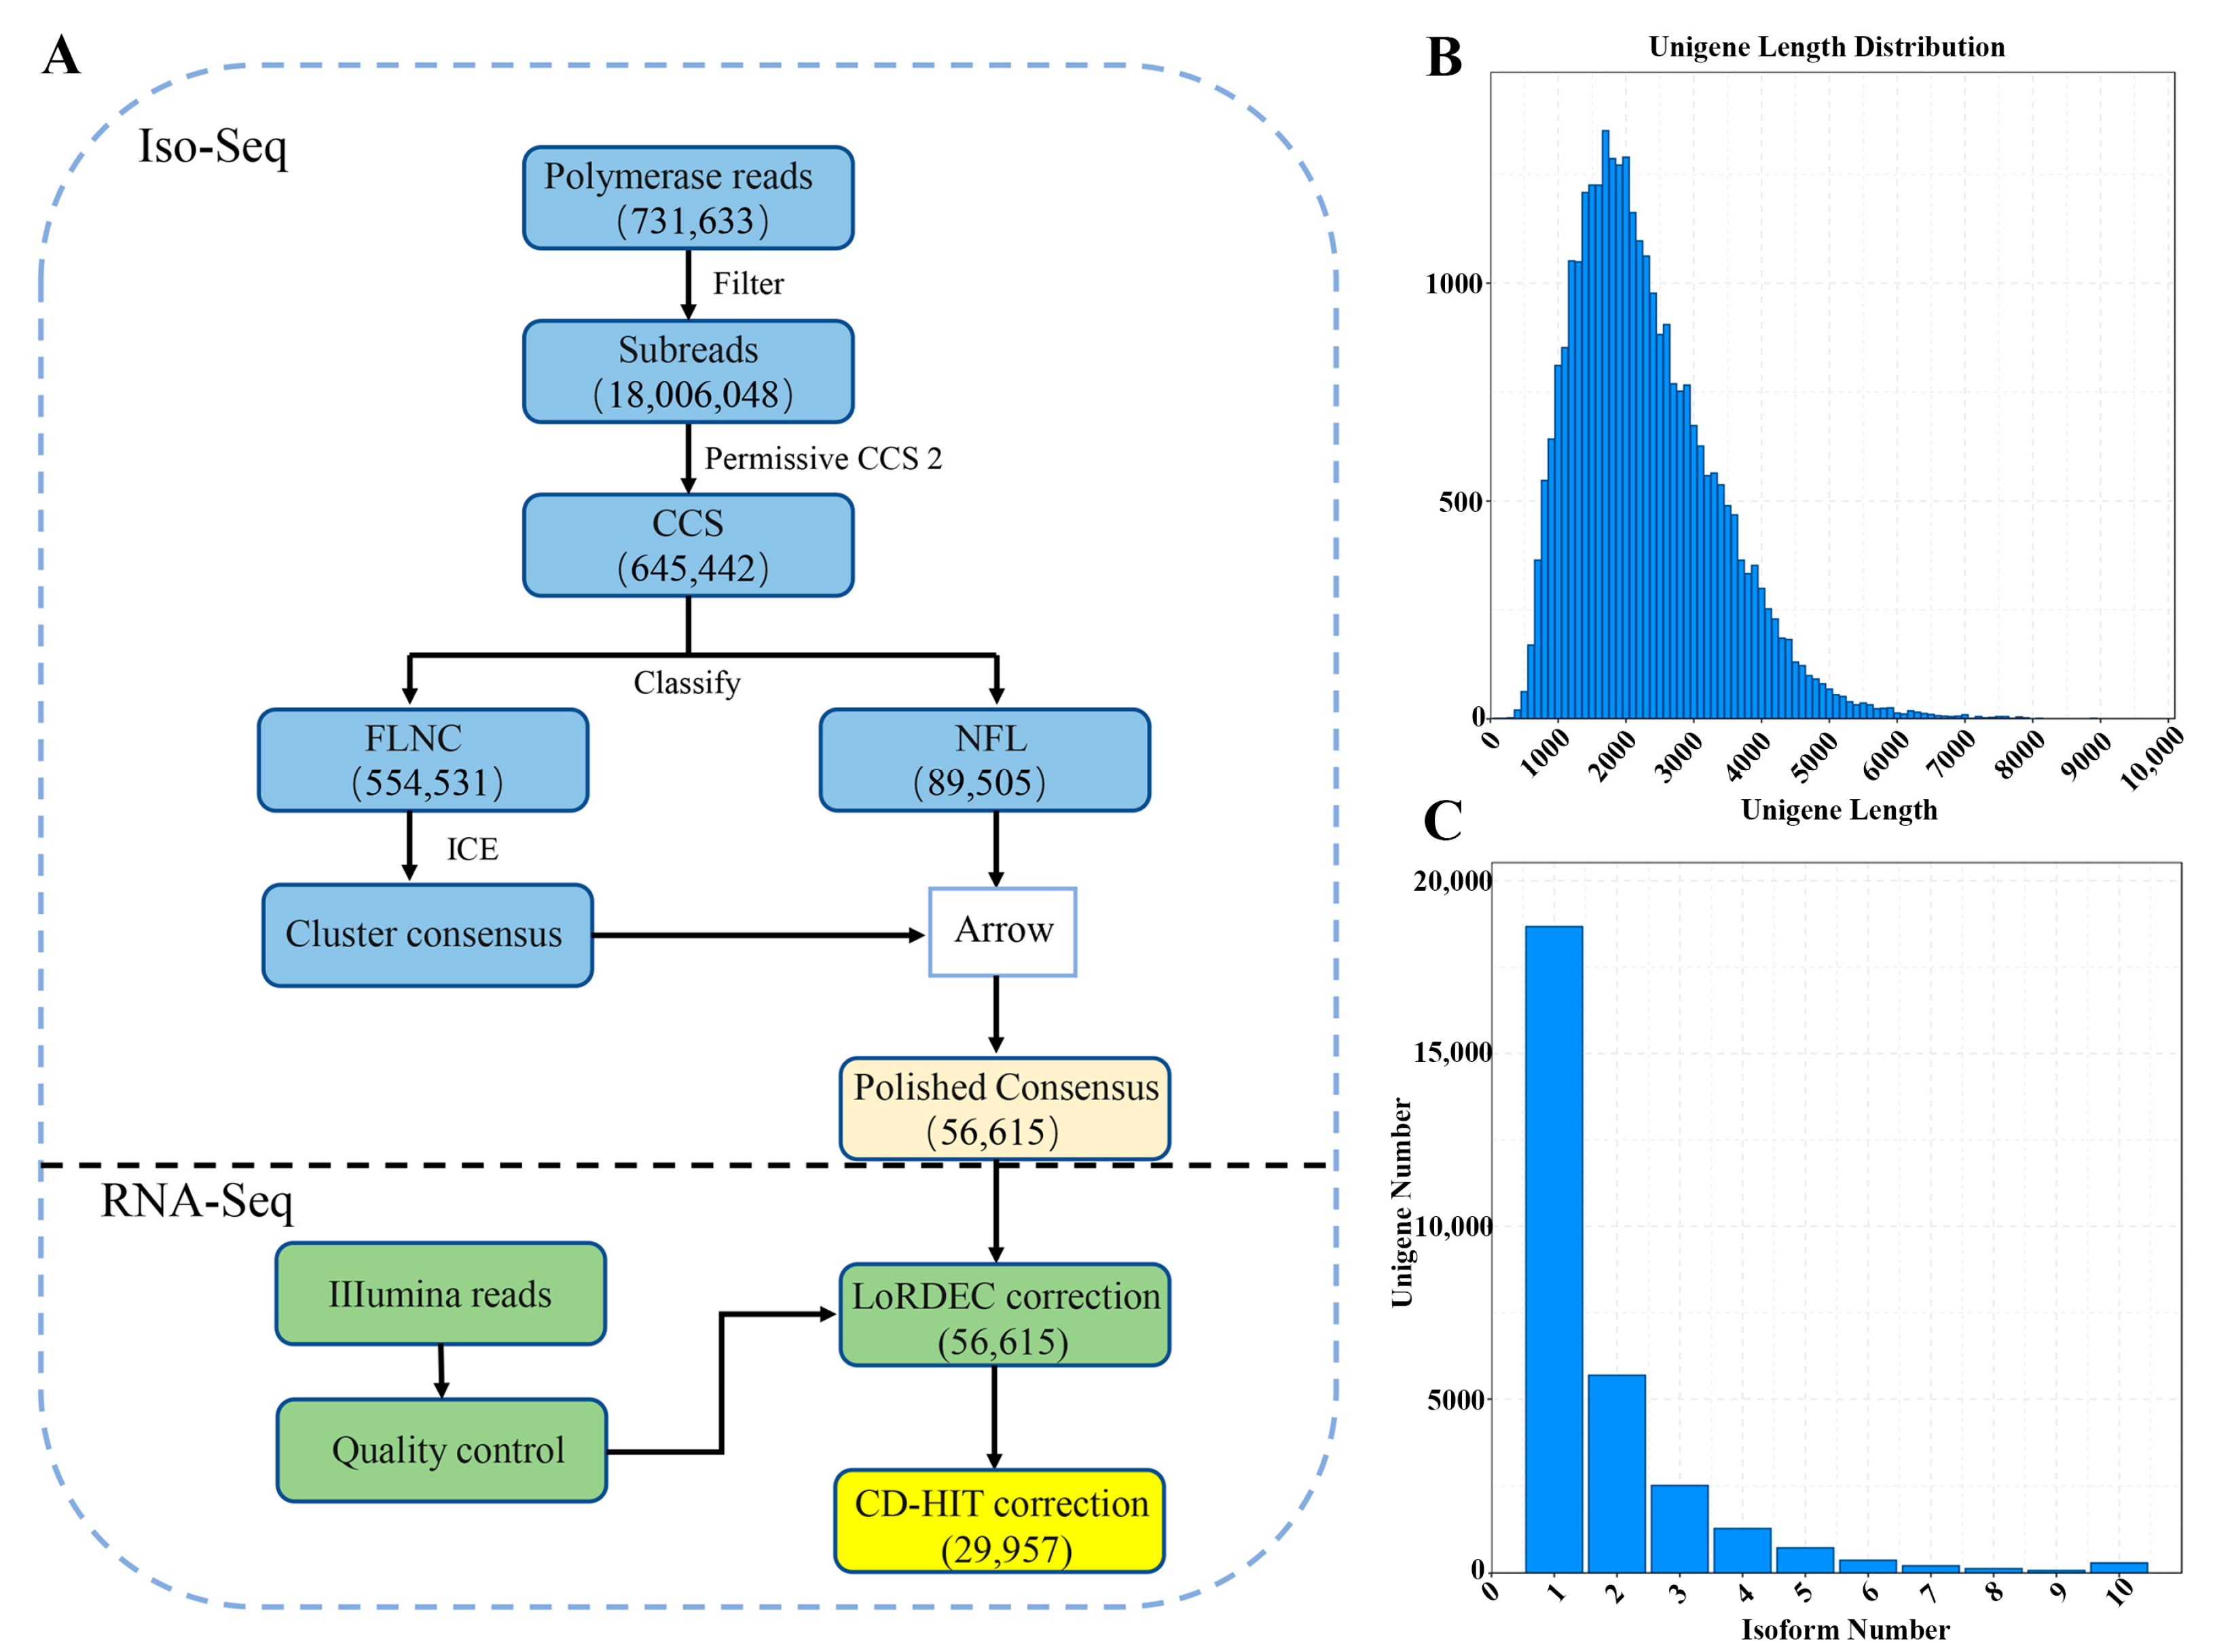
2.3. PacBio Iso-Seq Data Processing

The Iso-Seq library was prepared according to the Isoform Sequencing protocol (Iso-Seq) using the Clontech SMARTer PCR cDNA Synthesis Kit and the BluePippin Size Selection System protocol as described by Pacific Biosciences (PN 100-092-800-03). Raw data were processed using SMRTlink (V7.0) software to remove adapters and low-quality reads, generating subreads. Circular concordant sequences (CCS) were obtained by correcting subreads. Parameters: --minLength 50; --maxLength 15,000; --minPasses 1; --min_seq_len: minimum sequence length to output. Sequences were classified based on the presence of 5′ and 3′ primers and poly-A tails, yielding full-length non-chimeric sequence (FLNC) and non-full-length sequence (NFL). FLNC sequences were clustered using the hierarchical n*log(n) algorithm to generate consensus sequences, which were then polished for downstream analysis. Additional nucleotide errors in consensus reads were corrected using the Illumina RNA-seq data with the software LoRDEC (V0.7) [18] (-k 23; -s 3).

2.4. Transcript Structure and Functional Annotation

Gene function annotation was performed on non-redundant sequences using multiple databases: NCBI non-redundant protein sequences (NR; https://www.ncbi.nlm.nih.gov/protein?from_uid=2025685513, accessed on 1 June 2024), a manually annotated and reviewed protein sequence database (SwissProt; http://www.ebi.ac.uk/uniprot/, accessed on 12 March 2024), GO (http://www.geneontology.org/, accessed on 10 March 2024), Eukaryotic Ortholog Groups (KOG; http://www.ncbi.nlm.nih.gov/COG/, accessed on 18 April 2024), Protein family (Pfam; http://pfam.sanger.ac.uk/, accessed on 21 May 2024), and Kyoto Encyclopedia of Genes and Genomes (KEGG; http://www.genome.jp/kegg/, accessed on 11 July 2024). We used the software BLAST-2.16.0+ and set the e-value to ‘1 × 10⁻¹⁰ in the NCBI non-redundant nucleotide sequences (NT) database analysis. Coding potential was predicted using Coding-Non-Coding-Index. Prof (CNCI) (V2) [19], PLEK (v1.2) [20], CPC2 (v0.1) [21] and the Pfam (V1.6) [22] database. Identified long non-coding RNA (lncRNAs) were retained for further analysis. CDS were predicted using ANGEL (V2.4) [23], facilitating preliminary gene analysis and subsequent protein structure analysis (--min_angel_aa_length 50). Cuffdiff (v2.1.1) was used to calculate FPKMs of all transcripts in each sample. Transcription factors (TFs) were predicted using iTAK (1.7a) [24] software.

2.5. Analysis of Gene Expression Levels

Redundant sequences were removed using CD-HIT (v4.6.8) [25], and the obtained transcript was used as the reference sequence (ref) of the gene. Then, the clean reads of each sample obtained from Illumina sequencing were compared to the ref. In this process, RSEM (V1.3.0) [26] was utilized, with the parameters of the comparison software bowtie2 (V2.3.4) in RSEM software being set to end-to-end, sensitive mode. All other parameters were left at their default settings. The readcount value of each sample compared to each gene was further obtained and converted to Fragments Per Kilobase of exon model per Million mapped fragments (FPKM), which in turn analyzed the expression level of the gene.

2.6. Differential Expression and Pathway Analysis

Different gene expression analysis was conducted using DEGSeq (v1.12.0) [27]. DEG-seq using a model based on the negative binomial distribution, with DEGs identified based on |log2(FoldChange)| > 1 and padj < 0.05. Enrichment analyses for GO and KEGG pathways were performed to elucidate the functional roles of DEGs [28]. GO enrichment analysis of DEGs was implemented by the GOseq R package (V1.10.0), in which gene length bias was corrected. GO terms with corrected p-value less than 0.05 were considered significantly enriched by DEGs. We performed pathway enrichment analysis using KOBAS (v3.0) and FDR ≤ 0.05, indicating that the differential genes were significantly enriched in this pathway.

3. Results

3.1. Sequencing Data Overview

SMRT sequencing yielded 731,633 polymerase reads, 18,006,048 subreads and 645,442 CCS (Figure 2A). From these CCS, 554,531 FLNC reads were identified, generating 243,663 polished consensus isoforms. Length distribution analysis revealed 2533 (0.5–1 kb), 11,806 (1–2 kb) and 9045 (2–3 kb) isoforms (Figure 2B). Notably, 18,669 genes exhibited only one transcript (Figure 2C).

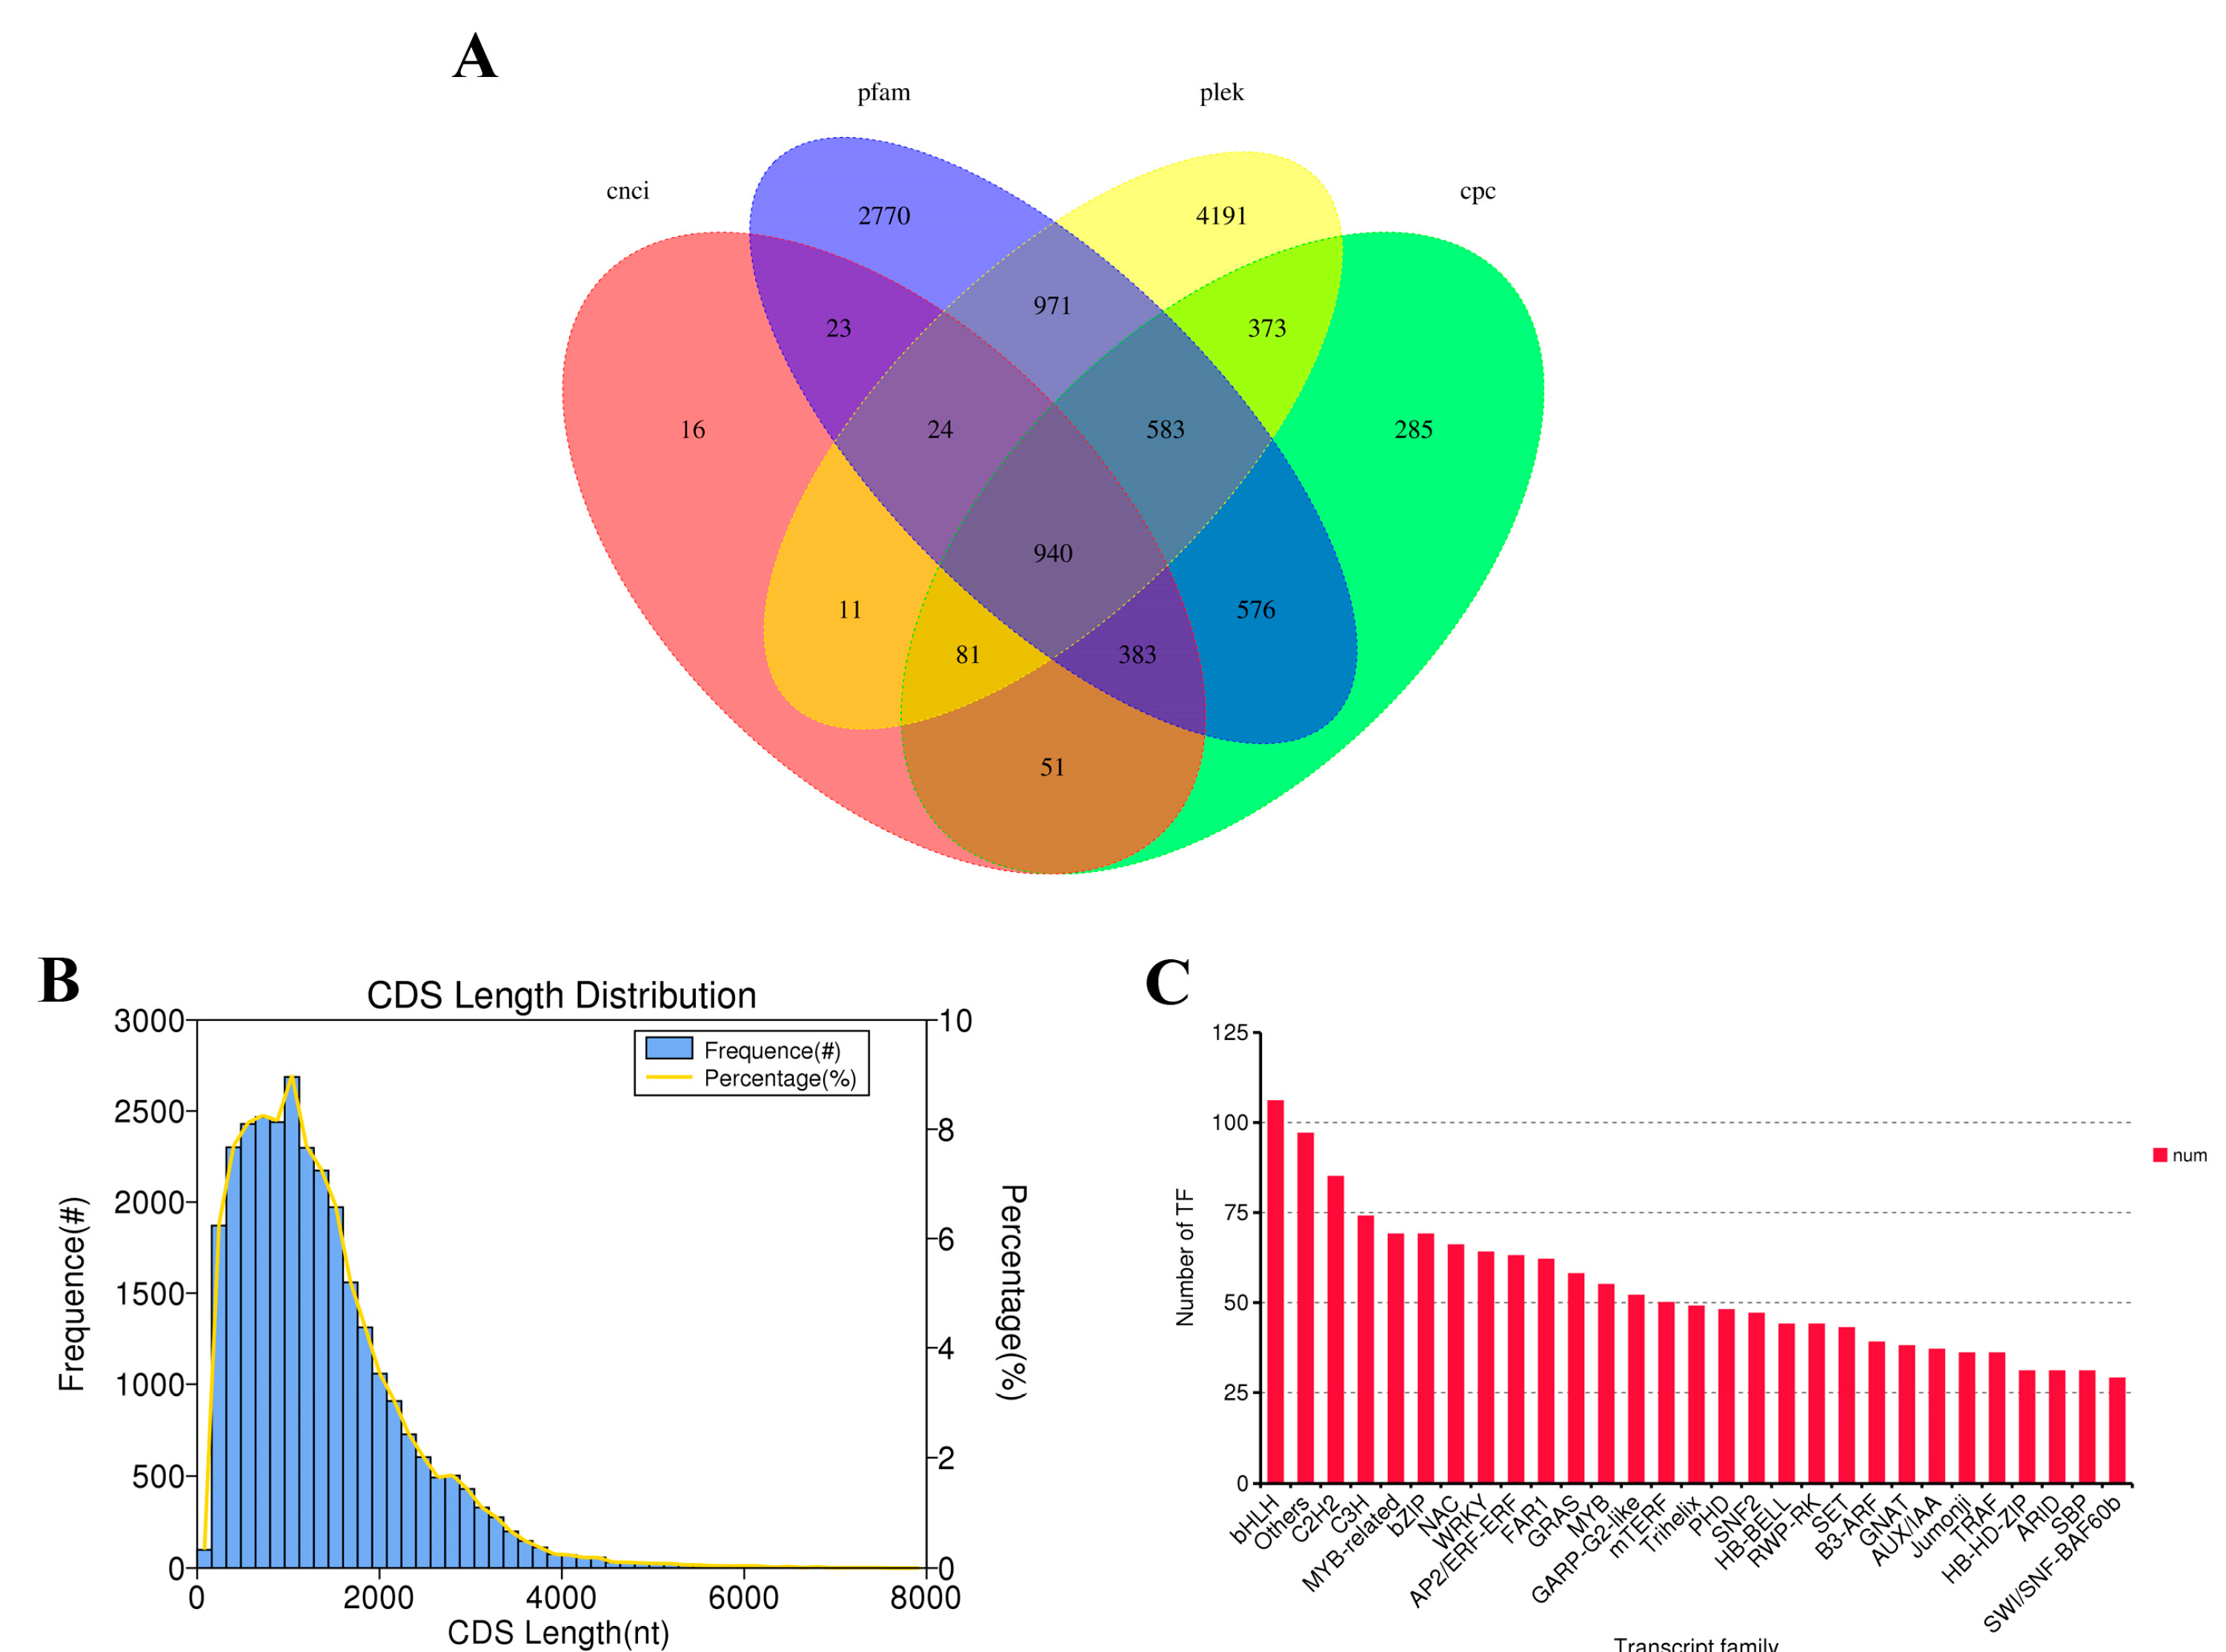
3.2. Full-Length Transcript Coding Sequences, LncRNA and Transcription Factor Prediction

LncRNA do not encode proteins and their coding potential was predicted using CNCI, CPC, plek and Pfam methods (Figure 3A). A total of 11,278 LncRNA were identified, of which 1529, 3272, 7174 and 6270 LncRNA were detected by CNCI, CPC, plek and Pfam, respectively. A total of 940 shared LncRNA were detected by the four software. Coding sequence (CDS) analysis revealed lengths ranging from 0 to 4000 nt, with most sequences (0–2000 nt) likely encoding functional proteins (Figure 3B). Plant TF prediction was performed via iTAK software. The top 30 TFs with the highest number of annotated transcripts were analyzed in Figure 3C. The highest number of transcription factors was predicted for the bHLH family (106), followed by C2H2 (85), C3H (74), MYB-related (69), bZIP (69), NAC (66) and WRKY (64).

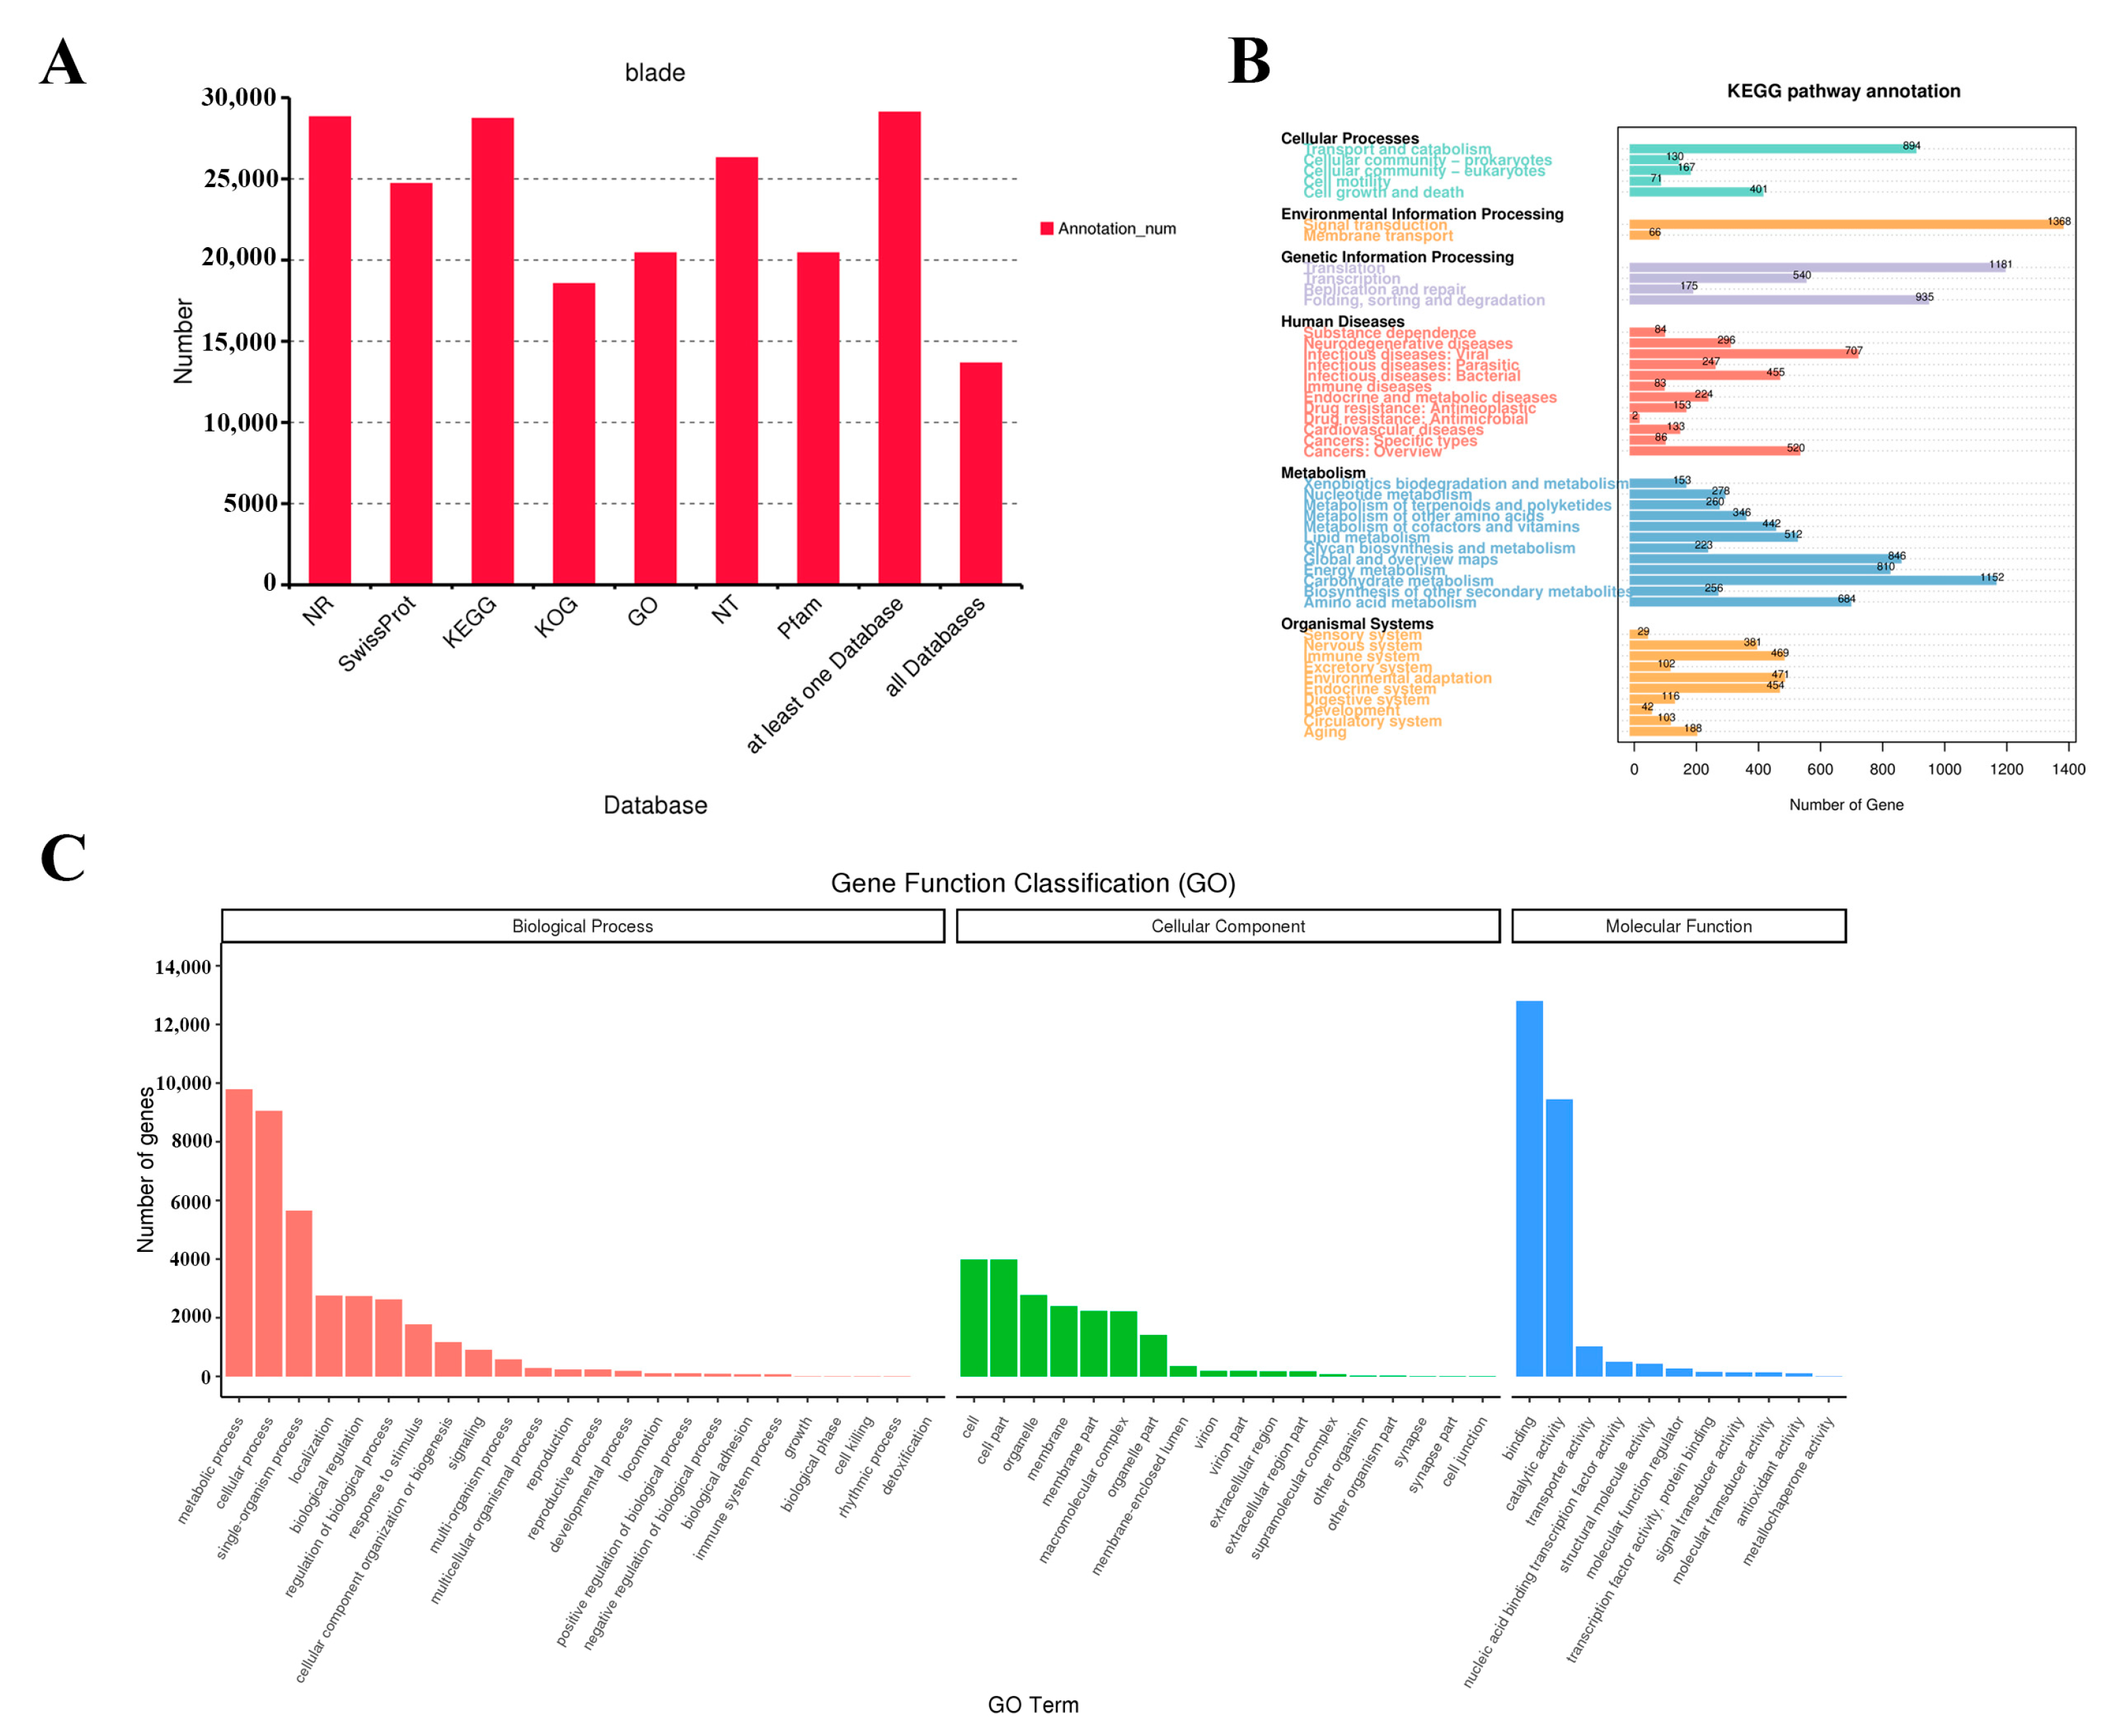
3.3. Functional Annotation Analysis of Full-Length Transcripts

Annotation across seven databases, including the NR, Swissprot, GO, KOG, Pfam, KEGG and NT, assigned functions to 29,094 transcripts (Figure 4A). NR provided the most annotations (28,810, 99.02%), followed by KEGG (28,711, 98.68%) and NT (26,288, 90.36%). In contrast, the least number of transcripts were annotated in the KOG database (18,536, 56.96%). The GO analyses mainly focused on three aspects: biological process, cellular component and molecular function (Figure 4C). The most annotated GO entries in the biological process were “metabolic process” (9785), “cellular process” (9050) and “single-organism process” (5648); cellular component were enriched for “cell” (3984), “cell part” (3984) and “organelle” (2781); the most annotated GO entries in molecular functions were “binding” (12,795), “catalytic activity” (9447) and “transporter activity” (1027). KEGG analysis identified key pathways (Figure 4). Cellular processes were mainly concentrated in “transport and catabolism” (894) and “cell growth and death” (401). Environmental information processing was mainly concentrated in “signal transduction” (1368). Notably, it encompasses “plant hormone signal transduction” (ko04075), which regulates chloroplast biogenesis. Genetic information processes were mainly concentrated in “translation” (1181) and “folding sorting and degradation” (935). In metabolism, the main annotations were “carbohydrate metabolism” (1152) and “global and overview maps” (846). In the organismal systems function, the main notes were “environmental adaptation” (471) and “immune system” (469).

3.4. Reference Sequence Comparison

The CD-HIT software was used to de-redundant the corrected consensus sequences, and the obtained transcripts were used as the reference sequences of the genes. Then, the clean reads of each sample obtained from Illumina sequencing were compared to the reference sequences. In this process, the RSEM software was used for comparison. The statistical results are shown in Table 1. The proportion of the number of sequenced sequences that could be aligned to the reference sequences for CK-1, CK-2, CK-3, albinism-1, albinism-2 and albinism-3 was 84.20%, 80.47%, 81.33%, 79.69%, 78.14% and 81.44%, respectively.

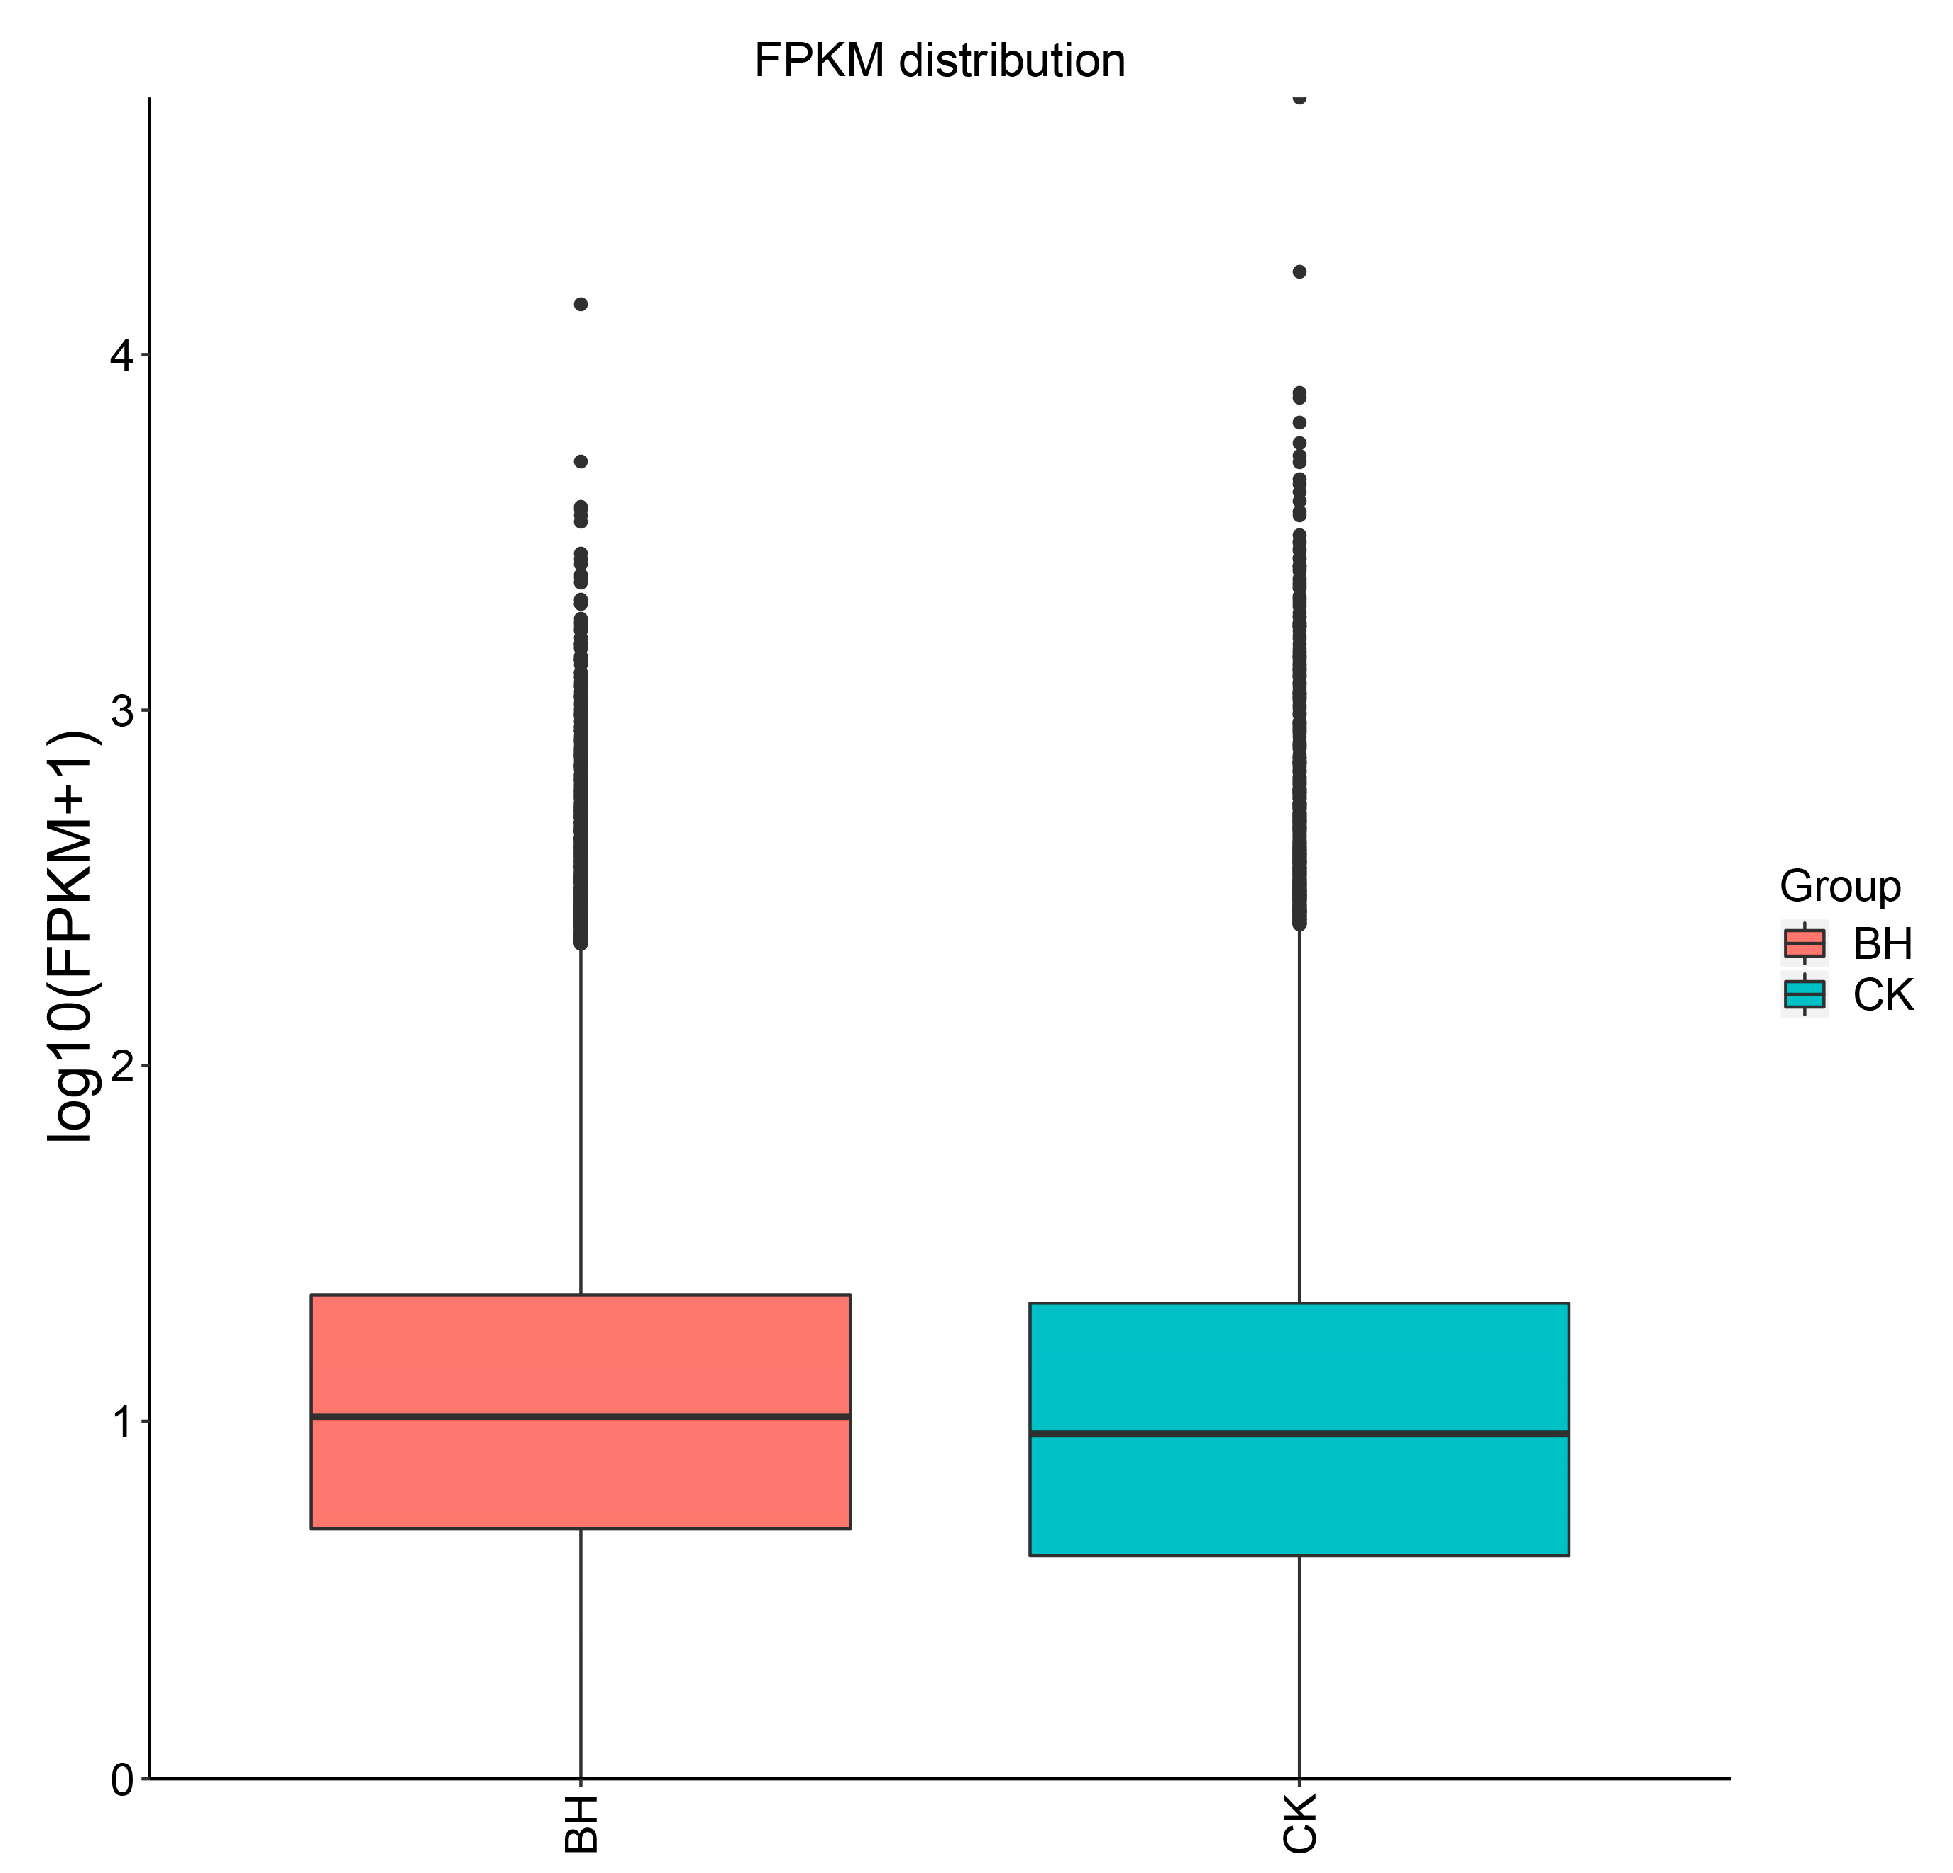
3.5. Analysis of Gene Expression and DEGs
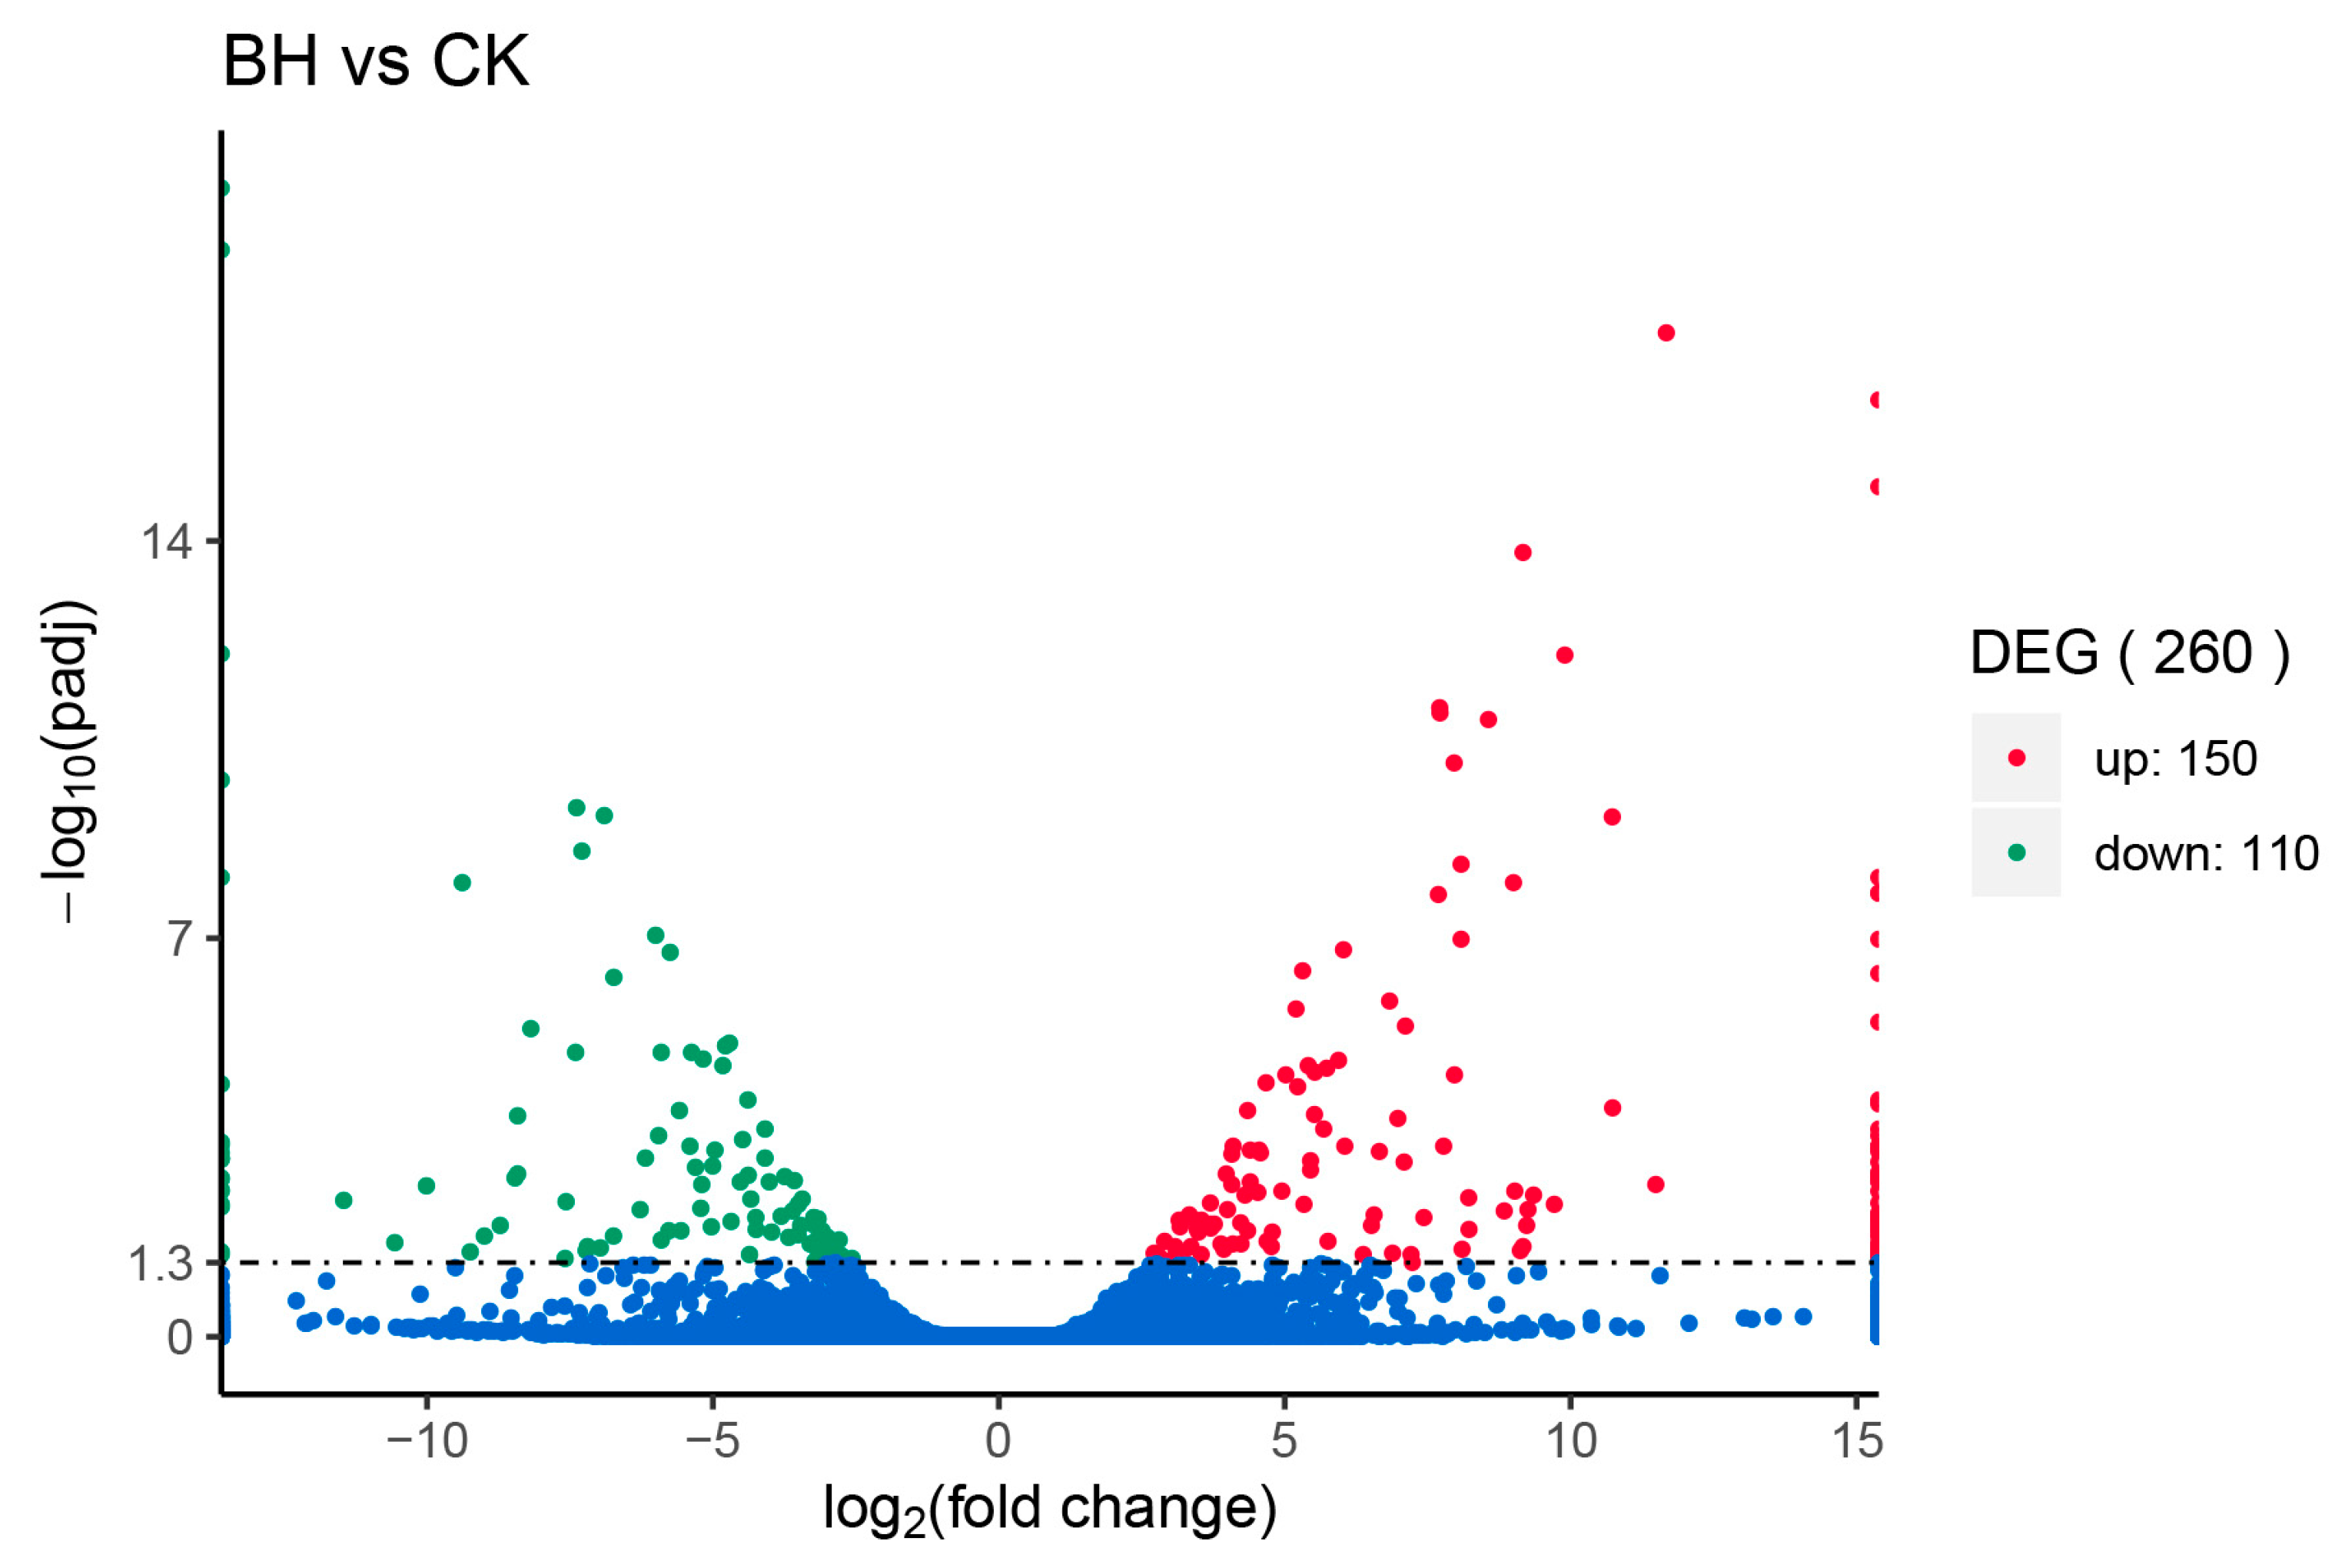
The region 1 < FPKM ≦ 15 had the highest number of transcripts in all the samples, followed by transcripts in the region FPKM > 15 and the number of transcripts in this region Albinism > CK, whereas the region FPKM ≦ 1 had the lowest number of genes and the number of transcripts in this region CK > Albinism (Table 2). The box plot of transcript expression (Figure 5) not only showed the degree of dispersion of transcript expression levels of individual samples but also compared the overall transcript expression levels of different samples, and the overall degree of dispersion of transcripts was the same between the albinism and normal seedlings of S. superba.

3.6. DEGs Profiling

The volcano plot visualizes the distribution of differential genes for each comparison combination. Comparative transcriptomics identified 260 DEGs between albinism and normal leaves: 150 upregulated and 110 down-regulated (Figure 6). These DEGs were prioritized for functional and pathway analyses.

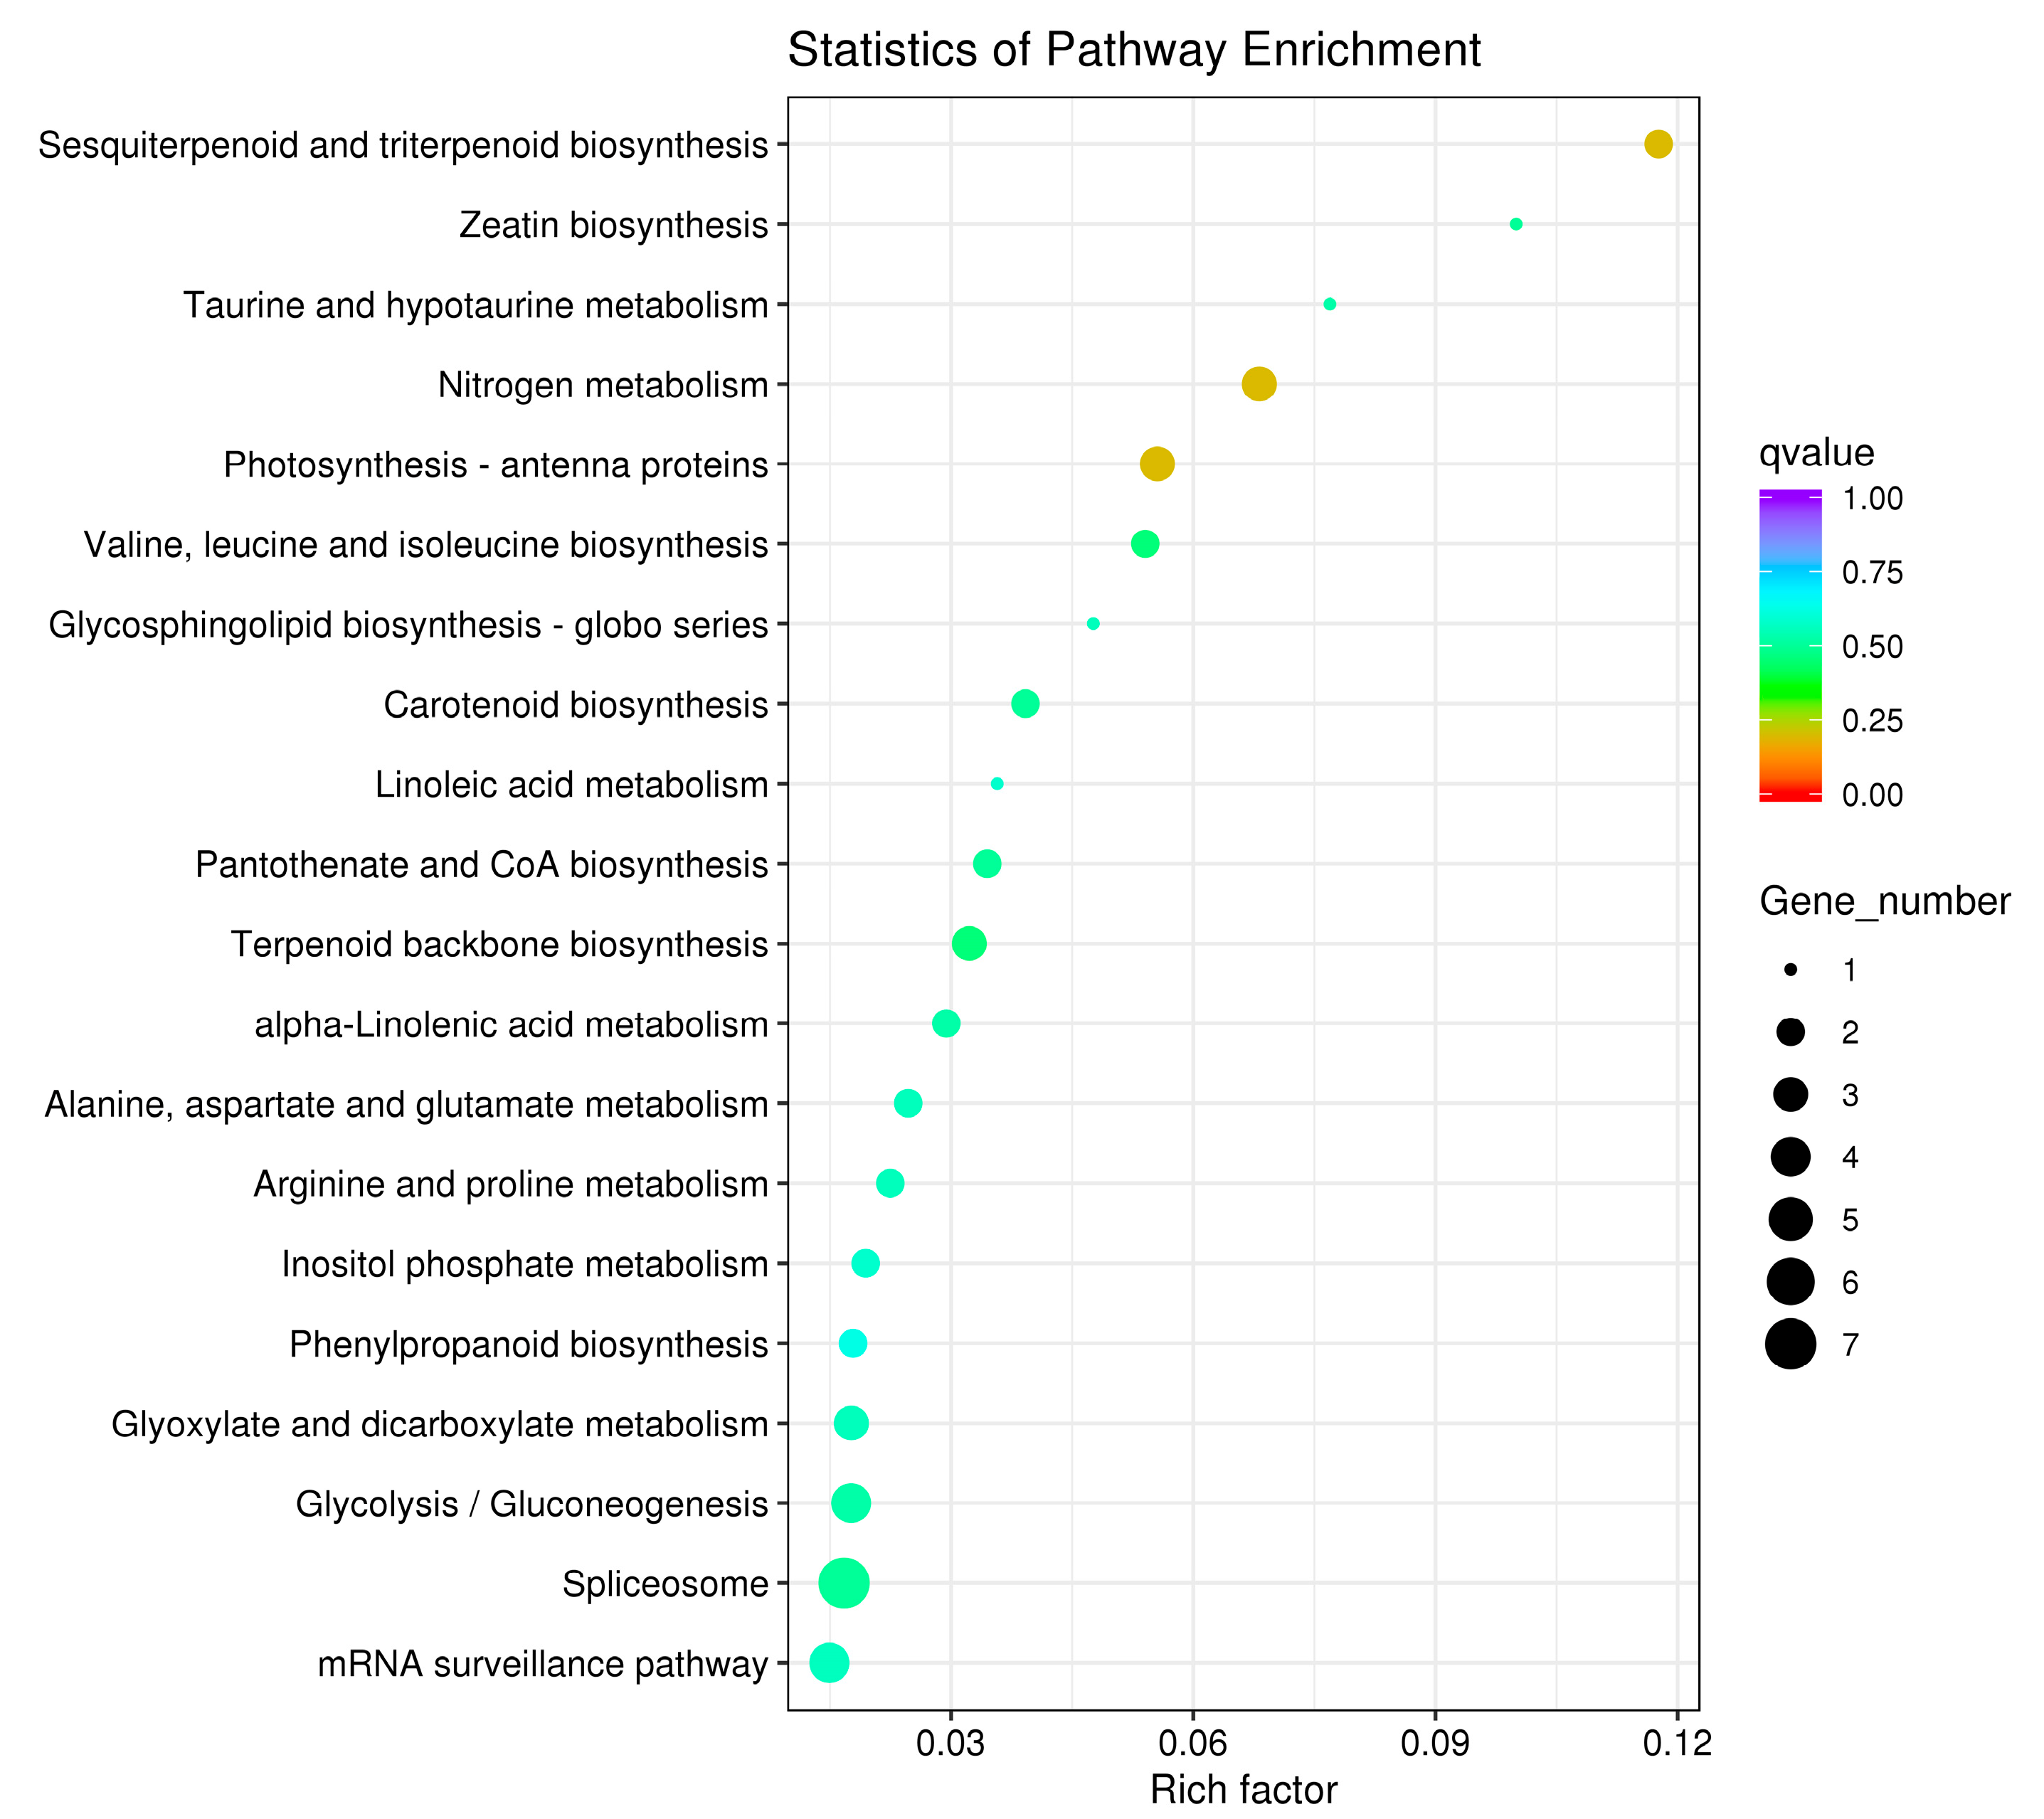
3.7. Functional Annotation of DEGs

DEGs were significantly enriched in 20 pathways, including “sesquiterpenoid and triterpenoid biosynthesis”, “zeatin biosynthesis”, “taurine and hypotaurine metabolism”, “nitrogen metabolism” and “photosynthesis-antenna proteins”. (Figure 7).

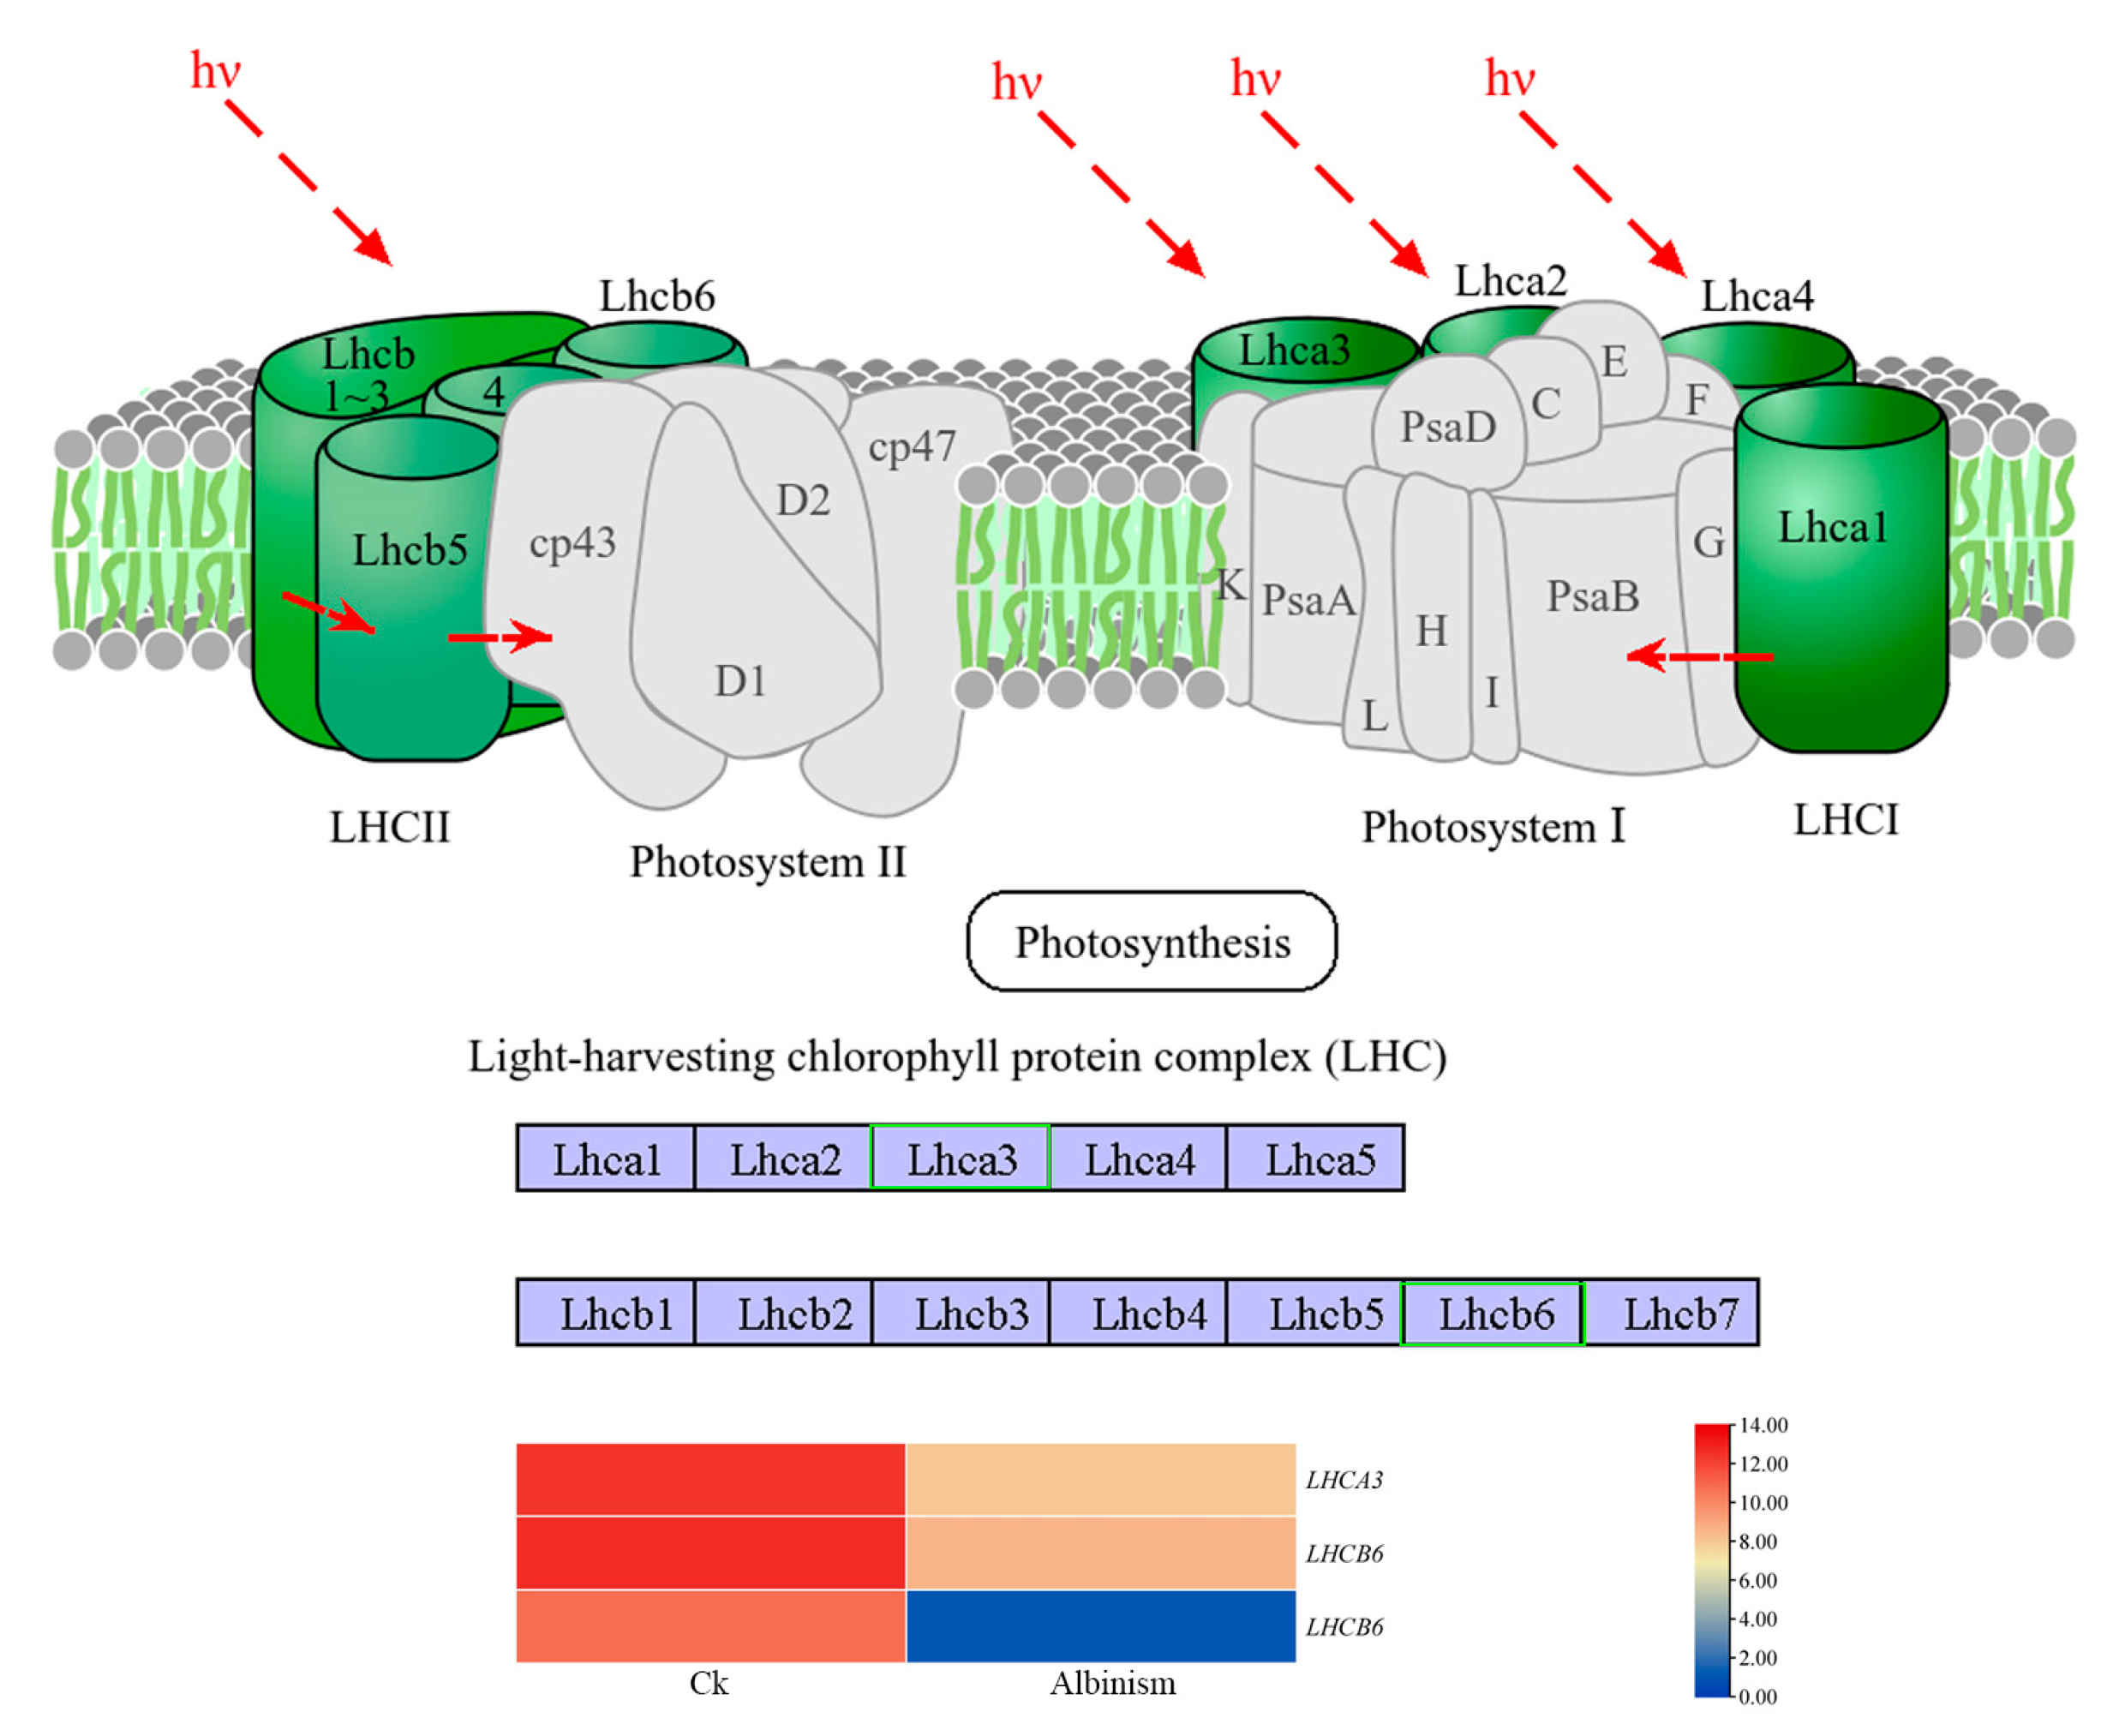
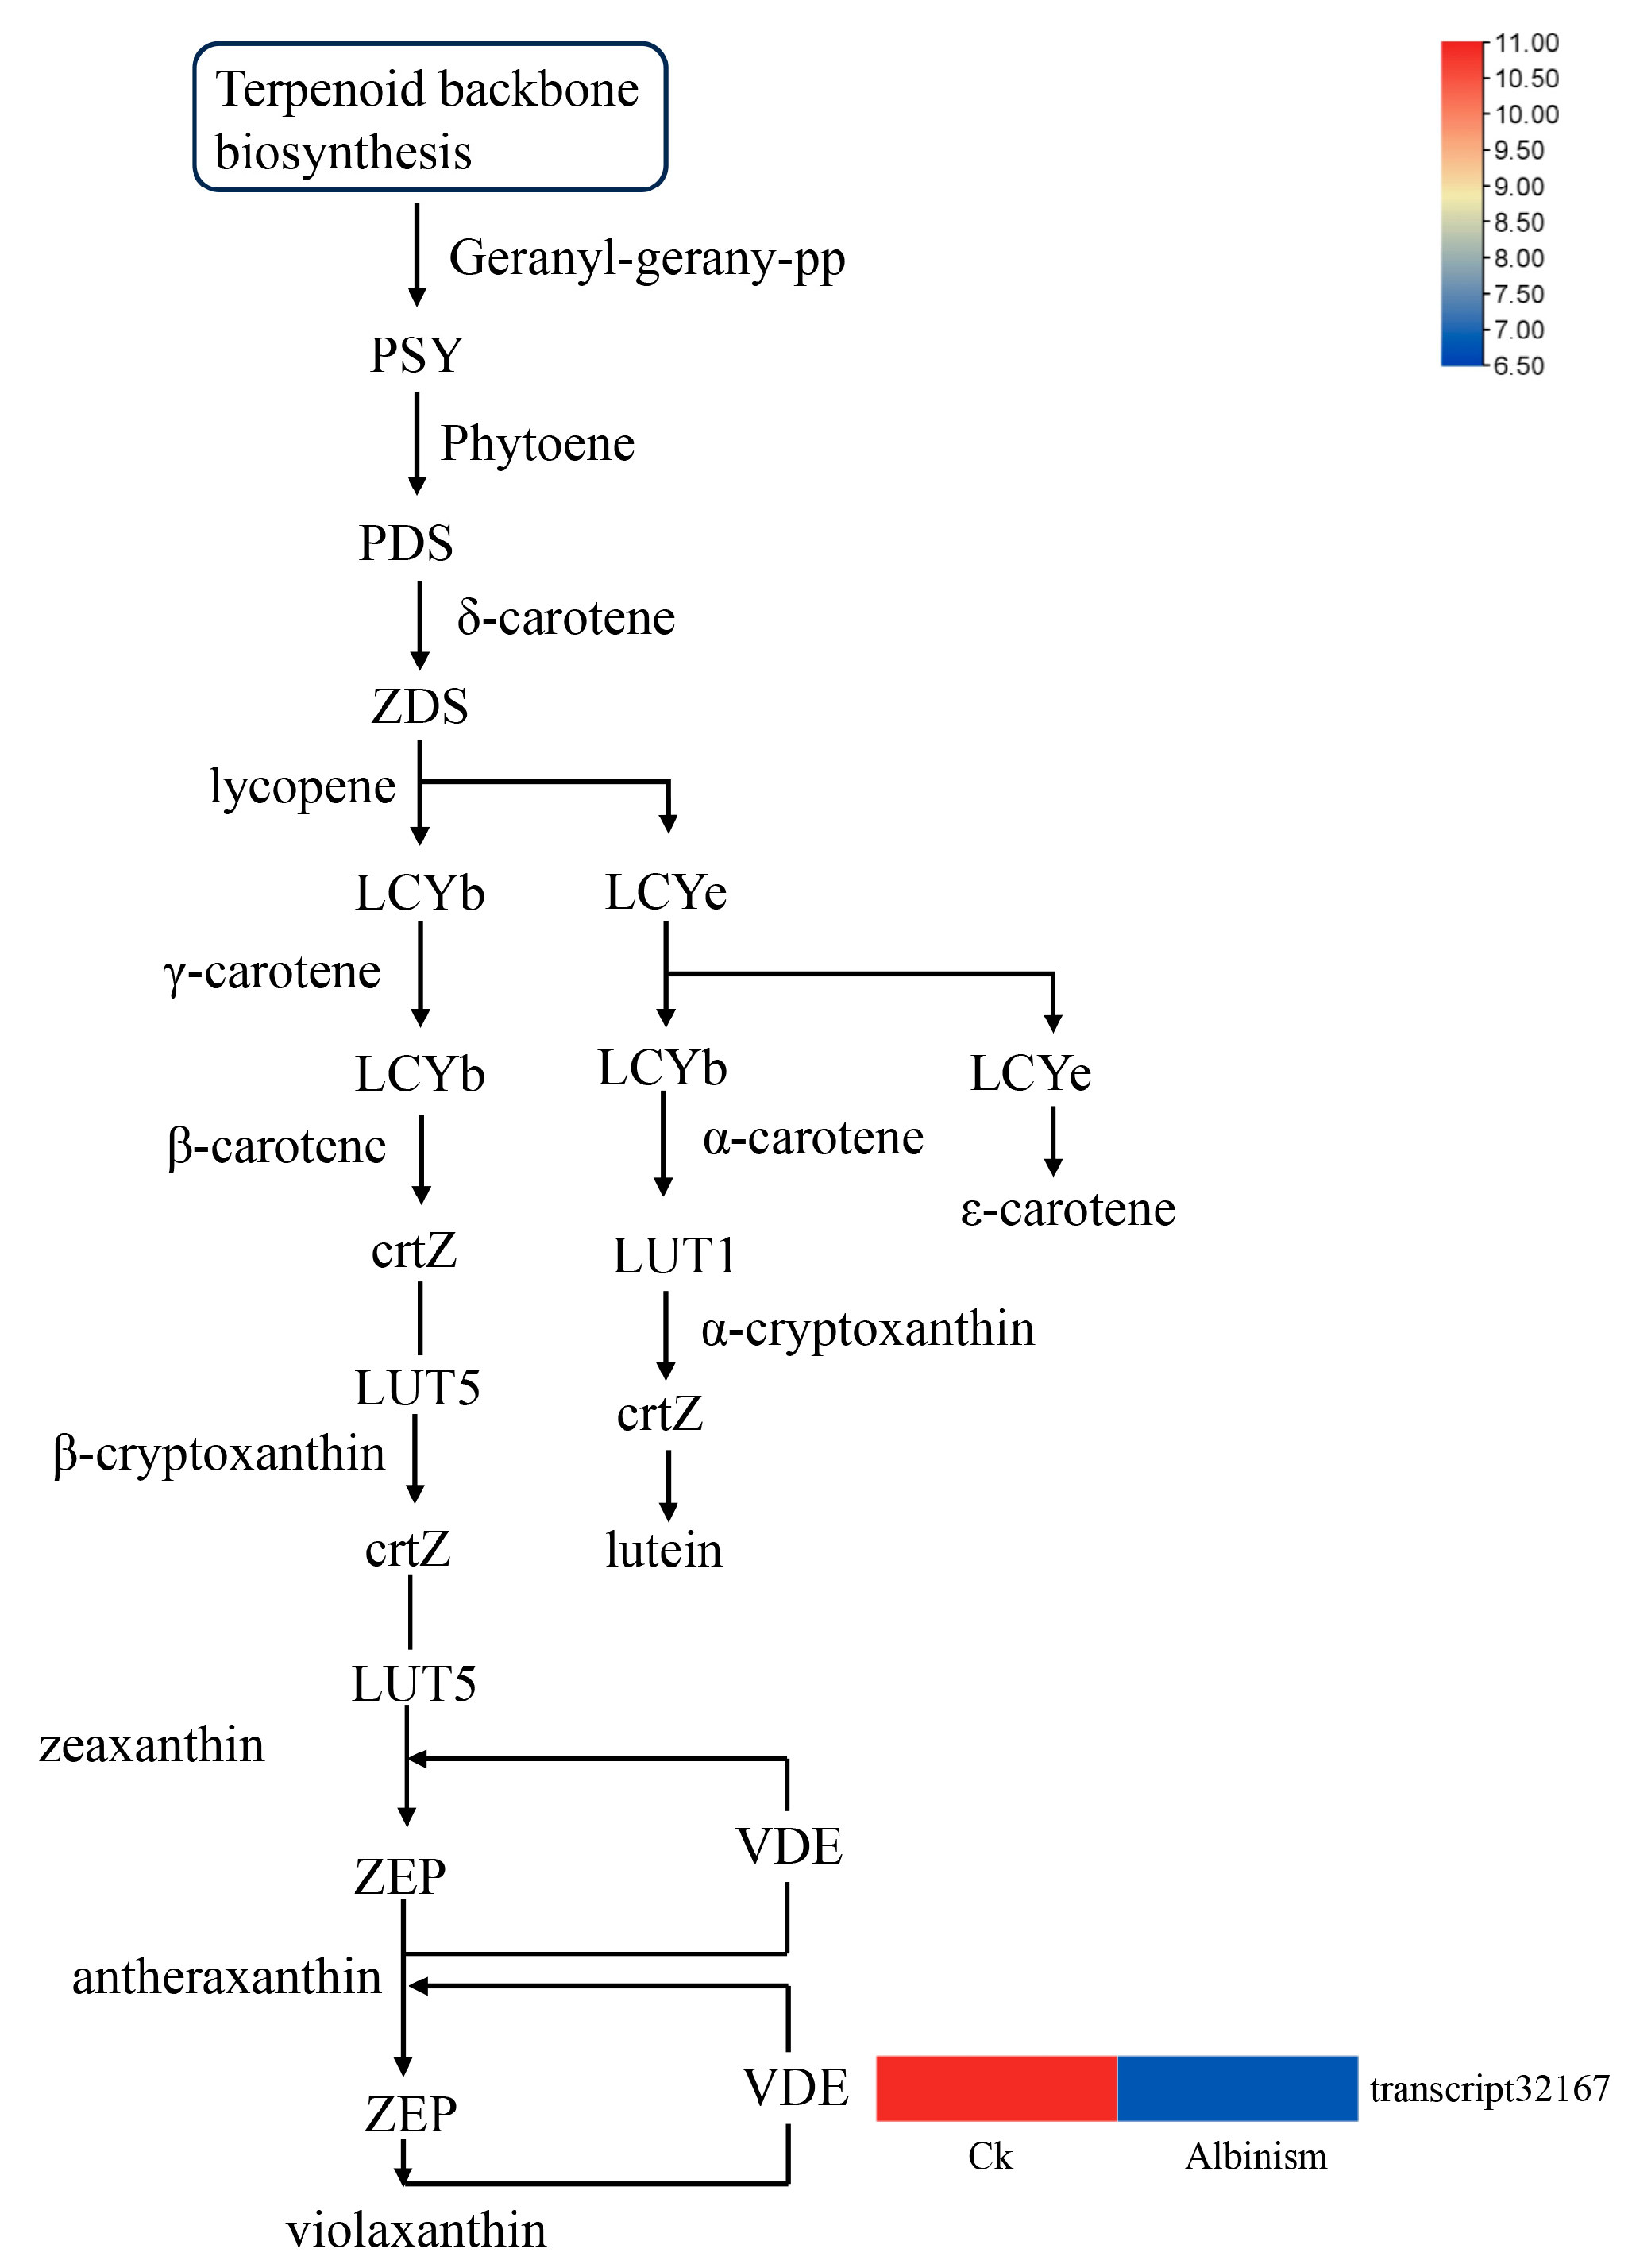
3.8. Differential Analysis of Genes Encoding Genes Related to the Photosynthesis-Antenna Protein Pathway and the Carotenoid Biosynthesis Pathway

LHC genes encoding photosynthesis-antenna proteins also showed significant down-regulation in the transcriptome difference analysis (Figure 8). Among them, the light-harvesting complex I chlorophyll a/b-binding protein (LHCA3) and light-harvesting complex II chlorophyll a/b-binding protein (LHCB6) encoded by six nuclear genes were less expressed in albinism leaves than in normal leaves. The proteins encoded by these genes are generally found in chloroplast membranes and are mainly involved in the capture and transfer of light energy during photosynthesis, which also indicates how chlorophyll a and chlorophyll b are involved in photosynthesis.
Carotenoids also play an important role in photosynthesis. VDE is a key enzyme in the xanthophyll cycle of the carotenoid biosynthesis, mainly responsible for catalyzing the conversion of violaxanthin to zeaxanthin. As shown in Figure 9, the expression content of VDE in albinism leaves of S. superba was lower than that in normal leaves, resulting in a blockage of the xanthophyll cycle and a decrease in photoprotective capacity. This may exacerbate the photo-oxidative damage in albinism leaves, which in turn accelerates the degradation of residual chlorophyll and inhibits photosynthetic efficiency.

3.9. Analysis of TFs in S. superba Albinism Seedlings

TFs regulate gene expression by binding to action elements in the upstream promoter region of genes, thereby affecting physiological processes in plants. In this study, we analyzed the expression patterns of major photosynthetic response-related TF family genes (e.g., BHLH, MYB, GLK and NAC) in S. superba seedlings to understand the molecular mechanisms by which they regulate the growth and development of chloroplasts. As shown in Table 3, these TFs are distributed in four TF families. The most annotated one is the BHLH family with five DEGs (four up-regulated and one down-regulated). In addition, the top three were MYB (three up-regulated) and GLK (two up-regulated and one down-regulated), while the NAC family had only one DEG annotated and down-regulated.

4. Discussion

Plant leaf albinism, characterized by reduced chlorophyll content, abnormal chloroplast development and impaired photosynthesis, represents a common phenotypic variation in plants. Albinism severely impairs photosynthesis capacity, forcing seedlings to rely on endosperm-derived nutrients for survival. Once these reserves are depleted, albinism seedlings typically perish [29]. Despite its detrimental effects on plant growth, albinism serves as a valuable model for investigating chloroplast development, chlorophyll metabolism and photosynthetic mechanisms. Previous studies have linked albinism to both environmental factors (e.g., temperature, nutrient deficiency) and genetic mutations [30,31]. While albinism phenotypes have been extensively documented in herbaceous species, like Nicotiana tabacum [32], Zea mays [33] and Oryza sativa [34], reports on woody plants remain scarce, and the underlying molecular mechanisms are poorly understood. In this study, we focused on the phenomenon of albinism in S. superba with a view to providing new insights into understanding its underlying mechanisms.
Advances in sequencing technologies have revolutionized transcriptomic studies. Third-generation sequencing (e.g., PacBio SMRT) enables direct acquisition of full-length transcripts, circumventing assembly errors and facilitating accurate gene annotation, alternative splicing analysis and lncRNA prediction [35,36]. Although Illumina short-read sequencing offers superior accuracy for differential gene expression analysis and error correction in long-read data [37,38], the integration of both platforms provides a robust approach for transcriptome characterization. To analyze the genetic resources of S. superba albinism, we constructed an important full-length transcriptome library using the three-generation PacBio platform and obtained 554,531 transcript sequences, 11,278 LncRNA and 1553 TFs, which provided better genetic information for the subsequent transcriptome analyses.
In this study, combining SMRT and RNA-Seq data from S. superba albinism and normal seedlings identified 260 DEGs, including 150 up-regulated and 110 down-regulated transcripts. KEGG enrichment highlighted significant involvement of these DEGs in the pathways related to the photosynthetic system. In addition, some of the differential genes may also regulate biological processes, such as “secondary metabolite synthesis” (“sesquiterpenoid and triterpenoid biosynthesis”, “zeatin biosynthesis”), “taurine and hypotaurine metabolism”, etc. This pattern of pathway enrichment may highlight specific adaptations in woody plants compared to herbaceous plants: flavonoid accumulation enhances antioxidant defenses and mitigates whitening-induced photo-oxidative damage, and zeatin acts as a cytokinin to maintain leaf cellular activity and slows down the senescence process. Altered expression of these differential genes in albinism seedlings may have affected the synthesis of chloroplasts with their structural development and the energy supply of the organism during the formation of leaf color. Future metabolite assays and functional validation of genes are needed to clarify the specific mechanisms of these pathways in S. superba albinism.
Chlorophyll fluorescence parameters in higher plants reflect photosynthetic pigment concentrations and thylakoid membrane integrity. The LHC plays a crucial role in photosynthesis, capturing light energy and delivering it to the core complex of the photosystem. LHCs, encoded by the LHC gene family, are integral to light energy capture and transfer, binding over 60% of chlorophyll in plants [39]. KEGG analysis revealed pronounced down-regulation of LHC genes in albinism leaves, suggesting their role in regulating the photosystem I core protein. Similar findings in Arabidopsis thaliana and maize have associated leaf color mutations with disrupted chloroplast assembly or chlorophyll metabolism, leading to reduced photosynthetic efficiency and seedling lethality [40,41]. The suppressed expression of chloroplast-related genes in S. superba albinism seedlings likely underlies their phenotypic aberrations, offering critical insights into the molecular basis of albinism. In carotenoid biosynthesis, VDE is an essential enzyme in plants, playing a key role in the lutein cycle. In S. superba albinism leaves, the expression of VDE was down-regulated, resulting in a blockage of the lutein cycle. Its photoprotective ability was reduced, and chlorophyll degradation was intensified under strong light, resulting in a decrease in photosynthetic efficiency.
TFs are key regulators of gene expression regulation playing an important role in the photosynthetic pathway and chlorophyll biosynthesis [42]. Previous studies have shown that the up-regulated expression of SlPRE5, an atypical bHLH TFs gene, resulted in reduced chlorophyll accumulation in tomato leaves. Overall, the bHLH TFs play an important negative regulatory role in photosynthesis as well as in chlorophyll accumulation [43]. MYB TFs play a key role in determining plant color [44]. For example, SlMYB72 regulates chlorophyll accumulation and chloroplast development in tomato [45]. The GLK TFs play a key role in the regulation of chloroplast development and involvement in chlorophyll synthesis [46]. In melons, down-regulation of CmGLK affects chlorophyll synthesis and chloroplast development [47]. The regulatory role of the GLK gene has been demonstrated in rice [48] and tomato [49]. The regulation of chlorophyll metabolism by NAC TFs has been widely reported in a variety of plants. For instance, transient expression of AcNAC1 in tobacco has been observed to induce the expression of NtSGR1 and NtSGR2, thereby promoting tobacco leaf de-greening [50]. In S. superba albinism seedlings, the DEGs with the highest enrichment of TFs were bHLH, MYB, GLK and NAC and most of the genes were up-regulated in albinism leaves. These genes may play a role in the leaf color phenotype of S. superba by regulating other genes involved in chloroplastogenesis, development, or photosynthesis. However, the regulatory mechanisms of leaf color formation mediated by bHLH, MYB, GLK and NAC TFs need to be further investigated in future studies.
In summary, this study elucidates key functional genes associated with albinism in S. superba through integrated transcriptomic analyses, laying a foundation for unraveling the molecular mechanisms driving this trait.

5. Conclusions

This study constructed a full-length transcriptome library for S. superba albinism seedlings, yielding high-quality transcripts that enabled comprehensive lncRNA identification, CDS analysis and TF prediction. By integrating Illumina short-read data, we quantified transcript expression, identified DEGs and performed KEGG enrichment. Further analyses showed that DEGs in both the photosynthesis-antenna protein pathway and the carotenoid biosynthesis pathway were down-regulated in albinism leaves, which may be the main factor contributing to the early albinism phenotype. TFs, such as bHLH, MYB, GLK and NAC, were identified as key regulators of S. superba albinism. These findings enhance our understanding of the molecular regulation underlying S. superba albinism. The results of this study provide new information to elucidate the molecular mechanisms underlying the formation of the albinism phenotype in S. superba. Future research will focus on fine-mapping and cloning the candidate genes responsible for this trait, providing a theoretical basis for molecular breeding and agricultural applications.

Author Contributions

Conceptualization, J.J. and M.C.; methodology, Y.F.; software, M.C.; validation, J.J., M.C. and Y.F.; formal analysis, Y.F.; investigation, P.Y.; resources, P.Y.; data curation, P.Y.; writing—original draft preparation, J.J. and M.C.; writing—review and editing, Y.F. and P.Y.; visualization, M.C.; supervision, Z.Y.; project administration, Z.Y.; funding acquisition, Z.Y. All authors have read and agreed to the published version of the manuscript.

Funding

This research was funded by the Science and Technology Major Project of Guangxi, grant number Guike AA24263024-2, Guangxi Science and Technology Base and Special Funds for Talents, grant number AD19254004 and the Special Program of Bagui Scholar, grant number 2019A026.

Data Availability Statement

The raw data supporting the conclusions of this article will be made available by the authors on request.

Acknowledgments

We thank the Beijing Novozymes Technology Co., Ltd. in the second-generation transcriptome and third-generation full-length transcriptome sequencing of the S. superba.

Conflicts of Interest

The funders had no role in the design of the study; in the collection, analyses, or interpretation of data; in the writing of the manuscript; or in the decision to publish the results.

References

  1. Li, J.; Jia, X.C.; Liu, L.Y.; Cao, X.M.; Xiong, Y.F.; Yang, Y.D.; Zhou, H.Q.; Yi, M.; Li, M. Comparative biochemical and transcriptome analysis provides insights into the regulatory mechanism of striped leaf albinism in arecanut (Areca catechu L.). Ind. Crops Prod. 2020, 154, 112734. [Google Scholar] [CrossRef]
  2. Pandalai, K.M.; Pillai, R.V. Albinism in Coconut Seedlings. Nature 1959, 184, 1163. [Google Scholar] [CrossRef]
  3. Silva, L.a.S.; Sampaio, V.F.; Barbosa, L.C.S.; Machado, M.; Flores-Borges, D.N.A.; Sales, J.F.; De Oliveira, D.C.; Mayer, J.L.S.; Kuster, V.C.; Rocha, D.I. Albinism in plants-far beyond the loss of chlorophyll: Structural and physiological aspects of wild-type and albino royal poinciana (Delonix regia) seedlings. Plant Biol. 2020, 22, 761–768. [Google Scholar] [CrossRef] [PubMed]
  4. Meng, X.X.; Xu, J.H.; Zhang, M.N.; Du, R.Y.; Zhao, W.X.; Zeng, Q.; Tu, Z.H.; Chen, J.H.; Chen, B.B. Third-generation sequencing and metabolome analysis reveal candidate genes and metabolites with altered levels in albino jackfruit seedlings. BMC Genom. 2021, 22, 543. [Google Scholar] [CrossRef] [PubMed]
  5. Xiong, B.; Ye, S.; Qiu, X.; Liao, L.; Sun, G.C.; Luo, J.Y.; Dai, L.; Rong, Y.; Wang, Z.H. Transcriptome Analyses of Two Citrus Cultivars (Shiranuhi and Huangguogan) in Seedling Etiolation. Sci. Rep. 2017, 7, 46245. [Google Scholar] [CrossRef] [PubMed]
  6. Sun, T.T.; Zhang, J.K.; Zhang, Q.; Li, X.L.; Li, M.J.; Yang, Y.Z.; Zhou, J.; Wei, Q.P.; Zhou, B.B. Methylome and transcriptome analyses of three different degrees of albinism in apple seedlings. BMC Genom. 2022, 23, 310. [Google Scholar] [CrossRef] [PubMed]
  7. Ke, X.B.; Shen, J.J.; Niu, Y.Q.; Zhao, H.J.; Guo, Y.L.; Sun, P.Y.; Yang, T.W.; Jiang, Y.X.; Zhao, B.S.; Wang, Z.; et al. Cucumber NUCLEAR FACTOR-YC2/-YC9 target translocon component CsTIC21 in chloroplast photomorphogenesis. Plant Physiol. 2023, 192, 2822–2837. [Google Scholar] [CrossRef] [PubMed]
  8. Wang, X.W.; Shao, C.X.; Liu, L.B.; Wang, Y.; An, Y.Q.; Li, H.; Ding, Y.W.; Jing, Y.P.; Li, X.J.; Xiao, J.W. PtrDJ1C, an atypical member of the DJ-1 superfamily, is essential for early chloroplast development and lignin deposition in poplar. Hortic. Plant J. 2023, 9, 1039–1054. [Google Scholar] [CrossRef]
  9. Wu, C.; Wu, H.T.; Wang, Q.; Wang, G.H.; Yi, X.; Chen, Y.P.; Zhou, G.X. Anticandidal Potential of Stem Bark Extract from Schima superba and the Identification of Its Major Anticandidal Compound. Molecules 2019, 24, 1587. [Google Scholar] [CrossRef] [PubMed]
  10. Xie, W.W.; Xu, D.T.; Chen, F.C.; Wang, Z.P.; Luo, J.D.; He, Y.H.; Zheng, Q.M.; Liu, C.Y. Integrated Cytological, Physiologicaland Transcriptome Analyses Provide Insight into the Albino Phenotype of Chinese Plum (Prunus salicina). Int. J. Mol. Sci. 2023, 24, 14457. [Google Scholar] [CrossRef] [PubMed]
  11. Qian, Q.X.; Ye, Q.F.; Xu, Y.; Vasupalli, N.; Lu, H.W.; Hu, Q.T.; Hou, D. Comparative Physiology and Transcriptome Analysis Provides Insights into the Regulatory Mechanism of Albinotic Bambusa oldhamii. Plants 2023, 12, 4090. [Google Scholar] [CrossRef] [PubMed]
  12. Wu, Z.J.; Liu, K.Y.; Zhang, X.; Tang, Q.H.; Zeng, L. CsNYC1a Mediates Chlorophyll Degradation and Albino Trait Formation in the Arbor-Type Tea Plant Camellia nanchuanica. J. Agric. Food Chem. 2024, 72, 14087–14098. [Google Scholar] [CrossRef] [PubMed]
  13. Bai, Q.S.; He, B.X.; Cai, Y.L.; Lian, H.M.; Zhang, Q.; Liang, D.C.; Wang, Y.L. Genetic Diversity and Population Structure of Schima superba From Southern China. Front. Ecol. Evol. 2022, 10, 879512. [Google Scholar] [CrossRef]
  14. Liu, B.; Liu, Q.Q.; Daryanto, S.; Guo, S.; Huang, Z.J.; Wang, Z.N.; Wang, L.X.; Ma, X.Q. Responses of Chinese fir and Schima superba seedlings to light gradients: Implications for the restoration of mixed broadleaf-conifer forests from Chinese fir monocultures. For. Ecol. Manag. 2018, 419, 51–57. [Google Scholar] [CrossRef]
  15. Wang, Y.P.; Wu, G.L.; Huang, S.H.; Ma, L.Z.; Fan, H.H.; Zhang, R.; Zhou, Z.C. Analysis of genetic parameters of growth and wood traits provides insight into the genetic improvement of Schima superba. Tree Genet. Genomes 2024, 20, 8. [Google Scholar] [CrossRef]
  16. Wu, C.P.; Fan, J.Z.; Xu, Y.H.; Jiang, B.; Jiao, J.J.; Yao, L.J.; Wieser, G. Adaptability Analysis of the Evergreen Pioneer Tree Species Schima superba to Climate Change in Zhejiang Province. Forests 2023, 14, 2438. [Google Scholar] [CrossRef]
  17. Thomas, S.; Underwood, J.G.; Tseng, E.; Holloway, A.K.; Bench to Basinet CvDC Informatics Subcommittee. Long-Read Sequencing of Chicken Transcripts and Identification of New Transcript Isoforms. PLoS ONE 2014, 9, e94650. [Google Scholar] [CrossRef] [PubMed]
  18. Salmela, L.; Rivals, E. LoRDEC: Accurate and efficient long read error correction. Bioinformatics 2014, 30, 3506–3514. [Google Scholar] [CrossRef] [PubMed]
  19. Sun, L.; Luo, H.T.; Bu, D.C.; Zhao, G.G.; Yu, K.T.; Zhang, C.H.; Liu, Y.N.; Chen, R.S.; Zhao, Y. Utilizing sequence intrinsic composition to classify protein-coding and long non-coding transcripts. Nucleic Acids Res. 2013, 41, e166. [Google Scholar] [CrossRef] [PubMed]
  20. Li, A.M.; Zhang, J.Y.; Zhou, Z.Y. PLEK: A tool for predicting long non-coding RNAs and messenger RNAs based on an improved k-mer scheme. BMC Bioinf. 2014, 15, 311. [Google Scholar] [CrossRef] [PubMed]
  21. Kang, Y.J.; Yang, D.C.; Kong, L.; Hou, M.; Meng, Y.Q.; Wei, L.P.; Gao, G. CPC2: A fast and accurate coding potential calculator based on sequence intrinsic features. Nucleic Acids Res. 2017, 45, 12–16. [Google Scholar] [CrossRef] [PubMed]
  22. Finn, R.D.; Coggill, P.; Eberhardt, R.Y.; Eddy, S.R.; Mistry, J.; Mitchell, A.L.; Potter, S.C.; Punta, M.; Qureshi, M.; Sangrador-Vegas, A.; et al. The Pfam protein families database: Towards a more sustainable future. Nucleic Acids Res. 2016, 44, 279–285. [Google Scholar] [CrossRef] [PubMed]
  23. Shimizu, K.; Adachi, J.; Muraoka, Y. ANGLE: A sequencing errors resistant program for predicting protein coding regions in unfinished cDNA. J. Bioinf. Comput. Biol. 2006, 4, 649–664. [Google Scholar] [CrossRef] [PubMed]
  24. Zheng, Y.; Jiao, C.; Sun, H.H.; Rosli, H.G.; Pombo, M.A.; Zhang, P.F.; Banf, M.; Dai, X.B.; Martin, G.B.; Giovannoni, J.J.; et al. ITAK: A Program for Genome-Wide Prediction and Classification of Plant Transcription Factors, Transcriptional Regulators and Protein Kinases. Mol. Plant 2016, 9, 1667–1670. [Google Scholar] [CrossRef] [PubMed]
  25. Fu, L.M.; Niu, B.F.; Zhu, Z.W.; Wu, S.T.; Li, W.Z. CD-HIT: Accelerated for clustering the next-generation sequencing data. Bioinformatics 2012, 28, 3150–3152. [Google Scholar] [CrossRef] [PubMed]
  26. Li, B.; Dewey, C.N. RSEM: Accurate Transcript Quantification from RNA-Seq Data with or Without a Reference Genome. BMC Bioinformatics 2011, 12, 323. [Google Scholar] [CrossRef] [PubMed]
  27. Anders, S.; Huber, W. Differential expression analysis for sequence count data. Genome Biol. 2010, 11, R106. [Google Scholar] [CrossRef] [PubMed]
  28. Jones, P.; Binns, D.; Chang, H.Y.; Fraser, M.; Li, W.Z.; Mcanulla, C.; Mcwilliam, H.; Maslen, J.; Mitchell, A.; Nuka, G.; et al. InterProScan 5: Genome-scale protein function classification. Bioinformatics 2014, 30, 1236–1240. [Google Scholar] [CrossRef] [PubMed]
  29. Feng, L.; Gao, M.J.; Hou, R.Y.; Hu, X.Y.; Zhang, L.; Wan, X.C.; Wei, S. Determination of quality constituents in the young leaves of albinism tea cultivars. Food Chem. 2014, 155, 98–104. [Google Scholar] [CrossRef] [PubMed]
  30. Wei, J.; Yang, L.H.; Wang, X.; Cao, Z.F.; Wang, C.J.; Cheng, H.W.; Luo, B.; Wei, Z.W.; Min, X.Y. Characterization of a novel green-revertible albinism mutant in alfalfa (Medicago sativa L.). J. Plant Physiol. 2025, 306, 154452. [Google Scholar] [CrossRef] [PubMed]
  31. Wang, Y.; Ma, Q.L.; Lin, L.J.; Zhang, H.F.; Luo, X.; Wang, J.; Lv, X.L.; Deng, Q.X. Integrated cytological, physiological and transcriptome analysis of the bud mutant of jujube (Ziziphus jujuba Mill.) with non-lethal albinism phenotype. Ind. Crops Prod. 2023, 201, 116964. [Google Scholar] [CrossRef]
  32. Bae, C.H.; Abe, T.; Matsuyama, T.; Fukunishi, N.; Nagata, N.; Nakano, T.; Kaneko, Y.; Miyoshi, K.; Matsushima, H.; Yoshida, S. Regulation of chloroplast gene expression is affected in ali, a novel tobacco albino mutant. Ann. Bot. 2001, 88, 545–553. [Google Scholar] [CrossRef]
  33. Spoehr, H.A. The Culture of Albino Maize. Plant Physiol. 1942, 17, 397–410. [Google Scholar] [CrossRef] [PubMed]
  34. Liu, C.H.; Zhu, H.T.; Xing, Y.; Tan, J.J.; Chen, X.H.; Zhang, J.J.; Peng, H.F.; Xie, Q.J.; Zhang, Z.M. Albino Leaf 2 is involved in the splicing of chloroplast group I and II introns in rice. J. Exp. Bot. 2016, 67, 5339–5347. [Google Scholar] [CrossRef] [PubMed]
  35. Roberts, R.J.; Carneiro, M.O.; Schatz, M.C. The advantages of SMRT sequencing. Genome Biol. 2013, 14, 405. [Google Scholar] [CrossRef] [PubMed]
  36. Yang, H.J.; Xu, D.P.; Zhuo, Z.H.; Hu, J.M.; Lu, B.Q. SMRT sequencing of the full-length transcriptome of the Rhynchophorus ferrugineus (Coleoptera: Curculionida). PeerJ 2020, 8, e9133. [Google Scholar] [CrossRef] [PubMed]
  37. Au, K.F.; Underwood, J.G.; Lee, L.; Wong, W.H. Improving PacBio Long Read Accuracy by Short Read Alignment. PLoS ONE 2012, 7, e46679. [Google Scholar] [CrossRef] [PubMed]
  38. Zhong, F.R.; Huang, L.; Qi, L.M.; Ma, Y.T.; Yan, Z.Y. Full-length transcriptome analysis of Coptis deltoidea and identification of putative genes involved in benzylisoquinoline alkaloids biosynthesis based on combined sequencing platforms. Plant Mol. Biol. 2020, 102, 477–499. [Google Scholar] [CrossRef] [PubMed]
  39. Zaib, P.; Ahmad, H.M.; Attacha, S.; Rahman, M.U.; Shafiq, M.R.; Parveen, K.; Fiaz, S.; Attia, K.A.; Ishaq, S.; Arif, S.; et al. Comparative genomics of light harvesting chlorophyll (LHC) gene family and impact of chlorophyll-A contents under drought stress in Helianthus annuus. J. Plant Physiol. 2023, 291, 154136. [Google Scholar] [CrossRef] [PubMed]
  40. Lu, X.M.; Hu, X.J.; Zhao, Y.Z.; Song, W.B.; Zhang, M.; Chen, Z.L.; Chen, W.; Dong, Y.B.; Wang, Z.H.; Lai, J.S. Map-Based Cloning of zb7 Encoding an IPP and DMAPP Synthase in the MEP Pathway of Maize. Mol. Plant 2012, 5, 1100–1112. [Google Scholar] [CrossRef] [PubMed]
  41. Sakamoto, W. Leaf-variegated mutations and their responsible genes in Arabidopsis thaliana. Genes Genet. Syst. 2003, 78, 1–9. [Google Scholar] [CrossRef] [PubMed]
  42. Yamatani, H.; Ito, T.; Nishimura, K.; Yamada, T.; Sakamoto, W.; Kusaba, M. Genetic analysis of chlorophyll synthesis and degradation regulated by BALANCE of CHLOROPHYLL METABOLISM. Plant Physiol. 2022, 189, 419–432. [Google Scholar] [CrossRef] [PubMed]
  43. Li, J.; Gong, J.; Zhang, L.C.; Shen, H.; Chen, G.P.; Xie, Q.L.; Hu, Z.L. Overexpression of SlPRE5, an atypical bHLH transcription factor, affects plant morphology and chlorophyll accumulation in tomato. J. Plant Physiol. 2022, 273, 153698. [Google Scholar] [CrossRef] [PubMed]
  44. Frangedakis, E.; Yelina, N.E.; Billakurthi, K.; Hua, L.; Schreier, T.; Dickinson, P.J.; Tomaselli, M.; Haseloff, J.; Hibberd, J.M. MYB-related transcription factors control chloroplast biogenesis. Cell 2024, 187, 4859–4876. [Google Scholar] [CrossRef] [PubMed]
  45. Wu, M.B.; Xu, X.; Hu, X.W.; Liu, Y.D.; Cao, H.H.; Chan, H.E.; Gong, Z.H.; Yuan, Y.J.; Luo, Y.Q.; Feng, B.H.; et al. SlMYB72 Regulates the Metabolism of Chlorophylls, Carotenoids and Flavonoids in Tomato Fruit. Plant Physiol. 2020, 183, 854–868. [Google Scholar] [CrossRef] [PubMed]
  46. Cackett, L.; Luginbuehl, L.H.; Schreier, T.B.; Lopez-Juez, E.; Hibberd, J.M. Chloroplast development in green plant tissues: The interplay between light, hormone and transcriptional regulation. New Phytol. 2021, 233, 2000–2016. [Google Scholar] [CrossRef] [PubMed]
  47. Ali, N.; Chen, H.; Zhang, C.; Khan, S.A.; Gandeka, M.; Xie, D.; Zhuang, W. Ectopic expression of AhGLK1b (GOLDEN2-like transcription factor) in Arabidopsis confers dual resistance to fungal and bacterial pathogens. Genes 2020, 11, 343. [Google Scholar] [CrossRef] [PubMed]
  48. Nakamura, H.; Muramatsu, M.; Hakata, M.; Ueno, O.; Nagamura, Y.; Hirochika, H.; Takano, M.; Ichikawa, H. Ectopic overex- pression of the transcription factor OsGLK1 induces chloroplast development in non-green rice cells. Plant Cell Physiol. 2009, 50, 1933–1949. [Google Scholar] [CrossRef] [PubMed]
  49. Nguyen, C.V.; Vrebalov, J.T.; Gapper, N.E.; Zheng, Y.; Zhong, S.; Fei, Z.; Giovannoni, J.J. Tomato GOLDEN2-LIKE transcription factors reveal molecular gradients that function during fruit development and ripening. Plant Cell 2014, 26, 585–601. [Google Scholar] [CrossRef] [PubMed]
  50. Wu, Y.Y.; Wu, S.; Li, X.Y.; Deng, J.H.; Liu, P.; Wang, W.Q.; Yin, X.R.; Liu, X.F. Transcriptional factors AcNAC1/2 synergistically orchestrate kiwifruit chlorophyll degradation. Postharvest Biol. Technol. 2025, 227, 113600. [Google Scholar] [CrossRef]
Figure 1. Phenotypes of normal (A) and albinism seedlings (B) of S. superba.
Forests 16 01201 g001
Figure 2. Data processing (A) and summary statistics (B,C) of PacBio Iso-Seq-derived single genes. (A) Overview of the data process. (B) Unigene length distribution. (C) Isoform number.
Forests 16 01201 g002
Figure 3. Structural analysis of S. superba full-length transcripts of (A) LncRNA prediction; (B) CDS length distribution; (C) top 30 TF families.
Forests 16 01201 g003
Figure 4. Annotation statistics: (A) database-wise transcript distribution; (B) KEGG pathway classification; (C) GO database annotation statistics.
Forests 16 01201 g004
Figure 5. FPKM box plot of albinism and normal seedlings of S. superba. Each box plot corresponds to five statistics: maximum, upper quartile, median, lower quartile and minimum.
Forests 16 01201 g005
Figure 6. Volcano plot of DEGs. Red: up-regulated; green: down-regulated; blue: non-significant differential. The horizontal coordinates represent the fold change in expression of genes across samples. The vertical coordinates represent the statistical significance of the difference in the change in gene expression.
Forests 16 01201 g006
Figure 7. KEGG pathway enrichment bubble plot for DEGs.
Forests 16 01201 g007
Figure 8. Heat map of photosynthesis-antenna protein pathway (ko00196) and related gene expression. The green box gene expression is down-regulated in S. superba albinism leaves.
Forests 16 01201 g008
Figure 9. Carotenoid biosynthesis and enzyme gene expression. GGPP, geranylgeranyl diphosphate; PSY, phytoene synthase; PDS, phytoene desaturase; ZDS, ζ-carotene desaturase; LCYb, lycopeneβ-cyclase; LCYe, lycopene ε-cyclase; LUT1, carotenoid ε-cyclohydroxylase; crtZ, β-carotene 3-hydroxylase; VDE, violaxanthin de-epoxidase; ZEP, zeaxanthin epoxidase.
Forests 16 01201 g009
Table 1. Comparison of reads with reference sequences.
Sample NameTotal ReadsTotal Mapped
CK-154,089,18045,545,316 (84.20%)
CK-262,614,98650,384,258 (80.47%)
CK-373,948,04060,144,360 (81.33%)
Albinism-169,103,85455,065,662 (79.69%)
Albinism-256,452,22244,111,492 (78.14%)
Albinism-361,578,32850,147,544 (81.44%)
CK: S. superba normal leaf; Albinism: S. superba albinism leaf; Total reads: the number of sequenced sequences after quality control; Total mapped: the number of sequenced sequences that can be aligned to the reference sequence.
Table 2. Statistics of the number of genes in different expression level intervals.
FPKMCK-1CK-2CK-3Albinism-1Albinism-2Albinism-3
FPKM ≤ 16636
(22.15%)
5832
(19.47%)
6148
(20.53%)
5654
(18.87%)
4983
(16.64%)
5858
(19.55%)
1 < FPKM ≤ 1515,084
(50.35%)
15,108
(50.43%)
14,737
(49.2%)
14,948
(49.9%)
15,422
(51.49%)
14,981
(50.01%)
FPKM > 158237
(27.5%)
9017
(30.09%)
9072
(30.29%)
9355
(31.23%)
9552
(31.89%)
9118
(30.43%)
Table 3. Analysis of TFs associated with albinism seedlings of S. superba.
Transcript IDGene IDlog2 (FC)Expression
transcript_HQ_blade_transcript24945bHLH9.8885up
transcript_HQ_blade_transcript30262bHLH9.1724up
transcript_HQ_blade_transcript37875bHLH−5.0077down
transcript_HQ_blade_transcript38898bHLH7.9627up
transcript_HQ_blade_transcript49724bHLH7.7079up
transcript_HQ_blade_transcript237MYB3.4657up
transcript_HQ_blade_transcript3381MYB5.2246up
transcript_HQ_blade_transcript14434MYB6.8876up
transcript_HQ_blade_transcript26491GLK2.9225up
transcript_HQ_blade_transcript43928GLK7.7787up
transcript_HQ_blade_transcript44162GLK−2.9006down
transcript_HQ_blade_transcript21143NAC−3.8109down
Disclaimer/Publisher’s Note: The statements, opinions and data contained in all publications are solely those of the individual author(s) and contributor(s) and not of MDPI and/or the editor(s). MDPI and/or the editor(s) disclaim responsibility for any injury to people or property resulting from any ideas, methods, instructions or products referred to in the content.

