Article

A Simple Model to Predict the Temporal Nitrogen Saturation Point of a Jack Pine (Pinus banksiana L.) Forest

by
Andrew M. McDonough
and
Shaun A. Watmough
*
School of the Environment, Trent University, Peterborough, ON L1J 5Y1, Canada
*
Author to whom correspondence should be addressed.
Forests 2025, 16(7), 1195; https://doi.org/10.3390/f16071195
Submission received: 9 June 2025 / Revised: 7 July 2025 / Accepted: 15 July 2025 / Published: 19 July 2025
(This article belongs to the Section Forest Health)

Abstract

Dry jack pine forests exposed to elevated nitrogen (N) deposition do not necessarily exhibit traditional N saturation responses. Using empirical results from a five year above-canopy N deposition experiment, a simple nitrogen (N) saturation model was developed for jack pine (Pinus banksiana Lamb.) forests dominated by cryptogams. For the model, a series of differential equations using empirically derived rate constants (k) were applied to estimate changes in net N pools in biotic and abiotic components across a narrow N deposition gradient (0, 5, 10, 15, 20, and 25 kg N ha−1 yr−1). Critical soil C:N ratios were used as the model limit to signify saturation. We explored the saturation response time by priming the model to mineralize approximately one percent of the soil N pool after the critical C:N ratio was reached. A portion of this pool was made available to jack pine trees. Nitrogen leaching below the rooting zone occurred when the mass of N mineralized from the soil organic- and A horizon layers exceeded the theoretical mass required by jack pine, driving the mineral soil below the critical C:N ratio. The model suggests that N leaching below the rooting zone could happen around 50 (1% LFH N mineralization) years after the onset of deposition at 25 kg N ha−1 yr−1. In contrast, N deposition rates ≤ 20 kg N ha−1 yr−1 are not expected to be associated with N leaching over this timeframe. The modeled results are consistent with empirical surveys of jack pine forests exposed to elevated N deposition for several decades.

1. Introduction

Nitrogen (N) often limits plant growth in boreal and temperate upland forests [1]. When forests are largely free from anthropogenic influence, the N requirements of plants are fulfilled by N cycling via decomposition, N fixation, and atmospheric deposition that largely originate from lightening or fire and generally range between 0.1 and 3 kg N ha1 yr1 [2]. When N is deficient in forests, trees can experience a reduction in foliar biomass and growth [3]. In addition, N deficiency can impact chlorophyll concentrations, leading to reductions in carbohydrate production and biomass. This has led to a reduction in the number of leaves produced by olive trees by almost half when compared with trees with an adequate N supply [4]. While impacts of N deficiency on plants are evident, deleterious effects have been reported when anthropogenic activity augments atmospheric N deposition. These effects include soil nitrate (NO3) and base cation loss, compositional shifts in vegetation [5], and increases in fine root turnover [6,7], among others.
While N dynamics are complex and a full mechanistic understanding of how N changes ecosystem biogeochemistry and plant community composition over time is lacking as ecosystems respond to enhanced N deposition in different ways [8,9,10], numerous dynamic biogeochemical models have been developed for terrestrial and aquatic ecosystems. These include the following: the Model of Acidification of Groundwater In Catchments (MAGIC) [11]; the Very Simple Dynamic Soil Acidification Model (VSD) [12,13]; the Simulation Model for Acidification’s Regional Trends (SMART) [14]; PnET-BGC [15]; Soil Acidification of Forest Ecosystems (SAFE), which was amended to ForSAFE (the Forest Soil Acidification Model of Forested Ecosystems); and, subsequently, ForSAFE-VEG (the Forest Soil Acidification Model of Forested Ecosystems and Vegetation) [16]. Generally, mechanisms driving soil acidification are in part predicated on reductions in base cations through NO3 leaching, which itself is partially related to well-founded inherent assumptions of nitrification by microbes [17,18]. At some boreal forest locations with elevated N deposition in both eastern and western Canada, there are reports regarding the absence of nitrifying bacteria [19,20], highlighting the differences among forest responses to N deposition.
Experimental work in the bituminous sands region of northern Alberta, Canada, for example, has shown a marked ability of jack pine (Pinus banksiana Lamb.) forests to absorb and immobilize inputs of N delivered from above the canopy [8,19,21]. McDonough et al. [8] reported that the forest canopy uptake slightly favored ammonium (NH4+) over nitrate (NO3) and reported that most N was immobilized by epiphytic lichens. As a result, the N pool in lichens ranged between 4% and 10% of applied N across all treatments (experimental gradient ranged from 0 to 25 kg N ha1 yr1). Gaige et al. [10] also reported that experimental additions of N above the canopy favored NH4+ retention and were associated with non-vascular, canopy-dwelling organisms. While McDonough et al. [8] reported some nuance regarding the contributions of N in throughfall, the non-vascular cryptogams, litter, fibric, and humus layer of the forest floor proved to be an effective sink of elevated N deposition [8,19]. Consequently, typical soil responses driven by N deposition reported elsewhere [22,23,24] were absent by the end of the study and could have possible consequences when trying to understand the outcomes over time.
Given the unique responses of the jack pine forest reported by McDonough et al. [8], McDonough and Watmough [21], and Bird et al. [19] over a five-year experimental N deposition study, we have developed a simple model here incorporating both empirical and mechanistic operations to help understand how the forest may respond over time. There were three main considerations for this work: (1) to estimate the duration of time it may take for the forest floor to saturate based on empirically derived N endpoints; (2) to compare experimental responses and modeled projections with a high-exposure jack pine site that had received inorganic N deposition at comparable rates over a prolonged period; and (3) to develop a conceptual model for jack pine forests receiving elevated atmospheric N deposition in the region.

2. Materials and Methods

2.1. Experimental Design

This is a continuation of the research by McDonough et al. [8], McDonough and Watmough [21], and Bird et al. [19], and is predicated on in situ experimental work conducted across a narrow, environmentally relevant, N deposition gradient (0, 5, 10, 15, 20, and 25 kg N ha−1 yr−1) in the bituminous sands region of northern Alberta, Canada. Briefly, N was added above a jack pine forest canopy as aqueous ammonium nitrate (NH4NO3) four times per year for five years (2011–2015) during the growing season using a mechanized sprayer attached to a helicopter. Applications started with low deposition scenarios (5 kg N ha−1 yr−1) and finished with high (25 kg N ha−1 yr−1), and the helicopter tank was flushed with pure water between treatments. For complete details, see McDonough et al. [8].

2.2. High-Exposure Site

To provide environmental context for the modeling application, measurements were taken from a homogeneous jack pine forest exposed to high N deposition (12–26 kg N ha−1 yr−1 in throughfall) [25] that was located <3 km from major industrial operations around the open pit mines in the bituminous sands region of Alberta, Canada. This site was approximately 12 km east of the experimental sites herein (Figure 1) and consisted of sandy, well-drained, eluviated dystric Brunisols [26], and the functional rooting zone was largely restricted to the top 30 cm on mineral soil.
While the high-exposure site had the same climatic conditions as the experimental forest, elevated levels of N, S, and base cation deposition have been reported in throughfall [25,27]. Base cation deposition is most likely the result of fugitive dust emissions from major open pit mining activities [27], whereas N and S deposition can originate from multiple sources, including flue gas emissions and fossil fuel combustion [28].
Data from the high-exposure site, including N deposition [25], soil N concentration, NO3 leaching, [26], vascular plant foliar N concentrations, and lichen N concentrations [29], were used for comparison against the controls, 15 kg N ha−1 yr−1, and 25 kg N ha−1 yr−1 treatments. Furthermore, during 2012, understory vascular plant cover data were collected from six 1 m2 ground vegetation quadrats, and foliage was collected by clipping sun-exposed needles from the upper canopy from six representative jack pine trees.

2.3. Simple Model

Predicting the response of the forest to elevated N required some basic assumptions in the model. These assumptions are largely based on empirical observations from experimental and gradient studies; therefore, while numerous, the assumptions are integral to the execution of the model, and their empirical nature adds validity. The following points were assumed: (a) Non-vascular plant biomass was in a steady state; (b) The understory vascular plant N pool was negligible and the N sorption capacity of the non-vascular understory plants is limited and will saturate at a point in time [30]; (c) N inputs in throughfall are 47% of the total load applied and based on experimental results, all throughfall N in the highest treatment bypasses the canopy after five years in the highest treatment; (d) The mass of N in throughfall that does not enter cryptogams enters the forest floor (litter, fibric, and humus (LFH)) [19]; (e) Decreases in the forest floor C:N ratio are the result of added N only (no change in C pools); and (f) N leaching from the forest floor to mineral soil will commence once the LFH C:N ratios reach 20 [31] (1% of the pool, including all treatments (an arbitrary value), and a second scenario of 0.78% applied to 25 kg N ha−1 yr−1 treatment as well). This is predicted by the possibility that litter mineralization slowed in the highest treatment. The value of 0.78% was selected because there was a 22% increase in the N:C ratio of decomposing jack pine litter relative to the other treatments. This N increase is presumably due to a reduction in the litter mineralization rate [8,32]. (g) Throughfall N bypasses the forest floor once LFH C:N reaches 10 [33]; (h) The mineral soil immobilizes the fraction of N not taken up by growing trees until it reaches a C:N ratio of 20; (i) Jack pine grow over time and foliar N concentration saturates at 2.3% (empirically derived [34]); and (j) The model reaches an endpoint once the mineral soil C:N ratio reaches 20, when “N saturation” has occurred.
The assumption that foliar N plateaus at a given N concentration is simply based on the largest empirical N values that we obtained from the literature for jack pine forests [34,35,36]. Although this limit is applied in this simple model, there is no suggestion that it is an absolute threshold. The limit is simply needed for the first order decay model (Xt = Ct(1 − ek−t)), which would not accurately predict N storage based on the empirical results herein. The causal loop diagram below provides a schematic of the positive and negative feedbacks in the model and encompasses the full suite of calculations (Figure 2).

2.4. Model Calculations

The conceptual model is composed of multiple calculations designed to provide a crude prediction of the time as to when the biotic and abiotic components of the forest will reach kinetic saturation or a maximum N storage capacity. The computations in the model are a combination of 8 different differential equations and simple arithmetic calculations. The differential equations provide the rates of change for nitrogen concentrations for the various species, while the N pool sizes are largely estimated by simple arithmetic using the N concentration and biomass. These computations were carried out using a basic spreadsheet but could easily be adapted to “if then” statements or code. The model equations are partitioned by four categories, as follows: (1) the total N storage capacity and kinetic uptake rate of the cryptogams, (2) the total N storage capacity of the LFH layer, (3) the change in the C:N ratio for both the forest floor and the mineral soil is caused by N additions only, and (4) the assumption that growing trees will satisfy their excess N demand from the mineralized N pool after the forest floor reaches a C:N ratio of 20. Moreover, mineralized N (from the forest floor) beyond tree demand will enter the mineral soil. Subsequently, the model endpoint is achieved once the C:N ratio of the mineral soil reaches 20.
Many of the calculations used in the model depend on logarithmic growth requiring a rate constant (k); therefore, Equation (1) was used to solve k (k > 0):
k = (ln(Ct/C0))/t
where Ct is the final thalli N concentration (%), foliar N concentration (%), or tree diameter (cm), and C0 is the initial concentration of thalli/foliar N, or tree diameter, which are derived from empirical data.
To model jack pine foliar N concentration (%), it was assumed that k for the control plot was 0, while other k values were calculated using data from Weetman and Fournier [34] that spanned deposition loads of 0, 34, 67 kg, and 134 kg N ha−1 yr−1. The line equation was then used to model rate constants for the 5, 10, 15, 20, and 25 kg N ha−1 yr−1 treatments. Furthermore, Burns and Honkala [37] reported that the average jack pine bole diameter can reach 20 cm (130 cm above the forest floor) on nutrient-poor sites over 100 years in Saskatchewan, Canada. Using the empirical bole diameter from the experimental sites (all trees regardless of treatment), we forced k (0.02) to reach ~11 cm after 60 years (empirical DBH) and ~20 cm after 100 years (Table 1). The 100-year timeframe was used to model tree growth; however, the general model was only considered over a 50-year timeframe, as this might provide a more realistic projection considering the five-year nature of the empirical experimental work that the model is predicated on.
The rate constants were then used in Equation (2) to model N concentrations for the cryptogams Cladonia mitis Sandst., Cladonia stellaris Opiz. and Pleuorozim schreberi (Brid.) Mitt., and foliar N concentrations and bole diameter for jack pine:
Xt = Ct(1 − e−kt) + C0
where Xt is the N concentration of one of the three cryptogams at time (t) (years), Ct is their final empirical N concentration (%) in the fifth application year, and k is the empirically derived decay constant. Using cryptogam biomass (Cbio) (kg ha−1) and the corresponding modeled N concentrations, the annual mass of N that they accumulate (Cn) (kg N ha−1 yr−1) can be calculated (Equation (3)).
Cn = Xt × Cbio
By summing up the masses of N stored in cryptogams annually (assuming no change in biomass) over a given timeframe, the total immobilizing effect of this kinetic process can be estimated (Equation (4)).
C r y N = C n i + k = 0 t Δ   C n
where CryN is the total pool of N immobilized by cryptogams over a given time (t) (kg ha−1) after the baseline year (k = 0), Cni is the initial cryptogam N pool (kg ha−1), and ΔCn is the change in annual cryptogam N pool (kg ha−1). Although the kinetic assimilation rates of N by cryptogams should lower throughfall concentrations, it may not eliminate them. Therefore, it is assumed that, because the non-vascular biotic pool resides overtop of the LFH layer, unused N in throughfall will enter the forest floor (Equation (5)).
LFHn = (TFn − Cn) + LFHi
where LFHn is the annual mass (kg ha−1) of N entering the LFH layer, TFn is the mass of N in throughfall (kg N ha−1), and LFHi is the initial empirical N mass of the LFH layer (kg ha−1). To calculate the change in the LFH C:N ratios, the cumulative mass of N in the LFH layer (LFHc) needed to be modeled and compared with empirical C masses (Equation (6)).
L F H c = L F H i + k = 0 t Δ L F H n
Elevated N mineralization in the LFH layer was triggered once the C:N ratio reached 20, at which point 1% (arbitrary) of the total N pool was mineralized and made available to jack pine (Equation (7)):
Navi = LFHNt × (1/100)
where LFHNt is the total LFH N pool (kg ha−1) at a given time after the C:N ratio reaches 20. If the N mass produced exceeds tree demand (Equation (7)), then it enters the mineral soil.
The kinetic constraints for jack pine were regulated by the rate constant (k) for foliar N. It was assumed that jack pine foliage could reach a maximum concentration of 2.3% N, which is simply predicated on the maximum foliar N concentration found in the literature [34]. While other tree tissues grew, we assumed that there was no increase in N concentration. As a result, mineralized N in the forest floor simultaneously entered two pools, either growing trees or mineral soil. Based on tree N demand (Equation (8)), the model was calibrated so trees would acquire N first, but if N that was made available exceeded tree demand, then excess N entered the mineral soil. Mineralization rates did not change over the experimental period and, therefore, they were not adjusted until the modeled C:N ratios reached 20. Furthermore, microbial uptake of N is not explicitly modeled, but it is assumed that they act as an immobilizing contingent in soil, as follows:
ΔNt = Ycurrent − Yprevious
where ΔNt is the change in the total N tree pool from year to year (kg N ha−1); Ycurrent is the total mass of N in the aboveground biomass (kg ha−1) for a given model year derived by the DBH-only allometric equation for jack pine defined by Lambert et al. [38]; and Yprevious is the total N tree pool (kg N ha−1) from the previous year. Note, N% values for stems, bark, and branches were held constant over time, while foliar N was predicted using the decay function (growth form) above.
The model endpoint was reached when the mineral soil C:N ratio decreased to 20. Nitrogen pool calculations for the mineral soil were based on the average N concentration in the rooting zone (top 30 cm) using a soil bulk density of 1.32 g cm−3.

2.5. Statistical Analysis

A one-way ANOVA was used to compare N concentrations of jack pine foliage and soil among the control, 15 kg N ha−1 yr−1, 25 kg N ha−1 yr−1, and the high-exposure sites that received ~20 kg N ha−1 yr−1 as throughfall (α = 0.05). All analyses were carried out using the statistical program R [39].

3. Results

3.1. Modeling Change in the Nitrogen Pool of Cryptogams

The model suggests that, although cryptogam immobilization slows after 10 years, these organisms may reach capacity after storing roughly 35 kg N ha−1 to 40 kg N ha−1, but they are not expected to fully plateau until approximately 30 years after inputs began in the 20 kg N ha−1 yr−1 and 25 kg N ha−1 yr−1 treatments. Given the negligible k values for both the control and the 5 kg N ha−1 yr−1 treatments, no additional N accumulation was predicted. Owing almost exclusively to the accumulation of N by Pluerozium schreberi (Brid.) Mitt., we expect a slight initial increase in cryptogam N content in the 5 kg N ha−1 yr−1 treatment, which should stabilize quickly (Figure 3).
The predicted increases of N should lower the forest floor C:N ratio rapidly in the 25 kg ha−1 yr−1 treatments and more moderately at treatments of ≤20 kg N ha−1 yr−1. As a result, the critical C:N ratio of 20 (forest floor) in the model was reached only 12 years after addition began for the highest treatment plot (25 kg N ha−1 yr−1), whereas it may take upwards of 21 and 28 years for the 20 kg N h−1 yr−1 and 15 kg N ha−1 yr−1 plots, respectively. For the lower treatments, the models suggest that it will take approximately 40 and >50 years for the forest floor to reach the critical C:N ratio in the 10 kg N ha−1 yr−1 and 5 kg N ha−1 yr−1 plots, respectively, while the control plot should be stable over time (Figure 4).
With respect to sensitivity in the model, if the LFH C:N saturation ratios are adjusted to 22 and 18, the 25 kg N ha−1 yr−1 load will reach saturation at approximately 9 and 13 years, respectively. For loads of 20 kg N ha−1 yr−1 and 15 kg N ha−1 yr−1, there is an approximate four-year spread on either side of the 20- and 27-year saturation estimates from when the LFH C:N ratio is 20. For the 10 kg N ha−1 yr−1 treatment, however, the timeframe to LFH saturation changes to 33- and 47 years for C:N ratios of 22 and 18 respectively. Litter, fibric, and humus C:N ratios are not expected to change for loads ≤ 5 kg N ha−1 yr−1 within the 50-year modeled timeframe (Table S1, Supplementary Material).
Increases in N concentration in jack pine needles above baseline conditions in the model were only activated once a C:N ratio of the forest floor reached 20, at which point mineralization of the humus form was allowed to increase above the baseline (1% for all treatments and a second scenario of 0.78% for the 25 kg N ha−1 yr−1). As a result, the control plot is expected to remain in a steady state over the 50-year period (assumed negligible foliar uptake of atmospheric N based on experimental results); moreover, while the highest and second highest treatments increase over the modeled timeframe, they are not expected to reach 2.3% N within the 50-year timeframe (Figure 5). Fixing forest floor mineralization at 1% (and 0.78% in the highest treatment) above the baseline altered the time at which N entered the mineral soil. The different forest floor mineralization rates in the highest treatment, however, did not meaningfully affect tree demand or when tree N was made available. As a result, jack pine trees from the highest treatment are expected to accumulate all available N over the first ten-year period, and none is expected to enter the mineral soil during this time. This same trend is expected for treatment plots 10, 15, and 20 kg N ha−1 yr−1, which occurred over 16-, 12- and 10-year periods, respectively. For the lowest experimental treatment (5 kg N ha−1 yr−1), however, N could enter the mineral soil immediately after the critical C:N ratio was reached, as tree demand is expected to be lower than that in the other treatments owing to the much lower predicted foliar N concentrations.
The 0, 5, 10, 15, and 20 kg N ha−1 yr−1 treatments are not predicted to reach the critical mineral soil C:N ratio within the 50-year modeled period. Conversely, the 25 kg N ha−1 yr−1 treatments could reach this metric at 50 years. There is no change in the timeframe if N mineralization of the forest floor is decreased to 0.78% (once the humus form C:N ratio reaches 20) (Figure 6). With respect to model sensitivity, if we adjust the saturation C:N ratios for mineral soil (1% of N in the organic layer is mineralized) to 22 and 18, time to saturation for the 25 kg N ha−1 yr−1 becomes 41- and >50 years, respectively. When considering a scenario under the 25 kg N ha−1 yr−1 deposition load where only 0.78% of N is mineralized from the organic horizon, the modeled timeframe to saturation is 42 years. The model does not predict saturation within the 50-year timeframe for a mineral soil C:N ratio of 18. Mineral soil C:N ratios of 22 and 18 are not expected to be reached within the 50-year timeframe for the other deposition scenarios (Tables S2 and S3 Supplementary Material).

3.2. Comparing the Experimental Site with the In Situ High-Nitrogen-Exposure Site

Atmospheric N deposition at the high-exposure site ranged from 12 to 26 kg N ha−1 yr−1 between 2008 and 2010 [25,26], which is within the range of the experimental site treatments. Interestingly, there were no significant differences (p > 0.05) in jack pine foliar N concentrations. Although soil N concentrations are slightly higher at the high-exposure site, again, there were no significant differences between the sites (p > 0.05). Nitrate leaching below the rooting zone was very low at all sites (Table 2). Although the epiphytic lichen community was sparse at the high-exposure site when compared with that of the experimental area, N concentrations in thallus tissues were higher than those found at the experimental site. Both Evernia mesomorpha Nyl. and Hypogymnia physodes L. thalli N concentrations were elevated by approximately 1% at the high-exposure site relative to the 15 kg N ha−1 yr−1 and 25 kg N ha−1 yr−1 experimental plots. Interestingly, terricolous lichen Cladonia mitis Sandst. thalli concentration at the high-exposure site was between that found in the control and the 25 kg N ha−1 yr−1 treatment, and almost at parity with the 15 kg N ha−1 yr−1 (0.81% N) treatment at 0.73% N (Table 2); however, like epiphytic lichens, their abundance was highly limited.
In contrast to lichens, total understory vascular vegetation cover and richness were dramatically higher at the high-exposure site at 53% (±53) and 8 (±1) when compared with those of the experimental sites ~12% and 4 (±1), respectively, and this was overwhelmingly driven by Arctostaphylos uva-ursi L. (Table 3).

4. Discussion

4.1. Modeled Response to Elevated Nitrogen Deposition

Studies conducted in the bituminous region so far have indicated that elevated N deposition has little impact on ecosystem biogeochemistry, with no detectable changes in soil chemistry or nitrate availability [40]. The most notable response observed from surveys and experimental studies is an increase in N content in epiphytic lichens and cryptograms [40]. Here, we developed a simple model based on experimental observations over five years to predict when pronounced biogeochemical changes may occur that lead to elevated N leaching at deposition scenarios ranging from background (~2.5 kg N ha−1 yr−1) to 25 kg N ha−1 yr−1 (plus background). This simple model suggests that the forest floor critical C:N ratio will be reached after approximately 12 years from t0 at 25 kg N ha−1 yr−1. After this point, and assuming 1% (and additionally at 0.78% N) mineralization of the forest floor at the highest treatment, jack pine foliar N concentrations will increase steadily for the modeled timeframe but will never reach 2.3% foliar N. Lowering the forest floor N mineralization rate (0.78%) had no effect on tree uptake. Despite this, trees are only expected to offset N contributions from the forest floor to the mineral soil for about a further 10 years (year 19), after which the C:N ratios (mineral soil) are predicted to decline towards 20 until roughly 50 years after t0, after which N losses are assumed as the mineral soil C:N ratio reaches 20. Nothing changes if we assume the highest treatment retards N mineralization by 22% relative to lower treatments, as N leaching is still predicted to occur roughly 50 years after t0. At 20 kg N ha−1 yr−1 and below, the critical mineral soil C:N ratio is not predicted to be reached within 50 years after the additions begin. Outside of the mining area (>5 km), where most monitoring sites are located, the modeled deposition is estimated to be <5 kg N ha−1 yr−1 [41,42], so our model is consistent with observations and suggests that broadly regional changes in N biogeochemistry will not occur for several decades, if at all, at constant deposition.
Using carbon-weighted N in litter, McDonough et al. [8] suggest that N mineralization of litter may have slowed in the highest treatment, which is a common response to elevated N [43] (and references within). After applying a scenario where LFH N mineralization in the highest treatment was set to roughly 80% relative to the others (≤20 kg N ha−1 yr−1), leaching (N) is not expected to change meaningfully relative to 1%. This model, however, does not incorporate N-re-immobilization potential by humic materials after N is mineralized by microbes, which would essentially mitigate N entering the mineral soil [43]. While adjusting LFH N mineralization rates in the model—based on higher N content in decomposing litter after five years of 25 kg N ha−1 yr−1 treatment—may be controversial, it does not change the prediction meaningfully within the 50-year timeframe. Interestingly, however, there is a similar timeframe (10 years) between the modeled projections of when the LFH critical C:N ratio may reach 20, when we assume trees have access to N (~10 years after additions begin), and the time it took for jack pine to respond to the experimental N additions in Quebec (~10 years) reported by Weetman et al. [36]. It should be noted that Weetman et al. [36] exclude the fibric and humus layers from analysis and applied considerably more N with cumulative loads ranging between 336 and 1344 kg N ha−1 over a nine-year period, ultimately limiting the comparison with the data herein.
McDonough et al. [8] reported a reduction in canopy N acquisition after five years in the highest treatment, and this was included as a model parameter. This process was responsible for the relatively faster pace at which the forest saturated in the conceptual model when compared with the lower treatments. Presumably, the N sorption capacity of canopy-dwelling organisms and fine branching may be related to both cumulative load and the concentration of N in precipitation [44,45]. In which case, canopies experimentally receiving 20 kg N ha−1 yr−1 or lower may have been on the verge of saturation. If this is true, presumably, more N would bypass the canopy in the lower treatments and enter the forest floor, in which case the model may underestimate the time to saturation.

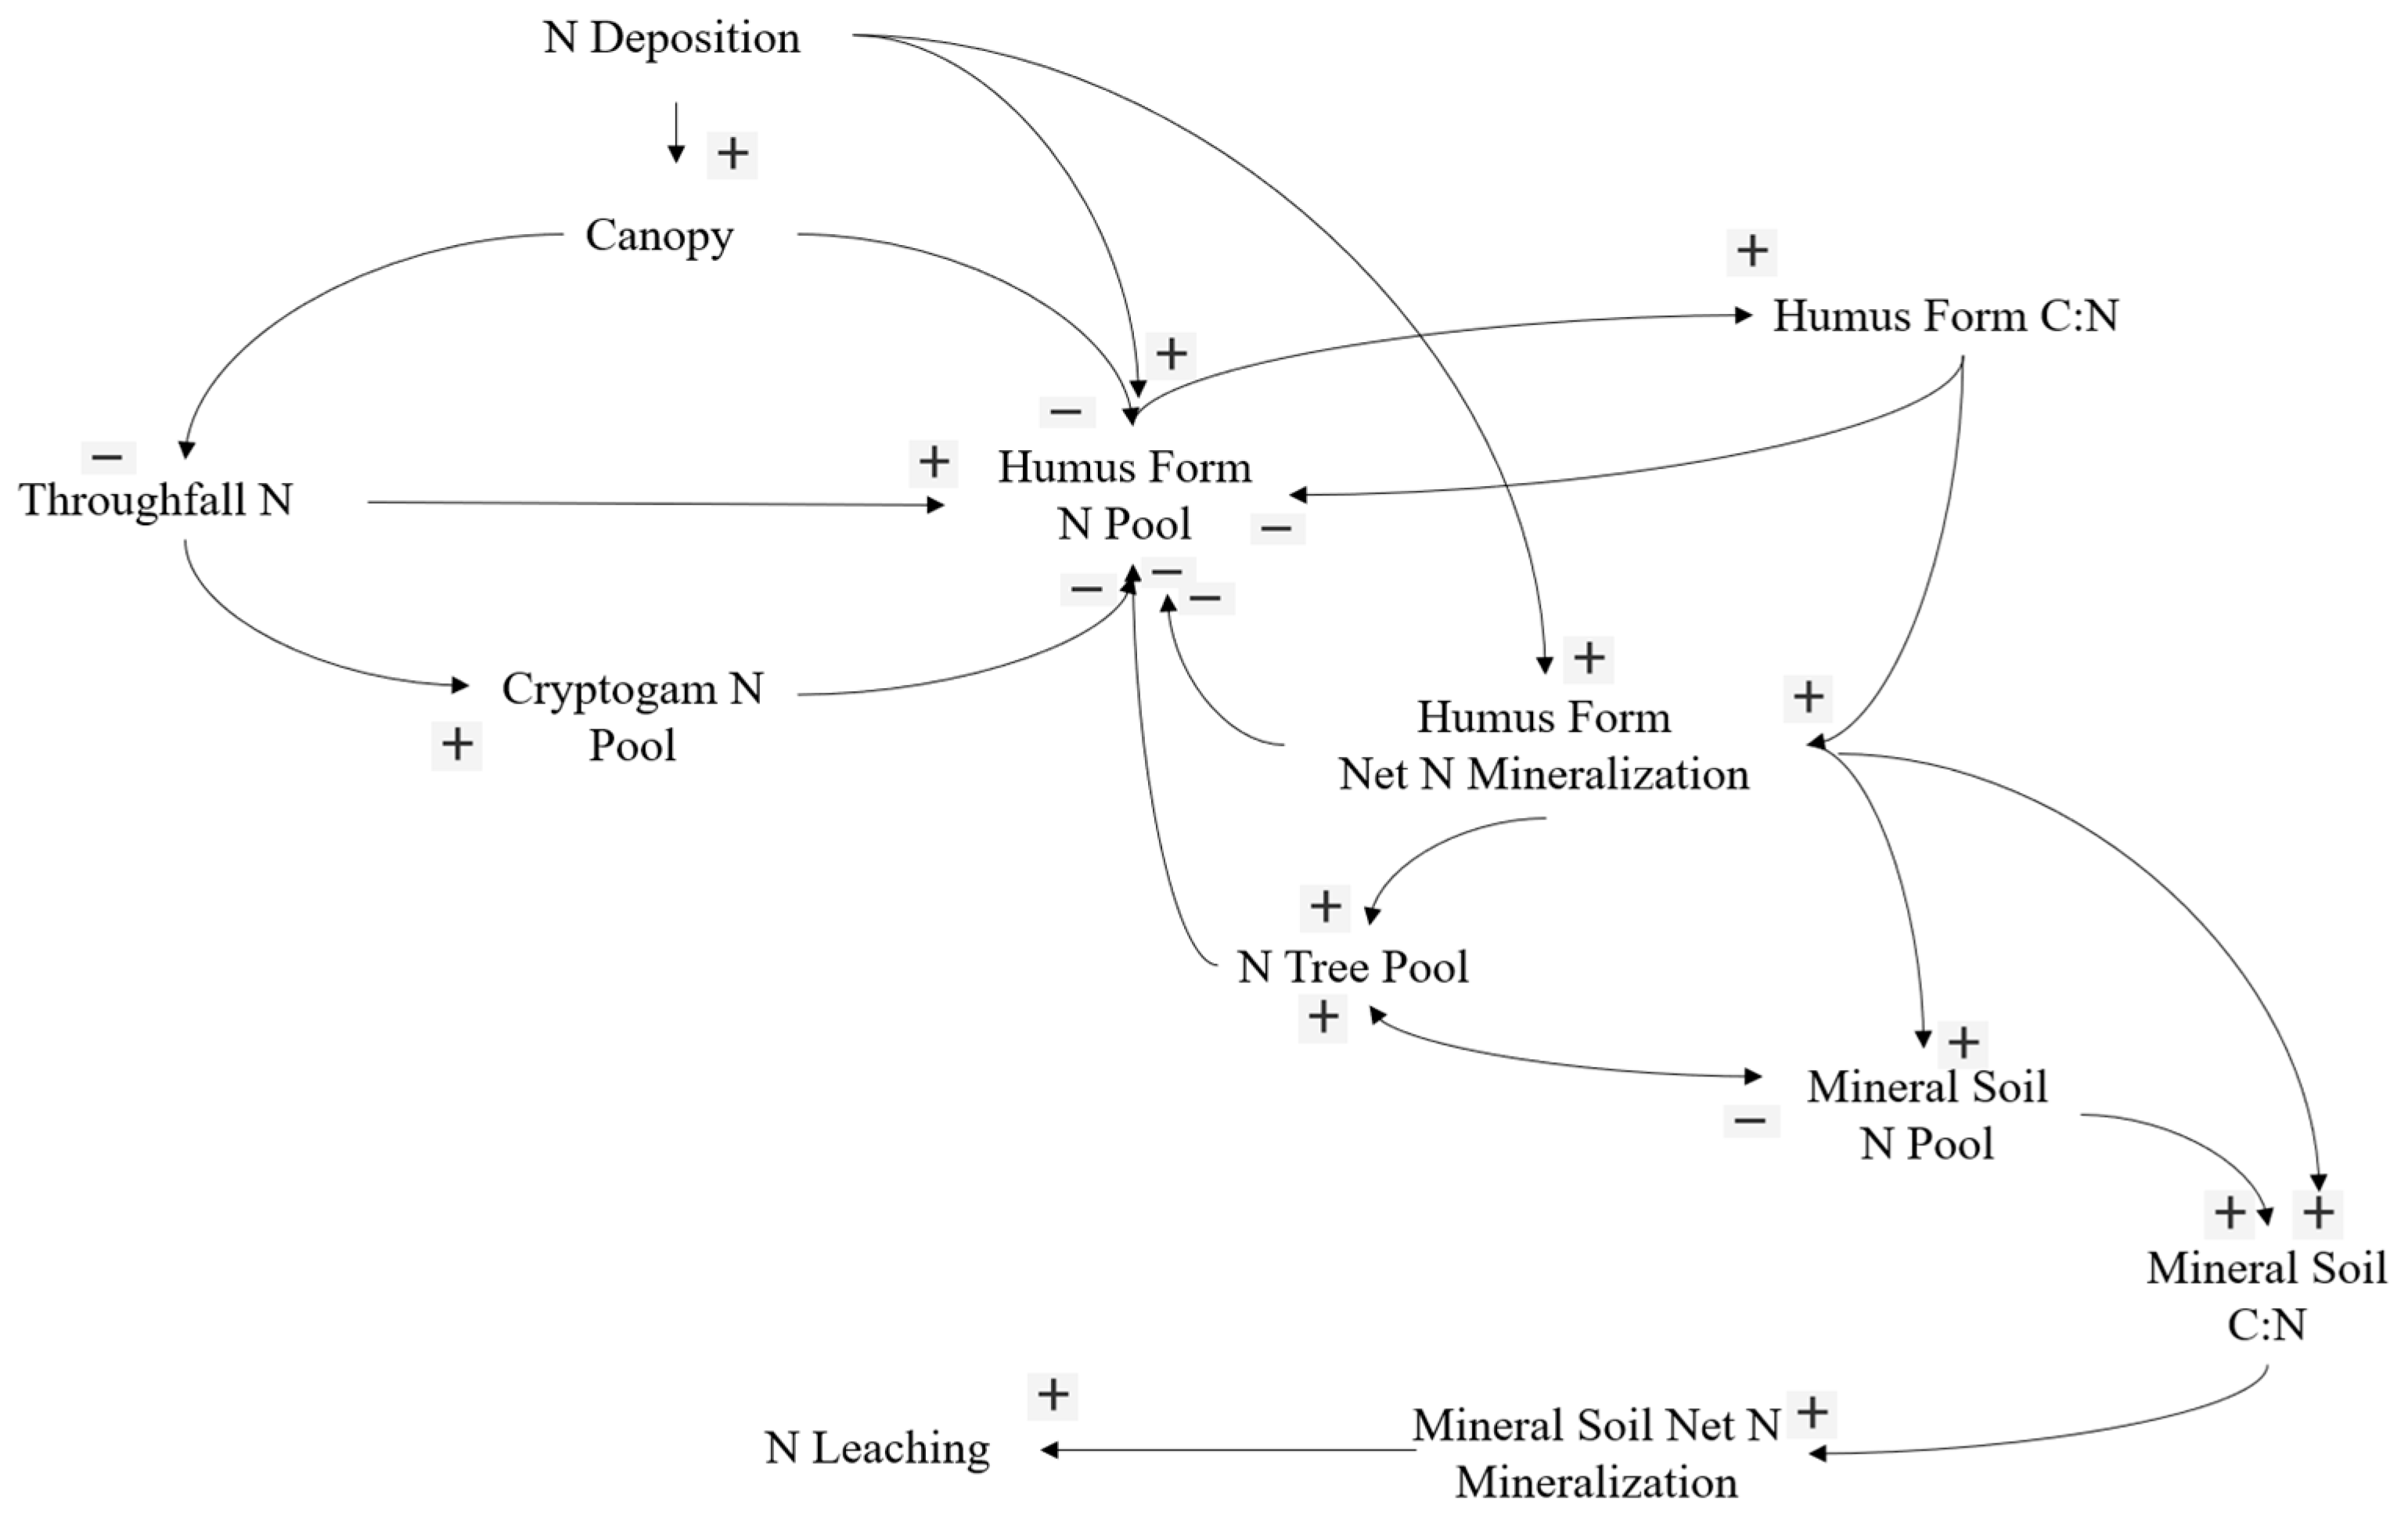
4.2. Conceptual Model of Nitrogen in Jack Pine Forests

Using the modeled responses, a conceptual framework of N saturation overtime can be developed for the jack pine forest. Strictly referencing the highest treatment, the forest may be divided among five discreet stages prior to N leaching. During the first stage, most of the wet N deposition simultaneously enters the tree canopy, the cryptogams, and the LFH layer. Stage two is initiated by virtual N saturation of the tree canopy but continues to enter both cryptogams and the LFH layer. After this virtual tree canopy saturation in stage two, it is predicted that, although the non-vascular cryptogams maintain a sorption capacity, N uptake will slow and, therefore, more incoming wet N deposition will directly enter the LFH layer. During stage four, N entering the LFH pool will drive the LFH C:N ratio toward 20, at which point enhanced N mineralization of this layer will begin. Within a theoretical kinetic uptake rate, it is predicted that jack pine trees will be able to access this mineralized N pool and prevent it from concentrating in the mineral soil for a short period of time. Finally, during stage five, N contributions from the forest floor to the mineral soil outpace demand by jack pine, which initiates a reduction in the mineral soil C:N ratio. Once the critical C:N ratio (20) of the mineral soil has been reached, N leaching below the major rooting zone begins. Despite this, jack pine foliar N% continues to increase (Figure 7).
Conceptually, all other treatments differ in their response to N when compared with the plot receiving 25 kg N ha−1 yr−1. Namely, direct canopy uptake in these treatments persists in substantially higher quantities over the modeled timeframe. As a result, stage 2 is omitted from the conceptual framework, which resulted in a much longer response time to saturation across treatments ≤ 20 kg N ha−1 yr−1. This is particularly notable for the 10 kg N ha−1 yr−1 treatment, which is not forecasted to reach saturation in the 50-year timeframe. Although we did not measure epiphytic lichen biomass at the high-exposure site, we noted their abundance was sparse. Therefore, despite a doubling of thalli N relative to the experimental site, we do not expect canopy retention (from this pool) to be higher.
This simple model has some limitations around decomposition in the organic horizon. McDonough et al. [8] and Lang et al. [46] highlight the important difference in decomposition rates between lichens and bryophytes. The complexity of this situation may shorten the time to N leaching. It is entirely possible that more N will be made available through faster lichen decomposition after approximately 10 years. Most of this additional N derived from lichen decomposition, however, could be re-immobilized within the humus in either the forest floor or the mineral soil [43]. Consequently, this simply reduces the capacity of the forest floor to remove N from throughfall, bypassing both the canopy and cryptogams. Again, if this is correct, it may suggest that the conceptual model underestimates the time it will take for the forest floor to saturate and subsequently increase mineral soil N pools and availability. We do, however, attempt to account for this by reporting changes in the timeframes of organic soil horizon saturation point by adjusting the sensitivity in the model. It suggests the model is robust within the 50-year period, particularly for the higher treatments, as it only changes modeled predictions of time by no more than 2 years at the high deposition loads. Moreover, the potential impact on mycorrhiza from elevated N deposition is a real possibility [47,48] and may have commenced in the highest treatment near the end of the study [19]. The effects on mycorrhiza with respect to N flux in soil are largely unknown, which presents uncertainties that have not been addressed in the modeling exercise due to empirical limitations, largely caused by the experimental timeframe. Future work in the region could flush out the impact on mycorrhiza and any cascading biogeochemical effect.
Regardless, this simple model supports the findings of others [25,27,40] that show forests receiving comparable N loads close to major bituminous sands operations have not yet leached N below the rooting zone. It is important to emphasize that, although the high-exposure site may have received elevated N deposition at comparable loads for around 10 to 15 years longer than the experimental forest (at the time of the study), deposition clearly fluctuated from year to year [25]. This itself may affect the time to saturation and, in the case of the high-exposure site, prolong the time to N leaching. These annual fluctuations could explain why N concentrations in jack pine foliage at the high-exposure site had not started to increase, which is also supported by the model for loads ≤ 20 kg N ha−1 yr−1. This may suggest that allowing N to increase to 2.3%, as we did in the model, is not entirely valid, and this increase may only occur in stands with considerable soil fertilization, which did not happen at the experimental sites despite some treatments receiving greater than 100 kg N ha−1 cumulatively. Overall, this could suggest that trees are outcompeted for surplus N.
The staged approach of the conceptual model is like the N saturation models proposed by Aber et al. [1] and Lovett and Goodale [9]. The simple model suggests that it is completely possible that N leaching below the major rooting zone could occur before terricolous lichens and jack pine foliage saturate. Although there appears to be a kinetic limitation with respect to annual N uptake by both terricolous lichens and jack pine foliage, they continue to accumulate N over the long term. In theory, this process directly supports the Lovett and Goodale [9] capacity and kinetic saturation model. On the other hand, the jack pine forest studied here, and possibly others in the region, seem to have an uncharacteristically high affinity for N retention [8], making them a particularly good fit for a staged saturation approach like the traditional Aber et al. [1] model. If the conceptual model proposed here is correct, this work, in combination with other research [9,10], highlights the importance of forest type when considering the impacts of N deposition.

4.3. High-Exposure vs. Experimental Site

Comparing and contrasting the high-exposure forest with the experimental site provides valuable insight regarding the effects of N deposition on jack pine forests in the region. Presumably, the high-exposure site had received elevated N deposition for a considerable period before experimentation began, and yet there were no significant differences among the experimental treatments and the forests close to major upgrading facilities. If the model was inaccurate, we would expect to see significantly higher jack pine foliar N and soil N concentrations at the high-exposure site, considering that the temporal exposure to N would have been much longer and the metrics used to assess saturation should have been present. The gradient study, coupled with the lack of significant differences among the treatments and the high-exposure site, suggests the predictions over a 50-year period, at least, are somewhat reasonable. The lack of monitoring data quantifying total N deposition in precipitation and throughfall, however, is problematic given the fluctuations of N deposition made evident by Fenn et al. [25]. Anecdotally, by 2015, it is quite possible that the high-exposure site had been exposed to N loads comparable with the experimental gradient. In which case, the conceptual model above does not fall short predicting forest response time to N leaching. If, however, this forest had been exposed for ~40+ years, the models would only hold true if annual deposition was around 10–15 kg N ha−1. Again, this is quite plausible given that N leaching had not been observed at the high-exposure site during the year 2013 [26] and plant and soil chemistry were very similar between the two sites [27]. Altogether, this reinforces the earlier notion that xeric jack pine forests have a remarkable ability to retain incoming N deposition when compared to other forests globally [5]. Interestingly, the age of both the experimental and high-exposure forests are at a point in time predisposed to fire [37]. If fires occur soon, they may reach temperatures that are hot enough to volatilize a substantial portion of the accumulated N pool [49]. In turn, a combination of the forest’s unique storage capacity and predisposition to fire could ultimately mitigate the detrimental effects of N [5]. From a broader management perspective, however, this is only a temporary fix, considering much of the N volatilized would most likely settle on ecosystem receptors elsewhere [50].
One notable difference between the two sites (high exposure vs. experimental) is the epiphytic lichen thalli N concentrations. In fact, the Evernia mesomorpha Nyl. concentrations reported by Watmough et al. [27] are among the highest identified when compared with other literature sources [51,52]. This is obviously related to N deposition, as dry deposition is likely much greater at the high-exposure site and occurs daily, which contrasts with N delivery at the experimental sites that occurred four times a year as a fine mist above the canopy via helicopter. To what extent this impacts tree N retention is difficult to assess at present. The other major difference is in ground vegetation cover, as the high-exposure site has a much greater herbaceous cover and sparser cryptogram layer. To date, this difference has not impacted N leaching, but a loss of the cryptogram layer would likely have an impact on the model predictions over time. The reason for the difference in plant communities is unknown but may be linked to the high inputs of base cations and phosphorus from dust, and possibly other contaminants [27], which were not considered in this simple model.

4.4. Critical Loads of N for Jack Pine Forests

Critical loads are used by land managers to protect the ecosystem how they deem fit and are defined as “a quantitative estimate of an exposure to one or more pollutants below which significant harmful effects on sensitive elements of the environment do not occur according to present knowledge” [53]. If N leaching below the rooting zone is used as an endpoint to establish a critical load, then 15 kg N ha−1 yr−1 seems like a reasonable recommendation based on the model projections herein over a 50-year period. While it could be argued that 20 kg N ha−1 yr−1 could be the critical load, this might overlook the possible lifetime of the forests before they burn, as well as the increases in foliar N with the decreases in soil C:N that were moving towards a saturation point. They most likely would have been reached if the model was extended beyond 50 years. For conservative purposes, this was not carried out; therefore, a critical load of 15 kg N ha−1 yr−1 should be protective of these jack pine forests in the region. While the effects of N deposition at 10 kg N ha−1 yr−1 could manifest at timeframes of > 100 years (outside the scope of this work), we feel it is unrealistic, as this most likely outstrips the lifetime of synthetic oil production in the region. Furthermore, and while at the higher end, this recommendation is slightly higher than the range proposed by Bobbink et al. [5] (5–10 kg N ha−1 yr−1) for boreal forests in Europe.

5. Conclusions

At the highest treatment (25 kg N ha−1 yr−1), N retention is predicted to persist for roughly 50 years before N leaching below the major rooting zone occurs. At ≤ 20 kg N ha−1 yr−1, N retention is predicted to be longer and occur after 50 years. The time delays between the onset of elevated N deposition and leaching are regulated by the lichen and moss layer on the forest floor and N uptake by tree roots once the critical C:N ratio (20) of the humus form is reached. While these projections differ from those of other forests in boreal or temperate regions of the world, the modeled values generally agree with measurements from jack pine forests that are exposed to elevated N deposition adjacent to major open pit operations for more than 10 years. Vegetation responses differ among the two sites and are most likely attributable to other factors rather than N deposition alone. The agreement between the modeled values, experimental, and gradient results shows that the model is effective in providing a temporal response time to saturation within the 50-year timeframe.

Supplementary Materials

The following supporting information can be downloaded at: https://www.mdpi.com/article/10.3390/f16071195/s1, Table S1: Sensitivity analysis showing estimated number of years until the litter, fibric, and humus layer (LFH) reach a critical soil C:N ratio from the time of onset of a corresponding atmospheric nitrogen deposition load above a jack pine forest canopy; Table S2: Sensitivity analysis showing estimated number of years until the mineral soil horizon reaches a critical soil C:N ratio from the time of onset of a corresponding atmospheric nitrogen deposition load above a jack pine forest canopy. Model assumes 1% of the nitrogen pool from the LFH horizon is mineralized; Table S3: Sensitivity analysis showing estimated number of years until the mineral soil horizon reaches a critical soil C:N ratio from the time of onset of a corresponding atmospheric nitrogen deposition load above a jack pine forest canopy. Model assumes 0.78% of the nitrogen pool from the LFH horizon is mineralized.

Author Contributions

Both A.M.M. and S.A.W. were responsible for the ideas in this work. Likewise, both authors contributed to the fieldwork and the writing. S.A.W. was awarded the grant that funded this work. All authors have read and agreed to the published version of the manuscript.

Funding

This work was funded by the Cumulative Environmental Management Association (CEMA) and the Natural Sciences and Engineering Research Council (NSERC). All grants were awarded to Shaun A. Watmough.

Data Availability Statement

Data will be made available by the authors upon reasonable request.

Acknowledgments

The authors would like to thank Adam Bird, Nicole Melong, Tyler Phillips, Neil Hillis, Scott Baker, Liana Orlovskaya, Katie Bigras, Ryan Cant, Collin Whitfield, Ina Kosevea, Daniela Pennycook, and anyone we may have missed.

Conflicts of Interest

The authors declare no financial conflicts of interest.

References

  1. Aber, J.; McDowell, W.; Nadelhoffer, K.; Magill, A.; Bernston, G.; Kamakea, M.; McNulty, S.; Currie, W.; Rustad, L.; Fernandez, I. Nitrogen saturation in temperate forest ecosystems: Hypotheses revisited. BioScience 1998, 48, 921–934. [Google Scholar] [CrossRef]
  2. Soons, M.B.; Hefting, M.M.; Dorland, E.; Lamers, L.P.M.; Versteeg, C.; Bobbink, R. Nitrogen effects on plant species richness in herbaceous communities are more widespread and stronger than those of phosphorus. Biol. Conserv. 2017, 212, 390–397. [Google Scholar] [CrossRef]
  3. Chandler, J.W.; Dale, J.E. Nitrogen deficiency and fertilization effects on needle growth and photosynthesis in Sitka spruce (Picea sitchensis). Tree Physiol. 1995, 15, 813–817. [Google Scholar] [CrossRef]
  4. Boussadia, O.; Steppe, K.; Zgallai, H.; Hadj, B.E.; Braham, M.; Lemeur, R.; Van Labeke, M.C. Effects of nitrogen deficiency on leaf photosynthesis, carbohydrate status and biomass production in two olive cultivars ‘Meski’ and ‘Koroneiki’. Sci. Hortic. 2010, 123, 336–342. [Google Scholar] [CrossRef]
  5. Bobbink, R.; Hicks, K.; Galloway, J.; Spranger, T.; Alkemade, R.; Ashmore, M.; Bustamante, M.; Cinderby, S.; Davidson, E.; Dentener, F.; et al. Global assessment of nitrogen deposition effects on terrestrial plant diversity: A synthesis. Ecol. Appl. 2010, 20, 30–59. [Google Scholar] [CrossRef] [PubMed]
  6. Schulte-Uebbing, L.; de Vries, W. Global-scale impacts of nitrogen deposition on tree carbon sequestration in tropical, temperate, and boreal forests: A meta-analysis. Glob. Change Biol. 2018, 24, e416–e431. [Google Scholar] [CrossRef] [PubMed]
  7. Nadelhoffer, K.J. The potential effects of nitrogen deposition on fine-root production in forest ecosystems. New Phytol. 2000, 147, 131–139. [Google Scholar] [CrossRef]
  8. McDonough, A.M.; Watmough, S.A.; Bird, A.W. Biogeochemcial responses to multiyear above-canopy applications of nitrogen at a jack pine (Pinus banksiana) forest in northern Alberta, Canada. Can. J. For. Res. 2023, 53, 1–13. [Google Scholar] [CrossRef]
  9. Lovett, G.M.; Goodale, C.L. A new conceptual model of nitrogen saturation based on experimental nitrogen addition to an oak forest. Ecosystems 2011, 14, 615–631. [Google Scholar] [CrossRef]
  10. Gaige, E.; Dail, D.B.; Hollinger, D.Y.; Davidson, E.A.; Gernandez, I.J.; Sievering, H.; White, A.; Halteman, W. Changes in canopy processes following whole-forest canopy nitrogen fertilization of a mature spruce-hemlock forest. Ecosystems 2007, 10, 1133–1147. [Google Scholar] [CrossRef]
  11. Cosby, B.J.; Ferrier, R.C.; Jenkins, A.; Wright, R.F. Modelling the effects of acid deposition: Refinements, adjustments and inclusion of nitrogen dynamics in the MAGIC model. Hydrol. Earth Syst. Sci. 2001, 5, 499–517. [Google Scholar] [CrossRef]
  12. Posch, M.; Reinds, G.J. A very simple dynamic soil acidification model for scenario analyses and target load calculations. Environ. Model. Softw. 2009, 24, 329–340. [Google Scholar] [CrossRef]
  13. Evens, C.D.; Caporn, S.J.M.; Carroll, J.A.; Pilkington, M.G.; Wilson, D.B.; Ray, N.; Cresswell, N. Modelling nitrogen saturation and carbon accumulation in heathland soils under elevated nitrogen deposition. Environ. Pollut. 2006, 143, 468–478. [Google Scholar] [CrossRef] [PubMed]
  14. de Vries, W.; Posch, M.; Kamari, J. Modeling Time Patterns of Forest Soil Acidification for Various Deposition Scenarios. In Regional Acidification Models; Kamari, J., Brakke, D.F., Jenkins, A., Norton, S.A., Wright, R.F., Eds.; Springer: Berlin/Heidelberg, Germany, 1989. [Google Scholar] [CrossRef]
  15. Chen, L.; Driscoll, C.T. A two-layer model to simulate variations in surface water chemistry draining a northern forest watershed. Water Resour. Res. 2005, 41, W09425. [Google Scholar] [CrossRef]
  16. Belyazid, S. Dynamic Modelling of Biogeochemical Processes in Forest Ecosystems. Ph.D. Thesis, Department of Chemical Engineering, Lund University, Lund, Sweden, 2006. [Google Scholar]
  17. Le Roux, X.; Schmid, B.; Poly, F.; Barnard, R.L.; Niklaus, P.A.; Guillaumaud, N.; Habekost, M.; Oelmann, Y.; Pilippot, L.; Salles, J.F.; et al. Soil environmental conditions and microbial build-up mediate the effects of plant diversity on soil nitrifying and denitrifying enzyme activities in temperate grasslands. PLoS ONE 2013, 8, e61069. [Google Scholar] [CrossRef] [PubMed]
  18. Hawkes, C.V.; Wren, I.F.; Herman, D.J.; Firestone, M.K. Plant invasion alters nitrogen cycling by modifying the soil nitrifying community. Ecol. Lett. 2005, 8, 976–985. [Google Scholar] [CrossRef] [PubMed]
  19. Bird, A.; Watmough, S.A.; Carson, M.A.; Basiliko, N.; McDonough, A.M. Nitrogen retention of terricolous lichens in a northern Alberta jack pine forest. Ecosystems 2019, 22, 1308–1324. [Google Scholar] [CrossRef]
  20. Ste-Marie, C.; Pare, D. Soil, pH and N availability effects on net nitrification in the forest floor of a range of boreal forest stands. Soil Biol. Biochem. 1999, 31, 1579–1589. [Google Scholar] [CrossRef]
  21. McDonough, A.M.; Watmough, S.A. Interactive effects of precipitation and above canopynitrogen deposition on understorey plants in a jack pine (Pinus banksiana) forest in northern Alberta, Canada. Sci. Total Environ. 2023, 855, 158706. [Google Scholar] [CrossRef] [PubMed]
  22. Crowley, K.F.; Lovett, G.M. Effects of nitrogen deposition on nitrate leaching from forests of the northeastern United States will change with tree species composition. Can. J. For. Res. 2017, 47, 997–1009. [Google Scholar] [CrossRef]
  23. MacDonald, J.A.; Dise, N.B.; Matzner, E.; Armbruster, M.; Gundersen, P.; Forsius, M. Nitrogen input together with ecosystem nitrogen enrichment predict nitrate leaching from European Forests. Glob. Change Biol. 2002, 8, 1028–1033. [Google Scholar] [CrossRef]
  24. Gundersen, P.; Emmet, B.A.; Kjonaas, O.J.; Koopsman, C.J.; Tietema, A. Impact of nitrogen deposition on nitrogen cycling in a forest: A synthesis of NITREX data. For. Ecol. Manag. 1998, 101, 37–56. [Google Scholar] [CrossRef]
  25. Fenn, M.E.; Bytnerowicz, A.; Schilling, S.L.; Ross, C.S. Atmospheric deposition of nitrogen, sulphur and base cations in jack pine stands in the Athabasca Oil Sands Region, Alberta, Canada. Environ. Pollut. 2015, 196, 497–510. [Google Scholar] [CrossRef] [PubMed]
  26. Watmough, S.A.; Koseva, I.; Landre, A. A comparison of tension and zero-tension lysimeter and PRSTM probes for measuring soil water chemistry in sandy boreal soils in the Athabasca Oil Sands Region, Canada. Water Air Soil Pollut. 2013, 224, 1663–1672. [Google Scholar] [CrossRef]
  27. Watmough, S.A.; Bird, A.; McDonough, A.M.; Grimm, E. Forest fertilization associated with oil sands emissions. Ecosystems 2019, 22, 1–14. [Google Scholar] [CrossRef]
  28. Proemse, B.; Mayer, B.; Fenn, M.E.; Ross, C.S. A multi-isotope approach for estimating industrial contributions to atmospheric nitrogen deposition in the Athabasca oil sands region in Alberta, Canada. Environ. Pollut. 2013, 182, 80–91. [Google Scholar] [CrossRef] [PubMed]
  29. Melong, N. Early Responses of Understorey Vegetation After One Year of Above Canopy Nitrogen Additions in a Jack Pine Stand in Northern Alberta. Master’s Thesis, Trent University, Peterborough, ON, Canada, 2014; 135p. [Google Scholar]
  30. Harmens, H.; Norris, D.A.; Cooper, D.M.; Mills, G.; Steinnes, E.; Kubin, E.; Thoni, L.; Aboal, J.R.; Alber, R.; Carballeira, A.; et al. Nitrogen concentrations in mosses indicate the spatial distribution of atmospheric nitrogen deposition in Europe. Environ. Pollut. 2011, 159, 2852–2860. [Google Scholar] [CrossRef] [PubMed]
  31. Osler, G.H.R.; Sommerkorn, M. Toward a complete soil C and N cycle: Incorporating the soil fauna. Ecology 2007, 88, 1611–1621. [Google Scholar] [CrossRef] [PubMed]
  32. Manzoni, S.; Jackson, R.B.; Trofymow, J.A.; Porporato, A. The global stoichiometry of litter nitrogen mineralization. Science 2008, 321, 684–686. [Google Scholar] [CrossRef] [PubMed]
  33. Aitkenhead, J.A.; McDowell, W.H. Soil C:N ratio as a predictor of annual riverine DOC flux at local and global scales. Glob. Biogeochem. Cycles 2000, 14, 127–138. [Google Scholar] [CrossRef]
  34. Weetman, G.F.; Fournier, R.M. Ten-year growth and nutrition effects of straw treatment and of repeated fertilization on jack pine. Can. J. For. Res. 1984, 14, 416–423. [Google Scholar] [CrossRef]
  35. Prescott, C.E.; Kishchuk, B.E.; Weetman, G.F. Long-term effects of repeated N fertilization and straw application in a jack pine forest. 3. Nitrogen availability in the forest floor. Can. J. For. Res. 1995, 25, 1991–1996. [Google Scholar] [CrossRef]
  36. Weetman, G.F.; Dallaire, L.C.; Fournier, R. Long-term effects of repeated N fertilization and straw application in a jack pine forest. 1. Twenty-two-year growth response. Can. J. For. Res. 1995, 25, 1978–1983. [Google Scholar] [CrossRef]
  37. Burns, R.M.; Honkala, B.H. Silvics of North America. 1990. Available online: https://www.srs.fs.usda.gov/pubs/misc/ag_654/volume_1/pinus/banksiana.htm (accessed on 1 July 2016).
  38. Lambert, M.-C.; Ung, C.-H.; Raulier, F. Canadian national tree aboveground biomass equations. Can. J. For. Res. 2005, 35, 1996–2018. [Google Scholar] [CrossRef]
  39. R Core Team. R: A Language and Environment for Statistical Computing; R Foundation for Statistical Computing: Vienna, Austria, 2025; Available online: https://www.R-project.org/ (accessed on 1 May 2020).
  40. Laxton, D.L.; Watmough, S.A.; Aherne, J.; Straker, J. An assessment of nitrogen saturation in Pinus banksiana plots in the Athabasca Oil Sands Region, Alberta. J. Limnol. 2010, 69, 171. [Google Scholar] [CrossRef]
  41. Horb, E.C.; Wentworth, G.R.; Maker, P.A.; Liggio, J.; Hayden, K.; Boutzis, E.I.; Beausoleil, D.L.; Hazewinkel, R.O.; Mahaffey, A.C.; Sayanda, D.; et al. A decadal synthesis of atmospheric emissions, ambient air quality, and deposition in the oil sands region. Integr. Environ. Assess. Manag. 2021, 18, 333–360. [Google Scholar] [CrossRef] [PubMed]
  42. Wieder, R.K.; Vitt, D.H.; Burke-Scoll, M.; Scott, K.D.; House, M.; Vile, M.A. Nitrogen and sulphur deposition and the growth of Sphagnum fuscum in bogs of the Athabasca Oil Sands Region, Alberta. J. Limnol. 2010, 69, 161–170. [Google Scholar] [CrossRef]
  43. Berg, B.; Matzner, E. Effect of N deposition on decomposition of pant litter and soil organic matter in forest ecosystems. Environ. Rev. 1997, 5, 1–25. [Google Scholar] [CrossRef]
  44. Santaniello, F.; Djupstrom, L.B.; Ranius, T.; Weslien, J.; Rudolphi, J.; Thor, G. Large portion of wood dependent lichens in boreal pine forest are confined to old hard wood. Biodivers. Conserv. 2017, 26, 1295–1310. [Google Scholar] [CrossRef]
  45. Boudreault, C.; Drapeau, P.; Bouchard, M.; St-Laurent, M.-H.; Imbeau, L.; Bergeron, Y. Contrasting responses of epiphytic and terricolous lichens to variations in forest characteristics in northern boreal ecosystems. Can. J. For. Res. 2015, 45, 595–606. [Google Scholar] [CrossRef]
  46. Lang, S.I.; Cornelissen, J.H.C.; Klahn, T.; Logtestijn, R.S.P.; Broekman, R.; Schweikert, W.; Aerts, R. An experimental comparison of chemical traits and litter decomposition rates in a diverse range of subarctic bryophyte, lichen and vascular plant species. J. Ecol. 2009, 87, 886–900. [Google Scholar] [CrossRef]
  47. van Diepen, L.T.A.; Lilleskov, E.A.; Pregitzer, K.S.; Miller, R.M. Decline of arbuscular mycorrhiza fungi in northern hardwood forests exposed to chronic nitrogen additions. New Phytol. 2007, 176, 175–183. [Google Scholar] [CrossRef] [PubMed]
  48. Treseder, K.K. A meta-analysis of mycorrhizal responses to nitrogen, phosphorus, and atmospheric CO2 in field studies. New Phytol. 2004, 164, 347–355. [Google Scholar] [CrossRef] [PubMed]
  49. Caldwell, T.G.; Johnson, D.W.; Miller, W.W.; Qualls, R.G. Forest floor carbon and nitrogen losses due to prescription fire. Soil Sci. Soc. Am. J. 2002, 66, 262–267. [Google Scholar] [CrossRef]
  50. DeBell, D.S.; Ralston, C.W. Release of nitrogen by burning light forest fuels. Soil Sci. Soc. Am. J. 1970, 34, 936–938. [Google Scholar] [CrossRef]
  51. Wieder, R.K.; Vile, M.A.; Scott, K.D.; Albright, C.M.; McMillen, K.J.; Vitt, D.H.; Fenn, M.E. Differential effects of high atmospheric N and S deposition on bog and plant/lichen tissue and porewater chemistry across the Athabasca Oil Sands Region. Environ. Sci. Technol. 2016, 50, 12630–12640. [Google Scholar] [CrossRef] [PubMed]
  52. Cleavitt, N.L.; Hinds, J.W.; Poirot, R.L.; Geiser, L.H.; Dibble, A.; Leon, B.; Perron, R.; Pardo, L.H. Epiphytic macrolichen communities correspond to patterns of sulfur and nitrogen deposition in the northeastern United States. Bryol. 2015, 118, 304–324. [Google Scholar] [CrossRef]
  53. Nilsson, J.; Grennfelt, P. Critical Loads for Sulphur and Nitrogen; Nordic Council of Ministers: Copenhagen, Denmark, 1988; Report No. 1988; p. 15. [Google Scholar]
Figure 1. Bituminous sands area showing the high-exposure site (square) relative to the experimental site (triangle). Figures produced using Google Earth Software Version 7.3.6.
Forests 16 01195 g001
Figure 2. A simple model causal loop diagram used to determine the time at which N leaching will occur below the major rooting zone. Plus (+) and minus (−) refer to increases and decreases, respectively, of the nitrogen pool or process that may be affected by N addition.
Forests 16 01195 g002
Figure 3. Conceptual model showing the predicted storage capacity of N by cryptogams across all treatments 25 years after t0, including 0 (black dashed line; overlaps with x-axis), 5 (green dashed line with two dots), 10 (orange dotted line), 15 (blue long dashed line), 20 (yellow dashed line with single dot), and 25 (red dashed line) kg N ha−1 yr−1 treatments.
Forests 16 01195 g003
Figure 4. Modeled forest floor C:N ratio over time for 0 (black dashed upper horizontal line), 5 (green dashed line with two dots), 10 (orange dotted line), 15 (blue long dashed line), 20 (yellow dashed line with single dot), and 25 (red dashed line) kg N ha−1 yr−1 treatments. The upper and lower dashed horizontal purple lines represent the critical forest floor C:N ratio of 20 and 10, respectively.
Forests 16 01195 g004
Figure 5. Modeled foliar N% over time for jack pine at the various deposition loads, including 0 (black dashed horizontal line; overlaps with green line), 5 (green dashed line with two dots; overlaps with black lines), 10 (orange dotted line), 15 (blue long dashed line), 20 (yellow dashed line with single dot), and 25 (red dashed line) kg N ha−1 yr−1 treatments. The upper horizontal purple dashed line represents a possible saturation point identified by empirical data.
Forests 16 01195 g005
Figure 6. Modeled mineral soil C:N ratios for the various deposition loads, including 0 (black dashed horizontal line; overlaps with other lines), 5 (green dashed line with two dots; overlaps with other lines), 10 (orange dotted line; overlaps with other lines), 15 (blue long dashed line; overlaps with other lines), 20 (yellow dashed line with single dot; overlaps with other lines), and 25 (red dashed line) kg N ha−1 yr−1 at 1% mineralization and 25 (red dashed line with one dot) kg N ha−1 yr−1 treatments. The upper and lower horizontal purple dashed lines represent the critical C:N ratios, 20 and 10.
Forests 16 01195 g006
Figure 7. Conceptual model of N saturation in a jack pine forest with annual deposition of 25 kg N ha−1 in the bituminous sands region of northern Alberta, Canada. Stage 1: N enters canopy, cryptogams, and the forest floor; stage 2: canopy saturation; stage 3: cryptogam assimilation slows and relatively more N enters the forest floor; stage 4: forest floor C:N reaches 20 and initiates mineralization, which transfers N to both trees and mineral soil; stage 5: while trees maintain their capacity to accumulate N, the mineral soil C:N ratio reaches 20 and N leaching below the rooting zone begins. Hashed yellow and red lines imply pools have either reached maximum capacity or have saturated, respectively.
Forests 16 01195 g007
Table 1. Empirical first order decay coefficients used for modeling nitrogen in non-vascular and jack pine derived empirically or from modeled data. Ct is the final N concentration or, in the case of jack pine, the final bole diameter (cm); k is the rate constant; and C0 is the initial N concentration or, in the case of jack pine, the initial bole diameter (cm).
SpeciesTreatment (kg ha−1 yr−1)CtkC0
Cladonia mitis Sandst.00.390.000.42
50.420.010.38
100.610.100.39
150.810.110.38
200.870.130.37
251.060.170.39
Cladonia stellaris Opiz. 00.410.000.46
50.500.020.39
100.690.070.41
150.680.070.4
200.840.110.42
250.950.130.43
Pluerozium schreberi00.820.020.73
(Brid.) Mitt.50.810.030.68
100.970.070.68
151.230.140.68
201.320.160.67
251.390.180.67
Pinus banksiana Lamb.00.890.000.89
52.300.020.89
102.300.030.89
152.300.040.89
202.300.050.89
252.300.090.89
Jack Pine Bole Diameter (cm)All200.020.20
Table 2. Chemical differences for various environmental media between high exposure < 3 km from major industrial activities and the 25 kg N ha−1 yr−1 treatment in the experimental forest. High-exposure site deposition data were obtained from [25] and soil data from Watmough et al. [26]. Understory vascular plant and tree data were collected by the author during 2012. All high-exposure site data were collected in the year 2012, while the experimental data are from 2015. Values in parentheses represent standard deviation.
ParameterHigh-Exposure Site25 kg N ha−1 yr−1 15 kg N ha−1 yr−1Control
Throughfall (kg N ha−1 yr−1)12–2625152.5
Vegetation N%
Jack Pine Needles (Growth Year 1)1.0 (±0.1)1.0 (±0.1)1.0 (±0.1)1.0 (±0.2)
Jack Pine Growth Needles (Year 2)1.17 (±0.1)1.0 (±0.1)1.0 (±0.1)0.9 (±0.2)
Jack Pine Growth Needles (Year 3)1.0 (±0.1)0.9 (±0.1)0.8 (±0.1)0.8 (±0.0)
Arctostaphylos uva-ursi L. 1.0 (±0.1)0.7 (±0.1)0.8 (±0.1)0.8 (±0.1)
Vaccinium vitis-idaea L. 1.0 (±0.1)1.0 (±0.1)1.1 (±0.0)0.9 (±0.0)
Vaccinium myrtilloides Michx. 1.6 (±0.1)1.9 (±0.1)1.8 (±0.1)1.9 (±0.1)
Evernia mesomorpha Nyl.2.1 (±0.1)1.2 (±0.0)1.2 (±0.1)0.9 (±0.1)
Hypogymnia physodes L. 2.1 (±0.1)0.9 (±0.2)1.1 (±0.1)0.8 (±0.1)
Cladonia mitis Sandst0.7 (±0.2)1.1 (±0.1)0.8 (±0.0)0.4 (±0.0)
Cladonia stellaris Opiz. 0.6 (±0.1)1.0 (±0.1)0.7 (±0.1)0.4 (±0.1)
Pleurozium schreberi (Brid.) Mitt0.9 (±0.24)1.4 (±0.3)1.2 (±0.1)0.8 (±0.1)
Soil
LFH N% 0.8 (±0.2)0.6 (±0.1)0.8 (±0.2)0.6 (±0.1)
LFH C:N34.6 (±7.01)32.7 (±3.1)37.3 (±2.5)41.7 (±5.6)
Ae N%0.1 (±0.0)0.03 (±0.02)0.04 (±0.01)0.02 (±0.01)
Ae C:N38.4 (±6.2)38.0 (±7.8)35.3 (±14)41.5 (±12.2)
NO3 Leaching (kg N ha−1)<1 <1<1<1
Table 3. Comparisons of vascular plant cover among the high exposure, 25 kg N ha−1 yr−1, and control plots. High exposure cover data were collected during 2012, while experimental plant data were collected during 2015. Values in parenthesis show standard deviation.
ParameterHigh-Exposure Site25 kg N ha−1 yr−1 15 kg N ha−1 yr−1Control
Vascular Ground Vegetation (% Cover)
Amelanchier alnifolia Nutt.1.5 (±1.9)0.03 (±0.13)0.02 (±0.09)0.02 (±0.1)
Arctostaphylos uva-ursi L.33.7 (±22)4 (±6)4.5 (±7)5.8 (±6.9)
Galium boreale L.0.25 (±0.40)0 (±0)0 (±0)0 (±0)
Geocaulon lividum Rich.1.2 (±1)0 (±0)0 (±0)0 (±0)
Maianthemum canadense Desf.10.4 (±8.57)0.36 (±1.14)0.21 (±0.6)0.34 (±2.1)
Melampyrum lineare Desr.2.3 (±1.5)0.03 (±0.02) 0 (±0)0 (±0)
Oryzopsis asperifolia Michx.10.2 (±11.6)0.02 (±0.1)0 (±0)0.03 (±0.1)
Solidago simplex Kunth. 0.67 (±1.6)0 (±0)0 (±0)0 (±0)
Vaccinium myrtilloides Michx.3.5 (±2.7)5.2 (±4.6)3.4 (±3.8)2.6 (±2.1)
Vaccinium vitis-idaea L.1.71 (±1.1)0.4 (±1)0.2 (±0.3)2.8 (±2.7)
Total Cover53 (±52.8)10 (±1)8.3 (±7.4)13.9 (±14)
Mean Species Richness8 (±1)3 (±1)2 (±1)4 (±1)
Disclaimer/Publisher’s Note: The statements, opinions and data contained in all publications are solely those of the individual author(s) and contributor(s) and not of MDPI and/or the editor(s). MDPI and/or the editor(s) disclaim responsibility for any injury to people or property resulting from any ideas, methods, instructions or products referred to in the content.

