Article

Canopy Cover Drives Odonata Diversity and Conservation Prioritization in the Protected Wetland Complex of Thermaikos Gulf (Greece)

by
Dimitris Kaltsas
1,
Lydia Alvanou
2,
Ioannis Ekklisiarchos
3,
Dimitrios I. Raptis
4 and
Dimitrios N. Avtzis
5,*
1
Independent Researcher, 38221 Volos, Greece
2
N.E.C.C.A, Management Unit of Protected Areas of Central Macedonia, 57300 Halastra, Greece
3
Natural History Museum of Crete, University of Crete, 71409 Heraklion, Greece
4
Renewable Natural Resource Management and Bioeconomy Laboratory, Department of Forest and Natural Environment Sciences, Democritus University of Thrace, 66100 Drama, Greece
5
Forest Research Institute, Hellenic Agricultural Organization “Dimitra”, 57006 Vassilika, Greece
*
Author to whom correspondence should be addressed.
Forests 2025, 16(7), 1181; https://doi.org/10.3390/f16071181
Submission received: 16 June 2025 / Revised: 13 July 2025 / Accepted: 16 July 2025 / Published: 17 July 2025
(This article belongs to the Section Forest Biodiversity)

Abstract

Odonata constitute an important invertebrate group that is strongly dependent on water conditions and sensitive to habitat disturbances, rendering them reliable indicators of habitat quality of both aquatic and terrestrial habitats. We studied the compositional and diversity patterns of Odonates in total, and separately for the two suborders (Zygoptera, Anisoptera) in relation to geographic and ecological parameters at the riparian zone of four rivers and one canal within the Axios Delta National Park and the Natura 2000 SAC GR1220002 in northern Greece, using the line transect technique. In total, 6252 individuals belonging to 28 species were identified. The compositional and diversity patterns were significantly different between agricultural and natural sites. Odonata assemblages at croplands were comparatively poorer, dominated by a few, widely distributed, taxonomically proximal species, tolerant to environmental changes, as a result of modifications and consequent alterations of abiotic conditions at croplands, which also led to higher local contribution to β-diversity and species turnover. The absence of several percher, endophytic, and threatened species from agricultural sites led to significantly lower diversity, as a result of environmental filtering due to ecophysiological restrictions. Taxonomic and functional diversity, uniqueness, and Dragonfly Biotic Index (DBI) were significantly higher in riparian forests, due to the sensitivity of damselflies to dehydration, and the avoidance of habitat loss and extreme temperatures by dragonflies, which prefer natural shelters near the ecotone. The newly introduced Conservation Value Index (CVI) revealed 21 conservation hotspots of Odonata (14 at canopy cover sites), widely distributed within the borders of NATURA 2000 SAC GR1220002.

1. Introduction

Freshwater ecosystems (lakes, rivers, streams, ponds, and reservoirs) are biodiversity hotspots as they cover less than 1% of the Earth’s surface and host approximately 10% of all animal species [1,2]. However, the human need for water has risen abruptly over the past century [3,4]. As a result of overexploitation, water pollution, flow modification, and habitat degradation, inland waters are the most threatened environments on Earth [3,5] and the consistently high degradation risk may lead to a shift in the dynamics of communities [6], and ultimately to biodiversity loss of up to five times higher than in terrestrial ecosystems [3,7,8]. Due to these pressures and global climate change, the Mediterranean is one of the most vulnerable regions worldwide [5]. The increasing demand for irrigation and drinking water has led to extensive droughts in the region in recent years [9], and even previously perennial rivers have become intermittent [10].
In Europe, approximately two-thirds of the wetlands have been destroyed in the past century [11] as a result of land use, urbanization, and pollution [12]. The Council Directive 92/43/EEC of the European Union on the conservation of natural habitats and wild flora and fauna under the ecological network NATURA 2000 was launched in May 1992, and the Special Areas of Conservation (SAC) cover about 20% of the area of European Union countries. Especially in Greece, 55 of the total 265 SACs (20.75%) include wetlands, corresponding to 0.65% of the total area of SACs in the country. Overall, 17.24% of the Greek wetlands are considered sensitive to desertification, and 2.9% are at critical desertification risk [12].
Anthropogenic disturbance leads to a decrease in environmental heterogeneity, which affects aquatic communities [13]. Thus, the most effective methods of evaluating areas of conservation priority are the use of bioindicators and the comparison of diversity patterns and the composition of communities [14,15,16]. Insects contribute to several different types of ecosystem services in aquatic ecosystems, especially in relation to energy transfer and the cycling of organic matter [17]. Aquatic and semiaquatic insects are known to respond to intensive land use through lower taxonomic and functional diversity and the dominance of opportunistic generalist taxa, which share similar traits in areas under disturbance [18,19].
Odonata is one of the most typical insect groups of freshwater ecosystems and certainly the best studied aquatic macroinvertebrate group in terms of taxonomy, ecology, and behavior [20,21]. They are diurnal amphibiotic predators; they fly conspicuously and can be easily detected and identified taxonomically in the field [22]. The suborder Zygoptera (damselflies) includes territorial species that are dependent on humidity and temperature for oviposition sites [23]. Environmental alterations in the aquatic or terrestrial habitats may lead to the local extinction of Zygoptera species [24]. The suborder Anisoptera (dragonflies) includes mainly generalist dwellers with high dispersal capacity, and generally more tolerant species to environmental changes [25,26]. Odonata is currently the only insect order with the threat status of all species assessed on a global scale [27]. All 142 Odonata species with resident breeding populations in Europe have been assessed on a continental level for the International Union for Conservation of Nature (IUCN) Red List, and 29 of them are currently threatened (Critically Endangered, Endangered, or Vulnerable) [28]. Of these, 13 are present in Greece and 4 are Greek endemics. All 79 Odonata species present in Greece were recently assessed at the national level, 13 of which are considered threatened today [29].
Dragonflies and damselflies are often used in applied and conservation ecology as indicators of the integrity of freshwater ecosystems and habitat quality (e.g., [30,31,32]), especially because different species vary significantly in terms of their ecological requirements [33,34]. Thus, Odonata are excellent bioindicators of modifications in the aquatic and the terrestrial environment near freshwater bodies [31,35], due to the dependence of larvae and adult individuals on water conditions [24] and their sensitivity to environmental changes (e.g., [24,31,36,37,38]) in terms of reproduction of adults, availability of oviposition sites, and development of larvae [39].
A thorough analytical approach of taxonomic and functional diversity is essential for the understanding of biodiversity patterns and especially the influence of environmental parameters on habitat requirements and resource use [40] in relation to the taxonomic affinity (e.g., taxonomic distinctness), rarity, as well as the life-history traits of species within each assemblage. Odonata are ideal for studying the variation in the functional trait space along different habitats and particularly in relation to anthropogenic environmental change [41] because even congeneric species exhibit a variety of morphological, biogeographic, and/or ecological trait values/categories. Moreover, the partitioning of β-diversity into turnover (species replacement between assemblages) and nestedness (species gain or loss between assemblages) is a useful tool to understand the patterns that affect the composition of Odonate assemblages [42]. The total β-diversity can also be divided into local contribution to β-diversity (LCBD) and species contribution to β-diversity (SCBD), potentially revealing sites (high LCBD) and species (high SCBD) with a greater impact on β-diversity [43].
Our study was conducted in the wetland complex of Thermaikos Gulf in Greece, within the Mediterranean basin global biodiversity hotspot. The area is protected under the Habitats Directive of the European Union. The objective of this study was to investigate the distributional and diversity patterns of Odonata across different habitat types and land uses, find potential indicator species, and ultimately unveil conservation hotspots at the riparian zones of four rivers and a canal. We tested the following hypotheses: (1) the species composition of Odonata assemblages does not differ along habitat types and levels of land use due to the wide distribution of generalist species and the potential contraction of range of specialist species in permanent running waters and their vulnerability to climate change [44] especially in recent years; (2) taxonomic and functional diversity of Odonata is lower in areas under intensive land use; (3) Odonate assemblages at closed canopy habitats are poorer and less diverse than those at other land cover types due to the lower amount of polarized light as a visual cue used by Odonata to detect oviposition sites [45] and available sunlight for thermoregulation [33]; (4) (i) based on hypothesis 1, β-diversity is mainly caused by the nestedness rather than the turnover element, (ii) assemblages with high LCBD include few, widely distributed species in the study area which exhibit the highest SCBD values [16].

2. Materials and Methods
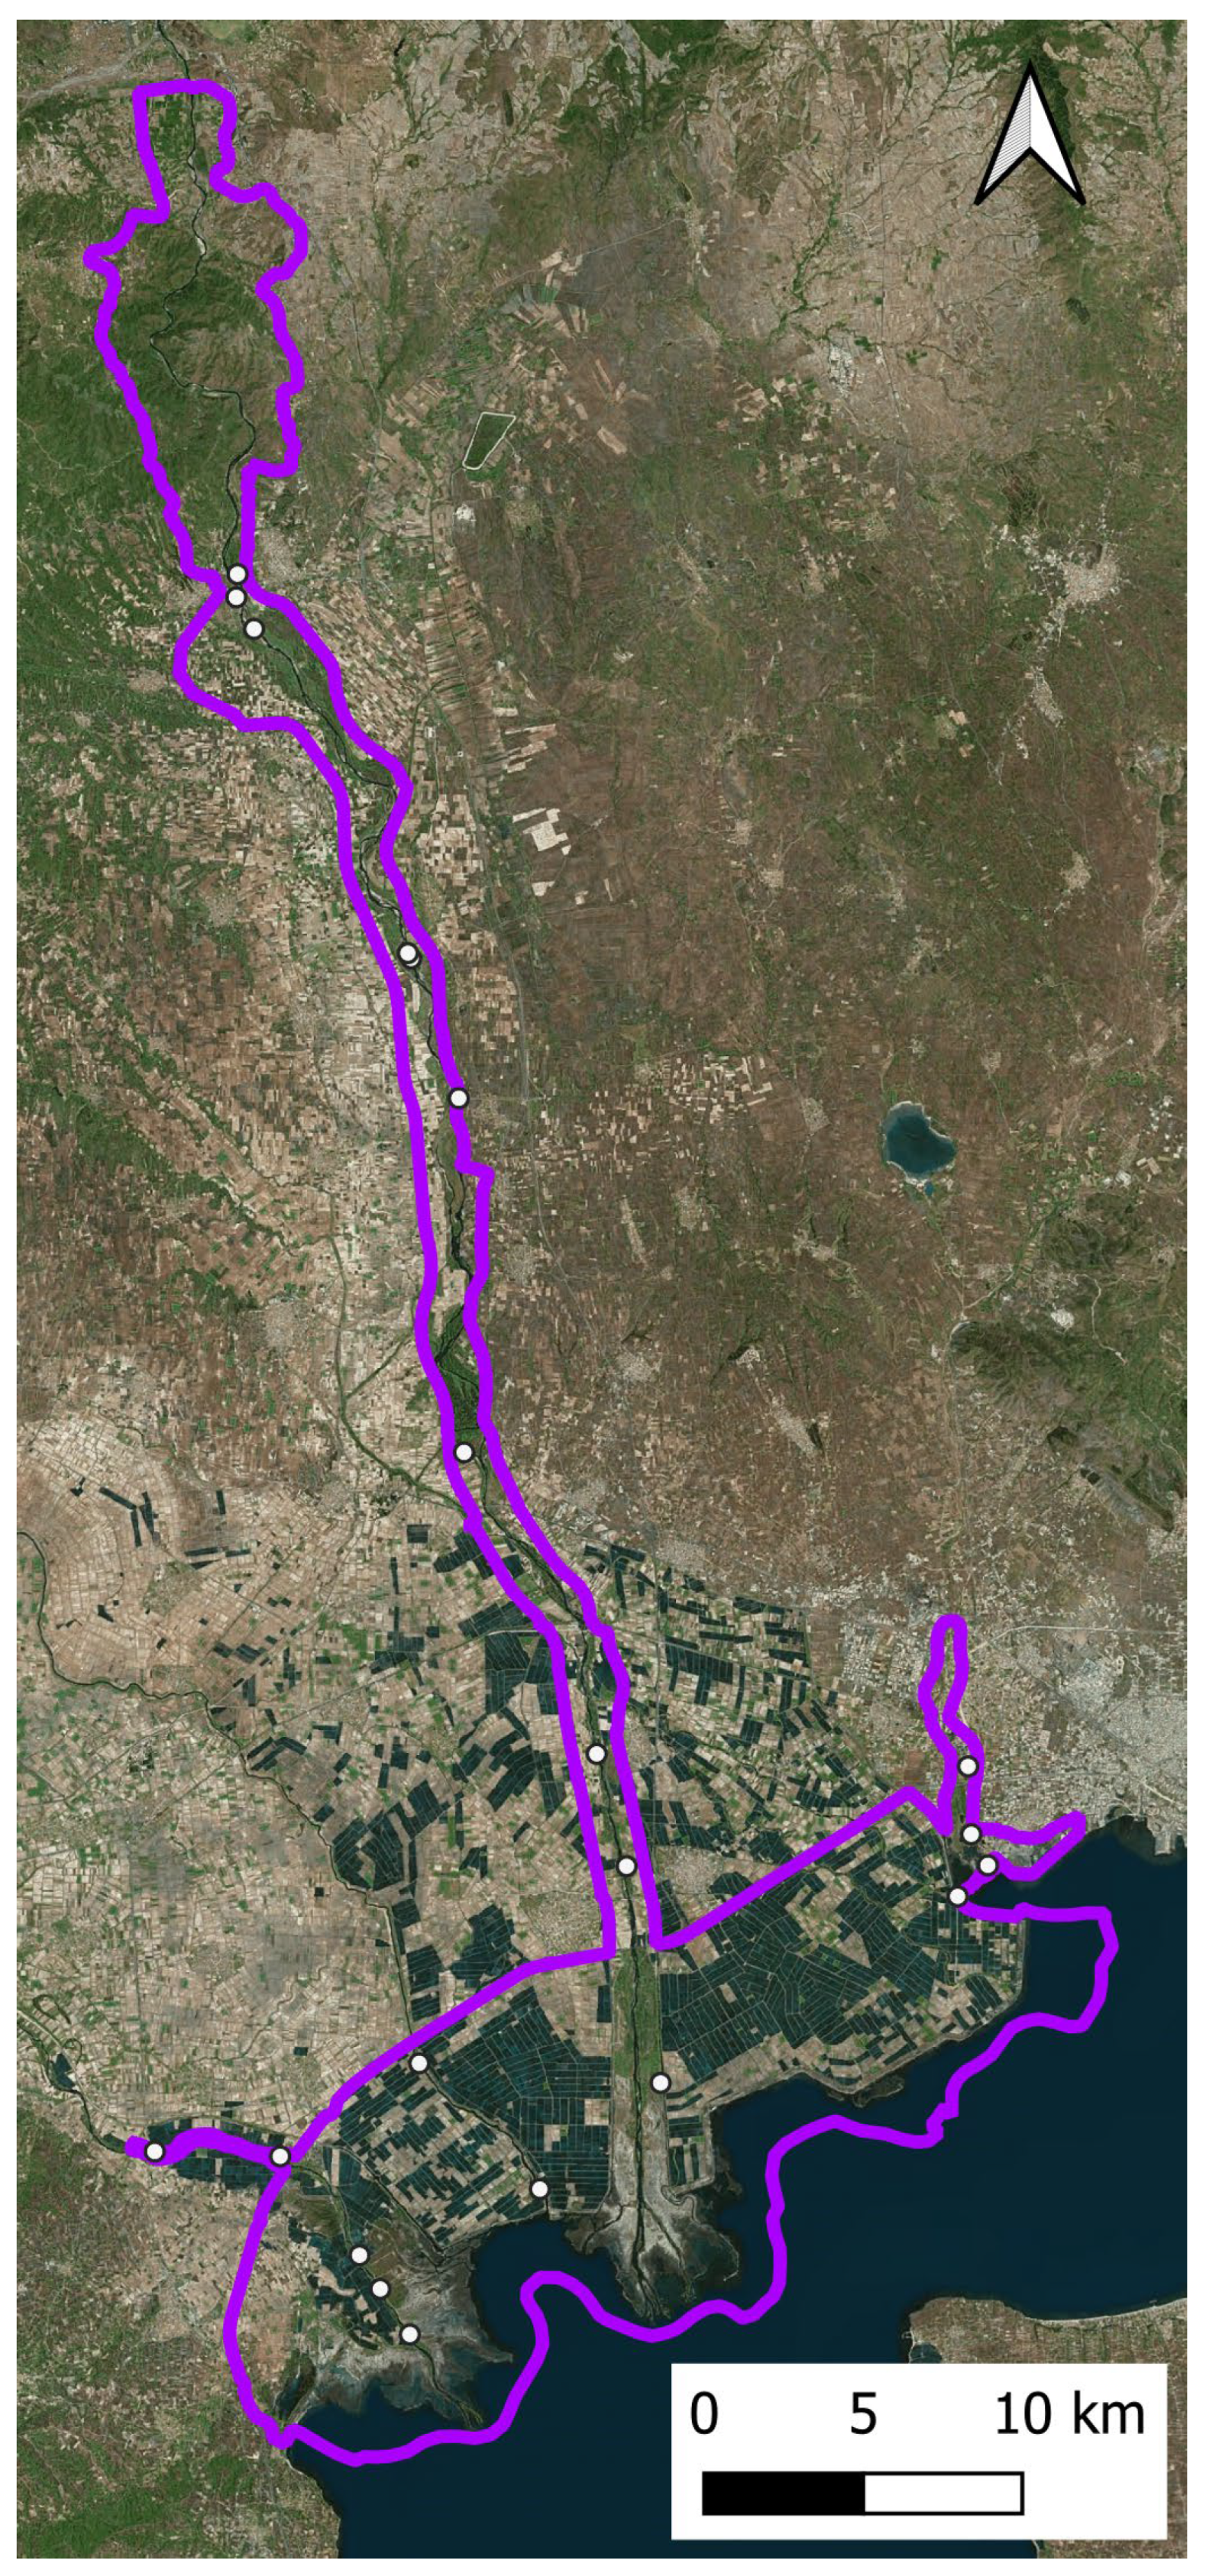
2.1. Study Area

Our study was conducted at the Region of Central Macedonia (Northern Greece), near the banks of Haliacmon (Aliakmonas), Loudias, Axios, and Gallikos rivers as well as Almyravlakas canal, all within the borders of NATURA 2000 SAC GR1220002, which extend to an area of 414.97 km2. This wetland complex is one of the most important wetland ecosystems of Greece. It includes all 76 km of the Axios river within Greece, from the borders with North Macedonia to its delta, the Haliacmon river delta, the estuaries of Gallikos and Loudias rivers, all flowing into the Thermaikos Gulf (North Aegean Sea) and also the Kalochori Lagoon. The study area is a system of estuaries, salt marshes, lagoons, agricultural crops (mainly rice fields), grasslands, saline and clay soils, mudflats, and sand dunes. The riparian vegetation in the area includes shrub, grass, and floating species such as Phragmites australis, Tamarix spp., Juncus maritimus, Solanum dulcamara, Puccinellia festuciformis, Hydrocharis morsusranae, Salicornia europaea, and Scirpus holoschoenus, while the main tree species in the riparian zones of the four rivers are as follows: Alnus glutinosa, Platanus orientalis, Populus alba, Ulmus minor, U. procera, Salix alba, and Acer negundo. The deltas and river estuaries of the area are part of the Axios Delta National Park, which is also protected under the Ramsar Convention on Wetlands of International Importance.

2.2. Sampling and Taxonomic Identification

Samplings were conducted from mid-May to mid-September (5 months) of 2021 and 2022 employing the line transect technique at the riverine areas of Axios, Haliacmon, and Loudias rivers as well as the Almyravlakas canal. A 200 m linear transect was set in each study site, and adult Odonata were recorded when observed at a distance of up to 7 m on either side of the path with the naked eye, a hand-held net, or using a 70–300 mm tele zoom lens. Field work was carried out during sunny, warm days from 9:00 to 17:00.
Every month, 20 different transects were carried out near the above-mentioned river banks, summing a total of 200 unique transects during our study. The minimum distance between the midpoints of two transects was 100 m. The number of transects per river depended on the length of each river bank, accessibility, and the number of different habitat types and CORINE Land Cover (CLC) types [46] along each river. Thus, we conducted 90 transects at riverine areas of Axios, 41 at Gallikos, 40 at Haliacmon, 19 at Loudias, and 10 at Almyravlakas canal (Figure 1). In total, our fieldwork covered 12 habitat types [47], 10 CLC types, and 5 ESA WorldCover 2021 v200 [48] categories: Bare/sparse vegetation (hereafter BV), Cropland (CR), Grassland (GR), Herbaceous wetland (HW), and Tree cover (TC) (Table S1). The TC category refers to Platanus, Populus, Ulmus, Acer, and Salix riparian forests with tree height > 4 m. After capture, Odonates were identified to species level in situ. Nomenclature follows Schorr et al. [49].

2.3. Data Analyses

2.3.1. Hypothesis 1

To analyze the compositional differences in the 200 sampling sites in relation to rivers, habitat, CLC, and ESA WorldCover categories, we applied one-way PERMANOVA [50] with the Bray–Curtis distance measure with 999 permutations, using the adonis2 function of the vegan package [51] in R version 4.3.3. First, we conducted a Permutational Multivariate Analysis of Dispersion (PERMDISP) [52] with the betadisper function to understand how homogeneous the samples were within each factor. Thus, significant PERMANOVA results were considered only under the condition of non-significant PERMDIST (i.e., the assumption of homogeneity of multivariate variances is not violated). Common and rare species were equally weighted with a square root transformation of the data. Species with fewer than five individuals in total were excluded to reduce noise in the data. Significance of pairwise differences between factor classes was Bonferroni corrected. The differences among Odonate site assemblages in different factor classes were visualized with Principal Components Analysis (PCA) after Hellinger transformation of data. The species potentially responsible for significant differences between groups were identified using Indicator Species Analysis (ISA), which combines information on the concentration of species abundance in a particular group and the faithfulness of occurrence of a species in a particular group [53]. Statistical significance was tested compared to the average of 4999 iterations. The maximum value of IndVal is 100 when all individuals of a species are exclusively present at all sites of one specific factor class. IndVal values > 25 represent significant indicators [53]. ISA was performed in PC-ORD 6.21 [54].

2.3.2. Hypotheses 2,3

To thoroughly compare Odonate assemblages based on land use and canopy cover, we selected taxonomic and functional diversity indices as well as Odonata-specific metrics.
Diversity at each site was calculated through Simpson’s evenness index: 1 − D = 1 − ΣPi2, where Pi stands for the proportion of each species at each site, and Effective Number of Species (ENS), the ‘true diversity’ index [55], which expresses the number of equally abundant species that would give the same mean proportional species abundance as that of a true assemblage. ENS = exp(H’), where H’ is the Shannon–Wiener diversity index.
We used two measures of rarity for each sampling site: (i) Relative Taxonomic Distinctness (RTD) which evaluates the taxonomic proximity of the species at each assemblage, a metric adequate with presence-absence data [56], calculated as: RTD = 1/√(nf × ng × ns), where nf is the number of families, ng the number of genera, and ns the number of species at each sampling site. RTD increases with decreasing taxonomic distance between the species of an assemblage [16]. (ii) The mean uniqueness at each assemblage, calculated as: Mean U = ΣUi/n, where n is the number of species recorded at each site and Ui the ‘uniqueness’ of each species: Ui = TDS/ni, where ni is the number of sampling sites where species i was recorded (rarity), and the taxonomic distinctness of each species: TDS = 1/√(f × g × s), where f is the number of recorded families in the suborder to which the species belongs, g is the number of recorded genera in the family, and s is the number of recorded species of the same genus [57]. Assemblages with high Mean U consist of rare and taxonomically distinct species [16].
We also calculated two functional diversity indices: (a) FDis (functional dispersion), a measure of the abundance-weighted dispersion of species in trait space [58], and (b) RaoQ (Rao’s quadratic entropy), which measures the variation in species traits within the community, weighted by relative abundance [59]. Odonate species were assigned to 22 life history traits, including numeric, categorical, binary, or ordinal data regarding the morphology, distribution, behavior, life history, habitat, and phenology of the observed species (Table S2 and Figure S1) [29,60,61,62,63,64,65,66,67,68,69,70,71,72,73,74,75,76]. We first obtained a species-by-species trait distance matrix using Gower distance with the trova function and then calculated the two functional diversity indices using the dbFD function in the FD package [40].
For each Odonata species, we calculated the Dragonfly Biotic Index (DBI), an index of freshwater conditions, based primarily on the presence of adult individuals [77]. The DBI value for each species has been determined based on three sub-indices: (i) Categorized geographical distribution, (ii) Red List (Threat Status), and (iii) sensitivity of its habitat to anthropogenic disturbance. Each sub-index of the DBI ranges from 0 to 3, and the DBI for each species is the sum of the scores for the three sub-indices and ranges from 0 to 9. A widespread, not-threatened species tolerant to disturbance would score 0 (0 + 0 + 0), while a rare, threatened, and sensitive species would score 9 (3 + 3 + 3) [77]. The sub-indices were determined based on the distribution of each species in Greece and the IUCN assessments at the national level [29]. The DBI for each sampling site was calculated as the sum of DBI scores of the species observed divided by the number of species at each site.
In principle, high values of Odonate richness, diversity, uniqueness, and DBI indicate sites of high conservation importance. In order to compare all sites, we first weighted all indices equally (species richness, Simpson, ENS, 1/RTD, Mean U, FDis, RaoQ, and DBI) by dividing the value for each site by the average value of all sites. The Conservation Value Index (CVI) for each sampling site was then computed as the average value of all eight equally weighted indices. Thus, sampling sites with values higher than 1 indicate high conservation importance compared to all other sites, and values higher than 1.5 indicate conservation hotspots of Odonata.
The species richness, abundance, diversity, and uniqueness metrics as well as DBI and CVI values of sampling sites were compared among different factor classes (rivers, habitats, CLC types, and ESA WorldCover categories) or sampling months using one-way ANOVA or Kruskal–Wallis test. Normal distribution of data was evaluated with the Shapiro–Wilk test. ANOVA/Kruskal–Wallis, correlation (Spearman’s rs), and PCA were applied in PAST version 4.17 [78]. All analyses were performed for Odonata in total as well as separately for Anisoptera and Zygoptera suborders.

2.3.3. Hypothesis 4

The hypothesis of turnover versus nestedness was tested by partitioning β-diversity based on the method of multiple-sites similarity, using the beta.multi function of the betapart package [79] in R. We used the Sørensen dissimilarity index (βSOR), which was partitioned into the turnover component, expressed by the Simpson dissimilarity index (βSIM), and nestedness, expressed by the βSNE, i.e., the difference of βSOR minus βSIM [80].
We also calculated β-diversity in the form of its two components according to Legendre and De Cáceres [43]: local contributions to β-diversity (LCBD) and species contributions to β-diversity (SCBD). LCBD expresses the degree of ecological uniqueness of an assemblage in comparison with other assemblages, while SCBD represents the relative contribution of each species to β-diversity. The function beta.div in the package adespatial (v.0.3–24) [81] in R was used to calculate abundance-based LCBD and SCBD.

3. Results

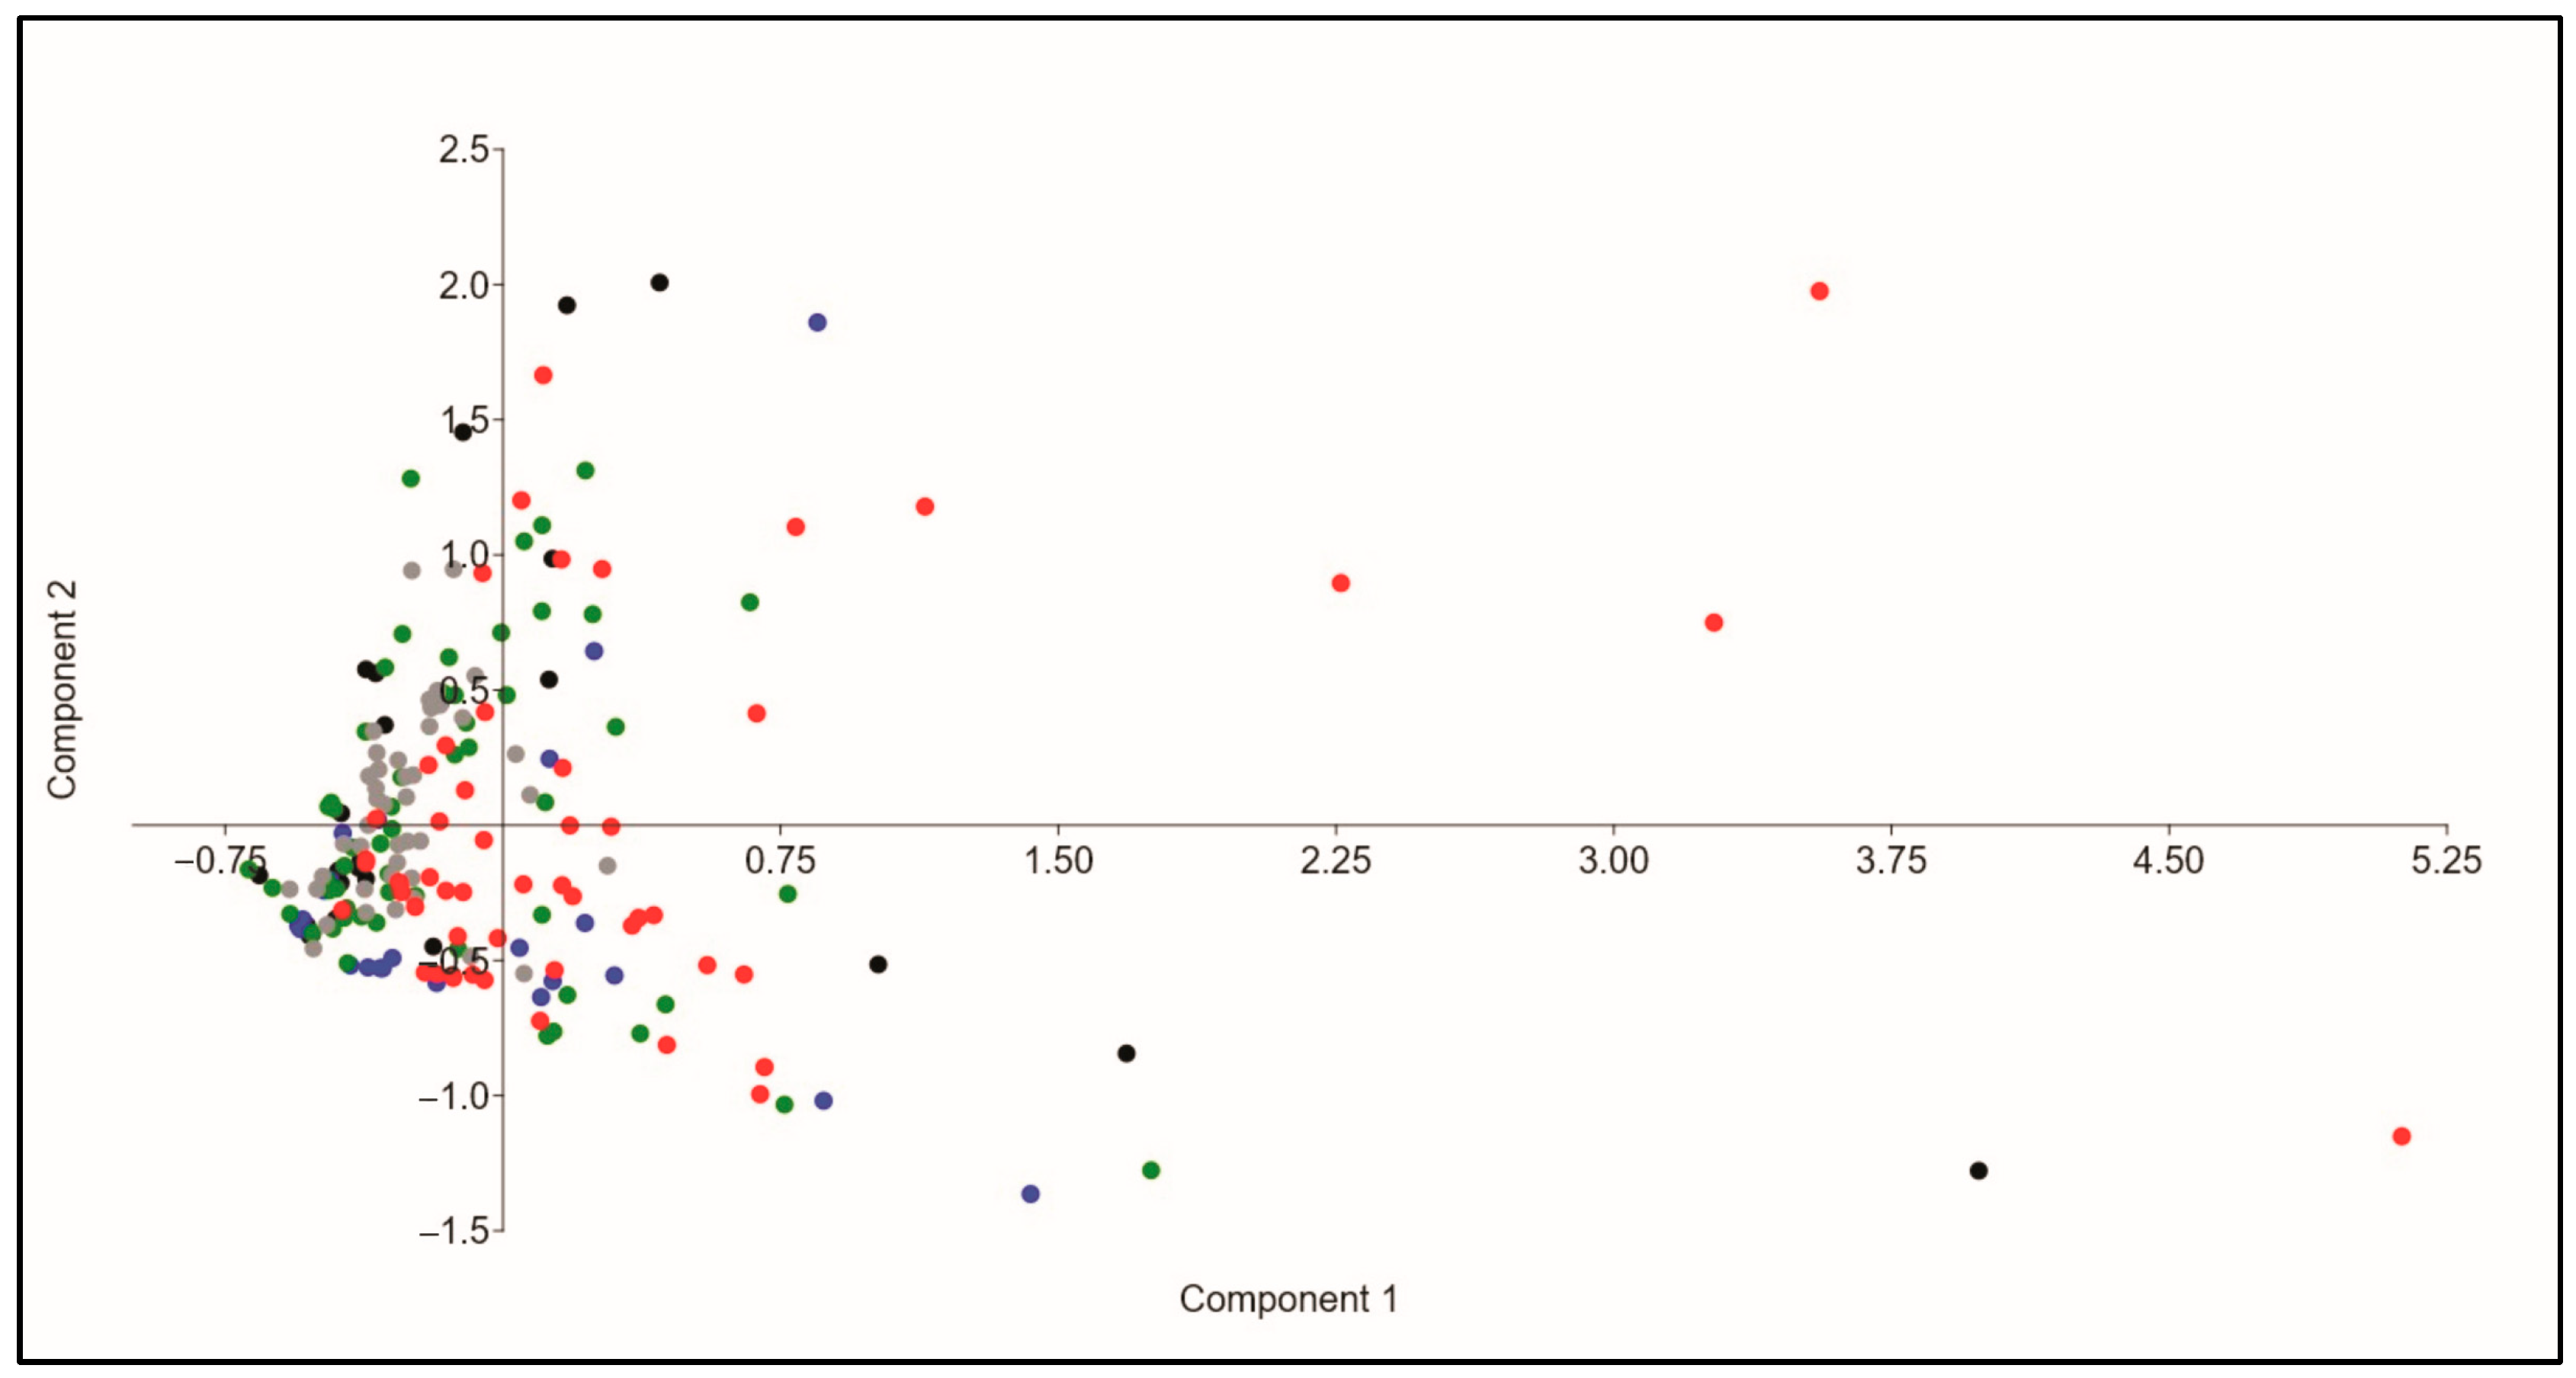
3.1. Composition of Odonate Assemblages

Overall, we identified 20 Anisoptera and 8 Zygoptera species (3.6 ± 1.35 species per site) belonging to 18 genera and 7 families with a total of 6252 individuals (Table 1). The most abundant species was Crocothemis erythraea (1794 individuals), followed by Ischnura elegans (1072 individuals) and Sympetrum fonscolombii (905 individuals). The commonest species were C. erythraea (73% of sites) and I. elegans (48% of sites), followed by Orthetrum albistylum (47% of sites). Five species had less than five recorded individuals in total: Chalcolestes parvidens, Ophiogomphus cecilia, Stylurus flavipes, Sympetrum striolatum, and Gomphus vulgatissimus (Table 1), and 16 of the 28 species were found at 10 sites or less (frequency < 5%) (Table S3).
Two of the observed species have been assessed higher than the Least Concern category on the national level: O. cecilia (Endangered) and Lestes macrostigma (Near Threatened) [29]. O. cecilia was found at a riparian forest of Axios river and L. macrostigma was observed at two sites at Loudias river and at one site at Gallikos river. Lindenia tetraphylla, a species included in the Bern Convention and EU Habitats Directive Annexes II and IV [28] was recorded at the riparian zone of Haliacmon and Axios Rivers (two sites per river) and at three sites near the mouth of Gallikos river, where the population of the species is comparatively larger.
PERMANOVA showed that the composition of Odonate assemblages differed only among the five different ESA WorldCover categories for all Odonata and separately for Anisoptera, while no compositional differences were detected among different rivers, habitats, and CLC categories (Table 2). Eight species were exclusively recorded at TC sites (Erythromma lindenii, C. parvidens, Aeshna affinis, G. vulgatissimus, O. cecilia, S. flavipes, Libellula fulva, and Sympetrum striolatum), and no other species was recorded at any of the other four ESA WorldCover categories. In total, 27 of the 28 species were recorded at TC sites, 17 at HW sites, 15 at GR sites, 14 at BV sites, and only 11 at CR sites (Table S3). However, ISA showed that no species proved to be significant indicators of a factor class (all IndVals < 25).
The compositional patterns of total Odonata assemblages (including both suborders) were visualized with PCA, with the first two axes explaining 31.6% and 22.1% of the variation, respectively (Figure 2). Odonate assemblages at HW sites exhibited the highest similarity (negative values of Component 1), followed by those at GR and CR sites, whereas assemblages at TC sites were the most variant and those at CR sites were the most unique in composition (mainly negative values of Component 2) compared to all other categories.

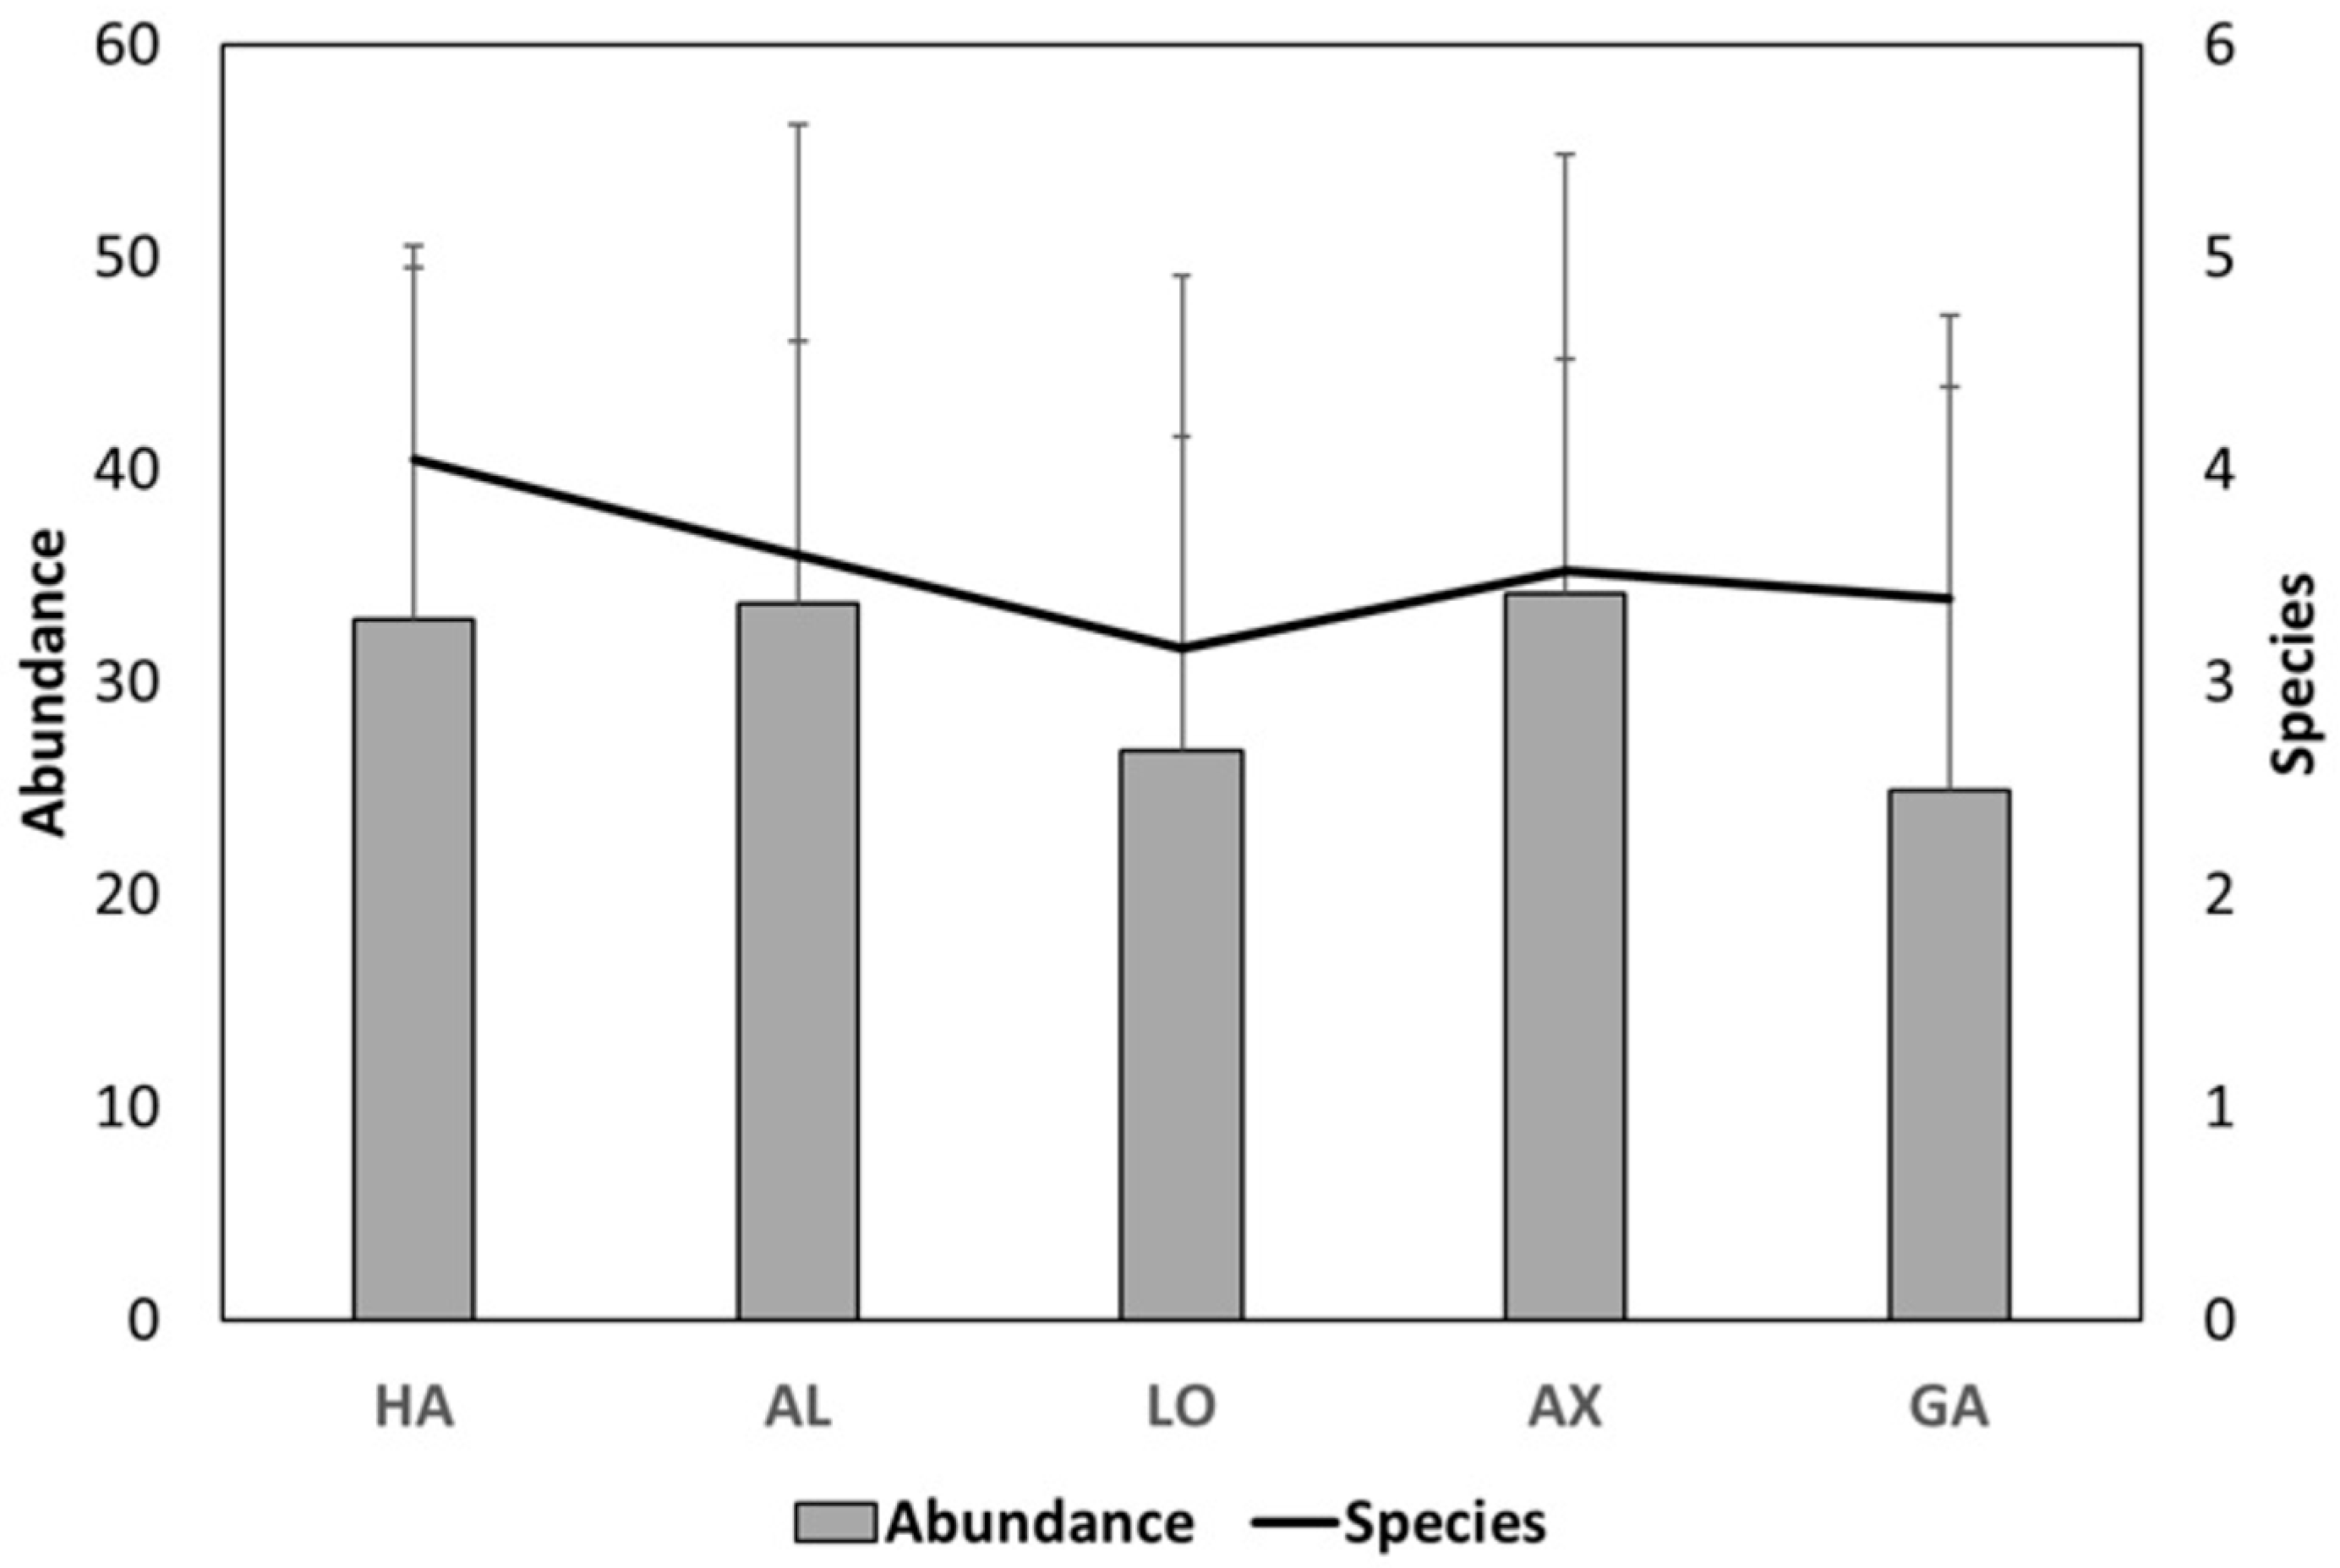
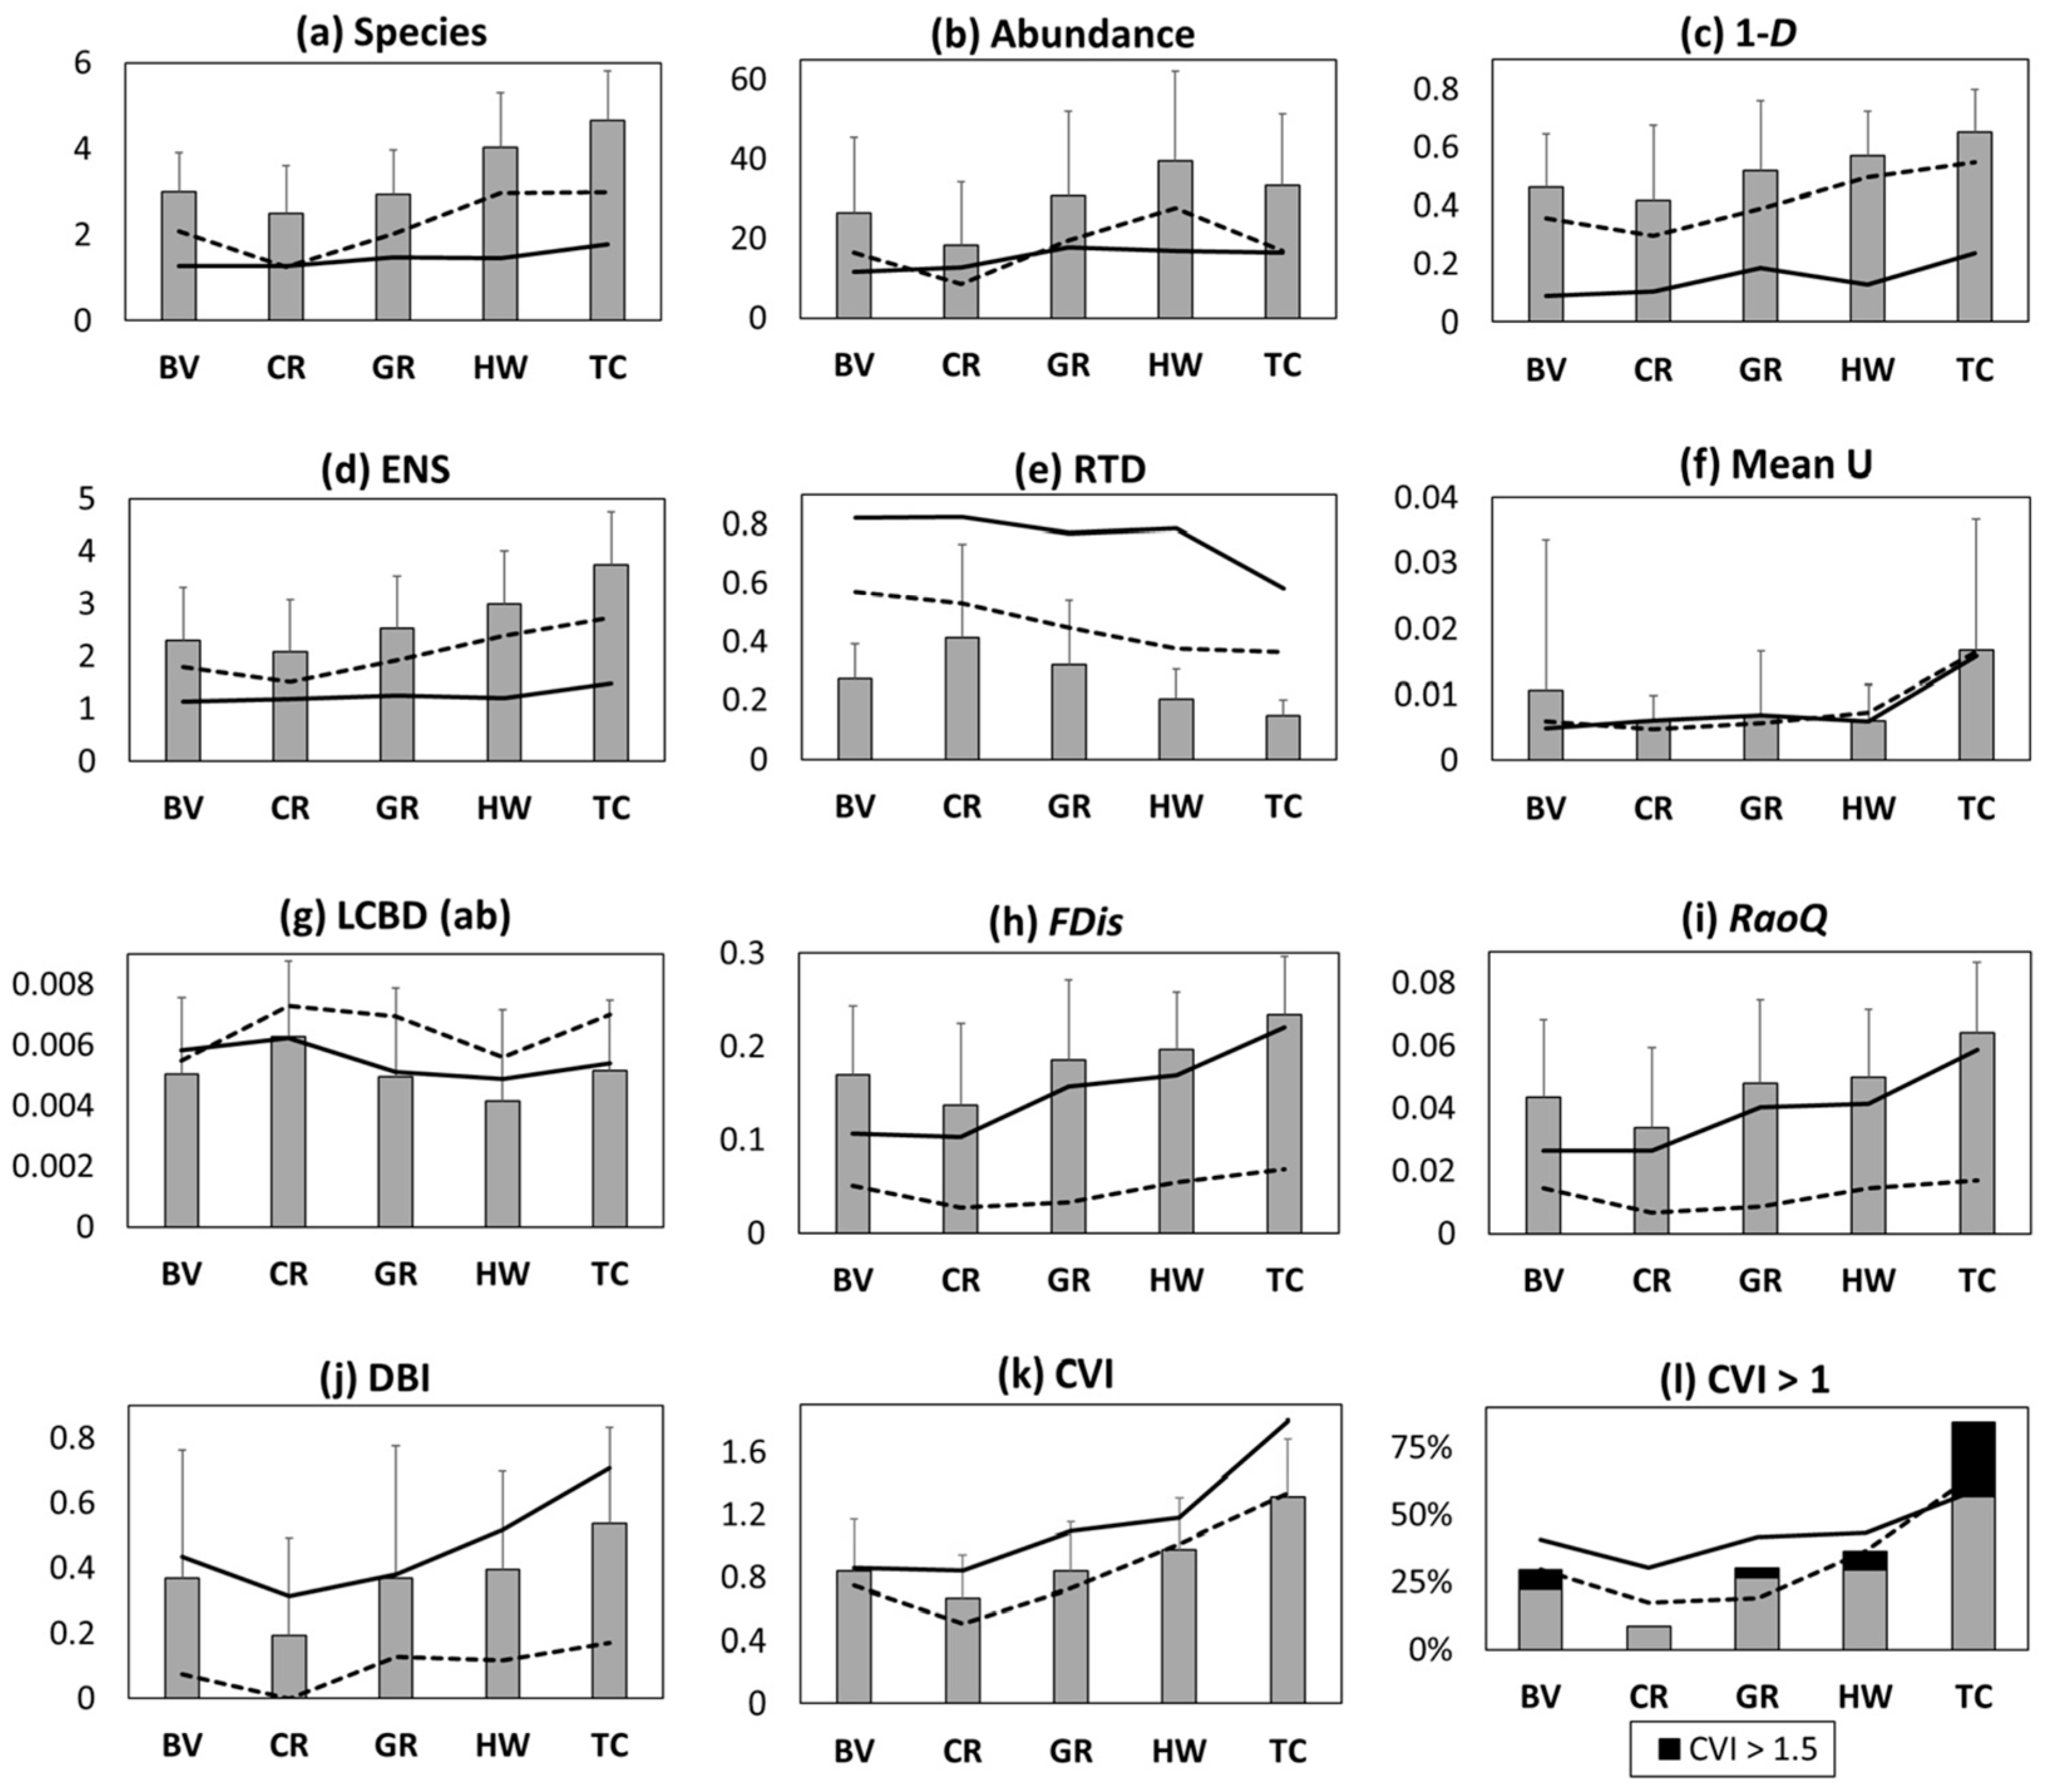
3.2. Richness and Diversity Patterns

The number of observed individuals per sampling site was highest at the Axios river, and average Odonate richness was highest at Haliacmon river, while average richness was lowest at the Loudias river and average abundance was lowest at the Gallikos river (Figure 3).
The distance of sampling sites from the nearest freshwater bodies was not significantly correlated with Odonate species richness (rs = 0.032; p = 0.65) or any other metric presented below. However, average species richness did not differ statistically per river, habitat type, or CLC. RTD and Mean U differed statistically among rivers due to their significantly high values at Haliacmon sites, while LCBD and Mean U were also significantly higher at the 92A0 habitat type. All taxonomic and functional diversity indices, as well as DBI and CVI, differed statistically among different ESA WorldCover categories, and most of these analyses were highly significant. These results were also confirmed for both suborders (species richness, ENS, RTD, Mean U, CVI), only for Zygoptera (abundance, 1-D, LCBD), or only for Anisoptera (FDis, RaoQ, DBI). Post hoc results showed that for most analyses, there were several and mostly highly significant pairwise differences, except for LCBD (just one marginally significant pairwise difference) (Table 3). Species richness was significantly negatively correlated with RTD (rs = −0926; p < 0.001) and LCBD (rs = −0346; p < 0.001), while RTD and LCBD were positively correlated (rs = 0.369; p < 0.001).
The common pattern for species richness, all taxonomic and functional diversity indices, DBI, and CVI was that their values were highest at TC sites and lowest at CR sites (Figure 4a,c,d,h–l). RTD was high at CR sites and low at TC sites (Figure 4e), Mean U was much higher at TC sites (Figure 4f), while average Odonate abundance was highest at HW sites and lowest at CR sites (Figure 4b), vice versa with LCBD (Figure 4g). These patterns (statistically significant or not) were more all less similar to or even identical to the results for each of the two Odonata suborders. Since CR sites represent the most exposed areas to sunlight and TC sites are the most shaded, we tested for potential activity shifts towards canopy cover sites in the warmest months. The abundance of Zygoperta at CR sites (Kruskal–Wallis: H = 9.201; p = 0.0267) and TC sites (Kruskal–Wallis: H = 13.57; p = 0.0088) differed among sampling months due to the significantly higher values during July and August compared to May. The respective analyses for species richness of both suborders, abundance of Anisoptera, and both variables for total Odonata resulted in a lack of significance (p > 0.05).
CVI was higher than 1 at 85 sites, i.e., 42.5% of all sampling sites, which corresponds to 84.3% of TC sites, followed by just 36.3% of HW sites, 30.2% of GR sites, 29.6% of BV sites, and 8.7% of CR sites (Figure 4k). CVI was higher than 1.5 at 21 sampling sites (10.5% of all sites): 14 TC sites, three HW, two BV, and two GR sites (Figure 4l).
The total β-diversity was low (βSOR = 0.313), which was caused mostly by the turnover component (βSIM = 0.26), whereas the nestedness component contributed very little (βSNE = 0.053). The turnover component was also the main driving factor of Anisoptera (βSIM = 0.971; βSNE = 0.011) and Zygoptera (βSIM = 0.963; βSNE = 0.013) β-diversity.
The four species with the highest SCBD values were Ischnura elegans (0.177), Sympetrum fonscolombii (0.149), Crocothemis erythraea (0.143), and Platycnemis pennipes (0.117). SCBD was negatively correlated with species uniqueness (Ui) (rs = −0.474, p = 0.011) and positively correlated with the number of sites occupied (rs = 0.914, p = 1.13 × 10⁻¹¹) and the abundance of each species (rs = 0.879, p = 7.78 × 10⁻¹⁰). Indeed, SCBD increased linearly with the number of sites occupied and the abundance of each species (Figure 5a,b) and decreased as Ui increased (Figure 5c).

4. Discussion

4.1. Land Use Drives Differential Assemblage Composition

Our results showed that the Odonate fauna of the wetland complex of Thermaikos Gulf is characterized by the dominance of highly abundant and widely distributed species at all four rivers and Almyravlakas canal, as well as the presence of several species with low frequency and abundance. Even though some of the latter species were excluded from our analyses, we found that the species composition of all Odonata and Anisoptera assemblages did differ among ESA WorldCover categories, which was mainly due to the differences between CR sites and other categories. The lack of significant differences in Odonate assemblages among rivers or the numerous and too specific habitat and CLC types was expected for insects with such great dispersal ability as Odonata, especially Anisoptera, while PERMANOVA revealed that land use rather than vegetation category was the driver of differential assemblage composition in our study (Table 2).
Odonata assemblages at cropland sites were comparatively poorer, dominated by widely distributed species in the area or heliophilic generalists, and included no species of conservation priority, which were present at 1–3 of the other four ESA WorldCover categories (Table S3). These findings coincide with previous studies on the dominance of far-ranging generalist species [82,83,84], the absence of several habitat specialists [85,86,87], and species of conservation concern or threatened species with decreasing habitat naturalness [88], as well as higher variation in the composition of assemblages in natural habitats [89]. This pattern is probably due to habitat changes or loss as a result of modifications and consequent alterations of abiotic conditions, which favor the predominance of fewer, tolerant Odonate species in areas under intensive agricultural land use [89].
Consequently, our initial hypothesis is not true, highlighting the sensitivity of Odonates to landscape modifications that filter the distribution of species within the wetland complex of Thermaikos Gulf.

4.2. Ecophysiological Restrictions Influence Diversity Patterns

What was proved for assemblage composition analysis was also reflected in diversity and conservation metrics. ESA WorldCover was the only factor with significant differences among its classes for all calculated indices, including data for all Odonata or separately for Zygoptera and Anisoptera (Table 3). Species richness and all taxonomic and functional diversity indices were significantly lower at CR sites compared to the other four WorldCover categories (Figure 4a–d,h,i), thus confirming our second hypothesis. Our results are consistent with previous studies that exhibit lower Odonate species richness or taxonomic diversity under intensive land use, namely agriculture [25,85,87], logging [42], or mixed disturbance types [16,90]. This pattern has been confirmed in the past for all Odonata or separately for Zygoptera, but not Anisoptera. As damselflies are smaller and have slim bodies and limited dispersal abilities, they are more vulnerable to desiccation and consequently they are affected more by intensive land use [20], especially regarding habitat alteration and removal of natural vegetation, and thus are usually recorded at densely vegetated, shaded riparian environments [91], but not at exposed croplands. On the contrary, most dragonflies are larger, heliothermic, powerful fliers; their capacity to heat their body by irradiation prior to activity is higher than that of damselflies because it increases with body size [92], and thus they are expected to be found anywhere, including areas under intensive land use.
Taking into account the fact that natural vegetation is more diverse than anthropogenic vegetation (let alone monocultures), undisturbed sites host more percher and endophytic species (Zygoptera and Aeschnidae) and exhibit generally higher diversity and abundance of macroinvertebrate species on which Odonate larvae can feed [16], compared to altered habitats. Indeed, only one percher species was recorded at CR sites, and total endophytic species richness was 43%–67% lower at CR sites compared to the other WorldCover categories in our study, while exophytic species were generally common at all categories (Figure S1 and Table S3). These differences were reflected in the significantly lower functional diversity metrics at cropland sites compared to sites with natural vegetation (Table 3, Figure 4h,i). Apparently, the variation in species traits within the assemblages at agricultural sites was much smaller as a result of environmental filtering due to ecophysiological restrictions. Moreover, DBI scores were significantly lower at CR sites (Table 3, Figure 4j), denoting that agriculture promotes the presence of widespread, non-threatened species, tolerant to disturbance [85], and emphasizing the sensitivity of the DBI to intensive land use [77] as it increases with increasing naturalness [88].

4.3. Canopy Cover Enhances Odonate Diversity and Site Conservation Value

The analysis of Odonata assemblages at each WorldCover class revealed that average species richness, taxonomic diversity, uniqueness, and functional diversity were all significantly higher at TC sites (Table 3, Figure 4a,c–f,h,i), i.e., at areas with canopy cover, thus refuting our third hypothesis. The only exception was RTD, which was significantly lower at TC sites compared to other WorldCover categories (Figure 4e); nevertheless, this index decreases with increasing taxonomic distance between the species of each assemblage, and thus it also fits the pattern of higher diversity at TC sites. Our results oppose previous studies, which found that total Odonate richness or both richness and diversity were either not affected [24,83,86,93,94,95] or decreased with increasing canopy cover [86,96,97].
The aforementioned pattern was also proved for Zygopteran and anisopteran assemblages at the Thermaikos Gulf (Figure 4), and it was affirmed statistically for all indices at least for one suborder (Table 3). Our results regarding higher richness of Zygoptera at canopy cover sites coincide with several previous studies [90,98,99]. On the contrary, anisopteran richness is reported to decrease with increasing canopy cover [25,90,98,99]. In addition, the possibility of activity shifts towards more shady areas in the warmest months is dismissed, since the species richness of both suborders, as well as dragonfly abundance at CR and TC sites, did not differ statistically among sampling months, whereas damselfly abundance was in fact significantly higher during the warmest months of our study. Most Zygoptera species are small and slender thermal conformers with restricted dispersal capacity [20], sensitive to dehydration and overheating [100], highly dependent on the habitat structure [101], and therefore, the lower temperatures at sites with canopy cover are likely to favor many damselfly species [33,92,99,102] because these environments provide thermal stability [33]. On the other hand, most dragonflies are heliothermic and are more likely to be found in more open areas [71,103,104]. Reduced sunlight at tree canopy shade can reduce water temperature, delay larval development [105], and cause a reduction in macrophytes that harbor prey and are used by dragonflies for oviposition [105,106]. The absence of several dragonfly species from riparian forests or forest patches is also associated with low levels of polarized light reflected from water, which is a visual cue for habitat selection by Anisoptera [33,97,107].
The ecophysiological differences between the two suborders were the main cause of significant compositional differences among Odonate assemblages in relation to canopy cover in previous studies [82,83,86,90,93,94]. Our analyses resulted in significant compositional differences between TC and CR sites for Anisoptera (Table 2), but for exactly the opposite reason, as dragonfly fauna was richest at riparian forests and minimal at open areas (Figure 4a). The contradiction of our results with previous studies regarding Anisoptera is based on the particularities of the wetland complex of Thermaikos Gulf. Specifically, 60.8% of the transects performed at TC sites were near CR sites. The fact that several sampling sites were near the ecotone transforms, at least to some extent, the comparison from canopy cover vs. open areas to disturbed areas vs. natural vegetation. In other words, our results regarding dragonflies are probably more due to the avoidance of neighboring agricultural sites rather than the preference for TC sites instead of HW, BV, or GR sites. The croplands in the wetland complex of Thermaikos Gulf cover extended areas that separate rivers Haliacmon, Loudias, Axios, and Gallikos from west to east, causing habitat fragmentation. Habitat alteration or loss across such large areas and the very high temperatures during summer, which may be a stress factor even for heliothermic species, are likely to deter several dragonfly species from roaming in open areas, thus making TC sites ideal shelters, especially during the hottest days. In addition, even though the attraction of dragonflies to canopy cover habitats is theoretically limited [97], because it is difficult to visually detect surfaces that reflect horizontally polarized light [108] through dense vegetation, it has been found that if these habitats are located, adult Odonata breed successfully and their larvae perform well there [97].
Both Zygopteran and anisopteran assemblages at TC sites had significantly higher taxonomic distance and rarity of co-occurring species (Table 3 and Figure 4e,f). As for the species that were only observed at TC sites in small numbers, Erythromma lindenii [109], Chalcolestes parvidens [62], Libellula fulva [110], Stylurus flavipes, and Ophiogomphus cecilia [111] have been recorded at riparian forests, whereas Gomphus vulgatissimus [93], Aeshna affinis [112], and Sympetrum striolatum [113] have been observed at the margins of forests. Notably, G. vulgatissimus prefers landscapes with a combination of forests, bushes, and agricultural fields [62], which was also the case in our study, highlighting the importance of canopy cover and its ecotone for several Odonate species. This is even more evident if we take into account the fact that even though species richness of damselfly and dragonfly assemblages was significantly higher at TC sites, the average abundance for both suborders was higher in HW and GR sites than in TC sites (Figure 4b), indicating that the richness and diversity patters discussed above were due to ecological adaptations of species and were not driven by high numbers of individuals.
Regardless of the number of species and their abundance at each sampling site, the studied Odonate assemblages also differed on the level of naturalness and canopy cover. The DBI scores at TC sites were significantly higher for Odonata in total and Anisoptera and minimal at CR sites, while Zygoptera followed exactly the same pattern without statistical significance due to the fact that all DBI scores of damselflies at CR sites were zero (Table 3 and Figure 4j). Our results are in congruence with previous studies supporting high DBI scores at natural sites and a significant decrease in the DBI in more degraded areas as a result of human-induced landscape changes [37,88,98]. In our study, Odonate species at areas with canopy cover are comparatively more threatened on national level, more narrowly distributed and are found at more sensitive habitats to anthropogenic disturbance, while agricultural sites host more tolerant, widespread, generalist species, indicating the effectiveness of the DBI for identifying sites of conservation priority [87], its potential as an index of landscape change, and its sensitivity to anthropogenic disturbance [77].
Similarly, the aforementioned pattern was also confirmed for the newly introduced Conservation Value Index (CVI), for Odonata in total and both suborders. In fact, the significance of high values at TC sites compared to all other WorldCover categories was even higher (Table 3, Figure 4k). The robustness of the CVI relies on the flexibility to include several parameters (which may differ according to the studied taxa and sampling methodology) under the condition that high values indicate areas of high conservation importance among numerous sampling sites within each sampling area. The implementation of qualitative and quantitative assemblage parameters makes the CVI a multifaceted, versatile, powerful tool for highlighting and ranking areas based on conservation priority. In our study, CVI > 1 (i.e., higher than the average of included parameters of assemblages in a region) was estimated for 84.3% of TC sites, followed by just 36.3% of HW sites, while only 8.7% of CR sites fit this pool of sampling sites (Figure 4l). Setting values of CVI > 1.5 as an equivalent of potential conservation hotspots, we found that 21 sampling sites fit this category: 14 tree cover sites, 3 herbaceous wetland, 2 bare/sparse vegetation, and 2 grassland sites (Figure 4l), widely distributed within the borders of NATURA 2000 SAC GR1220002 and the 4 rivers of the studied wetland complex: 10 sites at Axios, 5 sites at Haliacmon, 4 sites at Gallikos, and 2 sites at Loudias (Figure 6).

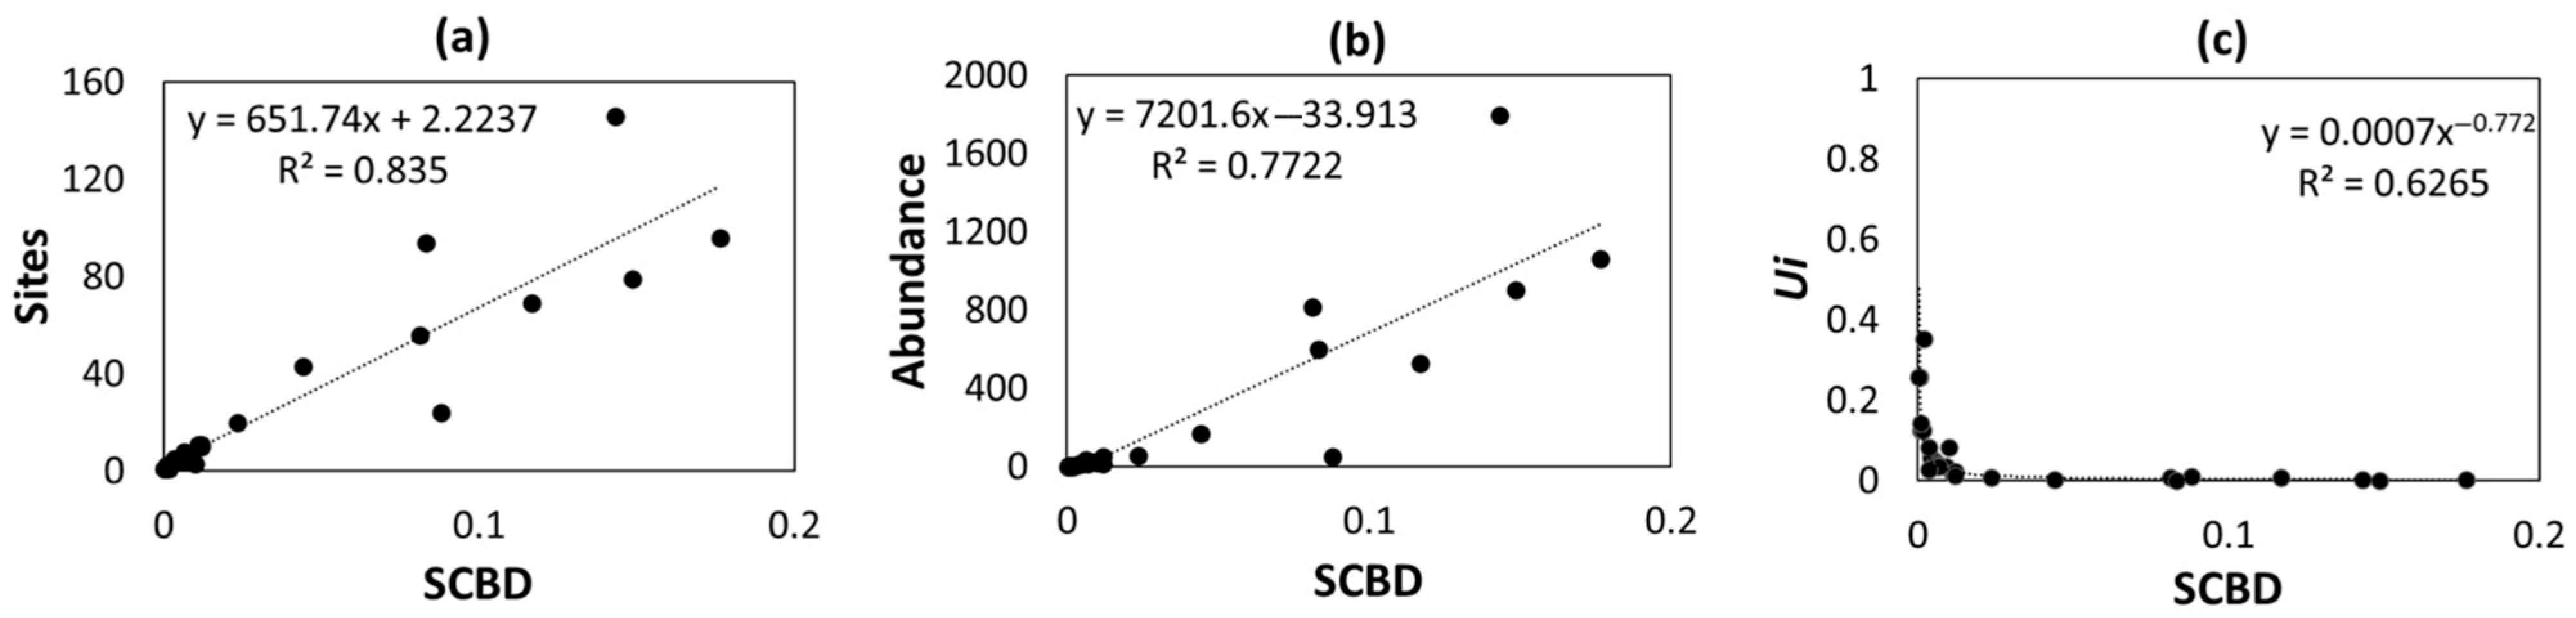
4.4. Agriculture Influences β-Diversity Patterns

Following the significant differences in the composition of Odonate assemblages as a consequence of habitat alterations under intensive land use, the fact that β-diversity in total and separately for Anisoptera and Zygoptera was strongly influenced by the turnover element comes as no surprise. High levels of anthropogenic disturbance often lead to higher turnover of Odonata as a result of disruption of ecological communities [114], because specialist species tend to respond negatively to habitat disturbance and fragmentation [115], in accordance with previous studies showing that turnover was the main driver of β-diversity of Odonate communities as a result of habitat alteration due to agriculture [85] and logging [42]. Thus, the first part of our fourth hypothesis is refuted.
Additionally, LCBD was higher at sites with low species richness and low taxonomic distance of co-occurring species (RTD), and, expectedly, it was highest on average at CR sites (Figure 4g), and this was affirmed statistically for the total Odonata and Zygoptera, but not Anisoptera (Table 3). The pattern of high local contribution to β-diversity through unique species combinations being associated with assemblages with fewer, taxonomically proximal species and often with degraded areas, is in accordance with previous studies [43] and specifically on Odonata [16,116,117]. In our study, it is apparent that agricultural sites host unique combinations of Odonate species due to the specific environmental conditions in these environments.
On the other hand, SCBD was positively related to increasing site occupancy and species abundance (Figure 5a,b) and negatively related to increasing species uniqueness (Figure 5c). The four Odonate species (two Zygoptera and two Anisoptera) with the highest SCBD values (I. elegans, S. fonscolombii, C. erythraea, and P. pennipes) were among the most widely distributed and abundant species in the study area (Table 1 and Table S3), contributing 58.5% of total β-diversity, and particularly CR sites. These findings are in agreement with previous studies [16,117], further strengthening the central role of land use in shaping β-diversity patterns. Thus, the second part of our fourth hypothesis is true.

4.5. Conclusions and Implications for Conservation

ESA WorldCover proved to be a powerful tool for the detection of different ecological patterns in relation to land use and broad vegetation categories, even for taxa with high dispersal capacity such as Odonata. Agricultural areas host few, tolerant, adaptive, mainly generalist Odonate species, whereas canopy cover sites host 27 of the 28 observed species in the whole study area, and those assemblages have the highest diversity, uniqueness, and DBI values for Odonata in total and separately for both suborders. The pattern of higher richness and diversity of dragonflies at canopy cover sites is reported for the first time. Previous relevant studies conducted in the temperate [97,106], tropical [25,90,98], equatorial [99], and subtropical zone [107] revealed a common pattern of comparatively low anisopteran richness at canopy cover sites (i.e., riparian forests or patches), thus refuting the possibility of variant patterns across different climate zones. Our finding is attributed to the avoidance of neighboring open areas due to habitat alteration and stressful abiotic conditions at cropland sites rather than the preference for riparian forest patches, as dragonflies are more likely to be found at open areas. Thus, habitat alteration or loss due to intensive land use and hostile abiotic conditions are probably the main factors that enhance Odonate diversity at canopy cover sites of the wetland complex of Thermaikos Gulf. Riparian areas with canopy cover are shelters for Odonate species and host 14 of the 21 conservation hotspots for Odonata within the borders of NATURA 2000 SAC GR1220002 (Figure 6).
Conservation initiatives regarding Odonata should incorporate the tolerance of species to canopy cover across study areas and the history of local habitat conditions, especially the effects of historical land use [97] as well as the effects of its intensification on this sensitive and versatile indicator group for identifying changes in freshwater habitats and riparian forests [24]. Differences in the composition and diversity patterns of Odonate assemblages linked to human-induced disturbance and canopy cover add important information for the effective conservation of wetlands.
Our results highlight the conservation priority of riparian forests. Foodplain forests (including riparian forests) have the minimum percentage of “above adequate condition” assessment and the highest percentage of “bad condition” in Greece [116]. Greek wetlands face severe desertification risks due to climatic changes and degradation from agricultural intensification [12]. Cultivation is the main human-driven disturbance at riparian forests in Greece, while heatwaves and droughts are becoming more intense over the last years [118]. The continuous monitoring of indicator groups such as Odonata, the application of management planning according to conservation priority, and the implementation of law at protected areas are imperative for the successful maintenance of these delicate ecosystems.

Supplementary Materials

The following supporting information can be downloaded at: https://www.mdpi.com/article/10.3390/f16071181/s1, Table S1. The habitat types, CORINE Land Cover codes, and ESA WorldCover 2020 v100 categories of the 200 line transects in our study; Table S2. The 22 traits used to estimate functional diversity at each sampling site. Body size traits are in millimeters. The categories of ‘Aquatic Habitat’ reflect the habitat categories of the first IUCN Red List assessments of Odonata species of Greece. ‘Phenology Peak’ is the period of maximal activity of each species in Greece. Table S3. The ecological and geographic characteristics of the sampling sites and the presence of Odonate species at each site. 1: Calopteryx splendens, 2: Erythromma lindenii, 3: Erythromma viridulum, 4: Ischnura elegans, 5: Chalcolestes parvidens, 6: Lestes barbarous, 7: Lestes macrostigma, 8: Platycnemis pennipes, 9: Aeshna affinis, 10: Aeshna mixta, 11: Anax imperator, 12: Anax parthenope, 13: Isoaeshna isosceles, 14: Gomphus vulgatissimus, 15: Lindenia tetraphylla, 16: Onychogomphus forcipatus, 17: Ophiogomphus cecilia, 18: Stylurus flavipes, 19: Crocothemis erythraea, 20: Libellula fulva, 21: Orthetrum albistylum, 22: Orthetrum brunneum, 23: Orthetrum cancellatum, 24: Orthetrum coerulescens, 25: Sympetrum fonscolombii, 26: Sympetrum meridionale, 27: Sympetrum sanguineum, 28: Sympetrum striolatum. Figure S1. Trait values for each functional trait per species (details of traits and trait levels in Table S2). Abbreviated species names: CALSPL—Calopteryx splendens, ERYLIN—Erythromma lindenii, ERYVIR—Erythromma viridulum, ISCELE—Ischnura elegans, CHAPAR—Chalcolestes parvidens, LESBAR—Lestes barbarous, LESMAC—Lestes macrostigma, PLAPEN—Platycnemis pennipes, AESAFF—Aeshna affinis, AESMIX—Aeshna mixta, ANAIMP—Anax imperator, ANAPAR—Anax parthenope, ISOISO—Isoaeshna isosceles, GOMVUL—Gomphus vulgatissimus, LINTET—Lindenia tetraphylla, ONYFOR—Onychogomphus forcipatus, OPHCEC—Ophiogomphus cecilia, STYFLA—Stylurus flavipes, CROERY—Crocothemis erythraea, LIBFUL—Libellula fulva, ORTALB—Orthetrum albistylum, ORTBRU—Orthetrum brunneum, ORTCAN—Orthetrum cancellatum, ORTCOE—Orthetrum coerulescens, SYMFON—Sympetrum fonscolombii, SYMMER—Sympetrum meridionale, SYMSAN—Sympetrum sanguineum, SYMSTR—Sympetrum striolatum.

Author Contributions

Conceptualization, D.K. and L.A.; methodology, D.K.; validation, D.K. and D.N.A.; formal analysis, D.K. and I.E.; writing—original draft preparation, D.K.; writing—review and editing, D.K., L.A., I.E., D.I.R. and D.N.A.; visualization, D.K.; supervision, D.K. and L.A. All authors have read and agreed to the published version of the manuscript.

Funding

This research was carried out on behalf of the Natural Environment and Climate Change Agency (N.E.C.C.A.) and the Management Unit of Protected Areas of Central Macedonia (former Thermaikos Gulf Protected Areas Management Authority) and co-funded by the Periphery of Central Macedonia and European Regional Development Fund through the Regional Operational Program (ROP) “Central Macedonia 2014–2020” (project code: MIS 5045794).

Data Availability Statement

The data presented in this article are available on request from the authors.

Acknowledgments

The samplings included in this paper are part of the project “Recording of the insect fauna of riparian ecosystems in the SAC GR1210002 and GR1220002 within the responsibility area of the Thermaikos Gulf Protected Areas Management Authority”. We thank the Natural Environment and Climate Change Agency (N.E.C.C.A.) and the Management Unit of Protected Areas of Central Macedonia for the fruitful collaboration during field work.

Conflicts of Interest

The authors declare no conflicts of interest.

References

  1. Dudgeon, D. Multiple threats imperil freshwater biodiversity in the Anthropocene. Curr. Biol. 2019, 29, R960–R967. [Google Scholar] [CrossRef] [PubMed]
  2. He, F.; Zarfl, C.; Bremerich, V.; David, J.N.W.; Hogan, Z.; Kalinkat, G.; Tockner, K.; Jähnig, S.C. The global decline of freshwater megafauna. Glob. Change Biol. 2019, 25, 3883–3892. [Google Scholar] [CrossRef] [PubMed]
  3. Dudgeon, D.; Arthington, A.H.; Gessner, M.O.; Kawabata, Z.-I.; Knowler, D.J.; Lévêque, C.; Sullivan, C.A. Freshwater biodiversity: Importance, threats, status and conservation challenges. Biol. Rev. 2006, 81, 163–182. [Google Scholar] [CrossRef] [PubMed]
  4. Strayer, D.L.; Dudgeon, D. Freshwater biodiversity conservation: Recent progress and future challenges. J. N. Am. Benthol. Soc. 2010, 29, 344–358. [Google Scholar] [CrossRef]
  5. Vörösmarty, C.J.; McIntyre, P.B.; Gessner, M.O.; Dudgeon, D.; Prusevich, A.; Green, P.; Glidden, S.; Bunn, S.E.; Sullivan, C.A.; Reidy Liermann, C.; et al. Global threats to human water security and river biodiversity. Nature 2010, 467, 555–561. [Google Scholar] [CrossRef] [PubMed]
  6. Couceiro, S.R.M.; Hamada, N.; Forsberg, B.R.; Pimentel, T.P.; Luz, S.L.B. A macroinvertebrate multimetric index to evaluate the biological condition of streams in the Central Amazon region of Brazil. Ecol. Indic. 2012, 18, 118–125. [Google Scholar] [CrossRef]
  7. Sala, O.E.; Chapin, F.S., III; Armesto, J.J.; Berlow, E.; Bloomfield, J.; Dirzo, R.; Huber-Sanwald, E.; Huenneke, L.F.; Jackson, R.B.; Kinzig, A.; et al. Global biodiversity scenarios for the year 2100. Science 2000, 287, 1770–1774. [Google Scholar] [CrossRef] [PubMed]
  8. Leal, C.G.; Lennox, G.D.; Ferraz, S.F.B.; Ferreira, J.; Gardner, T.A.; Thomson, J.R.; Berenguer, E.; Lees, A.C.; Hughes, R.M.; MacNally, R.; et al. Integrated terrestrial–freshwater planning doubles conservation of tropical aquatic species. Science 2020, 370, 117–121. [Google Scholar] [CrossRef] [PubMed]
  9. Boix, D.; García-Berthou, E.; Gascón, S.; Benejam, L.L.; Tornés, E.; Sala, J.; Benito, J.; Munné, A.; Solà, C.; Sabater, S. Response of community structure to sustained drought in Mediterranean rivers. J. Hydrol. 2010, 383, 135–146. [Google Scholar] [CrossRef]
  10. Shanafield, M.; Bourke, S.A.; Zimmer, M.A.; Costigan, K.H. An overview of the hydrology of non–perennial rivers and streams. WIREs Water 2021, 8, e1504. [Google Scholar] [CrossRef]
  11. Commission of the European Communities. Wise Use and Conservation of Wetlands. Communication from the Commission to the Council and the European Parliament. COM(95) 189 Final; Office for Official Publications of the European Communities: Luxembourg; Brussels, Belgium, 1995. [Google Scholar]
  12. Zotos, A.; Kokkoris, I.P.; Charalampopoulos, I.; Bekri, E.S.; Dimopoulos, P. Wetlands in crisis: The silent desertification threat on the Greek wetlands. Land 2024, 13, 1567. [Google Scholar] [CrossRef]
  13. Rahel, F.J. Homogenization of freshwater faunas. Annu. Rev. Ecol. Evol. Syst. 2002, 33, 291–315. [Google Scholar] [CrossRef]
  14. Sargac, J.; Johnson, R.K.; Burdon, F.J.; Truchy, A.; Rîşnoveanu, G.; Goethals, P.; McKie, B.G. Forested riparian buffers change the taxonomic and functional composition of stream invertebrate communities in agricultural catchments. Water 2021, 13, 1028. [Google Scholar] [CrossRef]
  15. Vilenica, M.; Rebrina, F.; Matoničkin Kepčija, R.; Šegota, V.; Rumišek, M.; Ružanović, L.; Brigić, A. Aquatic macrophyte vegetation promotes taxonomic and functional diversity of Odonata assemblages in intermittent karst rivers in the Mediterranean. Diversity 2022, 14, 31. [Google Scholar] [CrossRef]
  16. Beaujour, P.M.; Loranger-Merciris, G.; Cézilly, F. Sites and species contribution to the β-diversity of Odonata assemblages in Haiti: Implications for conservation. Glob. Ecol. Conserv. 2024, 50, e02816. [Google Scholar] [CrossRef]
  17. Allan, J.D.; Castillo, M.M. Stream Ecology: Structure and Function of Running Waters; Chapman and Hall: New York, NY, USA, 2007. [Google Scholar]
  18. Ball-Damerow, J.E.; M’Gonigle, L.K.; Resh, V.H. Changes in occurrence, richness, and biological traits of dragonflies and damselflies (Odonata) in California and Nevada over the past century. Biodivers. Conserv. 2014, 23, 2107–2126. [Google Scholar] [CrossRef]
  19. Gimenez, B.C.; Higuti, J. Land use effects on the functional structure of aquatic insect communities in Neotropical streams. Inland Waters 2017, 7, 305–313. [Google Scholar] [CrossRef]
  20. Corbet, P.S. Dragonflies: Behaviour and Ecology of Odonata; Harley Books: Colchester, UK, 1999. [Google Scholar]
  21. Cordoba-Aguilar, A.; Beatty, C.D.; Bried, J.T. Dragonflies & Damselflies: Model Organisms for Ecological and Evolutionary Research, 2nd ed.; Oxford University Press: Oxford, UK, 2022. [Google Scholar]
  22. Kalkman, V.J.; Clausnitzer, V.; Dijkstra, K.D.B.; Orr, A.G.; Paulson, D.; van Tol, J. Global diversity of dragonflies (Odonata) in freshwater. Hydrobiologia 2008, 595, 351–363. [Google Scholar] [CrossRef]
  23. Rodrigues, M.E.; de Oliveira Roque, F.; Quintero, J.M.O.; de Castro Pena, J.C.; de Souza, D.C.; De Marco, P. Nonlinear responses in damselfly community along a gradient of habitat loss in a savanna landscape. Biol. Conserv. 2016, 194, 113–120. [Google Scholar] [CrossRef]
  24. Dolný, A.; Harabiš, F.; Bárta, D.; Lhota, S.; Drozd, P. Aquatic insects indicate terrestrial habitat degradation: Changes in taxonomical structure and functional diversity of dragonflies in tropical rainforest of East Kalimantan. Trop. Zool. 2012, 25, 141–157. [Google Scholar] [CrossRef]
  25. Oliveira-Junior, J.M.B.; De Marco, P.; Dias-Silva, K.; Leitão, R.P.; Leal, C.G.; Pompeu, P.S.; Gardner, T.A.; Hughes, R.M.; Juen, L. Effects off human disturbance and riparian conditions on Odonata (Insecta) assemblages in eastern Amazon basin streams. Limnologica 2017, 66, 31–39. [Google Scholar] [CrossRef]
  26. Monteiro-Júnior, C.S.; Juen, L.; Hamada, N. Analysis of urban impacts of aquatic habitats in the central Amazon basin: Adult odonates as bioindicators of environmental quality. Ecol. Indic. 2015, 48, 303–311. [Google Scholar] [CrossRef]
  27. Clausnitzer, V.; Kalkman, V.J.; Ram, M.; Collen, B.; Baillie, J.E.; Bedjanič, M.; Darwall, W.R.T.; Dijkstra, K.-D.B.; Dowf, R.; Hawking, J.; et al. Odonata enter the biodiversity crisis debate: The first global assessment of an insect group. Biol. Conserv. 2009, 142, 1864–1869. [Google Scholar] [CrossRef]
  28. De Knijf, G.; Billqvist, M.; van Grunsven, R.H.A.; Prunier, F.; Vinko, D.; Trottet, A.; Bellotto, V.; Clay, J.; Allen, D.J. Measuring the Pulse of European Biodiversity. European Red List of Dragonflies & Damselflies (Odonata); European Commission: Brussels, Belgium, 2024. [Google Scholar]
  29. The Greek Red List. Available online: https://redlist.necca.gov.gr (accessed on 27 May 2025).
  30. Smith, J.; Samways, M.J.; Taylor, S. Assessing riparian quality using two complementary sets of bioindicators. Biodivers. Conserv. 2007, 16, 2695–2713. [Google Scholar] [CrossRef]
  31. Silva, D.P.; De Marco, P., Jr.; Resende, D.C. Adult Odonate abundance and community assemblage measures as indicators of stream ecological integrity: A case study. Ecol. Indic. 2010, 10, 744–752. [Google Scholar] [CrossRef]
  32. Simaika, J.P.; Samways, M.J. Comparative assessment of indices of freshwater habitat conditions using different invertebrate taxon sets. Ecol. Indic. 2011, 11, 370–378. [Google Scholar] [CrossRef]
  33. De Marco Júnior, P.; Batista, J.D.; Cabette, H.S.R. Community assembly of adult odonates in tropical streams: An ecophysiological hypothesis. PLoS ONE 2015, 10, e0123023. [Google Scholar] [CrossRef] [PubMed]
  34. Ribeiro, C.; Juen, L.; Rodrigues, M.E. The Zygoptera/Anisoptera ratio as a tool to assess anthropogenic changes in Atlantic Forest streams. Biodivers. Conserv. 2021, 30, 1315–1329. [Google Scholar] [CrossRef]
  35. Ribeiro, C.; Rodrigues, M.E.; Sahlén, G.; de Oliveira Roque, F. Dragonflies within and outside a protected area: A comparison revealing the role of well–preserved atlantic forests in the preservation of critically endangered, phytotelmatous species. J. Insect Conserv. 2022, 26, 271–282. [Google Scholar] [CrossRef]
  36. Flenner, I.; Sahlén, G. Dragonfly community re–organization in boreal forestlakes: Rapid species turnover driven by climate change? Insect Conserv. Divers. 2008, 1, 169–179. [Google Scholar] [CrossRef]
  37. Harabiš, F.; Dolný, A. Human altered ecosystems: Suitable habitats as well as ecological traps for dragonflies (Odonata): The matter of scale. J. Insect Conserv. 2012, 16, 121–130. [Google Scholar] [CrossRef]
  38. Golfieri, B.; Hardersen, S.; Maiolini, B.; Surian, N. Odonates as indicators of the ecological integrity of the river corridor: Development and application of the Odonate River Index (ORI) in northern Italy. Ecol. Indic. 2016, 61, 234–247. [Google Scholar] [CrossRef]
  39. Rodrigues, M.E.; Roque, F.O.; Ferreira, R.G.N.; Saito, V.S.; Samways, M.J. Egg–laying traits reflect shifts in dragonfly assemblages in response to different amount of tropical forest cover. Insect Conserv. Divers. 2018, 11, 231–240. [Google Scholar] [CrossRef]
  40. de Bello, F.; Carmona, C.P.; Mason, N.W.H.; Sebastià, M.-T.; Lepš, J. Which trait dissimilarity for functional diversity: Trait means or trait overlap? J. Veg. Sci. 2013, 24, 807–819. [Google Scholar] [CrossRef]
  41. Rocha-Ortega, M.; Rodríguez, P.; Córdoba-Aguilar, A. Spatial and temporal effects of land use change as potential drivers of odonate community composition but not species richness. Biodivers. Conserv. 2019, 28, 451–466. [Google Scholar] [CrossRef]
  42. Mendes, T.P.; de Assis Montag, L.F.; Alvarado, S.T.; Juen, L. Assessing habitat quality on alpha and beta diversity of Odonata larvae (Insect) in logging areas in Amazon forest. Hydrobiologia 2021, 848, 1147–1161. [Google Scholar] [CrossRef]
  43. Legendre, P.; De Cáceres, M. Beta diversity as the variance of community data: Dissimilarity coefficients and partitioning. Ecol. Lett. 2013, 16, 951–963. [Google Scholar] [CrossRef] [PubMed]
  44. Olsen, K.; Svenning, J.C.; Balslev, H. Niche breadth predicts geographical range size and northern range shift in European dragonfly species (Odonata). Diversity 2022, 14, 719. [Google Scholar] [CrossRef]
  45. Wildermuth, H. Dragonflies recognize the water of rendezvous and oviposition sites by horizontally polarized light: A behavioural field test. Naturwissenschaften 1998, 85, 297–302. [Google Scholar] [CrossRef]
  46. Bossard, M.; Feranec, J.; Otahel, J. CORINE Land Cover Technical Guide: Addendum 2000; European Environment Agency: Copenhagen, Denmark, 2000. [Google Scholar]
  47. Dimopoulos, P.; Bergmeier, E.; Fischer, P. Natura 2000 habitat types of Greece evaluated in the light of distribution, threat and responsibility. Biol. Environ. 2006, 106, 175–187. [Google Scholar] [CrossRef]
  48. Zanaga, D.; Van De Kerchove, R.; Daems, D.; De Keersmaecker, W.; Brockmann, C.; Kirches, G.; Wevers, J.; Cartus, O.; Santoro, M.; Fritz, S.; et al. ESA WorldCover 10 m 2021 v200. 2022. Available online: https://zenodo.org/records/7254221 (accessed on 27 May 2025).
  49. Schorr, M.; Paulson, D.; Deliry, C. World Odonata List. 2025. Available online: https://www.pugetsound.edu/puget-sound-museum-natural-history/biodiversity-resources/insects/dragonflies/world-odonata-list (accessed on 27 May 2025).
  50. Anderson, M.J. A new method for non-parametric multivariate analysis of variance. Austral Ecol. 2001, 26, 32–46. [Google Scholar]
  51. Oksanen, J.; Blanchet, F.G.; Friendly, M.; Kindt, R.; Legendre, P.; McGlinn, D.; Minchin, P.R.; O’Hara, R.B.; Simpson, G.L.; Solymos, P.; et al. The ‘vegan’ Package. 2007. Available online: https://cran.r-project.org/web/packages/vegan/index.html (accessed on 10 July 2025).
  52. Anderson, M.J. Distance-based tests for homogeneity of multivariate dispersions. Biometrics 2006, 62, 245–253. [Google Scholar] [CrossRef] [PubMed]
  53. Dufrêne, M.; Legendre, P. Species assemblages and indicator species: The need for a flexible assymetrical approach. Ecol. Monogr. 1997, 67, 345–366. [Google Scholar] [CrossRef]
  54. McCune, B.; Mefford, M.J. PC-ORD, version 6.21; Multivariate Analysis of Ecological Data; MjM Software: Gleneden Beach, OR, USA, 2011. [Google Scholar]
  55. Jost, L. Entropy and diversity. Oikos 2006, 113, 363–375. [Google Scholar] [CrossRef]
  56. Ellingsen, K.E.; Clarke, K.R.; Somerfield, P.J.; Warwick, R.M. Taxonomic distinctness as a measure of diversity applied over a large scale: The benthos of the Norwegian continental shelf. J. Anim. Ecol. 2005, 74, 1069–1079. [Google Scholar] [CrossRef]
  57. Freitag, S.; Jaarsveld, A.V. Relative occupancy, endemism, taxonomic distinctiveness and vulnerability: Prioritizing regional conservation actions. Biodivers. Conserv. 1997, 6, 211–232. [Google Scholar] [CrossRef]
  58. Laliberte, E.; Legendre, P. A distance-based framework for measuring functional diversity from multiple traits. Ecology 2010, 91, 299–305. [Google Scholar] [CrossRef] [PubMed]
  59. Botta-Dukat, Z. Rao’s quadratic entropy as a measure of functional diversity based on multiple traits. J. Veg. Sci. 2005, 16, 533–540. [Google Scholar] [CrossRef]
  60. Dijkstra, K.-D.B.; Lewington, R. Field Guide to the Dragonflies of Britain and Europe; British Wildlife Publishing: Gillingham, Dorset, UK, 2006. [Google Scholar]
  61. Cancellario, T.; Miranda, R.; Baquero, E.; Fontaneto, D.; Martínez, A.; Mammola, S. Climate change will redefine taxonomic, functional, and phylogenetic diversity of Odonata in space and time. npj Biodivers. 2022, 1, 1. [Google Scholar] [CrossRef] [PubMed]
  62. Boudot, J.-P.; Kalkman, V.J. Atlas of the European Dragonflies and Damselflies; KNNV Publishing: Zeist, The Netherlands, 2015. [Google Scholar]
  63. Harabiš, F.; Hronková, J. European database of the life-history, morphological and habitat characteristics of dragonflies (Odonata). Eur. J. Entomol. 2020, 117, 302–308. [Google Scholar] [CrossRef]
  64. Jödicke, R. Die Binsenjungfern und Winterlibellen Europas: Lestidae; Die Neue Brehm-Bucherei: Westarp, Germany, 1997. [Google Scholar]
  65. Sternberg, K. Die postglaziale Besiedlung Mitteleuropas durch Libellen, mit besonderer Berücksichtigung Südwestdeutschlands (Insecta, Odonata). The postglacial colonization of Central Europe by dragonflies, with special reference to southwestern Germany (Insecta, Odonata). J. Biogeogr. 1998, 25, 319–337. [Google Scholar] [CrossRef]
  66. Viza, A.; Garcia-Raventós, A.; Ll Riera, J.; Maynou, X.; Martín, R.; Prunier, F.; El Haissoufi, M.; Múrria, C. Species-specific functional traits rather than phylogenetic relatedness better predict future range-shift responses of odonates. Insect Conserv. Diver. 2023, 16, 574–587. [Google Scholar] [CrossRef]
  67. Schneider, W. Eine Massenwanderung von Selysiothemis nigra (Vander Linden, 1825) (Odonata: Macrodiplactidae) und Lindenia tetraphylla (Vander Linden, 1825) (Odonata: Gomphidae) in Südjordanien. Entomol. Z. 1981, 91, 97–102. [Google Scholar]
  68. Martens, A. Die Federlibellen Europas (Platycnemididae); Westarp & Spektrum: Magdeburg, Germany, 1996. [Google Scholar]
  69. Sternberg, K.; Buchwald, R. Die Libellen Baden Band 2: Grosslibellen (Anisoptera); Ulmer Verlang: Stuttgart, Germany, 2000. [Google Scholar]
  70. Rüppell, G.; Hilfert-Rüppell, D.; Rehfeldt, G.; Schütte, C. Die Prachtlibellen Europas; Westarp Wissenschaften: Hohenwarsleben, Germany, 2005. [Google Scholar]
  71. Harabiš, F.; Dolný, A. The effect of ecological determinants on the dispersal abilities of Central European dragonflies (Odonata). Odonatologica 2011, 41, 17–26. [Google Scholar]
  72. Wildermuth, H. Perching behaviour in Lindenia tetraphylla - a distinctive feature among European Clubtails (Odonata: Gomphidae). Not. Odonatol. 2014, 8, 55–66. [Google Scholar]
  73. Hilfert-Rüppell, D. To stay or not to stay: Decision-making during territorial behaviour of Calopteryx haemorrhoidalis and Calopteryx splendens splendens (Zygoptera: Calopterygidae). Int. J. Odonatol. 1999, 2, 167–175. [Google Scholar] [CrossRef]
  74. Wildermuth, H.; Martens, A. Taschenlexikon der Libellen Europas: Alle Arten von den Azoren bis zum Ural im Porträt; Quelle & Meyer: Wiebelsheim, Germany, 2014. [Google Scholar]
  75. Suhling, F.; Müller, O. Die Flußjungfern Europas (Gomphidae); Westarp: Magdeburg, Germany; 237p.
  76. Sternberg, K.; Buchwald, R. Die Libellen Baden Band 1: Kleinlibellen (Zygoptera); Ulmer Verlang: Stuttgart, Germany, 1999. [Google Scholar]
  77. Samways, M.J.; Simaika, J.P. Manual of Freshwater Assessment for South Africa: Dragonfly Biotic Index; South African National Biodiversity Institute (SANBI): Pretoria, South Africa, 2016. [Google Scholar]
  78. Hammer, Ø.; Harper, D.A.T.; Ryan, P.D. PAST: Paleontological statistics software package for education and data analysis. Palaeontol. Electron. 2001, 4, 1–9. [Google Scholar]
  79. Baselga, A.; Orme, C.D.L. betapart: An R package for the study of beta diversity. Methods Ecol. Evol. 2012, 3, 808–812. [Google Scholar] [CrossRef]
  80. Baselga, A. Partitioning the turnover and nestedness components of beta diversity. Glob. Ecol. Biogeogr. 2010, 19, 134–143. [Google Scholar] [CrossRef]
  81. Dray, S.; Bauman, D.; Blanchet, G.; Borcard, D.; Clappe, S.; Guénard, G.; Jombart, T.; Larocque, G.; Legendre, P.; Madi, N.; et al. Package ‘adespatial’. 2018. Available online: https://cran.r-project.org/package=adespatial (accessed on 27 May 2025).
  82. Worthen, W.B.; Guevara-Mora, M. The Effects of Light Environment on Adult Odonate Communities in Disturbed and Intact Forest: The Importance of Small-Scale Effects. Diversity 2024, 16, 557. [Google Scholar] [CrossRef]
  83. Carvalho, F.G.; Duarte, L.; Nakamura, G.; dos Santos-Seger, G.D.; Juen, L. Changes of phylogenetic and taxonomic diversity of Odonata (Insecta) in response to land use in Amazonia. Forests 2021, 12, 1061. [Google Scholar] [CrossRef]
  84. Pereira-Moura, L.; Veras, D.S.; de Carvalho, F.G.; Juen, L.; Couceiro, S.R.M. Habitat specificity and morphology-main filters for the distribution of Odonata in the Cerrado Maranhense, Brazil. Aquat. Ecol. 2023, 57, 443–458. [Google Scholar] [CrossRef]
  85. Renner, S.; Périco, E.; Dalzochio, M.S.; Sahlén, G. Water body type and land cover shape the dragonfly communities (Odonata) in the Pampa biome, Rio Grande do Sul, Brazil. J. Insect Conserv. 2018, 22, 113–125. [Google Scholar] [CrossRef]
  86. Seidu, I.; Danquah, E.; Ayine Nsor, C.; Amaning Kwarteng, D.; Lancaster, L.T. Odonata community structure and patterns of land use in the Atewa Range Forest Reserve, Eastern Region (Ghana). Int. J. Odonatol. 2017, 20, 173–189. [Google Scholar] [CrossRef]
  87. Kietzka, G.J.; Pryke, J.S.; Samways, M.J. Comparative effects of urban and agricultural land transformation on Odonata assemblages in a biodiversity hotspot. Basic Appl. Ecol. 2018, 33, 89–98. [Google Scholar] [CrossRef]
  88. Dolný, A.; Ožana, S.; Burda, M.; Harabiš, F. Effects of landscape patterns and their changes to species richness, species composition, and the conservation value of Odonates (Insecta). Insects 2021, 12, 478. [Google Scholar] [CrossRef] [PubMed]
  89. Pires, M.M.; Sahlén, G.; Périco, E. Agricultural land use affects the heterogeneity of Odonata communities in the Brazilian Pampa. J. Insect Conserv. 2022, 26, 503–514. [Google Scholar] [CrossRef]
  90. Calvão, L.B.; Brito, J.D.S.; Ferreira, D.; Cunha, E.J.; Oliveira-Junior, J.M.B.; Juen, L. Effects of the loss of forest cover on odonate communities in eastern Amazonia. J. Insect Conserv. 2023, 27, 205–218. [Google Scholar] [CrossRef]
  91. Juen, L.; De Marco, P., Jr. Odonate biodiversity in terra-firme forest streamlets in Central Amazonia: On the relative effects of neutral and niche drivers at small geographical extents. Insect Conserv. Divers. 2011, 4, 265–274. [Google Scholar] [CrossRef]
  92. Corbet, P.S.; May, M.L. Fliers and perchers among Odonata: Dichotomy or multidimensional continuum? A provisional reappraisal. Int. J. Odonatol. 2008, 11, 155–171. [Google Scholar] [CrossRef]
  93. Monteiro Júnior, C.S.; Couceiro, S.R.M.; Hamada, N.; Juen, L. Effect of vegetation removal for road building on richness and composition of Odonata communities in Amazonia, Brazil. Int. J. Odonatol. 2013, 16, 135–144. [Google Scholar] [CrossRef]
  94. Koparde, P.; Mhaske, P.; Patwardhan, A. Habitat correlates of Odonata species diversity in the northern Western Ghats, India. Odonatologica 2015, 44, 21–43. [Google Scholar]
  95. Calvão, L.B.; Nogueira, D.S.; de Assis Montag, L.F.; Lopes, M.A.; Juen, L. Are Odonata communities impacted by conventional or reduced impact logging? For. Ecol. Manag. 2016, 382, 143–150. [Google Scholar] [CrossRef]
  96. Hofhansl, F.P.; Schneeweihs, S. Banderillas: Effects of deforestation on dragonflies (Insecta, Odonata) in the Pacific lowland of Costa Rica. Zugleich Kat. Der Oberösterr. Landesmuseen N.S. 2008, 80, 237–247. [Google Scholar]
  97. French, S.K.; McCauley, S.J. Canopy cover affects habitat selection by adult dragonflies. Hydrobiologia 2018, 818, 129–143. [Google Scholar] [CrossRef]
  98. Miguel, T.B.; Oliveira-Junior, J.M.B.; Ligeiro, R.; Juen, L. Odonata (Insecta) as a tool for the biomonitoring of environmental quality. Ecol. Indic. 2017, 81, 555–566. [Google Scholar] [CrossRef]
  99. Hendriks, J.A.; Mariaty; Maimunah, S.; Anirudh, N.B.; Holly, B.A.; Erkens, R.H.; Harrison, M.E. Odonata (Insecta) communities in a lowland mixed mosaic forest in Central Kalimantan, Indonesia. Ecologies 2023, 4, 55–73. [Google Scholar] [CrossRef]
  100. Resende, D.C. Activity patterns and thermoregulation in a tropical dragonfly assemblage. Odonatologica 2002, 31, 129–138. [Google Scholar]
  101. Heiser, M.; Schmitt, T. Do different dispersal capacities influence the biogeography of the western Palearctic dragonflies (Odonata)? Biol. J. Linn. Soc. 2010, 99, 177–195. [Google Scholar] [CrossRef]
  102. Dutra, S.; De Marco, P. Bionomic differences in odonates and their influence on the efficiency of indicator species of environmental quality. Ecol. Indic. 2015, 49, 132–142. [Google Scholar] [CrossRef]
  103. Carvalho, F.G.; Pinto, N.S.; Oliveira-Junior, J.M.B.; Juen, L. Effects of marginal vegetation removal on Odonata communities. Acta Limnol. Bras. 2013, 25, 10–18. [Google Scholar] [CrossRef]
  104. Corbet, P.S.; Brooks, S.J. Dragonflies; Collins New Naturalist Library; HarperCollins Publishers: London, UK, 2008. [Google Scholar]
  105. Kietzka, G.J.; Pryke, J.S.; Samways, M.J.; Leather, S.R.; Sahlen, G. Landscape ecological networks are successful in supporting a diverse dragonfly assemblage. Insect Conserv. Divers. 2015, 8, 229–237. [Google Scholar] [CrossRef]
  106. Cunningham-Minnick, M.J.; Meyer, T.B.; Crist, T.O. Shifts in dragonfly community structure across aquatic ecotones. Int. J. Odonatol. 2019, 22, 121–133. [Google Scholar] [CrossRef]
  107. Remsburg, A.J.; Olson, A.C.; Samways, M.J. Shade alone reduces adult dragonfly (Odonata: Libellulidae) abundance. J. Insect Behav. 2008, 21, 460–468. [Google Scholar] [CrossRef]
  108. Horváth, G. Reflection-polarization patterns at flat water surfaces and their relevance for insect polarization vision. J. Theor. Biol. 1995, 175, 27–37. [Google Scholar] [CrossRef] [PubMed]
  109. Holuša, O. Expansion of Erythromma lindenii (Selys, 1840) (Odonata: Coenagrionidae) is still ongoing: Settlement of Central Europe by various migratory routes. Libellula 2023, 42, 49–61. [Google Scholar]
  110. Tatarkiewicz, D. Sites of the emergence of the Scarce Chaser Libellula fulva (O.F. Müller, 1764) (Odonata: Libellulidae) in the forest of Puszcza Notecka. Odonatrix 2010, 6, 21–29. [Google Scholar]
  111. Hacet, N.; Aktaç, N. Two new records of Odonata (Gomphidae) for Turkey, Gomphus flavipes (Charpentier, 1825) and Ophiogomphus cecilia (Geoffroy in Fourcroy, 1785), with distributional notes on G. flavipes and G. ubadschii Schmidt, 1953. Entomol. News 2008, 119, 81–89. [Google Scholar] [CrossRef]
  112. Hardersen, S. The dragonflies: Species, phenology, larval habitats (Odonata). In Invertebrati di una foresta della Pianura Padana, Bosco della Fontana, Secondo contributo; Ceretti, P.H., Mason, S., Nardi, F., Tisato, G., Zapparoli, M., Eds.; Conservatione Habitat Invertebrati: Verona, Italy, 2004; pp. 29–50. [Google Scholar]
  113. Borkenstein, A.; Jödicke, R. Thermoregulatory behaviour of Sympetrum striolatum at low temperatures with special reference to the role of direct sunlight (Odonata: Libellulidae). Odonatologica 2022, 51, 83–109. [Google Scholar] [CrossRef]
  114. Basel, A.M.; Simaika, J.P.; Samways, M.J.; Midgley, G.F.; Latombe, G.; MacFadyen, S.; Hui, C. Drivers of compositional turnover in narrow-ranged and widespread dragonflies and damselflies in Africa. Insect Conserv. Divers. 2024, 17, 501–511. [Google Scholar] [CrossRef]
  115. Devictor, V.; Julliard, R.; Jiguet, F. Distribution of specialist and generalist species along spatial gradients of habitat disturbance and fragmentation. Oikos 2008, 117, 507–514. [Google Scholar] [CrossRef]
  116. De, K.; Dey, D.; Shruti, M.; Uniyal, V.P.; Adhikari, B.S.; Johnson, J.A.; Hussain, S.A. β-diversity of odonate community of the Ganga River: Partitioning and insights from local and species contribution. Wetl. Ecol. Manag. 2023, 31, 899–912. [Google Scholar] [CrossRef]
  117. Nascimento, A.C.L.; Martins, A.R.; Dias-Silva, K.; Juen, L.; Mortati, A.F.; Oliveira-Junior, J.M.B. Species and Site Contributions to Odonata adult assemblage uniqueness in Brazilian Amazon streams. J. Insect Conserv. 2025, 29, 13. [Google Scholar] [CrossRef]
  118. Kokkoris, I.; Dimopoulos, P.; Xystrakis, F.; Tsiripidis, I. National scale ecosystem condition assessment with emphasis on forest types in Greece. One Ecosyst. 2018, 3, e25434. [Google Scholar] [CrossRef]
Figure 1. The sampling sites are at the wetland complex of Thermaikos Gulf in northern Greece. 1, Haliacmon river; 2, Almyravlakas canal; 3, Loudias river; 4, Axios river; 5, Gallikos river.
Forests 16 01181 g001
Figure 2. PCA ordination plot of Odonata assemblages (both suborders) across WorldCover classes based on their composition. Black: BV, blue: CR, green: GR, gray: HW, red: TC.
Forests 16 01181 g002
Figure 3. The average Odonate abundance and species richness per sampling site. HA, Haliacmon; AL, Almyravlakas; LO, Loudias; AX, Axios; GA, Gallikos.
Forests 16 01181 g003
Figure 4. Average ± SD of (a) species richness, (b) abundance, (c) Simpson index, (d) Effective Number of Species, (e) Relative Taxonomic Distinctness, (f) Mean uniqueness, (g) local contribution to beta diversity based on abundance, (h) functional dispersion, (i) Rao’s quadratic entropy, (j) Dragonfly Biotic Index, (k) Conservation Value Index, and (l) percentage of CVI > 1 of Odonata site assemblages at the five ESA WorldCover 2021 v200 categories. Gray bars: all Odonata, solid line: Anisoptera, dotted line: Zygoptera. BV, bare/sparse vegetation; CR, cropland; GR, grassland; HW, herbaceous wetland; TC, tree cover.
Forests 16 01181 g004
Figure 5. Relation of SCBD of Odonate species with (a) sites occupied, (b) abundance, and (c) uniqueness.
Forests 16 01181 g005
Figure 6. Sampling sites with CVI > 1.5 in our study.
Forests 16 01181 g006
Table 1. The total number of observations per species at each river/canal.
SuborderSpeciesHaliacmonAlmyravlakasLoudiasAxiosGallikos
ZygopteraCalopteryx splendens253 556
ZygopteraErythromma lindenii 5
ZygopteraErythromma viridulum2 1617
ZygopteraIschnura elegans10113073580188
ZygopteraChalcolestes parvidens 1
ZygopteraLestes barbarus 42
ZygopteraLestes macrostigma 17 1
ZygopteraPlatycnemis pennipes2065123187
AnisopteraAeshna affinis16
AnisopteraAeshna mixta9 52
AnisopteraAnax imperator 1315
AnisopteraAnax parthenope2512229
AnisopteraIsoaeshna isoceles 41
AnisopteraGomphus vulgatissimus2
AnisopteraLindenia tetraphylla3 318
AnisopteraOnychogomphus forcipatus2 94
AnisopteraOphiogomphus cecilia 1
AnisopteraStylurus flavipes1
AnisopteraCrocothemis erythraea306168175888257
AnisopteraLibellula fulva21 3
AnisopteraOrthetrum albistylum1123849271130
AnisopteraOrthetrum brunneum1 417
AnisopteraOrthetrum cancellatum571577910
AnisopteraOrthetrum coerulescens9 2124
AnisopteraSympetrum fonscolombii2066584323227
AnisopteraSympetrum meridionale7 6
AnisopteraSympetrum sanguineum 19
AnisopteraSympetrum striolatum1
Table 2. PERMDIST and one-way PERMANOVA results: F statistic, p values, and Bonferroni corrected significant pairwise tests among classes of each factor. BV, bare/sparse vegetation; CR, cropland; GR, grassland; HW, herbaceous wetland; TC, tree cover.
AnalysisFactor
(Classes)
TotalZygopteraAnisoptera
FpFpFp
PERMDISTRiver1.2960.240.5440.692.7510.031
Habitat4.3370.0012.5780.0113.1760.002
CLC5.0240.0011.8270.0613.630.001
ESA WorldCover1.1590.3520.580.6730.3780.846
PERMANOVARiver1.090.3320.9480.4771.7330.016
Habitat1.2240.1271.1990.2351.0330.413
CLC0.6750.6492.3540.080.0150.998
ESA WorldCover2.5360.0011.8430.0572.4330.003
(CR-HW)3.7430.003 2.7740.016
(BV-CR)3.8340.005 2.7610.01
(CR-GR)3.3070.008
(BV-GR)2.7590.015 3.9370.003
(BV-TC)2.3720.026
(CR-TC)2.3910.04 2.6280.017
(GR-TC)2.3910.04 2.4920.029
(GR-HW) 2.9170.012
Table 3. Kruskal–Wallis test results and Dunn’s post hoc test p values. Analyses with significant pairwise post hoc results after Bonferroni correction are presented. Affirmed significance per suborder is highlighted with superscript (A) for Anisoptera and (Z) for Zygoptera. S, species richness; 1-D, Simpson index; ENS, Effective Number of Species; RTD, Relative Taxonomic Distinctness, Mean U, Mean uniqueness; FDis, functional dispersion; RaoQ, Rao’s quadratic entropy; LCBD (ab), Local Contribution to Beta Diversity based on abundance data; DBI, Dragonfly Biotic Index; CVI, Conservation Value Index. Details for factor classes in Table S1. p values of pairwise post hoc analyses: *** < 0.001 < ** < 0.01 < * < 0.05.
FactorVariableHpDunn’s Post Hoc Test
RiverRTD (A)11.530.0212GA-HA *
Mean U (A,Z)12.660.0130HA-LO *
HabitatMean U (A)32.840.000692A0-92D0 **, 92A0-1410 *
LCBD (ab)42.691.23 × 10−592A0-92D0 *, 92A0-1410 *
WorldCoverS (A,Z)68.776.51 × 10−15BV-TC ***, CR-TC ***, GR-TC ***, BV-HW **, CR-HW **, GR-HW **
Abundance (Z)19.326.79 × 10−4CR-HW **, CR-TC **
1-D (Z)31.832.07 × 10−6BV-TC ***, CR-TC ***, GR-TC **
ENS (A,Z)56.221.80 × 10−11BV-TC ***, CR-TC ***, GR-TC ***, CR-HW **, BV-HW *
RTD (A,Z)60.861.92 × 10−12BV-TC ***, CR-TC ***, GR-TC ***, CR-HW **, GR-HW **
Mean U (A,Z)35.673.39 × 10−7GR-TC ***, HW-TC ***, BV-TC **, CR-TC *
LCBD (ab) (Z)18.351.10 × 10−3CR-HW *
FDis (A)29.865.22 × 10−6CR-TC ***, BV-TC *, GR-TC *, HW-TC *
RaoQ (A)26.732.26 × 10−5CR-TC ***, GR-TC **, BV-TC *, HW-TC *
DBI (A)29.067.61 × 10−6CR-TC ***, GR-TC **, BV-TC *, CR-HW *
Disclaimer/Publisher’s Note: The statements, opinions and data contained in all publications are solely those of the individual author(s) and contributor(s) and not of MDPI and/or the editor(s). MDPI and/or the editor(s) disclaim responsibility for any injury to people or property resulting from any ideas, methods, instructions or products referred to in the content.

