Article

Rural Digital Economy, Forest Ecological Product Value, and Farmers’ Income: Evidence from China

School of Economics and Management, Northeast Forestry University, Harbin 150040, China
*
Author to whom correspondence should be addressed.
Forests 2025, 16(7), 1172; https://doi.org/10.3390/f16071172
Submission received: 6 June 2025 / Revised: 9 July 2025 / Accepted: 10 July 2025 / Published: 16 July 2025
(This article belongs to the Section Forest Economics, Policy, and Social Science)

Abstract

The value realization of forest ecological products (VRF) is crucial for rural revitalization, while the rural digital economy (RDE) plays a central role in enhancing farmers’ income (FI). This study constructs index systems to evaluate the RDE and VRF using the entropy weight method and the input–output model. Based on panel data from 31 Chinese provinces (2011–2021), we employ a comprehensive analytical framework that includes spatiotemporal evolution analysis, benchmark regression models, mediation effect analysis, and heterogeneity analysis. The results of the benchmark regression models show that the RDE significantly boosts FI, with each unit of increase in the RDE leading to a 2579-unit rise in income. Spatiotemporal evolution analysis reveals that the positive effect of the RDE weakens from the Eastern coastal regions to the less developed Western regions. Furthermore, mediation effect analysis indicates that VRF mediates the relationship between the RDE and FI. Heterogeneity analysis demonstrates that the impact of the RDE varies across regions and income levels. These findings provide strong evidence of the role of the RDE in promoting FI and highlight VRF as a mediating mechanism, offering policy insights for integrating digital and ecological strategies to foster inclusive rural growth.

1. Introduction

The 2020 Rural Work Conference highlighted that resolving the “three rural issues” was a top priority for the Party, and concerted efforts from both the Party and society were needed to achieve rural revitalization. By the end of 2023, the Rural Work Conference had further stressed the importance of aligning new urbanization initiatives with the holistic development of rural areas, emphasizing that increasing FI must remain a central focus in addressing the “three rural issues” [1]. Despite significant economic progress following the reform and opening-up of China, an income gap persists between urban and rural areas and even within rural populations, and it tends to widen. For example, in 2023, rural residents in more developed regions reported a per capita disposable income of 26,196 CNY, which was 1.42 times greater than the 18,458 CNY earned by those in less developed areas. Therefore, tackling the challenges of enhancing FI and narrowing regional income gaps has become an urgent necessity [2].
The Ninth National Forest Resources Inventory reveals that China’s forest coverage has risen to 22.96, reflecting a 1.33 percentage point growth compared with the results from the Eighth Inventory. This translates to a forested area of 222 million hectares, representing 5.51% of the global total. Expanding forested land not only increases the value of ecological services and creates employment opportunities in the short term but also yields tangible forest and ecological products, converting ecological advantages into economic benefits [3]. Since 2019, several policy documents, such as the Digital Rural Strategy Outline and the Digital Rural Action Plan (2022–2025), have been introduced to advance the RDE by integrating digital technologies into agricultural and rural systems. The expansion of the digital economy, in conjunction with abundant forest resources in rural areas, shows considerable potential for increasing FI [4]. Hence, it is essential to evaluate the combined effects of the RDE and VRF on FI [5].

1.1. Studies on RDE and FI

As an emerging mode of economic organization, the digital economy has gained widespread recognition globally for its role in driving economic growth and serving as a pivotal mechanism for enhancing FI. Drawing from the experiences of Japan and China, Fan et al. (2006) [6] concluded that advancements in science and technology can effectively stimulate economic development at both national and regional levels. Similarly, Močnik et al. (2010) [7], through cross-national empirical analysis, demonstrated that digital technologies significantly contribute to income growth, with this effect being particularly pronounced in developed countries. From the perspective of the United Kingdom, Tiwasing et al. (2022) [8] underscored the transformative opportunities to rural enterprises presented by digital innovation, positioning it as a fundamental force behind rural development. In a regional study of Aragón, Spain, Playán et al. (2024) [9] observed that the integration of digital technologies and management systems into agriculture can modernize irrigation practices, facilitate agricultural intensification, and ultimately improve FI. Investigating a case in Jamaica, Johnson (2024) [10] found that digital information systems enhance productivity along the agricultural value chain by streamlining operations, eliminating intermediaries, lowering costs, and raising farmers’ profits. In the context of Nigeria’s rice value chain, Odewole et al. (2024) [11] highlighted the substantial productivity gains and improved living standards enabled by the adoption of digital tools. Likewise, Fakhraddine et al. (2025) [12] reported that the digitization and smart transformation of agriculture in Morocco has reduced the adverse effects of climate variability and environmental degradation, thereby improving overall production efficiency. Using China as a case study, Zhou et al. (2025) [13] confirmed the income-enhancing effects of digital inclusive finance and technological advancement for rural households. Collectively, these international studies offer compelling evidence that the digital economy plays a vital role in regional development and rural income enhancement, providing meaningful lessons and strategic references for other nations seeking to promote digital transformation and advance rural revitalization agendas.
The digital economy should be understood not as a single metric but as a comprehensive, multidimensional concept. To more accurately capture its influence on FI, researchers often employ a multifaceted framework to quantify the RDE, encompassing factors such as infrastructure, digital applications, and service delivery. For instance, Kim (2006) [14] evaluated South Korea’s digital infrastructure by considering indicators including communication devices, computers, personal computers, and computer components. Similarly, Burbridge et al. (2009) [15] assessed the state of digitalization in the United Kingdom by analyzing variables such as high-speed broadband availability, mobile networks, digital broadcasting, and digital radio. In Kazakhstan, Berdykulova, G. M. K. et al. (2014) [16] gauged the digital economy’s development through metrics like mobile phone penetration, information and communication technology (ICT) adoption, innovation capacity, and government e-services. Erdiaw-Kwasie et al. (2016) [17] focused on Australia’s RDE, assessing it via computer and broadband access alongside literacy and skills essential for full participation in the digital environment. Zhao et al. (2020) [18] measured digital economic development in Chinese urban clusters through dual dimensions of internet infrastructure and digital inclusive finance, utilizing indicators such as computers, broadband, mobile phones, employment in software and telecommunications sectors, and financial inclusion services. More recently, Fang et al. (2024) [19] examined China’s RDE from the angles of infrastructure and industrial digitalization, selecting indicators including broadband coverage, computer ownership, mobile phone usage, inclusive finance, delivery networks, and the emergence of Taobao villages.

1.2. Studies on VRF and FI

VRF has increasingly been recognized as a vital mechanism for converting ecological assets into tangible economic outcomes. This pathway holds particular significance in forest-rich rural regions, where it serves as an effective strategy to boost FI, foster green development, and achieve ecological prosperity. The multifaceted value of forest ecological products has gained broad acceptance in both academic research and policy agendas, encompassing economic, ecological, social, and cultural dimensions. Vosti et al. (2003), Sikora et al. (2012), Sonntag-Öströmet et al. (2014), and Kerchner et al. (2015) emphasized that leveraging forest resources—through timber commerce, nature-based tourism, forest health and wellness initiatives, and carbon credit trading—can drive rural revitalization and enhance livelihoods [20,21,22,23]. Zhu et al. (2017) and Jonsson et al. (2021) further demonstrated that forestry-related employment in areas such as logging, wood product manufacturing, timber sales, and non-timber forest product (NTFP) trade plays a critical role in expanding job opportunities for rural residents [24,25]. In addition, Agnoletti et al. (2022) and Jaung et al. (2022) argued that forests not only embody local heritage, traditional ecological knowledge, and collective identity, but also present novel possibilities for cultural and recreational engagement—particularly in light of digital innovations such as the “metaverse” [26,27]. Furthermore, Kacprzak et al. (2024), Wang et al. (2025), and Zhang et al. (2025) underscored the essential ecological functions of forests, including oxygen production, pollutant filtration, wildlife habitat support, flood regulation, erosion prevention, and desertification control [28,29,30]. These ecosystem services collectively contribute to enhancing regional ecological resilience and environmental sustainability.
A growing body of research has explored various methodologies for assessing VRF. Representative approaches include ecosystem service valuation [31], ecological footprint analysis [32], market-based valuation [33], shadow pricing techniques [34], input–output modeling [35], the two-stage evaluation method [36], and complex network analysis [37]. Collectively, these methods offer a robust theoretical framework and practical tools for capturing the multifaceted value embedded in forest ecological products.

1.3. The Synergistic Mechanism Linking RDE, VRF, and FI

In recent years, increasing scholarly attention has been directed toward investigating the underlying mechanisms through which the digital economy affects FI, with a particular focus on clarifying the specific pathways that facilitate rural income enhancement. Within rural contexts, digital technologies contribute positively to income growth by improving digital infrastructure, fostering the integration of rural industries, extending the reach of digital financial services, diversifying agricultural product marketing channels, and restructuring rural employment patterns. Empirical studies conducted across rural regions in China, the European Union, the United States, and the United Kingdom have consistently shown that the development of the digital economy—through advancements in information and communication technologies [38], broadband expansion [39,40], and transportation infrastructure [41]—can significantly promote rural economic development, thereby enhancing household income. By elevating total factor productivity, the digital economy supports the transition of rural industries toward greater intensification, specialization, environmental sustainability, integration, and operational efficiency. This evolution not only accelerates agricultural modernization and rural industrial convergence but also injects renewed vitality into the broader rural revitalization agenda [42,43,44]. Moreover, digital information systems help to dismantle longstanding information asymmetries and enhance farmers’ access to essential financial services such as credit, thereby ensuring the stability of both agricultural production and rural livelihoods [45,46]. Digital platforms—including e-commerce and livestreaming—have further broadened market access and created diverse non-agricultural employment opportunities, effectively improving income levels through more efficient allocation of rural labor resources [47,48]. Collectively, these findings deepen our comprehension of the functional pathways linking the digital economy to income generation and offer valuable empirical insights for the development of more precisely targeted rural policy interventions.
While a growing number of scholars have begun to investigate the role of digitalization in fostering green and sustainable development, the majority of existing studies remain concentrated on domains such as energy efficiency, carbon mitigation, sustainable agriculture, and ecological well-being. For example, innovations in digital technologies have been shown to improve the efficiency of energy and resource utilization, thereby facilitating sustainable production and consumption within enterprises [49,50]. Digital transformation enables firms to lower resource use and minimize environmental degradation, with particularly significant impacts on reducing carbon emissions [51,52]. In the agricultural sector, the digital economy has encouraged the implementation and progression of eco-friendly technologies, providing viable avenues toward sustainable farming and supporting the formation of circular agricultural systems that enhance resource utilization and environmental performance [53,54]. In addition, digitalization has profoundly altered both production and lifestyle patterns, contributing substantially to improvements in human well-being and promoting sustainable urban development [55,56].
Despite these advancements, VRF has received little attention in the context of the RDE’s influence on FI. Few studies have systematically incorporated this component into a unified analytical framework. The tripartite mechanism—linking RDE, VRF, and FI—remains underexplored. To bridge this gap, the present study proposes an integrated framework that connects these three elements. It aims to clarify the mediating role of VRF and the reinforcing effect of RDE in this relationship, thereby addressing the pressing issue of how ecological value can be effectively converted into income for rural populations. This framework not only extends the conceptual scope of RDE research but also contributes to filling a significant void in the current literature.
To enhance readers’ comprehension of the key themes and purposes of the cited studies, this paper presents a summary table of the references, thereby improving the clarity and coherence of the literature review section, as shown in Table 1.

2. Research Hypothesis

The RDE contributes to increasing local FI by facilitating industrial transformation, reshaping employment patterns, and expanding market access. Moreover, the level of the RDE varies from one location to another due to differences in residents’ educational attainment and regional economic development. These differences result in varying degrees of impact on FI, influencing both the extent of income improvement and the demographic groups that benefit from it.

2.1. The Mechanisms Through Which RDE Influences FI

RDE contributes to increasing FI primarily in three key areas, the first being promoting industrial upgrading. The growth of RDE promotes its deep fusion with agriculture, driving the modernization and restructuring of rural industries [57]. The second key area involved adjusting employment structure. The RDE creates more high-quality employment opportunities for low-income groups in rural areas, thus encouraging rural residents to continuously improve their knowledge and skills, which contributes to an increase in revenue channels and narrows the income gap [58]. The third key area consists of broadening the sales channels. The RDE enhances FI opportunities by connecting farmers with broader consumer markets through e-commerce platforms, which expands both sales channels and revenue sources [59]. FI is influenced by the RDE through various channels. In addition to directly offering them nonfarm jobs, such as careers as data analysts and rural e-commerce agents, as well as jobs in other new professions, which pay more than agricultural jobs, the digital economy gives farmers access to a wider range of employment options. It can also indirectly increase the value of agricultural products by improving labor productivity; for example, intelligent irrigation systems or precision agriculture technology have increased labor costs and improved the quantity and quality of agricultural products. Furthermore, digital sales methods, including live-streaming and personalized product recommendations, enhance product value, broaden market reach, and improve competitiveness, all of which contribute to higher income for farmers. In summary, we present Hypothesis 1, as follows:
Hypothesis 1.
The RDE has a significant positive effect on FI.
The impact of the RDE on FI varies across geographic regions. Economically developed regions tend to enjoy more “digital dividends”, whereas economically backward regions experience difficulties converting natural resources, such as forests, into economic benefits, even if such resources are abundant [60]. In China, the influence of the RDE on income generation varies significantly across regions, showing a clear trend of increasing impact from the Eastern to the Western regions [61]. Various effects of the RDE on FI are influenced by numerous factors, including policy differences, local environmental conditions, farmers’ education levels, and regional economic sectors. In economically developed areas, such as Eastern China, the RDE has a pronounced influence on increasing FI because of the region’s relatively advanced digital infrastructure and farmers’ higher levels of education. These factors enable farmers in these regions to effectively utilize digital technologies, improve agricultural productivity, expand marketing opportunities, and add value to their products. In contrast, the Western and Northeastern regions face challenges in terms of capital, technology, and human resources because of their geographical, climatic, and educational conditions. These disparities hinder their capacity to fully benefit from the digital economy. In conclusion, we propose Hypothesis 2, as follows:
Hypothesis 2.
The effect of RDE on FI varies by location.
The internal income levels of farmers also vary and are influenced by factors such as disparities in technological capabilities and educational attainment. While rural residents in certain areas generally earn incomes above the average income of those in other regions, the issue of excessive economic disparities may still persist [62]. The digital economy contributes to reducing income disparities, particularly in low- and middle-income nations or regions, and it addresses income inequality among rural populations in economically disadvantaged areas [63]. The earnings of rural inhabitants are categorized into various tiers. For high-income groups in rural areas, such as large planters and agricultural managers, the digital economy facilitates advancements in agricultural techniques and production efficiency, significantly boosting agricultural earnings. For rural low-income groups, including households with limited incomes and small-scale retail farmers, the digital economy can provide opportunities for skills training and nonagricultural jobs, thereby increasing wage income. For the middle-income group, because they have specific skills, and their salary income is at the middle level, changing jobs will not increase wages. These people are therefore less likely to see significant changes in their jobs or income due to the impacts of the RDE, which essentially leaves their income unchanged. The RDE influences FI growth unevenly across income groups, but it can narrow the income gap between lower- and middle-income farmers, to some extent. Therefore, we present Hypothesis 3, as follows:
Hypothesis 3.
The RDE has the capacity to reduce income disparities among famers, to a certain degree.

2.2. The Intermediary Mechanism of VRF

The RDE and VRF are closely related, and they each benefit from the other’s strengths. On one hand, the digital economy’s integration of cutting-edge technology, such as remote sensing and data analytics, provides safety protection technology for VRF. This technological integration not only supports economic gains but also fosters the long-term health of forest ecosystems by enhancing their sustainability and resilience [64]. In addition, the RDE offers an alternative pathway for the rural forestry sector, providing opportunities to transition away from traditional, highly polluting industries, such as wood processing and the forest chemical industry. Instead, new sectors, such as the under-forest economy, forest healthcare, and forest-based tourism, can uncover the potential of forest ecological products [65]. Rural areas rich in forest resources can promote the diversification and accessibility of the local economy by combining key related industries of the digital economy. First, farmers’ earnings can be enhanced by promoting the integration of digital innovations in rural communities. The widespread adoption of these technologies enables farmers to monitor market trends effectively and gives them the flexibility to adjust their production strategies accordingly. As a result, production efficiency improves, the added value of forest ecological products increases, and the competitiveness of such products strengthens, ultimately leading to greater economic returns. Second, FI can be increased through the application of digital sales. Digital sales methods, including e-commerce platforms and livestream sales, have eliminated the geographical barriers traditionally faced by individuals living in mountainous and rural regions. These advancements facilitate remote transactions of forestry production inputs and forest products across regions. This expands market access for farmers, reduces transaction costs, and promotes the more efficient allocation of forestry resources, all of which contribute to increased income for farmers. Additionally, the RDE fosters income growth by introducing new opportunities within the forestry sector. The combination of emerging industries, including forest tourism and forest healthcare, with conventional forestry practices enhances the rural economy and offers farmers a broader range of income opportunities. Building on this, we present Hypothesis 4 below:
Hypothesis 4.
VRF serves as a critical link between FI and RDE.
To present the content, purpose, methods, results, and conclusions of the four hypotheses more clearly and systematically, we have consolidated them into a comprehensive summary table, as shown in Table 2.

3. Research Design

3.1. Modeling

3.1.1. Entropy Weight Model (EWM)

The EWM offers a holistic approach for evaluating various factors by determining their respective weights and calculating the overall index on the basis of the information entropy of each factor. This approach minimizes the influence of subjective biases and can ensure a comprehensive and objective assessment. As described by Wang, J. et al. (2021) [66], we employ the entropy weight method to evaluate the RDE from a multidimensional perspective. The specific steps for the calculation process are detailed below:
① To account for variations in dimensions and magnitudes among different indicators, a normalization process is implemented. This approach standardizes the data and accommodates both positive and negative indicators, ensuring consistency and comparability.
Positive   Indicators :   X i j = X i j min { X j } max { X j } min { X i }
Negative   Indicators :   X i j = max { X j } X i j max { X j } min { X i }
where max { X j } and min { X j } represent the highest and lowest values of the indicators in all years, respectively, and X i j denotes the dimensionless result.
② Calculate the objective weight for each indicator, which represents its proportion within the specific year.
w i j = X i j i = 1 m X i j
③ Calculate information entropy of computing index e j .
e j = 1 ln m i = 1 m ω i j × ln ω i j
④ Calculate information redundancy d j .
d j = 1 e j
⑤ Calculate index weight φ j .
φ j = d j j = 1 m d j
⑥ Use linear weighting to calculate the level of the R D E i .
R D E i = j = 1 m φ j × ω i j

3.1.2. Input–Output Model (IOM)

The Cobb–Douglas function is one of the models most commonly used in the study of input–output efficiency. It forecasts prospective output and offers a scientific foundation for production planning by considering production elements, including labor, capital, and technology developments. By analyzing the input–output ratios of various production factors, it becomes possible to identify the most effective allocation strategies. This approach facilitates the optimization of resource distribution and ultimately improves production efficiency. To assess the efficiency of the input–output of forest ecological products, we use the methodology described by Kong, F. B. et al. (2023) [67].
① The reformulated production function model is as follows:
Y i , t = A i , t α L i , t β H i , t γ K i , t δ I i , t μ λ i , t
② Take the logarithm on both sides to obtain
ln Y i , t = α ln A i , t + β ln L i , t + γ ln H i , t + δ ln K i , t + μ ln I i , t + ln λ i , t
Among them, Y i , t , A i , t , L i , t , H i , t , K i , t , and I i , t represent the total output values of the three forestry industries, forest area investment, forestry land area investment, timber harvesting investment, forestry practitioner investment, and forestry fixed assets investment, respectively; α , β , γ , δ , and μ represent the input elasticities of forestry land area investment, timber harvesting investment, forestry practitioner investment, and forestry fixed assets investment; and λ i , t represents a constant term.

3.1.3. Benchmark Regression Model (BRM)

The BRM primarily serves to investigate the interdependence among variables, to uncover the extent and direction of the impact of various independent variables on the dependent variables, and to help us understand the reasons and trends behind the data. The BRM is used to examine how the RDE and other control factors affect FI levels. Referring to Lü, X. Y. et al. (2024) [68], we utilize the BRM as follows:
F I i t = α 0 + α 1 R D E i t + α 2 W i t + ε i t
In this context, i and t represent the province and the year, respectively; F I i t denotes famers’ income; R D E i t denotes the rural digital economy; W i t consists of a set of control variables, which include factors such as gross domestic product (GDP), farmland wetland area (FW), industrial structure (IS), basic transportation (BT), and forest resource quality (FQ); α 0 represents a constant term; α 1 represents the coefficient associated with the RDE; α 2 represents the coefficients associated with the control variables; and ε i t is the model’s random disturbance term.

3.1.4. Mediation Effect Model (MEM)

MEMs are widely employed in various disciplines, including economics, as they help clarify the processes and mechanisms through which independent variables influence dependent variables by highlighting the role of mediating variables. Although many studies focus on how the RDE directly affects particular outcomes, we extend current theoretical frameworks by suggesting that the RDE may also indirectly increase rural residents’ incomes by facilitating VRF. Building upon the BRM and Lü, X. Y. et al.’s (2024) [68] framework, the following MDM is presented:
V R F i t = β 0 + β 1 R D E i t + β 2 W i t + ε i t
F I i t = γ 0 + γ 1 R D E i t + γ 2 V R F i t + γ 3 W i t + ε i t
where V R F i t denotes the value realization of forestry products; the other variables contained are consistent with those in (10).

3.1.5. Kernel Density Model

Kernel density estimation is a nonparametric approach employed to visualize distribution morphology, location attributes, and the temporal or conditional dynamic trends of variables through continuous curves, while ensuring the stability of the obtained results. In line with Li, Y. et al. (2024) [69], we apply the Gaussian kernel function to explore the distribution dynamics and evolution of the RDE levels and FI levels. The formula used in this process is as follows:
f h ( x ) = 1 n h i = 1 n K ( x i x ¯ h )
where h represents a parameter, K ( ) represents the Gaussian kernel function, x i represents the sample observation value, and x ¯ represents the sample mean.

3.1.6. Quantile Regression Model

The traditional regression model does not account for the varying impacts that the RDE has on the income distribution among farmers across different income brackets. According to Bassett, G. et al. (1978) [70], quantile regression models are an extension of mean reversion that can demonstrate the precise influence of explanatory factors on explained variables at various quantile points. With reference to Nie, R. et al. (2020) [71], we construct a quantile regression model as follows:
Q q ( y i | x i ) = δ 0 q + δ 1 q x i + ε i
where x i and y i , respectively, represent the explanatory variables and the explained variables in the regression model associated with the RDE level and the FI level; Q q ( y i | x i ) represents the specific influence of the RDE on FI across different quantiles; δ 0 q refers to the constant terms at various quantiles; δ 1 q is the coefficient that quantifies the effect of RDE on FI at different quantiles; and ε i represents a random perturbation term. In this study, 100 bootstrap samples are used to determine the confidence interval of the sample, and the regression coefficient of the model is subsequently estimated.

3.2. Description of Variables

3.2.1. Explained Variable

FI represents the total income generated by rural residents from diverse sources and organizations during a specific survey period and serves as the primary measure of rural residents’ living conditions. In line with the methodology proposed by Li, G. C. et al. (2018) [72], we use the logarithmic transformation of rural household per capita disposable income as the explained variable.

3.2.2. Core Explanatory Variable

The RDE serves as a crucial instrument for assessing the state of the rural digital economy and the advancement of the digital transformation that rural industries are undergoing. Technological developments have strengthened the digital economy, modernized rural industries, and displayed characteristics of high efficiency, integration, and innovation. Numerous scholars have proposed different frameworks to measure the progression of the digital economy. Using the approaches of Zhao, T. et al. (2020) and Fang Z. et al. (2024) [18,19], we incorporate crucial metrics that represent rural digital infrastructure and industrial digitalization to assess the RDE, the details of which are provided in Table 3. The entropy weight method is used to conduct a quantitative assessment.

3.2.3. Mediating Variable

VRF is a critical aspect for evaluating the contribution of forest ecosystems to human society through goods and services. Enhancing this value can significantly foster improvement in both regional economies and the well-being of local populations. In this study, drawing from the methods outlined by Kong, F. B. et al. (2023) and Zhan, L. L. et al. (2024) [4,35], we select five input indicators that represent two key dimensions: forest ecological capital and forestry social capital. The total value generated by the forestry industry is used as the output indicator, as detailed in Table 4. The conversion rates for the input–output indicators are computed using Stata17 software.

3.2.4. Control Variables

To effectively address the endogeneity issues caused by omitted variables and to accurately identify the impact of the RDE and VRF on FI, we include several control variables: (1) GDP. This is a specific quantification used to evaluate the development level of a region in multiple aspects. Regions with high development levels usually display a more diversified economic structure. Not only is agriculture well-developed, but industry and the service sectors are also relatively prosperous. This diversified economic structure offers farmers a wide range of employment opportunities and enables them to venture into nonagricultural sectors, thereby diversify their income sources. Referring to Cao, X. L. et al. (2024) [73], we measure the regional per capita GDP by obtaining the logarithm. (2) FQ. This constitutes an important basis for assessing forest health status, formulating forest management strategies, and realizing forest sustainability. High-quality forest resources provide farmers with rich sources of economic income. In addition to harvesting timber, selling forest products, and participating in the under-forest economy and forest tourism, individuals can leverage forest resources for activities such as managing and protecting forests, processing forest products, and providing ecotourism services. High-quality forest resources can also improve ecological compensation benefits, all of which can promote the rural economy and rural revitalization. We refer to Cao, X. L. et al. (2024) [73] and obtain the log of forest stock volume per unit area to represent this variable. (3) IS. This is a key metric for evaluating the economic development and degree of modernization of a country or region. Typically, it is characterized by the relative contributions of the primary, secondary, and tertiary sectors to GDP, providing insights into the distinctive features of a country or region’s industrial composition at different phases of economic advancement. With the refinement and advancement of the industrial structure, farmers continue to improve their production technology and management level to meet market demand and obtain higher remuneration. Building on Chen, X. M. et al.’s (2022) [74] research, we use the value-to-GDP ratio of the secondary industry as a metric. (4) FW. This is an important basis for measuring the ecological function of a region, and it provides a scientific basis for ecological protection and management. Farmers who participate in farmland wetland protection are provided with economic compensation, which can directly increase their income. Moreover, wetland protection may enable farmers to switch from agricultural production to diversified agricultural activities, such as ecotourism and aquaculture, increasing their income level. We refer to Zhao, X. D. et al. (2019) [75], employing the logarithmic summation of cultivated land and wetland areas as a proxy for the variables under investigation. (5) BT. This is an important variable for measuring all aspects of the transportation field. Basic transportation facilities can enhance the economy of forests and neighboring areas, promote the accessibility of forest resources, and thus stimulate economic growth and nonagricultural employment. Referring to Zhao, X. D. et al. (2019) [75], we apply the logarithmic value of the ratio between regional road length and the geographical area of administrative divisions as a metric.

3.2.5. Instrumental Variable

This research primarily explores the causal link between the RDE and FI, recognizing a potentially strong endogeneity issue between these variables. To address this concern while maintaining both the relevance and exogeneity of the instrumental variables, two instruments are employed: (1) Drawing on Wang, X. H. et al. (2022) [76], the quantity of postal relay stations (Yizhan) during the Ming Dynasty is utilized. These stations served as key hubs for transportation and information dissemination in ancient China. Areas with a greater number of relay stations typically exhibited higher population mobility and more vibrant social interactions. Although this historical variable does not exert a direct effect on present-day FI, it likely influences the development of the RDE and thus functions as a suitable instrumental variable to identify its impact on income. (2) Based on Bai, P. W. et al. (2021) [77], the number of post offices in 1984 is adopted as another instrument. This measure reflects the extent of early communication infrastructure across Chinese regions and holds significance for the subsequent growth of the RDE. While it does not directly affect current FI, it can shape the spatial distribution of digital economic activities, making it a valid instrument in this context.

3.2.6. Description of Data

The RDE and VRF are vital components of the rural economy. These factors not only serve as significant sources of income for rural residents, improving their economic conditions, but also help reduce income disparities among farmers, to some degree. In this study, we investigate how the RDE and VRF affect rural residents’ earnings by analyzing panel data from 31 provinces, municipalities, and autonomous regions in China from 2011 to 2021, as illustrated in Figure 1. The main data sources for this study are the National Bureau of Statistics, the China Forestry and Grassland Statistical Yearbook, the Ali Research Institute, and the Peking University Digital Inclusive Finance Index. To minimize the effect of extreme values, the data are trimmed at the 1% and 99% percentiles, and missing values are addressed through interpolation. Descriptive statistics of each variable are presented in Table 5.

4. Spatiotemporal Analysis of RDE and FI

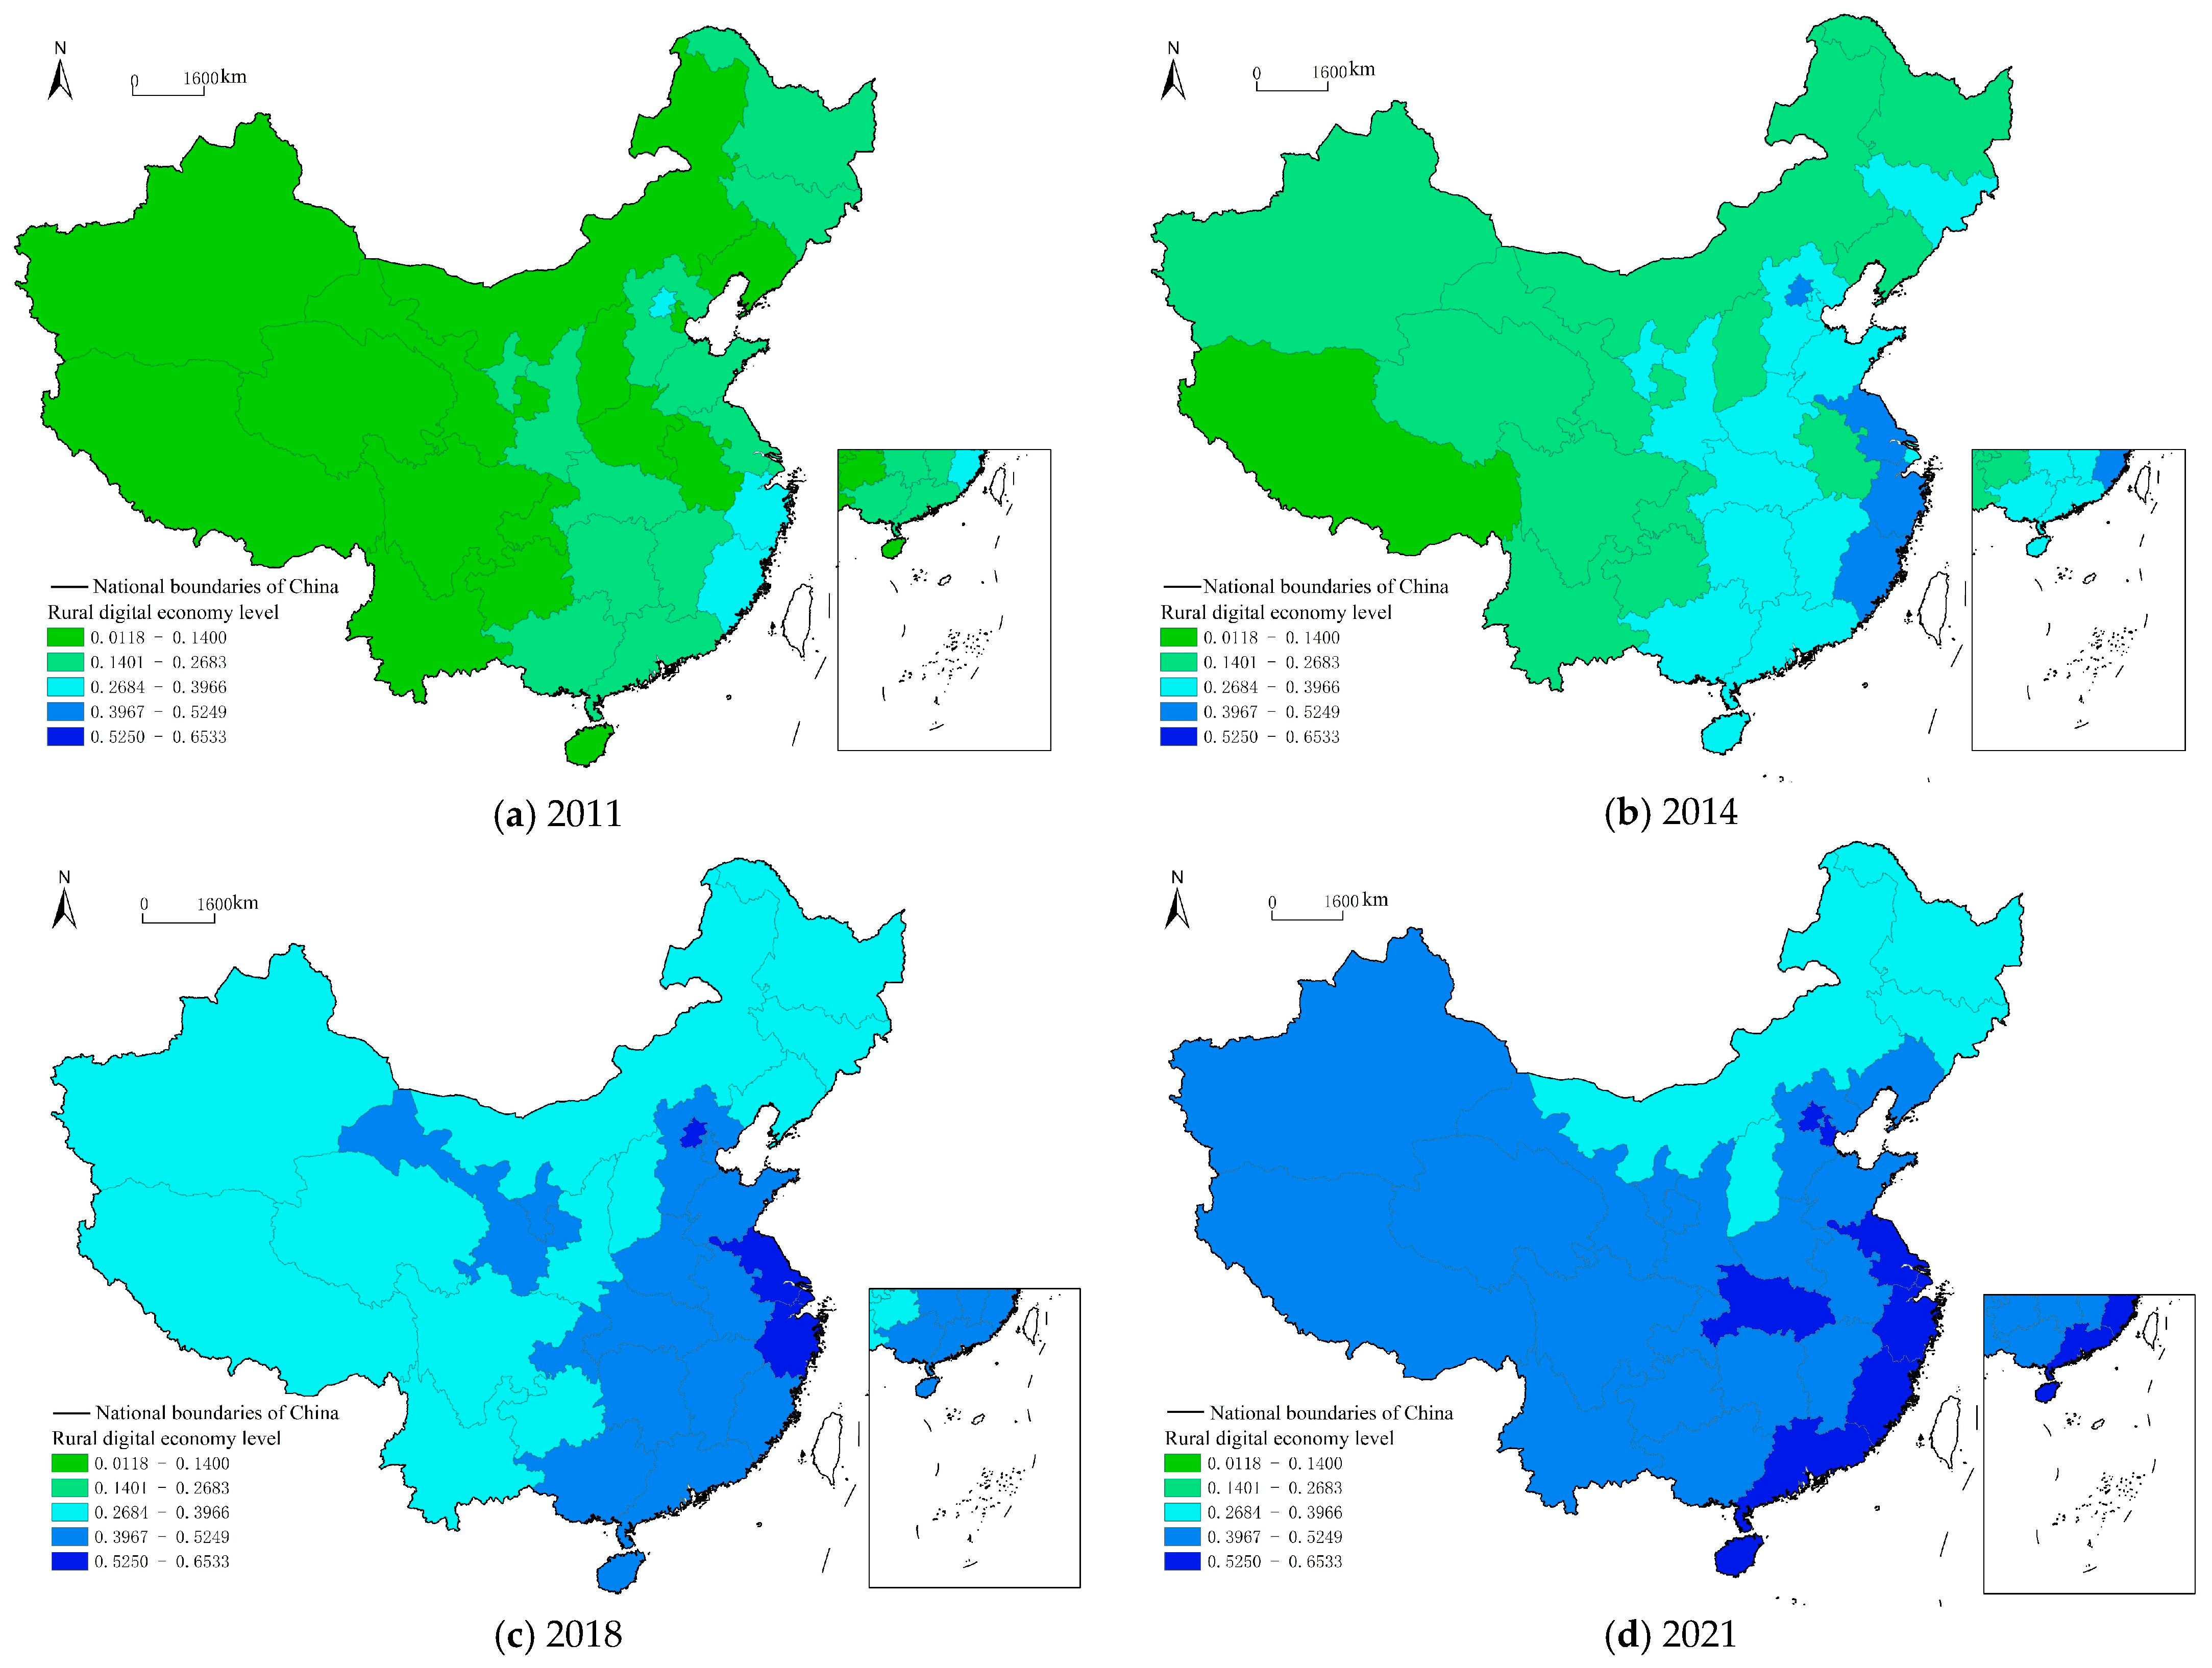
4.1. Spatiotemporal Analysis of the Level of RDE

We use MATLAB R2023a software to depict how the RDE in 31 Chinese provinces, municipalities, and autonomous areas changed between 2011 and 2021. As presented in Figure 2, the objective is to document and depict the evolving patterns of China’s RDE throughout this eleven-year period. In terms of distribution, the central point of the density function generally shifts toward the right over time. Between 2011 and 2021, the average value of the RDE enhanced from 0.162 to 0.496, indicating a significant increase in growth. From the perspective of the peaks, the sequential increase in their number suggests a trend in which regional disparities in the RDE initially widened before gradually narrowing. The differences in rural digital economies began to gradually expand in 2014 and gradually slowed in 2018.
Figure 3 shows how the RDE grew in different regions between 2011 and 2021. The data reveal steady national growth, with the Eastern region continuously leading in driving digital economy advancements, with approximately 0.080 times faster growth than the average level worldwide. The Central and Western regions lagged behind, reflecting lower digital economic development. However, the gap between the Western region and the national mean narrowed from 0.052 in 2011 to 0.038 in 2021, demonstrating advancements in the evolution of the digital economy. The gap between the Northeast region and the national mean gradually expanded, increasing from 0.008 in 2011 to 0.107 in 2021, while the Central region’s RDE level typically mirrored the national average. Importantly, the rate of expansion of the RDE across different regions was rapid from 2011 to 2014, accelerated between 2014 and 2018, and then slowed from 2018 to 2021.
The kernel density function diagrams for each year, displayed in Figure 2 and Figure 3, reflect the observed trends in the RDE levels across regions, and both figures support the changing trends. From 2011 to 2021, the level of the RDE across all regions showed consistent growth. After 2014, it grew at a notably faster rate, which resulted in a growing regional gap. After 2018, the growth rate decreased across areas, and regional differences decreased as well, suggesting a trend toward more balanced development. This shift can largely be attributed to the economic imbalances present at the outset of the digital economy’s expansion, which led to differing rates of infrastructure development and digital economy advancement across regions. Economically developed areas tend to develop digital economies faster than less developed areas, which further widens the digital economic gap. In recent years, the government has actively supported the RDE by implementing pertinent policies and allocating substantial funds to encourage digital development and growth. This has supported the rise of rural e-commerce and other sectors designed to facilitate the marketing of local specialty goods. In turn, the digital economy has driven the shift and modernization of local industries, fostering technological collaboration and economic partnerships with neighboring areas. Therefore, the disparities in digital economy levels between regions have diminished.
ArcGIS 10.8 software is employed to generate visual representations of the fluctuations in the RDE across 31 provinces, municipalities, and autonomous regions in China, with a particular emphasis on the years 2011, 2014, 2018, and 2021. Figure 4 illustrates the digital economy levels for different regions. The areas with the highest RDE levels in 2011 were Beijing, Fujian, and Zhejiang, with values of 0.340, 0.305, and 0.270, respectively. By 2014, Jiangsu had also emerged as a leading region. A distinct increasing trend had emerged by 2018 in the Eastern coastal provinces, such as Beijing, Fujian, Zhejiang, and Jiangsu, with growth gradually extending inland to the Central and Western regions. By 2021, the RDE had advanced even more significantly in the Eastern coastal regions, with Jiangsu, Beijing, Zhejiang, Shanghai, Guangdong, Hainan, and Fujian among those with the highest levels, with rates of 0.633, 0.634, 0.618, 0.598, 0.594, 0.561, and 0.549, respectively. The RDE had expanded significantly by 2021 compared to the levels for 2011, reflecting clear spatial diffusion across regions. This growth can be largely attributed to the substantial improvements in rural infrastructure, particularly in the network communication systems implemented by various provinces and municipalities. These infrastructural advancements have facilitated the enhanced interregional exchange of information and economic activity.

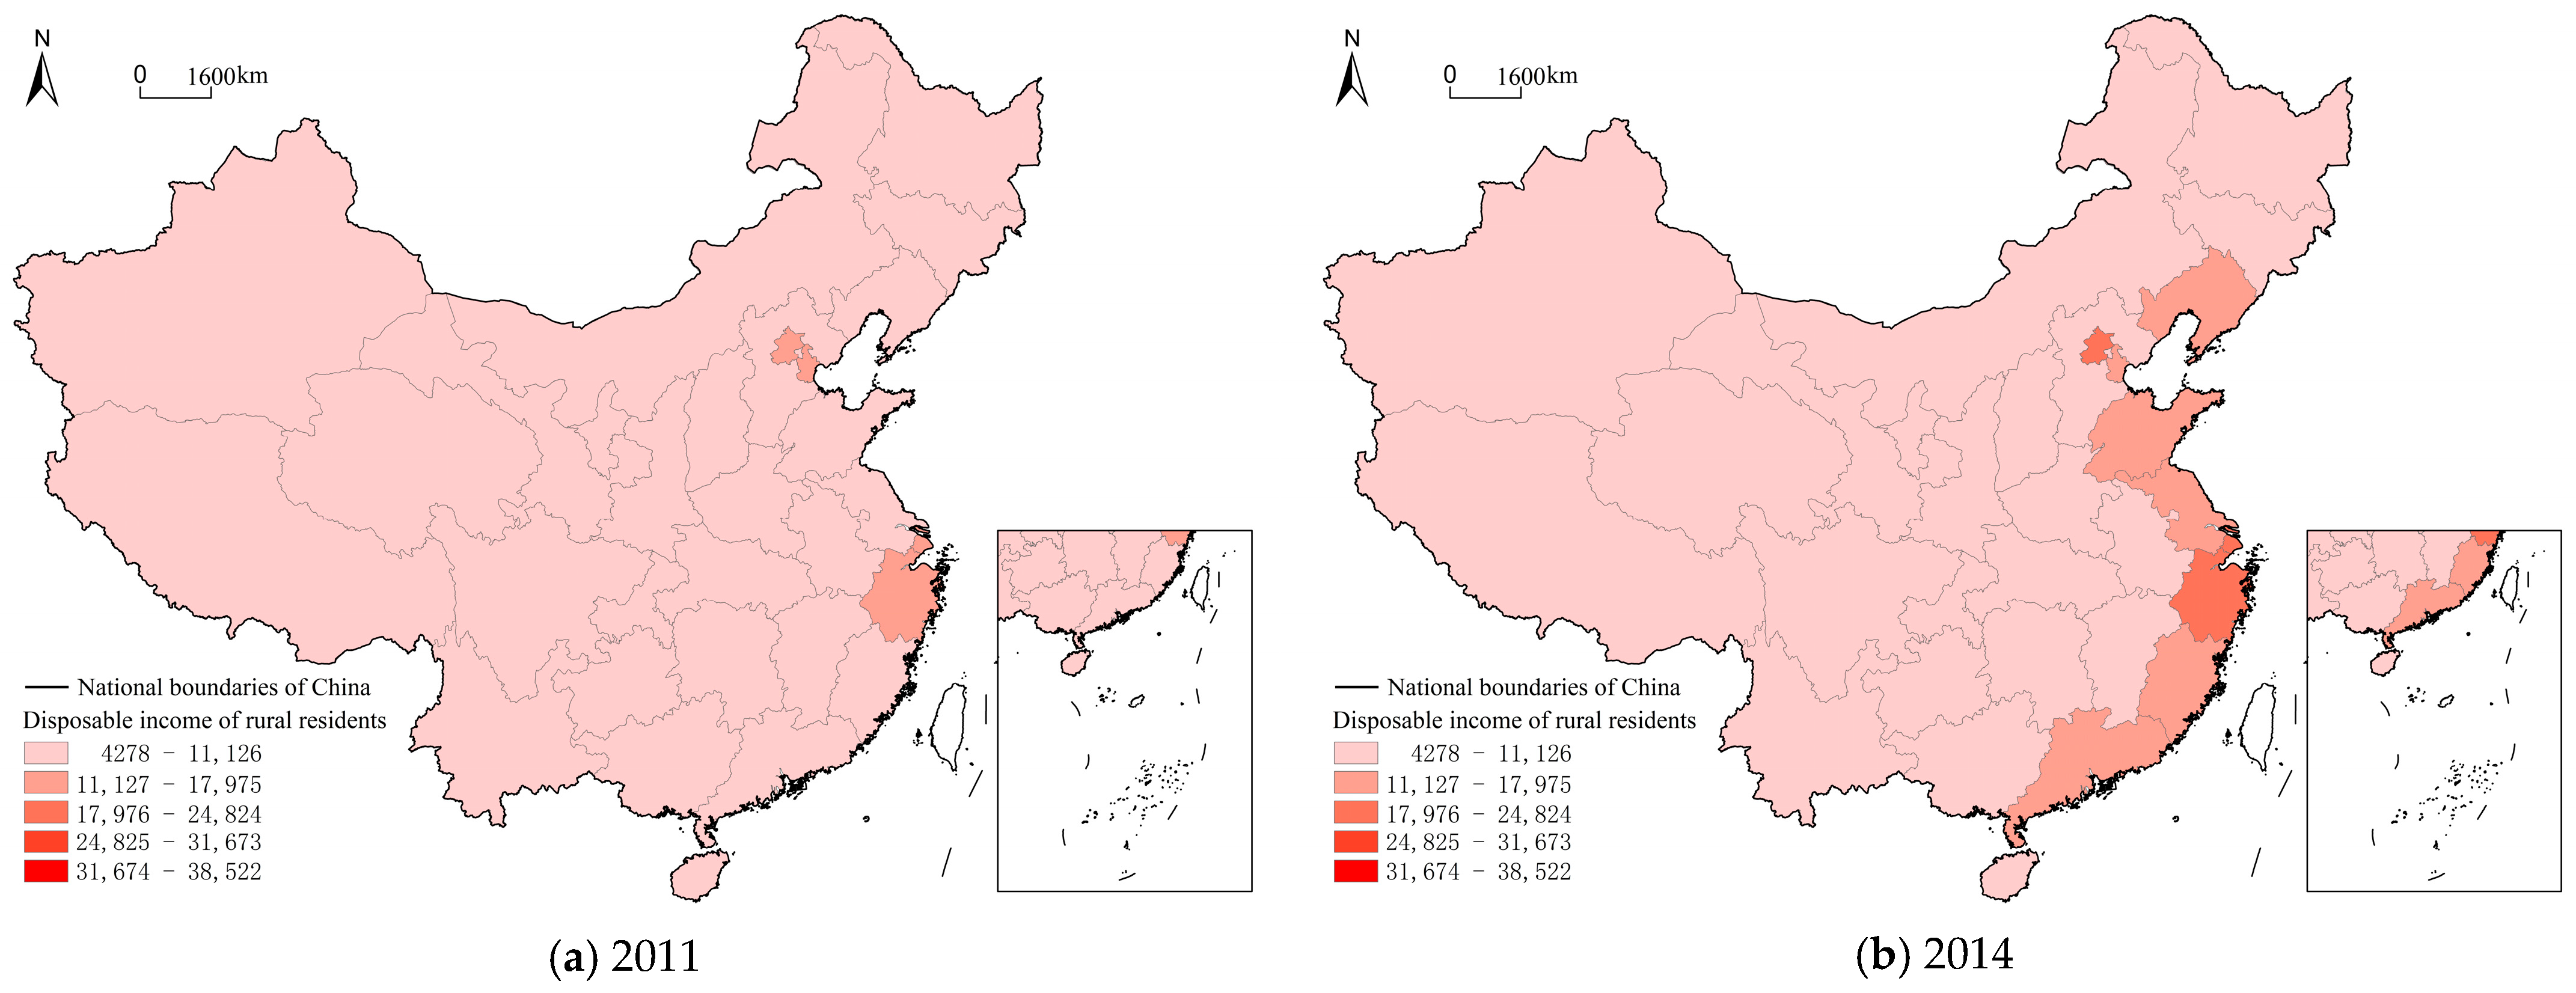
4.2. Spatiotemporal Analysis of FI Levels

Figure 5 illustrates the variations in FI levels across 31 provinces, municipalities, and autonomous regions in China from 2011 to 2021. In terms of distribution, the center of the density function gradually moved to the right over the years, signifying an overall increase in FI, which suggests a positive trend in farmers’ earnings over the period. The average value rose from 7688 CNY in 2011 to 19,698 CNY in 2021, which represents an increase of approximately 2.56 times. From the perspective of the crest, the width of the crest widened over time, indicating that the income gap among farmers gradually widened. The income gap among farmers was 11,459 CNY in 2011, and it expanded to 27,088 CNY in 2021.
The temporal and spatial evolution trends in FI levels across the Eastern, Central, Western, Northeastern, and national regions from 2011 to 2021 are shown in Figure 6. The income levels of farmers across different regions, as well as the country as a whole, exhibited a consistent upward trajectory. However, the disparity between regions continuously increased. In the Eastern region, the income level surpassed the national average, with the gap increasing from 2969 CNY in 2011 to 6741 CNY in 2021. FI in the Central, Western, and Northeastern regions, however, continued to lag behind the national average. This discrepancy is the greatest in the Western region, with the gap growing from 2108 CNY in 2011 to 4277 CNY in 2021. The Central region follows next, with the gap expanding from 725 CNY in 2011 to 1955 CNY in 2021. The smallest gap is found in the Northeastern region, increasing from 13 CNY in 2011 to 1449 CNY in 2021.
When we look at Figure 5 and Figure 6, the core density distribution maps of each year are consistent with the changing trend of FI levels in each region, and the two figures support the changing trends. Farmers in the Eastern region enjoy income levels above the national mean, whereas those areas in the Central, Western, and Northeastern regions exhibit lower levels. Furthermore, the income gap between these regions and the national benchmark has steadily widened over time. This situation occurs because the Eastern region occupies an advantageous geographical location along the coast. Most Eastern areas are special economic zones that are open to the outside world, and their infrastructure, such as network communication, was developed earlier than that in other regions. The economy of the Eastern region developed earlier and faster than that of other areas, so the effect on FI is obvious. In the Central, Western, and Northeastern regions, geographical location, climate conditions, policy directives, etc. contribute to inadequate infrastructure development, particularly in regards to network communication. Consequently, these areas experience delayed and slower economic growth than does the Eastern region. As a result, the impact on FI in these regions remains less pronounced.
ArcGIS 10.8 software is used to create graphical depictions of the variations in per capita disposable income among rural inhabitants across 31 provinces, municipalities, and autonomous regions in China, with a particular emphasis on the years 2011, 2014, 2018, and 2021. The variations in FI across different regions are depicted in Figure 7. The cities with relatively high FI levels were Shanghai, Zhejiang, Beijing, and Tianjin in 2011, with income levels of 15,137 CNY, 14,197 CNY, 13,742 CNY, and 11,941 CNY, respectively. FI in the Eastern coastal regions started to rise noticeably in 2014, and by 2018, the increase had spread from the Eastern coast to the interior. The five provinces and cities with the highest FI were Shanghai, Zhejiang, Beijing, Tianjin, and Jiangsu, with 38,521 CNY, 35,247 CNY, 33,303 CNY, 27,955 CNY, and 26,791 CNY, respectively, in 2021. Compared with that in 2011, the income level of farmers changed significantly in 2021, presenting an increasing trend from the Southeastern coastal regions toward the inland regions and a progressive decreasing trend from East to West. This may be due to the earlier industrial transformation and upgrading in the Eastern coastal areas compared to that in other regions, coupled with the support of relevant policies, which provided farmers with opportunities to engage in nonagricultural jobs and businesses, thereby improving FI channels and income levels.

5. Analysis of Results

5.1. Baseline Analysis

The relationship between FI levels and the RDE is investigated via an initial regression analysis of Model (10). The results are displayed in Table 6. The positive coefficients for the RDE in columns (1) and (2) are statistically significant at the 1% level, supporting Hypothesis 1 that the RDE increases FI. Fixed effects and random effects models are applied for re-estimation to take regional differences into consideration. The Hausman and F-test results reject the null hypothesis, supporting the use of the fixed effects model (FE) for further analysis. Column (3) reports the results of the FE model without control variables, whereas column (4) includes the results after the controls are incorporated. The coefficient of the RDE in column (4) is significant at the 1% level (0.622 ***), confirming the validity of Hypothesis 1. Among the control variables, the regional development level, farmland wetland area, and forest resource coefficients all display positive relationships at a minimum significance level of 5%, suggesting that higher regional development, larger farmland wetland areas, and better forest resources are all factors that contribute to improving FI. Higher regional development levels tend to facilitate the enhancement of rural areas, and larger farmland and wetland areas, along with superior forest resources, contribute positively to diversifying the income sources of rural residents. Both the industrial structure and basic transportation variables are tested at the 1% significance level and yield statistically significant results. However, their respective coefficients are negative. The reason may be that the rural industries in China are still dominated by traditional management styles, and the internal structure of rural industries is unreasonable. Moreover, rural areas face different challenges than do urban regions, particularly in terms of infrastructure, such as network communication, which remains underdeveloped. Thus, the RDE is still in its infancy and exhibits a limited capacity to meaningfully increase rural residents’ incomes. Therefore, Hypothesis 1 is validated.

5.2. Mediating Effect Analysis

Building on the above, the RDE might have an effect on FI by making VRF possible. The mediation analysis is carried out using Models (11) and (12), in which the mediating variable is VRF. The findings are presented in Table 7.
The total effect analysis, presented in column (1), shows that the RDE has a regression coefficient of (0.622 ***) and has passed the significant test at the 1% level. This result implies that the RDE contributes to the increase in FI. In addition, the direct effect analysis in column (2) reveals a regression coefficient of (4.689 **), which has passed significant test at the 5% level. This result implies that the RDE also contributes to VRF. Furthermore, comparing columns (1) and (3) for the mediating effect, the regression coefficient for the RDE decreases from (0.622 ***) to (0.602 ***), and it has passed the significant test at the 1% level. This confirms that VRF serves as a mediator between the effect of the RDE on FI. In conclusion, Hypothesis 4 is supported.

5.3. Endogeneity Test and Robustness Test

5.3.1. Two-Stage Least Squares (2SLS) with Instrumental Variables

To address the potential endogeneity between the RDE and FI, this study applies two instrumental variables—the number of postal relay stations from the Ming Dynasty and the number of post offices in 1984—in a two-stage least squares (2SLS) estimation. The estimation results are summarized in Table 8 Instrument validity is confirmed, as the F-statistics for all instruments exceed the critical value of 10, indicating no weak instrument concerns. The first-stage regressions, shown in columns (2) and (4), reveal that both instruments significantly influence the RDE. The second-stage results, presented in columns (3) and (5), indicate a statistically significant positive effect of the RDE on FI. These results align closely with the baseline regressions, thereby supporting the robustness of the study’s findings.

5.3.2. Replacement of the Dependent Variable

As a robustness test, this study replaces the original dependent variable—per capita disposable income of rural residents—with the urban–rural income gap. This gap is quantified by taking the logarithm of the difference between the urban and rural per capita disposable incomes. Serving as a comprehensive measure of the relative economic disparity between urban and rural areas, this indicator enables evaluation of the rural digital economy’s impact from the perspective of income inequality. The regression results, presented in column (5) of Table 8,remain statistically significant at the 1% level, thereby reinforcing the robustness of the conclusions.

5.3.3. Adjustment of the Study Sample

Given the notable regional variations in the effect of the RDE on FI, and following the methods of He, Q. Y. et al. [78], this study performs a robustness check by excluding the four highly developed municipalities—Beijing, Shanghai, Tianjin, and Chongqing—and re-estimating the model. The results, presented in column (6) of Table 8. demonstrate that, even with the exclusion of these municipalities, the RDE continues to exert a significant positive impact on FI at the 1% significance level. This further confirms the robustness of the baseline regression results.

5.4. Heterogeneity Analysis

5.4.1. Regional Heterogeneity Analysis

To test Hypothesis 2, we group China’s 31 provinces, municipalities, and autonomous regions into four geographical zones. A heterogeneity analysis is conducted for each region, with the results displayed in Table 9. The analysis reveals that the RDE notably influences farmers’ earnings in the Eastern, Central, and Western regions, and the coefficients for these regions are (0.611 ***), (0.781 ***), and (0.520 ***), all surpassing the 1% significance level. However, the coefficient for the Northeastern region is not significant. This may be because the Eastern region experienced the initiation of the digital economy earlier than the other regions because of factors such as geographical location and favorable policy support. In recent years, the Central and Western regions have seen notable improvements due to national development initiatives, such as the Central Region Rise Strategy and the Western Grand Development Strategy. These strategies have facilitated industrial advancements and infrastructure development, creating a solid foundation for the digital economy in various areas. However, owing to its aging industrial structure, harsh climate conditions, and diminishing policy effects, the Northeast region lacks the necessary capital, technology, and talent support. As a consequence, the pace of digital economy development—including smart transportation and rural e-commerce—is significantly slower in the Northeast region than in other areas, which makes its impact on increasing FI less clear. In summary, Hypothesis 2 is confirmed.

5.4.2. Quantile Heterogeneity Analysis

The regression analysis shows that the RDE plays a substantial role in enhancing FI levels. However, the analysis does not support an in-depth understanding of how this effect is distributed across different income brackets. To close this gap, we explore how the RDE affects FI across a range of income percentiles. To do so, we follow the approach outlined by Wang, P. (2017) [79], selecting five key quantiles—0.10, 0.25, 0.50, 0.75, and 0.90—for further regression analysis. The outcome is presented in Table 10. The influence of the RDE on FI across different quantiles is a significant variation. The effect is the most pronounced at the 0.90 quantile, with a coefficient of (3.089 ***), followed by the 0.10 quantile (2.956 ***), the 0.25 quantile (2.806 ***), and the 0.75 quantile (2.781 ***). The smallest effect is observed at the 0.50 quantile, with a coefficient of (2.600 ***).
The quantile regression trend chart is presented in Figure 8. This supports our understanding of how the impact of the RDE on FI evolves across different income levels. The x-axis of the chart represents the various quantile levels used to capture the differential influence of the RDE on FI. The y-axis indicates the regression coefficients for each variable at these respective quantile levels. In addition, the middle dashed line in the chart represents the regression estimates of the independent variables obtained using the ordinary least squares (OLS) method. The area between the upper and lower dashed lines corresponds to the 95% confidence intervals of the regression results.
Moreover, the shaded area illustrates the quantile regression estimates of the explanatory variables, accompanied by their own 95% confidence intervals. The graph illustrates a “positive U-shaped” correlation between FI levels and the RDE. Initially, there is a decline, followed by a rise, suggesting that both higher-income groups (approximately the 70% quantile) and lower-income groups (approximately the 30% quantile) in rural areas experience a large impact from the RDE. In contrast, the middle-income group (approximately between the 30% and 70% quantiles) is less strongly influenced by this economic factor.
The quantiles above 70% are strongly affected by the RDE. This shows that the technological optimization, industrial upgrading, and e-commerce economy brought about by the RDE bring new opportunities for higher-income groups in rural areas, such as agricultural contractors and rural enterprise managers. Farmers situated below the 30th income percentile also experience a pronounced impact from the RDE. This influence stems from the increase in nonagricultural employment opportunities generated by digital economic activities, which may offer low-income rural residents more avenues for earning income. These nonagricultural job opportunities, often facilitated by the growth of digital platforms, such as e-commerce, digital services, and online marketing, provide alternative income sources for individuals whose livelihoods have traditionally been limited to agriculture. The RDE has the smallest influence on farmers in the 30%–70% quantile range. This implies that those in the middle-income range, who display comparatively solid personal skills and family capital, are less likely than those in other groups to see major changes in their income or employment due to the growth of the RDE. This population is therefore not expected to be significantly impacted by the RDE. The RDE yields varying income effects across different groups, with the greatest influence on high-income farmers, followed by low-income groups, and the least influence on middle-income groups. This discrepancy is likely due to unequal access to digital resources and opportunities. However, the digital economy is essential for lowering the wealth disparity in rural areas, particularly between low- and middle-income households, by creating new sources of income and enhancing economic opportunities for underserved groups. Therefore, Hypothesis 3 is supported by these findings.

6. Discussion and Policy Implications

6.1. RDE Promotes FI

The RDE plays a critical role in enhancing FI. A growing body of research supports this view, indicating that digital technologies can significantly elevate income levels among residents. Nonetheless, existing studies predominantly assess the digital economy from a macro perspective, typically at the national or provincial level [6,7], or focus primarily on urban areas [18]. Few investigations differentiate between urban and rural contexts or specifically evaluate the development of digital economies with rural characteristics. Addressing this gap, the present study concentrates on rural regions to more precisely examine the actual effects of the rural digital economy on FI. To this end, a combination of spatiotemporal analytical techniques—including kernel density estimation, map-based visualization, and line charts—is employed to track the evolution of RDE development and FI from 2011 to 2021. The findings reveal a steady upward trend for both digital economy indicators and income levels over the decade, accompanied by a marked narrowing of regional disparities. The growth pattern exhibits a spatial diffusion from the Eastern coastal zones toward the inland areas. Regions characterized by a more advanced RDE consistently show higher levels of FI. While prior literature has largely emphasized the spatial spillover effects of the RDE or provided descriptive accounts of its spatiotemporal patterns, this study offers a more integrated approach. For instance, Tao, J. (2024) and Yang, R. et al. (2025) [80,81] highlighted spatial heterogeneity in the income-enhancing effects of the digital economy, whereas Grishchenko, N. et al. (2024) [82] used geovisualization techniques to depict the evolution of digital technologies across EU countries. Similarly, Hu, M.J. (2025) [83] demonstrated the coordinated development of the digital economy and green finance through spatiotemporal analyses. Building upon these contributions, the present study combines temporal trends with spatial patterns and utilizes kernel density visualizations (Figure 3 and Figure 6) to uncover a declining trend in intra-regional disparities in regards to both RDE development and FI. These results underscore the RDE as a key driver in promoting equitable income growth across rural areas.

6.2. The Mediating Role of VRF

The RDE contributes to increasing FI, in part through the mediating role of VRF. When both the RDE and VRF are incorporated into the model, the coefficient of the RDE remains significantly positive at the 1% level, although its magnitude is reduced compared to that of the model without the mediating variable. This suggests that a portion of the income-enhancing effect of the RDE is transmitted via VRF. In existing studies, scholars have identified various mediating channels through which the digital economy affects rural income generation, including industrial upgrading [42,44], improved efficiency in information acquisition [45,46], and the restructuring of employment patterns [47,48]. While some research has examined the relationship between the digital economy and ecological value, the focus has largely been limited to topics such as energy efficiency [49,50], carbon emissions [51,52], and agricultural sustainability [53,54]. To date, few studies have considered VRF as a mediating mechanism. Adopting a perspective of ecological–economic integration, this study proposes a conceptual framework linking the RDE, VRF, and FI. This integrated approach not only clarifies the intermediary role of forest ecological product value but also expands the theoretical understanding of how the RDE contributes to income growth. This represents the key contributions and innovation of the present research.

6.3. Heterogeneity Across Regions

The influence of the RDE on household income varies notably across regions, exhibiting significant regional heterogeneity. Empirical evidence shows that the RDE exerts a statistically significant and positive impact on FI in the Eastern, Central, and Western regions at the 1% significance level, highlighting its robust role in income enhancement. In contrast, the effect in the Northeastern region is statistically insignificant, indicating that the RDE has yet to generate a substantial impact on FI in this area. Although a considerable body of literature has established the general consensus that the digital economy significantly fosters income growth [84], many studies tend to overlook the disparities in regional development levels. Previous research often categorizes China into three broad regions—Eastern, Central, and Western—for analysis [48,80], with relatively limited focus on the Northeastern region. Expanding on this framework, the current study incorporates the Northeastern region, uncovering its unique characteristics in RDE development. These findings offer valuable theoretical guidance for devising region-specific policies to advance the growth of the RDE.

6.4. Heterogeneity Across Income Quantiles of Farmers

The development of the RDE exerts varied effects on farmers across different income brackets. By segmenting FI into quantiles, it is revealed that the RDE most significantly boosts income growth for those above the 70th percentile, followed by the group below the 30th percentile, while its influence on farmers within the 30th to 70th percentile range is comparatively limited. This pattern indicates that the RDE contributes to narrowing the income gap between low- and middle-income rural households and, to a certain extent, mitigates overall income disparities within rural communities. Prior studies have predominantly concentrated on urban–rural income disparities [85,86]. Furthermore, de Moraes, C. O. et al. (2023) [87] documented the income inequality associated with the digital economy but did not thoroughly investigate its specific manifestations or the differentiated impacts across income groups. Zhu, H. J. et al. (2025) [88] explored the digital economy’s effects across income quantiles for the general Chinese population. In contrast, the present study focuses specifically on income heterogeneity within the rural farming population, providing a detailed examination of how the RDE differentially affects farmers at distinct income levels. The results offer valuable theoretical perspectives and practical policy implications for poverty reduction and income inequality alleviation in rural and similarly underdeveloped areas worldwide.

6.5. Policy Implications

Enhancing digital infrastructure is essential for stimulating economic growth. Efforts should focus on promoting the extensive deployment and application of advanced technologies such as 5G, artificial intelligence, and the Internet of things across rural areas. It is crucial to foster the integration of these digital technologies with local rural industries to expand diverse income-generating opportunities for farmers. Additionally, improving farmers’ digital literacy and providing targeted skills training will strengthen their ability to actively engage in the digital economy. Leveraging digital platforms, dynamic monitoring, and evaluation systems should be established to scientifically guide the implementation of RDE policies, thereby accelerating progress toward rural revitalization objectives.
Strengthening digital empowerment is crucial to harmonizing ecological conservation with economic development. Efforts should focus on accelerating the adoption of digital technologies throughout the development, distribution, and branding of forest ecological products. Concurrently, it is important to enhance the forest ecological product industry system and market mechanisms, tailored to the unique characteristics of local industries. Deepening the integration of digital platforms with the forest ecological sector can stimulate innovative business models and formats within the “digital + ecology” paradigm, including initiatives such as “smart forestry” and “forest product e-commerce livestreaming”. These advancements will unlock the market potential of forest ecological resources and support sustainable increases in FI.
Policy differentiation should be prioritized to facilitate coordinated regional development. In the Eastern, Central, and Western regions—where the RDE significantly enhances FI, and both digital economy maturity and income levels are relatively high—efforts should focus on strengthening the application and innovation capabilities of digital industries to accelerate the digital transformation and upgrading of local sectors. Conversely, in the Northeastern region, targeted governmental policies and financial support are needed to reinforce the development of essential digital infrastructure, including networks and transportation systems, with an emphasis on capacity building and nurturing emerging digital industries. By tailoring strategies to regional conditions and strategically allocating resources, balanced and coordinated regional advancement can be effectively achieved.
Improving the digital skills and digital employment opportunities of rural residents is crucial. For higher-income rural groups, policymakers should develop targeted strategies to facilitate their shift from traditional to modern agroforestry practices, enhancing production efficiency and marginal benefits, while simultaneously generating additional digital employment opportunities. For middle-income rural populations, emphasis should be placed on raising awareness of the digital economy and providing relevant education to motivate skilled individuals to participate in rural digital industries, thereby mitigating the outflow of talent from these areas. For lower-income rural groups, increasing digital literacy and offering vocational training are essential to boost their overall competencies, promoting income growth through access to higher-quality employment.

7. Conclusions

7.1. Main Conclusion

In this context, we employ panel data from 31 Chinese provinces between 2012 and 2021, and we apply the EWM to evaluate the RDE and the IOM to assess VRF. A spatiotemporal analysis is conducted to investigate the impact of the advancement of the RDE on FI. Additionally, the mediation model is employed to analyze the relationships between the RDE, VRF, and FI. Ultimately, locational heterogeneity and quantile heterogeneity analyses reveal that the impact of the RDE on FI differs across regions and income levels, which demonstrates its potential to reduce income inequalities within the agricultural sector. The key findings of the research are summarized below:
First, the RDE has a significant positive impact on FI, and this effect remains robust after addressing endogeneity and conducting robustness tests. Moreover, both the level of the RDE and FI show a decreasing trend from the Eastern coastal areas to the Northwestern inland regions.
Second, the RDE can indirectly promote increases in FI through a mediating pathway, namely, VRF.
Third, the impact of the RDE on FI exhibits regional heterogeneity; it is significant in the Eastern, Central, and Western regions, but not in the Northeastern region.
Fourth, the effect of the RDE on FI also varies across different income quantiles. Specifically, the impact presents an inverted-U-shaped pattern, first decreasing and then increasing across income quantiles.

7.2. Theoretical Implications

Overall, compared with existing studies, this paper makes several theoretical contributions and extensions. First, it focuses on the unique developmental characteristics of rural areas and constructs an integrated analytical framework that combines the RDE, VRF, and FI, thereby expanding the current research perspective on the relationship between the digital economy and FI. Second, this study innovatively proposes and empirically verifies a mediating pathway—“RDEVRFFI”—revealing the amplifying effect of the digital economy in promoting ecological value realization. This offers a new theoretical explanation for how the digital economy indirectly contributes to FI through ecological mechanisms. Third, the study addresses the key issue of how ecological value can be effectively transformed into tangible income, highlighting the enabling role of the RDE in this transformation process. In doing so, it enriches the theoretical framework of the integrated development of ecological and digital economies, fills the research gap in the interactive mechanism of “RDEVRFFI”, and provides novel theoretical support and a new research paradigm for empowering ecological resource utilization and promoting common prosperity in rural areas through digital technology. Finally, the heterogeneous impacts of the RDE across regions, along with the varying degrees to which farmers at different income levels benefit from it, offer important implications for policymaking. These findings can guide governments in designing more tailored strategies for enhancing digital infrastructure and improving digital literacy in rural areas, thereby contributing to the advancement of rural revitalization efforts across diverse national and regional contexts.

7.3. Limitations and Future Research

While this study contributes to a deeper empirical understanding of the relationship between the RDE and FI, several limitations persist.
First, the analysis relies on provincial-level panel data from China, which may mask finer-scale variations within regions—such as differences in the implementation efficacy of local government policies, the extent of digital infrastructure deployment, or the actual degree of farmers’ participation in the digital economy. Future research could enhance study precision by narrowing the spatial scope to county- or even village-level data, thereby more accurately reflecting the RDE’s true impact on FI.
Second, the empirical methodology primarily employs static panel regression models. Although effective for capturing overall associations among variables, this approach is insufficient for revealing dynamic evolutions, potential lagged effects, or spatial spillovers. Future studies could incorporate dynamic panel data models or spatial econometric techniques to uncover more nuanced and complex causal relationships.
Finally, despite an initial exploration of regional heterogeneity, the current analysis remains relatively conventional and does not fully capture the multidimensional structural features of the RDE. Specifically, the differentiated influences of components such as digital infrastructure, digital financial inclusion, and farmers’ digital literacy on income have yet to be systematically examined. Subsequent research should further investigate how these internal dimensions distinctly affect FI, which would enrich the existing literature and provide empirical foundations for designing more precise and effective rural digital development policies.

Author Contributions

Conceptualization: J.Z. and G.M.; resources and funding acquisition: G.M.; data curation and analysis, original draft preparation: S.Z.; writing—review and editing: J.Z., G.M. and S.Z. All authors have read and agreed to the published version of the manuscript.

Funding

This research was funded by the Heilongjiang Natural Science Foundation of China (grant number LH2023G003) and the National Social Science Fund Project (grant number 18BJY056).

Data Availability Statement

The raw data supporting the conclusions of this article will be made available by the authors upon request.

Conflicts of Interest

The authors declare no conflicts of interest.

Abbreviations

The following abbreviations are used in this manuscript:
RDERural Digital Economy
VRFValue Realization of Forest Ecological Products
FIFarmers’ Income
GDPGross Domestic Product
FWFarmland Wetland Area
ISIndustrial Structure
BTBasic Transportation
FQForest Resource Quality
MQMing Dynasty Postal Relay Stations
PONumber of Post Offices in 1984
EWMEntropy Weight Model
BRMBenchmark Regression Model
MEMMediation Effect Model
IOMInput–Output Model

References

  1. Wei, H.K.; Zhong, F.N.; Li, S.; Huang, Y.P.; Du, Z.X. Persistently Advancing the Work Related to Agriculture, Rural Areas and Farmers to Foster a New Pattern of Integrated Urban-Rural Development: Expert Interpretation of the 2023 Central Economic Work Conference and the Central Rural Work Conference. China Rural. Econ. 2024, 1, 2–20. [Google Scholar]
  2. Xu, X.J.; Zhang, T.T. Economic Growth, Income Disparity, and Common Prosperity. Southwest Financ. 2023, 1, 29–42. [Google Scholar]
  3. Ren, L.J.; Mao, J.N.; Song, Y.; Wang, Z.Y.; Yang, X.J. The Logic and Dilemmas of Forest Ecological Product Value Realization from a Whole-Process Perspective. Issues For. Econ. 2025, 45, 263–274. [Google Scholar]
  4. Kong, F.B.; Cheng, W.J.; Xu, C.Y. Can the Development of the Digital Economy Improve the Efficiency of Forest Ecological Product Value Transformation? An Empirical Analysis Based on Lishui City, Zhejiang Province. China Rural. Econ. 2023, 5, 163–184. [Google Scholar]
  5. Hou, F.M.; Li, X.Y.; Xiao, H.; Wu, C. Empowering the Development of Rural Forestry in China through the Digital Economy: Theoretical Mechanism, Effectiveness Analysis, and Policy Implications. World For. Res. 2023, 36, 1–6. [Google Scholar]
  6. Fan, P.; Watanabe, C. Promoting industrial development through technology policy: Lessons from Japan and China. Technol. Soc. 2006, 28, 303–320. [Google Scholar] [CrossRef]
  7. Močnik, D.; Širec, K. The determinants of Internet use controlling for income level: Cross-country empirical evidence. Inf. Econ. Policy 2010, 22, 243–256. [Google Scholar] [CrossRef]
  8. Tiwasing, P.; Clark, B.; Gkartzios, M. How can rural businesses thrive in the digital economy? A UK perspective. Heliyon 2022, 8, e10745. [Google Scholar] [CrossRef] [PubMed]
  9. Playán, E.; Gimeno, Y.; Lorenzo-González, M.; Jiménez, A.; López-Pardo, J.; Oliván, I.; Castillo, R.; Carbonell, X.; Fábregas, M.; Vicente, L.; et al. Irrigation modernization in the Ebro-Aragón region of Spain: Past and future trends. Agric. Water Manag. 2024, 302, 108975. [Google Scholar] [CrossRef]
  10. Johnson, D. Food security, the agriculture value chain, and digital transformation: The case of Jamaica’s agricultural business information system (ABIS). Technol. Soc. 2024, 77, 102523. [Google Scholar] [CrossRef]
  11. Odewole, M.M.; Sanusi, M.S.; Sunmonu, M.O.; Yerima, S.; Mobolaji, D.; Olaoye, J.O. Digitalization of rice value chain in Nigeria with circular economy inclusion for improved productivity—A review. Heliyon 2024, 10, e31611. [Google Scholar] [CrossRef] [PubMed]
  12. Fakhraddine, M.; Zerrad, N.; Berhili, H.; Morchid, M. Digital transformation in Moroccan agriculture: Applications, used technologies, impacts on marketing, limitations, and orientations for future research. Smart Agric. Technol. 2025, 11, 100978. [Google Scholar] [CrossRef]
  13. Zhou, J.; Yang, S. Common prosperity in the era of technological transformation: Digital inclusive finance, technological progress, and the income distribution of migrant workers. Financ. Res. Lett. 2025, 81, 107486. [Google Scholar] [CrossRef]
  14. Kim, J. Infrastructure of the digital economy: Some empirical findings with the case of Korea. Technol. Forecast. Soc. Chang. 2006, 73, 377–389. [Google Scholar] [CrossRef]
  15. Burbridge, C.; Maguire, G. Digital Britain interim report: A step in the right direction? Comput. Law Secur. Rev. 2009, 25, 263–269. [Google Scholar] [CrossRef]
  16. Berdykulova, G.M.K.; Sailov, A.I.U.; Kaliazhdarova, S.Y.K.; Berdykulov, E.B.U. The Emerging Digital Economy: Case of Kazakhstan. Procedia Soc. Behav. Sci. 2014, 109, 1287–1291. [Google Scholar] [CrossRef]
  17. Erdiaw-Kwasie, M.O.; Alam, K. Towards understanding digital divide in rural partnerships and development: A framework and evidence from rural Australia. J. Rural. Stud. 2016, 43, 214–224. [Google Scholar] [CrossRef]
  18. Zhao, T.; Zhang, Z.; Liang, S.K. Digital Economy, Entrepreneurial Activity, and High-Quality Development: Empirical Evi-dence from Chinese Cities. Manag. World 2020, 36, 65–76. [Google Scholar]
  19. Fang, Z.; Li, G.C.; Yin, Y.X.; Liu, P.L. Measurement of Rural Digital Economy Development and Its Impact on Agricultural Productivity Growth. J. China Agric. Univ. 2024, 29, 252–268. [Google Scholar]
  20. Vosti, S.A.; Braz, E.M.; Carpentier, C.L.; D’oliveira, M.V.; Witcover, J. Rights to Forest Products, Deforestation and Smallholder Income: Evidence from the Western Brazilian Amazon. World Dev. 2003, 31, 1889–1901. [Google Scholar] [CrossRef]
  21. Sikora, A.T.; Nybakk, E. Rural development and forest owner innovativeness in a country in transition: Qualitative and quantitative insights from tourism in Poland. For. Policy Econ. 2012, 15, 3–11. [Google Scholar] [CrossRef]
  22. Sonntag-Öström, E.; Nordin, M.; Lundell, Y.; Dolling, A.; Wiklund, U.; Karlsson, M.; Carlberg, B.; Järvholm, L.S. Restorative effects of visits to urban and forest environments in patients with exhaustion disorder. Urban For. Urban Green. 2014, 13, 344–354. [Google Scholar] [CrossRef]
  23. Kerchner, C.D.; Keeton, W.S. California’s regulatory forest carbon market: Viability for northeast landowners. For. Policy Econ. 2015, 50, 70–81. [Google Scholar] [CrossRef]
  24. Zhu, H.; Hu, S.; Ren, Y.; Ma, X.; Cao, Y. Determinants of engagement in non-timber forest products (NTFPs) business activities: A study on worker households in the forest areas of Daxinganling and Xiaoxinganling Mountains, northeastern China. For. Policy Econ. 2017, 80, 125–132. [Google Scholar] [CrossRef]
  25. Jonsson, R.; Rinaldi, F.; Pilli, R.; Fiorese, G.; Hurmekoski, E.; Cazzaniga, N.; Robert, N.; Camia, A. Boosting the EU forest-based bioeconomy: Market, climate, and employment impacts. Technol. Forecast. Soc. Chang. 2021, 163, 120478. [Google Scholar] [CrossRef]
  26. Agnoletti, M.; Piras, F.; Venturi, M.; Santoro, A. Cultural values and forest dynamics: The Italian forests in the last 150 years. For. Ecol. Manag. 2022, 503, 119655. [Google Scholar] [CrossRef]
  27. Jaung, W. Digital forest recreation in the metaverse: Opportunities and challenges. Technol. Forecast. Soc. Chang. 2022, 185, 122090. [Google Scholar] [CrossRef]
  28. Kacprzak, M.J.; Ellis, A.; Fijałkowski, K.; Kupich, I.; Gryszpanowicz, P.; Greenfield, E.; Nowak, D. Urban forest species selection for improvement of ecological benefits in Polish cities—The actual and forecast potential. J. Environ. Manag. 2024, 366, 121732. [Google Scholar] [CrossRef] [PubMed]
  29. Wang, R.-Y.; Huang, G.; Zi, P.; Li, T.; Liang, Q. Implementation of ecological risk scenario simulation and driving mechanisms in typical rocky desertification regions in China: A coupling multi-model ecological assessment framework. Ecol. Indic. 2025, 174, 113464. [Google Scholar] [CrossRef]
  30. Zhang, X.; Li, K.; Xu, Z.; Li, C.; Bai, Z.; Yang, C. Optimal selection of tree species for ecological protection forests on the riverbank side of the lower Yellow River flood control dikes. Ecol. Indic. 2025, 177, 113691. [Google Scholar] [CrossRef]
  31. Isely, E.S.; Isely, P.; Seedang, S.; Mulder, K.; Thompson, K.; Steinman, A.D. Addressing the information gaps associated with valuing green infrastructure in west Michigan: INtegrated Valuation of Ecosystem Services Tool (INVEST). J. Great Lakes Res. 2010, 36, 448–457. [Google Scholar] [CrossRef]
  32. Galli, A. On the rationale and policy usefulness of Ecological Footprint Accounting: The case of Morocco. Environ. Sci. Policy 2015, 48, 210–224. [Google Scholar] [CrossRef]
  33. Pohjola, J.; Laturi, J.; Lintunen, J.; Uusivuori, J. Immediate and long-run impacts of a forest carbon policy—A market-level assessment with heterogeneous forest owners. J. For. Econ. 2018, 32, 94–105. [Google Scholar] [CrossRef]
  34. Nguyen, C.P.; Nguyen, B.Q. Environmental foe or friend: The influence of the shadow economy on forest land. Land Use Policy 2022, 124, 106456. [Google Scholar] [CrossRef]
  35. Zhan, L.L.; Yang, J.Z. Study on the Efficiency of Forest Ecological Product Value Realization in China: Based on an Input–Output Analysis Framework. Econ. Issues 2024, 8, 34–42. [Google Scholar]
  36. Lou, J.; Yang, G.-L.; Song, L.; Liu, K.-D. From resources to capital: Investigating the efficiency of forest ecosystem products value realization in China. Socio-Econ. Plan. Sci. 2024, 96, 102052. [Google Scholar] [CrossRef]
  37. Song, X.C.; Liu, C.; Zhang, C.C. Ecospatial network of forest carbon stocks in three parallel rivers region based on complex network theory. For. Ecol. Manag. 2025, 586, 122694. [Google Scholar] [CrossRef]
  38. Xia, J. Linking ICTs to rural development: China’s rural information policy. Gov. Inf. Q. 2010, 27, 187–195. [Google Scholar] [CrossRef]
  39. Cawley, A.; Preston, P. Broadband and digital ‘content’ in the EU-25: Recent trends and challenges. Telemat. Inform. 2007, 24, 259–271. [Google Scholar] [CrossRef]
  40. LaRose, R.; Strover, S.; Gregg, J.L.; Straubhaar, J. The impact of rural broadband development: Lessons from a natural field experiment. Gov. Inf. Q. 2011, 28, 91–100. [Google Scholar] [CrossRef]
  41. Velaga, N.R.; Beecroft, M.; Nelson, J.D.; Corsar, D.; Edwards, P. Transport poverty meets the digital divide: Accessibility and connectivity in rural communities. J. Transp. Geogr. 2012, 21, 102–112. [Google Scholar] [CrossRef]
  42. Kalai, M.; Helali, K. Technical Change and Total Factor Productivity Growth in the Tunisian Manufacturing Industry: A Malmquist Index Approach. Afr. Dev. Rev. 2016, 28, 344–356. [Google Scholar] [CrossRef]
  43. Wang, S.; Peng, T.; Du, A.M.; Lin, X. The impact of the digital economy on rural industrial revitalization. Res. Int. Bus. Financ. 2025, 76, 102878. [Google Scholar] [CrossRef]
  44. Zeng, Y.; Zhou, X. The dynamic relationship among digital inclusive finance, integration of industries in rural areas, and rural revitalization. Financ. Res. Lett. 2025, 85, 107848. [Google Scholar] [CrossRef]
  45. Agyekumhene, C.; de Vries, J.R.; van Paassen, A.; Macnaghten, P.; Schut, M.; Bregt, A. Digital platforms for smallholder credit access: The mediation of trust for cooperation in maize value chain financing. NJAS Wagening. J. Life Sci. 2018, 86–87, 77–88. [Google Scholar] [CrossRef]
  46. Lajoie-O’MAlley, A.; Bronson, K.; van der Burg, S.; Klerkx, L. The future(s) of digital agriculture and sustainable food systems: An analysis of high-level policy documents. Ecosyst. Serv. 2020, 45, 101183. [Google Scholar] [CrossRef]
  47. Zhao, J.; Tan, L.Y. Operational Models and Development Strategies of Livestream E-commerce Embedded in Agricultural Product Supply Chains under the Digital Economy. Commer. Econ. Res. 2022, 22, 107–110. [Google Scholar]
  48. Zheng, M. Digital finance, e-commerce development, and regional trade development. Financ. Res. Lett. 2025, 81, 107532. [Google Scholar] [CrossRef]
  49. Kristoffersen, E.; Blomsma, F.; Mikalef, P.; Li, J. The smart circular economy: A digital-enabled circular strategies framework for manufacturing companies. J. Bus. Res. 2020, 120, 241–261. [Google Scholar] [CrossRef]
  50. Rani, T.; Wang, F.; Rehman, S.A.U.; Amjad, M.A. Shaping sustainable futures in BRICS-T economies: The role of digitalization with moderating effects of green technology innovation and financial inclusion. Technol. Soc. 2025, 82, 102879. [Google Scholar] [CrossRef]
  51. Singh, K.; Chaudhuri, R.; Chatterjee, S. Assessing the impact of digital transformation on green supply chain for achieving carbon neutrality and accelerating circular economy initiatives. Comput. Ind. Eng. 2025, 201, 110943. [Google Scholar] [CrossRef]
  52. Alvi, S.; Ahmad, I.; Nawaz, S.M.N.; Connell, W.; Anser, M.K.; Hassan, M.U. The role of green finance, energy transition, and digitalization in OECD greenhouse gas emissions. J. Clean. Prod. 2025, 518, 145865. [Google Scholar] [CrossRef]
  53. Yang, C.; Ji, X.; Cheng, C.; Liao, S.; Obuobi, B.; Zhang, Y. Digital economy empowers sustainable agriculture: Implications for farmers’ adoption of ecological agricultural technologies. Ecol. Indic. 2024, 159, 111723. [Google Scholar] [CrossRef]
  54. Saurabh, T.; Denis, J.; Bhupendra, S. Exploring the role of digital technologies in promoting circular economy practices in the Indian agriculture sector. Manish Kumar and Vivek Agarwal and Rachel Louise Gomes and Durga Prasad Panday. In Water Sustainability and Hydrological Extremes; Elsevier: Amsterdam, The Netherlands, 2025; pp. 333–357. [Google Scholar] [CrossRef]
  55. Yang, L.; Ma, Z.; Xu, Y. How does the digital economy affect ecological well-being performance? Evidence from three major urban agglomerations in China. Ecol. Indic. 2023, 157, 111261. [Google Scholar] [CrossRef]
  56. Wan, G.; Yang, L.; Hao, Y.; Geng, Y. Assessing the impacts of digital economy on urban green development efficiency. Sustain. Futur. 2025, 10, 100910. [Google Scholar] [CrossRef]
  57. Zhang, X.; Fan, D. Can agricultural digital transformation help farmers increase income? An empirical study based on thousands of farmers in Hubei Province. Environ. Dev. Sustain. 2023, 26, 14405–14431. [Google Scholar] [CrossRef] [PubMed]
  58. Guo, L.; Wang, F.; Zeng, S.J. Digital Economy, Rural Revitalization, and High-Quality Employment for Farmers. Survey World 2023, 10, 3–11. [Google Scholar]
  59. Huang, C.; Du, A.M.; Lin, B. How does the digital economy affect the green transition: The role of industrial intelligence and E-commerce. Res. Int. Bus. Financ. 2024, 73, 102541. [Google Scholar] [CrossRef]
  60. Hajjar, R.; Newton, P.; Ihalainen, M.; Agrawal, A.; Alix-Garcia, J.; Castle, S.E.; Erbaugh, J.T.; Gabay, M.; Hughes, K.; Mawutor, S.; et al. Levers for alleviating poverty in forests. For. Policy Econ. 2021, 132, 102589. [Google Scholar] [CrossRef]
  61. Ding, K.K.; Ma, Z.B.; Wang, T. Study on the Impact of Rural Digital Economy on Farmers’ Income and Its Spatial Hetero-geneity. Resour. Environ. Arid Areas. 2024, 38, 90–99. [Google Scholar]
  62. Xu, Q.; Zhong, M. The impact of income inequity on energy consumption: The moderating role of digitalization. J. Environ. Manag. 2022, 325, 116464. [Google Scholar] [CrossRef] [PubMed]
  63. Wang, F.; Shen, S. Does the digital economy development improve or exacerbate income inequality? International evidence. Manag. Decis. Econ. 2024, 45, 4012–4038. [Google Scholar] [CrossRef]
  64. Borgogno-Mondino, E.; De Petris, S.; Sarvia, F.; Momo, E.J.; Sussio, F.; Pari, P. Adoption of Digital Aerial Photogrammetry in Forest Planning: A Case Study of Canavese Forestry Consortium, NW Italy with Technical and Economic Issues. Land 2022, 11, 1350. [Google Scholar] [CrossRef]
  65. Chang, H.; Xiong, K.; Zhu, D.; Zhang, Z.; Zhang, W. Ecosystem Services Value Realization and Ecological Industry Design in Scenic Areas of Karst in South China. Forests 2024, 15, 363. [Google Scholar] [CrossRef]
  66. Wang, J.; Zhu, J.; Luo, Q. Measurement of the Development Level and Evolution of China’s Digital Economy. J. Quant. Tech. Econ. 2021, 38, 26–42. [Google Scholar]
  67. Kong, F.B.; Cheng, W.J.; Xu, C.Y. Conversion Efficiency of Forest Ecological Capital to Economic Value and Its Influ-encing Factors in National Pilot Areas. Sci. Silvae Sin. 2023, 59, 1–11. [Google Scholar]
  68. Lü, X.Y.; Wu, J.J. Digital Economy, Rural Industrial Revitalization, and Common Prosperity for Farmers. Stat. Decis. 2024, 40, 11–15. [Google Scholar]
  69. Li, Y.; Chen, H.L.; Tian, M.Z. Statistical Measurement and Spatiotemporal Evolution of the New Quality Productive Forces. Stat. Decis. 2024, 40, 11–17. [Google Scholar]
  70. Bassett, G.; Koenker, R. Asymptotic Theory of Least Absolute Error Regression. J. Am. Stat. Assoc. 1978, 73, 618–622. [Google Scholar] [CrossRef]
  71. Nie, R.; Yang, D.; Shen, D.J. An Empirical Study on the Impact of Rural Income Classes on Household Consumption Structure in China: Micro Evidence Based on CFPS Data. J. Northeast. Univ. 2020, 22, 29–37. [Google Scholar]
  72. Li, G.C.; Li, Y.Y.; Zhou, X.S. Agricultural Mechanization, Labor Transfer, and Farmers’ Income Growth: Cause or Effect? China Rural. Econ. 2018, 11, 112–127. [Google Scholar]
  73. Cao, X.L.; Ren, Y.H. Forest Resource Abundance, Ecological Product Value Realization, and Rural Household Income. J. China Agric. Univ. 2024, 29, 34–49. [Google Scholar]
  74. Chen, X.M.; Yu, K. The Impact of Rural Industrial Integration on Rural Household Income: An Empirical Analysis Based on the Spatial Durbin Model. J. Xiangtan Univ. 2022, 46, 66–73. [Google Scholar]
  75. Zhao, X.D.; Li, L.C.; Yang, W.T.; Cheng, B.D.; Liu, J.L. Analysis of Socioeconomic Factors Influencing Forest Transition at the County Level in Fujian Province. Sci. Silvae Sin. 2019, 55, 147–156. [Google Scholar]
  76. Wang, X.H.; Li, X.T.; Zhang, S.P. Does a Polycentric Spatial Structure Promote High-Quality Urban Development? Empirical Evidence from Prefecture-Level Cities in China. China Popul. Resour. Environ. 2022, 32, 57–67. [Google Scholar]
  77. Bai, P.W.; Yu, L. Digital Economy Development and Corporate Price Markups: Theoretical Mechanisms and Empirical Evidence. China Ind. Econ. 2021, 11, 59–77. [Google Scholar]
  78. He, E.; Wang, M.C.; Li, Y.C. Is Digitalization of Inclusive Finance a “Digital Dividend”? From the Perspective of Rural Household Income Growth. South. Financ. 2020, 12, 71–84. [Google Scholar]
  79. Wang, P. “Rural-to-Urban Conversion,” Returns to Human Capital, and Income Inequality: A Quantile Regression Decompo-sition Approach. Shehui 2017, 37, 217–241. [Google Scholar]
  80. Tao, J.; Wang, Z.; Xu, Y.; Zhao, B.; Liu, J. Can the digital economy boost rural residents’ income? Evidence from China based on the spatial Durbin model. Econ. Anal. Policy 2024, 81, 856–872. [Google Scholar] [CrossRef]
  81. Yang, R.; Li, Y.; Li, Y. The spatial effects of digital inclusive finance and traditional finance on the income of the migrant population: A comparative analysis of 243 cities in China. Int. Rev. Financ. Anal. 2025, 102, 104054. [Google Scholar] [CrossRef]
  82. Grishchenko, N. Spatial-temporal evolution of digital skills in the EU countries. Telemat. Inform. 2024, 94, 102185. [Google Scholar] [CrossRef]
  83. Hu, M.; Zheng, Y.; Chen, G.; Li, Z. Spatio-temporal synergies of digital economy and green finance: Catalyzing green low-carbon transition in the Yangtze River Delta Region. J. Environ. Manag. 2025, 390, 126199. [Google Scholar] [CrossRef] [PubMed]
  84. Han, J.; Wang, J.; Zhang, W. Digital Adoption levels and income generation in rural households in China. Heliyon 2023, 9, e21045. [Google Scholar] [CrossRef] [PubMed]
  85. Shen, C.; Wu, X.; Shi, L.; Wan, Y.; Hao, Z.; Ding, J.; Wen, Q. How does the digital economy affect the urban–rural income gap? Evidence from Chinese cities. Habitat Int. 2025, 157, 103327. [Google Scholar] [CrossRef]
  86. Xia, H.; Yu, H.; Wang, S.; Yang, H. Digital economy and the urban–rural income gap: Impact, mechanisms, and spatial heterogeneity. J. Innov. Knowl. 2024, 9, 100505. [Google Scholar] [CrossRef]
  87. de Moraes, C.O.; Roquete, R.M.; Gawryszewski, G. Who needs cash? Digital finance and income inequality. Q. Rev. Econ. Financ. 2023, 91, 84–93. [Google Scholar] [CrossRef]
  88. Zhu, H.; Zhu, J.; Zhu, Y. Quantifying change: The impact of digital financial inclusion across income quantiles in China. China Econ. Rev. 2025, 91, 102399. [Google Scholar] [CrossRef]
Figure 1. Spatial location map of 31 provinces, municipalities, and autonomous regions in China.
Forests 16 01172 g001
Figure 2. Nuclear density of RDE levels from 2011–2021.
Forests 16 01172 g002
Figure 3. Temporal and spatial evolution trends of RDE in China.
Forests 16 01172 g003
Figure 4. The level of RDE in China, 2011–2021.
Forests 16 01172 g004
Figure 5. Nuclear density of FI levels from 2011–2021.
Forests 16 01172 g005
Figure 6. Temporal and spatial evolution trends of FI levels in China.
Forests 16 01172 g006
Figure 7. Per capita disposable income levels of farmers in China, 2011–2021.
Forests 16 01172 g007aForests 16 01172 g007b
Figure 8. Quantile regression trend chart showing the relationship between RDE and FI.
Forests 16 01172 g008
Table 1. Literature summary.
Reserch TopicRepresentative LiteratureContent Summary
RDE and FIFan et al. (2006) [6], Močnik et al. (2010) [7], Tiwasing et al. (2022) [8], Playán et al. (2024) [9], Johnson (2024) [10], Odewole et al. (2024) [11], Fakhraddine et al. (2025) [12], Zhou et al. (2025) [13], Kim (2006) [14], Burbridge et al. (2009) [15], Berdykulova et al. (2014) [16], Erdiaw-Kwasie et al. (2016) [17], Zhao et al. (2020) [18], Fang et al. (2024) [19]A comprehensive review of both domestic and international literature confirms the significant positive impact of the digital economy on FI, thereby establishing a robust theoretical basis for this study. Furthermore, the diverse approaches adopted by various countries to assess and quantify the digital economy offer important methodological references for developing a scientifically rigorous and well-structured indicator system. Building on these existing studies, this research is further inspired to explore novel pathways and perspectives through which the digital economy can enhance FI.
VRF and FIVosti et al. (2003) [20], Sikora et al. (2012) [21], Sonntag-Öströmet et al. (2014) [22], and Kerchner et al. (2015) [23], Zhu et al. (2017) [24], Jonsson et al. (2021) [25], Agnoletti et al. (2022) [26], Jaung et al. (2022) [27], Kacprzak et al. (2024) [28], Wang et al. (2025) [29], Zhang et al. (2025) [30], Isely et al. (2010) [31], Galli (2015) [32], Pohjola et al. (2018) [33], Nguyen et al. (2022) [34], Zhan et al. (2024) [35], Lou et al. (2024) [36], Song et al. (2025) [37]The critical role of VRF in enhancing FI has been well recognized. This study details the mechanisms by which forest ecological products contribute value across economic, social, ecological, and cultural spheres, underscoring the importance of this research area. Additionally, the various valuation methods developed by scholars offer a strong theoretical basis and methodological support in this work for building the indicator framework and computing a comprehensive index.
The Synergistic Mechanism Linking RDE, VRF, and FIXia (2010) [38], Cawley et al. (2007) [39], LaRose, R et al. (2011) [40], Velaga et al. (2012) [41], Kalai et al. (2016) [42], Wang et al. (2025) [43], Zeng et al. (2025) [44], Agyekumhene et al. (2018) [45], Lajoie-O’MAlley et al. (2020) [46], Zhao et al. (2022) [47], Zheng et al. (2025) [48], Kristoffersen et al. (2020) [49], Rani Zheng et al. (2025) [50], Singh et al. (2025) [51], Alvi et al. (2025) [52], Yang et al. (2024) [53], Saurabh et al. (2025) [54], Yang et al. (2023) [55], Wan et al. (2025) [56]A comprehensive review of domestic and international literature indicates that research on the digital economy’s role in boosting FI predominantly emphasizes the enhancement of digital infrastructure, the integration of rural industries, the expansion of digital financial services, the diversification of agricultural product marketing channels, and the optimization of rural employment patterns. Meanwhile, studies focusing on green and sustainable development mainly address improvements in energy efficiency, reductions in carbon emissions, the advancement of sustainable agricultural practices, and the enhancement of ecological well-being. These insights offer valuable theoretical foundations and references for incorporating VRF as a mediating mechanism by which the digital economy fosters increases in FI.
Table 2. Hypotheses summary table.
HypothesisHypothesis StatementHypothesis ObjectiveResearch MethodTest ResultsMain Conclusions
Hypothesis 1The RDE has a significant positive effect on FI.To verify whether the RDE has a positive and significant impact on FI.Fixed Effects Regression Modelp < 0.01The hypothesis is confirmed. The RDE has a significant positive effect on FI.
Hypothesis 2The effect of RDE on FI varies by location.To explore whether the impact of the RDE on FI varies across different locations.Regional Heterogeneity AnalysisEastern, Central, and Western regions: p < 0.01; Northeast region: p > 0.1The hypothesis is confirmed. The effect of the RDE on FI varies by location.
Hypothesis 3The RDE has the capacity to reduce income disparities among famers, to a certain degree.To examine whether the RDE helps reduce income disparities among farmers.Quantile Heterogeneity Analysisp < 0.01The hypothesis is confirmed. The RDE exerts different effects on farmers with varying income levels and can reduce income disparities among farmers, to some extent.
Hypothesis 4VRF serves as a critical link between FI and RDE.To explore whether VRF serves as a mediating factor between the RDE and FI.Mediating Effect Analysisp < 0.1The hypothesis is confirmed. VRF serves as a critical link between FI and the RDE.
Table 3. Comprehensive evaluation index system of the level of the RDE.
Primary IndicatorsSecondary IndicatorsSpecific IndicatorsUnitsAttributes
Rural digital economy Rural digital infrastructureRural households with broadband access/total rural households%positive
Rural households with mobile phone/100 rural householdssetpositive
Rural households with computer/100 rural householdssetpositive
Industrial digitalizationPeking University Digital Inclusive Finance Index positive
Rural delivery line length/provincial areakm/ten thousand km2positive
Number of Taobao villages/total number of administrative villages%positive
Table 4. Input–output index system of VRF.
Indicator TypePrimary IndicatorsSecondary IndicatorsTertiary IndicatorsUnits
Input indexForest ecological capitalForest resourcesForest area10,000 ha
Forestry land resourcesForestry land area10,000 ha
Main forest productsTimber harvesting10,000 m3
Forestry social capitalForestry labor resourcesForestry practitioners10,000 people
Forestry capital investmentForestry fixed assets100,000,000 CNY
Output indexForestry economic output valueTotal value of forestry industryTotal output value of the three forestry industries100,000,000 CNY
Table 5. Descriptive statistics of each variable.
VariableObsMeanStd. Dev.MinMax
F I 3419.4010.4168.36110.559
R D E 3410.3560.1320.0120.653
V R F 3410.9070.9510.1569.945
G D P 34110.8190.4529.68212.142
F W 34110.5421.2246.83212.226
I S 3410.4050.0800.1600.620
B T 3410.9270.5250.0522.234
F Q 3413.8780.5502.3595.035
Table 6. Results of benchmark regression analysis.
OLSFE
(1)(2)(3)(4)
R D E 2.583 ***
(69.717)
0.680 ***
(8.475)
2.579 ***
(69.444)
0.622 ***
(7.344)
G D P 0.816 ***
(26.743)
0.841 ***
(26.205)
F W 0.040 **
(2.160)
0.105
(1.338)
I S −0.547 ***
(−5.219)
−0.608 ***
(−5.499)
B T −0.080 ***
(−2.767)
−0.110 ***
(−2.977)
F Q 0.055 **
(2.060)
0.060 *
(1.686)
Constant8.481 ***
(237.647)
−0.005
(−0.014)
8.482 ***
(613.286)
−0.913
(−1.087)
Control variableNOYESNOYES
R-squared 0.9400.982
Observations341341341341
Note: ***, **, and * indicate significance levels of 1%, 5%, and 10%, respectively.
Table 7. Test results for the intermediary effect.
F I V R F F I
(1) Total Effect(2) Direct Effect(3) Indirect Effect
R D E 0.622 ***
(7.344)
4.689 **
(2.567)
0.602 ***
(7.046)
V R F 0.004 *
(1.656)
G D P 0.841 ***
(26.205)
−1.517 **
(−2.192)
0.848 ***
(26.281)
F W 0.105
(1.338)
−1.832
(−1.081)
0.113
(1.441)
I S −0.608 ***
(−5.499)
2.684
(1.126)
−0.620 ***
(−5.610)
B T −0.110 ***
(−2.977)
0.301
(0.379)
−0.111 ***
(−3.021)
F Q 0.060 *
(1.686)
−0.439
(−0.575)
0.062 *
(1.745)
Constant−0.913
(−1.087)
35.288 *
(1.949)
−1.069
(−1.268)
Control variableYESYESYES
R-squared0.9820.0280.982
Observations341341341
Note: ***, **, and * indicate significance levels of 1%, 5%, and 10%, respectively.
Table 8. Endogeneity and robustness tests.
Ming Dynasty Postal Relay StationsNumber of Post Offices in 1984Replace Explained VariableReject Part of the Sample
First StageSecond StageFirst StageSecond Stage
R D E F I R D E F I
(1)(2)(3)(4)(5)(6)
M S 0.001 ***
(6.919)
P O 0.053 ***
(8.816)
R D E 0.683 ***
(3.054)
1.437 ***
(6.060)
0.736 ***
(9.487)
0.606 ***
(6.334)
Constant−2.292
(−18.498)
1.555 ***
(2.665)
−2.072 ***
(−16.034)
3.321 ***
(6.190)
3.198 ***
(4.157)
−2.072 **
(−2.341)
Control variableYESYESYESYESYESYES
R20.7510.9120.7690.9160.9750.982
Observations341341341341341297
Note: *** and ** indicate significance levels of 1% and 5%, respectively.
Table 9. Analysis of the geographical heterogeneity of RDE development.
Eastern RegionCentral RegionWestern RegionNortheast Region
(1)(2)(3)(4)
R D E 0.611 ***
(4.479)
0.781 ***
(4.063)
0.520 ***
(2.974)
−0.152
(−0.883)
Constant2.713 ***
(2.827)
−8.843 **
(−2.214)
−3.383 **
(−2.476)
−4.095
(−0.563)
Control variableYESYESYESYES
R-squared0.9890.9930.9860.997
Observations1106613233
Note: *** and ** indicate significance levels of 1% and 5%, respectively.
Table 10. Quantile effect of RDE on FI.
Quantile Point
0.100.250.500.750.90
R D E 2.956 ***2.806 ***2.600 ***2.781 ***3.089 ***
(23.546)(32.834)(27.911)(22.870)(21.579)
Constant8.135 ***8.278 ***8.468 ***8.517 ***8.565 ***
(146.662)(239.667)(246.484)(245.540)(145.996)
R-squared0.5470.5700.5550.5120.495
Observations341341341341341
Note: *** indicates significance of 1%.
Disclaimer/Publisher’s Note: The statements, opinions and data contained in all publications are solely those of the individual author(s) and contributor(s) and not of MDPI and/or the editor(s). MDPI and/or the editor(s) disclaim responsibility for any injury to people or property resulting from any ideas, methods, instructions or products referred to in the content.

