1. Introduction
Forest activities, especially final harvest, can potentially affect the surface sediment dynamics of catchments due to the reduction in vegetation, physical modifications to the soil surface (e.g., compaction), and changes in hillslope–channel connectivity. If these activities are not thoughtfully planned, they can lead to increased runoff, promote soil erosion, and sediment delivery to stream networks [
1,
2].
The forestry sector contributes significantly to the national Gross Domestic Product [
3]. The economic importance of this industry has driven substantial expansion of commercial forest plantations, primarily of
Pinus radiata and
Eucalyptus spp., which now cover approximately 875,000 ha in the Biobío Region [
4]. This region accounts for 32.5% of the total GDP of the forestry sector.
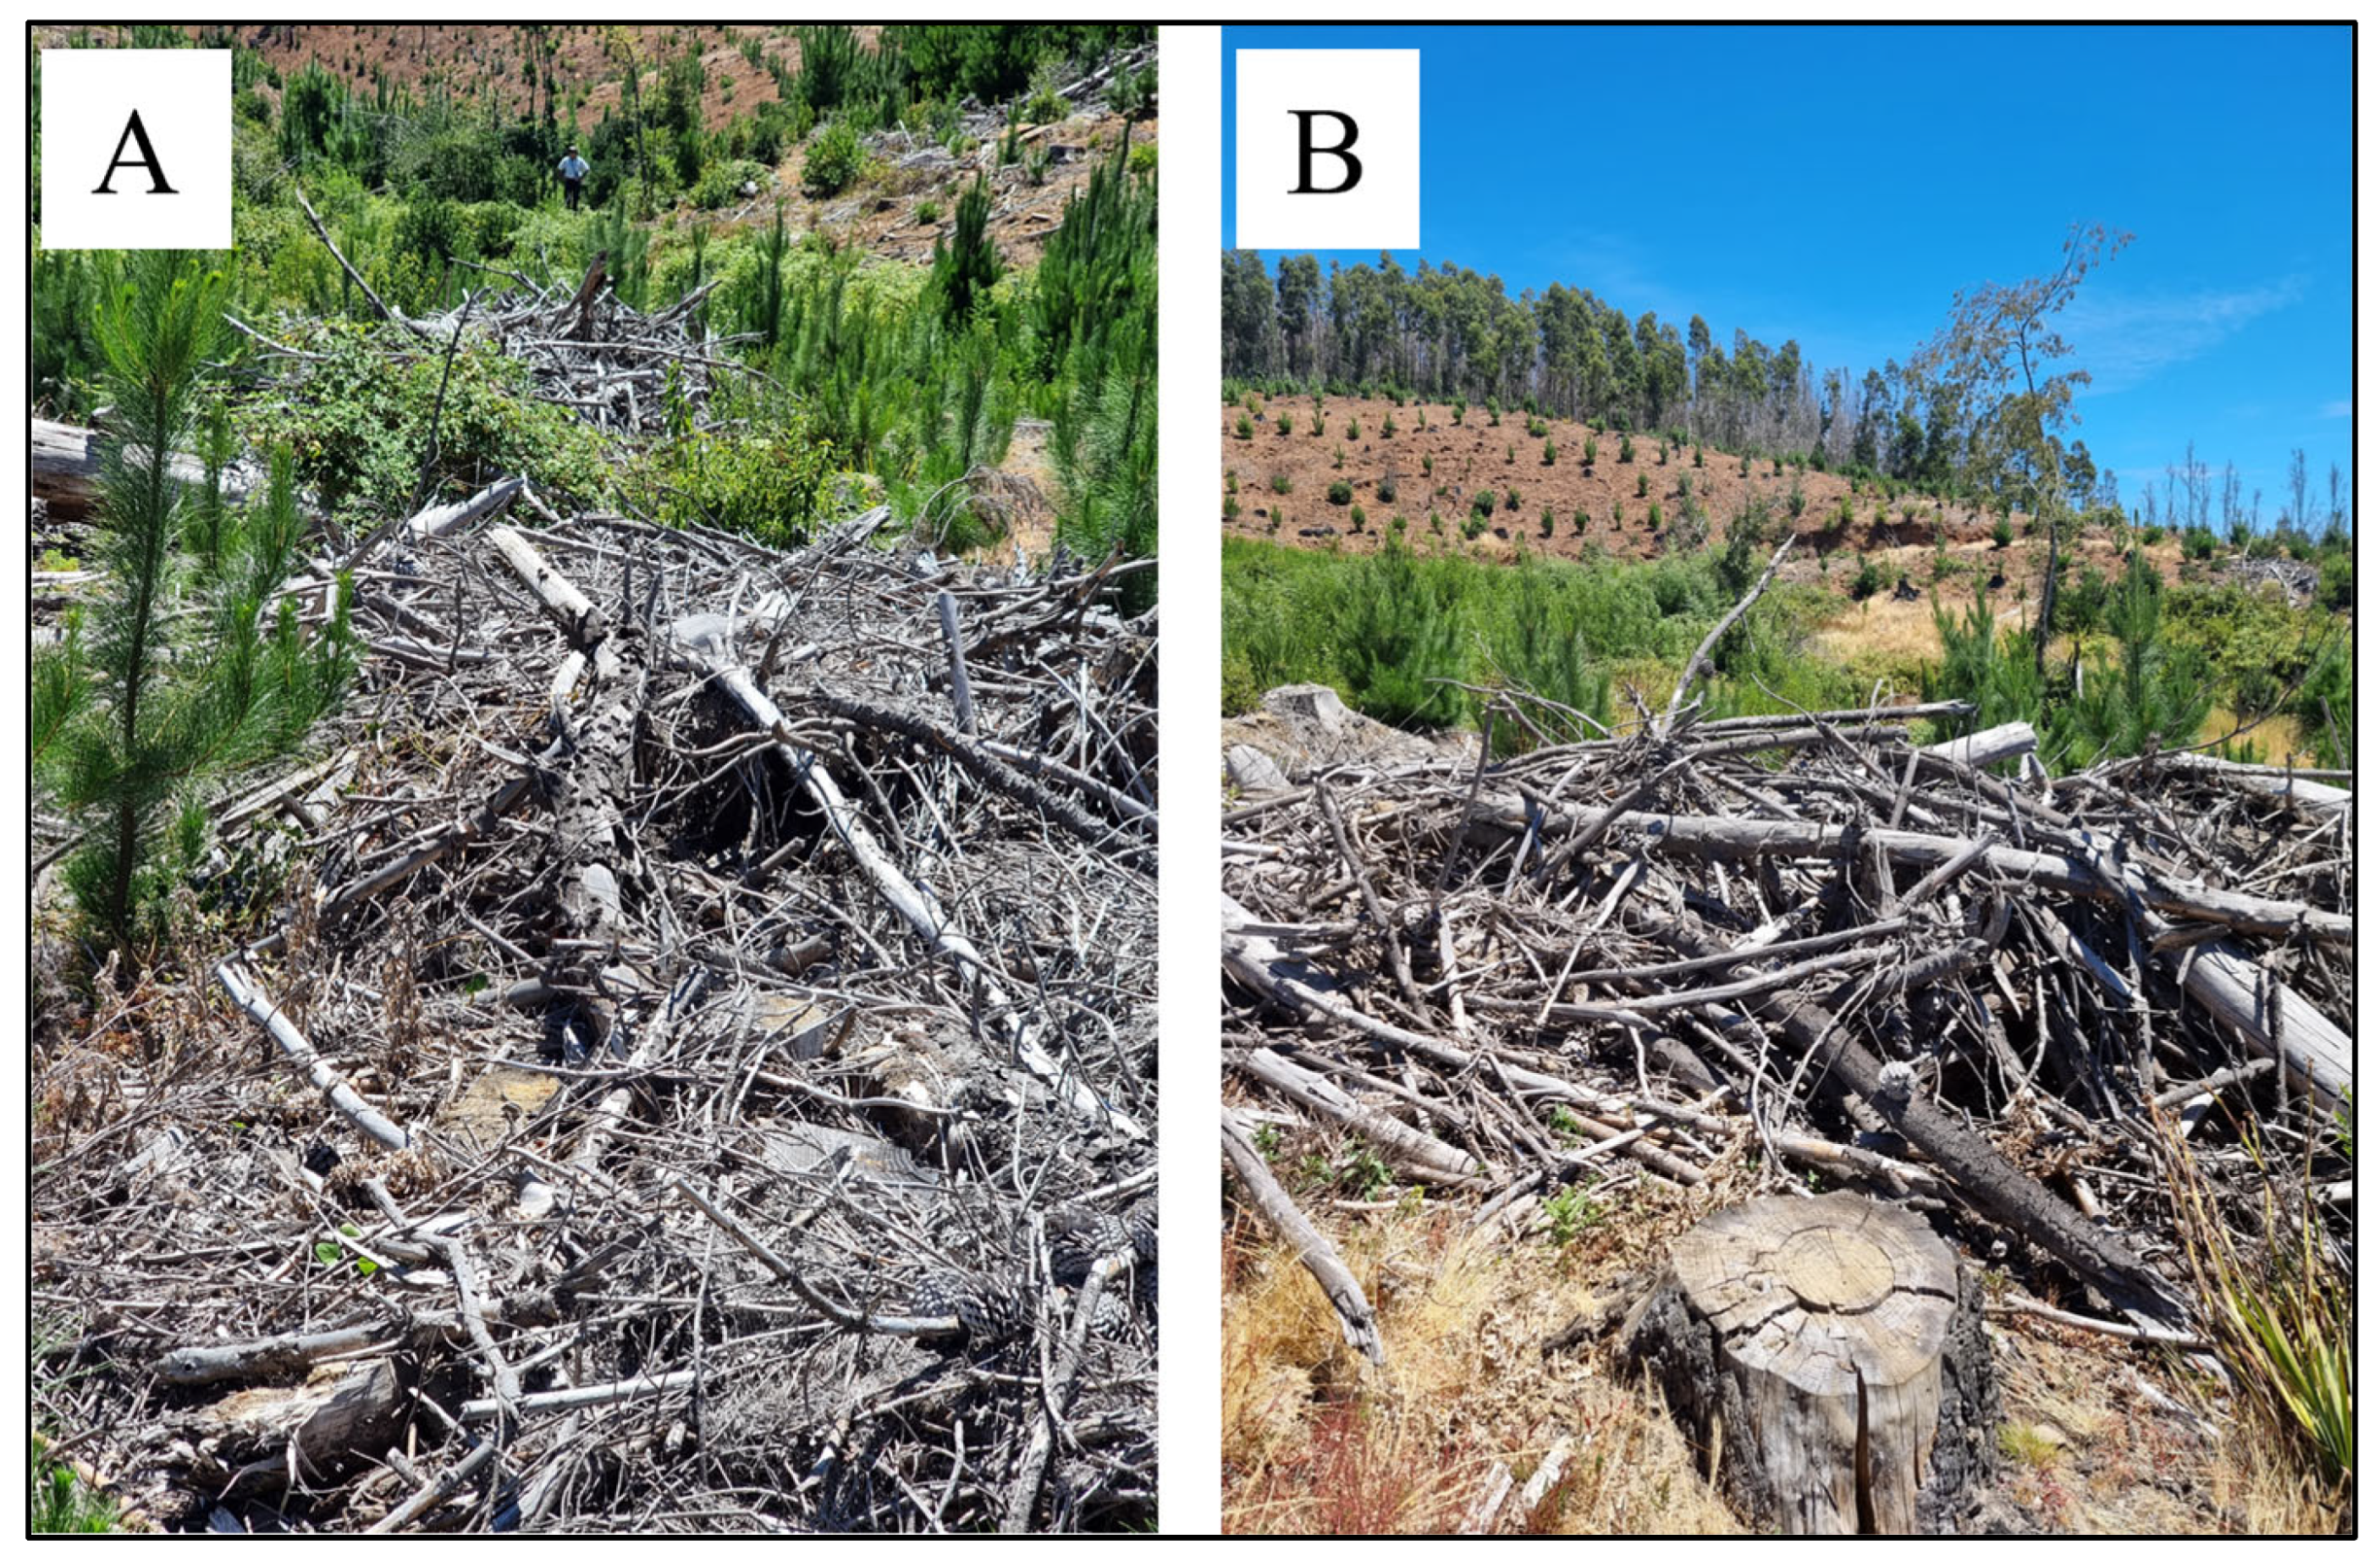
To mitigate environmental impacts associated with harvesting, sustainable forest management practices are implemented before, during, and after operations. These practices aim to minimize soil exposure, regulate water flow, and intercept mobilized sediments before they reach stream channels. Measures may include pre-harvest planning of roads, skid trails and water diversion structures, limiting machinery traffic during harvesting, and post-harvest use of logging residues arranged in rows along hillslopes (
Figure 1) (hereafter referred to a “windrows” as in [
5,
6]) to reduce erosion and control sediment fluxes [
7,
8].
Windrows represent a potentially effective approach for post-harvest sediment management, and their setup varies substantially in terms of density, orientation, size, and placement relative to topographic features. Previous research by ref. [
7] found that these windrows could reduce sediment delivery after harvest, but their effectiveness depends on their placement along the slope, spacing, and overall configuration. During extreme erosive events, these barriers become less effective; therefore, their design should be improved, and finer debris should be left between barriers to protect soils. Other studies have shown that the orientation of erosion barriers relative to slope direction significantly influences their effectiveness, with barriers aligned with the contour lines generally outperforming those placed in other orientations [
8,
9].
The spatial relationship between sediment control measures and channel networks can also influence their effectiveness. In 2004, ref. [
10] introduced the concept of critical source areas, locations within catchments that disproportionately contribute to sediment delivery downstream. Management interventions targeting these areas may achieve greater benefits than a uniform application across the landscape. However, to optimize the placement of residue windrows, a better understanding is needed of how their effectiveness varies with distance from drainage channels and other landscape features, using high-resolution spatial analysis methodologies.
Recent methodological advances in remote sensing, particularly LiDAR (Light Detection and Ranging) technology, have allowed for a more detailed assessment of land surface features. High-resolution digital terrain models (DTMs) derived from LiDAR data can capture fine-scale topographic features, including anthropogenic modifications, such as residue windrows, allowing for more accurate modeling of their effects on hydrological and sediment connectivity [
11,
12].
Sediment connectivity, defined as the degree to which sediment can move through a landscape from source to sink [
13], is a critical concept for understanding how management practices can influence sediment transport. Recent advances in connectivity theory and assessment methods, including the development of the Index of Connectivity (IC) [
14], have enabled more accurate analysis of how landscape features and management interventions affect sediment transport pathways [
15,
16]. The IC is a spatially explicit tool for evaluating potential sediment transfer, considering both topography and, when necessary, land cover characteristics [
14]. It combines an upslope contributing component with a downslope path-weighting factor and is calculated based on a digital terrain model (DTM), capturing the potential for sediment flow from each pixel to a defined target zone [
17].
In the forestry sector, there is a growing need to improve and ensure post-harvest sustainability management practices to effectively control potential soil erosion and surface sediment transport. This is because the characteristics and conditions of the soil are one of the key factors that define the potential forest site productivity. While numerous studies have explored forest operations and erosion control measures, few have applied spatially explicit sediment connectivity frameworks to evaluate how specific management practices, such as windrow placement, influence sediment detachment and transfer potential. In particular, there is a lack of studies using high-resolution structural connectivity indices to support the planning and optimization of erosion control strategies in post-harvest landscapes.
To address this gap, this study aims to (1) quantify the effects of residue windrows on structural sediment connectivity at the catchment scale; (2) analyze how windrow orientation influences their effectiveness; and (3) examine the spatial relationships between windrow characteristics (placement, morphometry, volume), topographic features, and changes in connectivity. The approach focuses on structural connectivity derived from terrain analysis as a proxy to assess the landscape’s potential for sediment transfer in the absence of direct sediment measurements.
2. Study Area
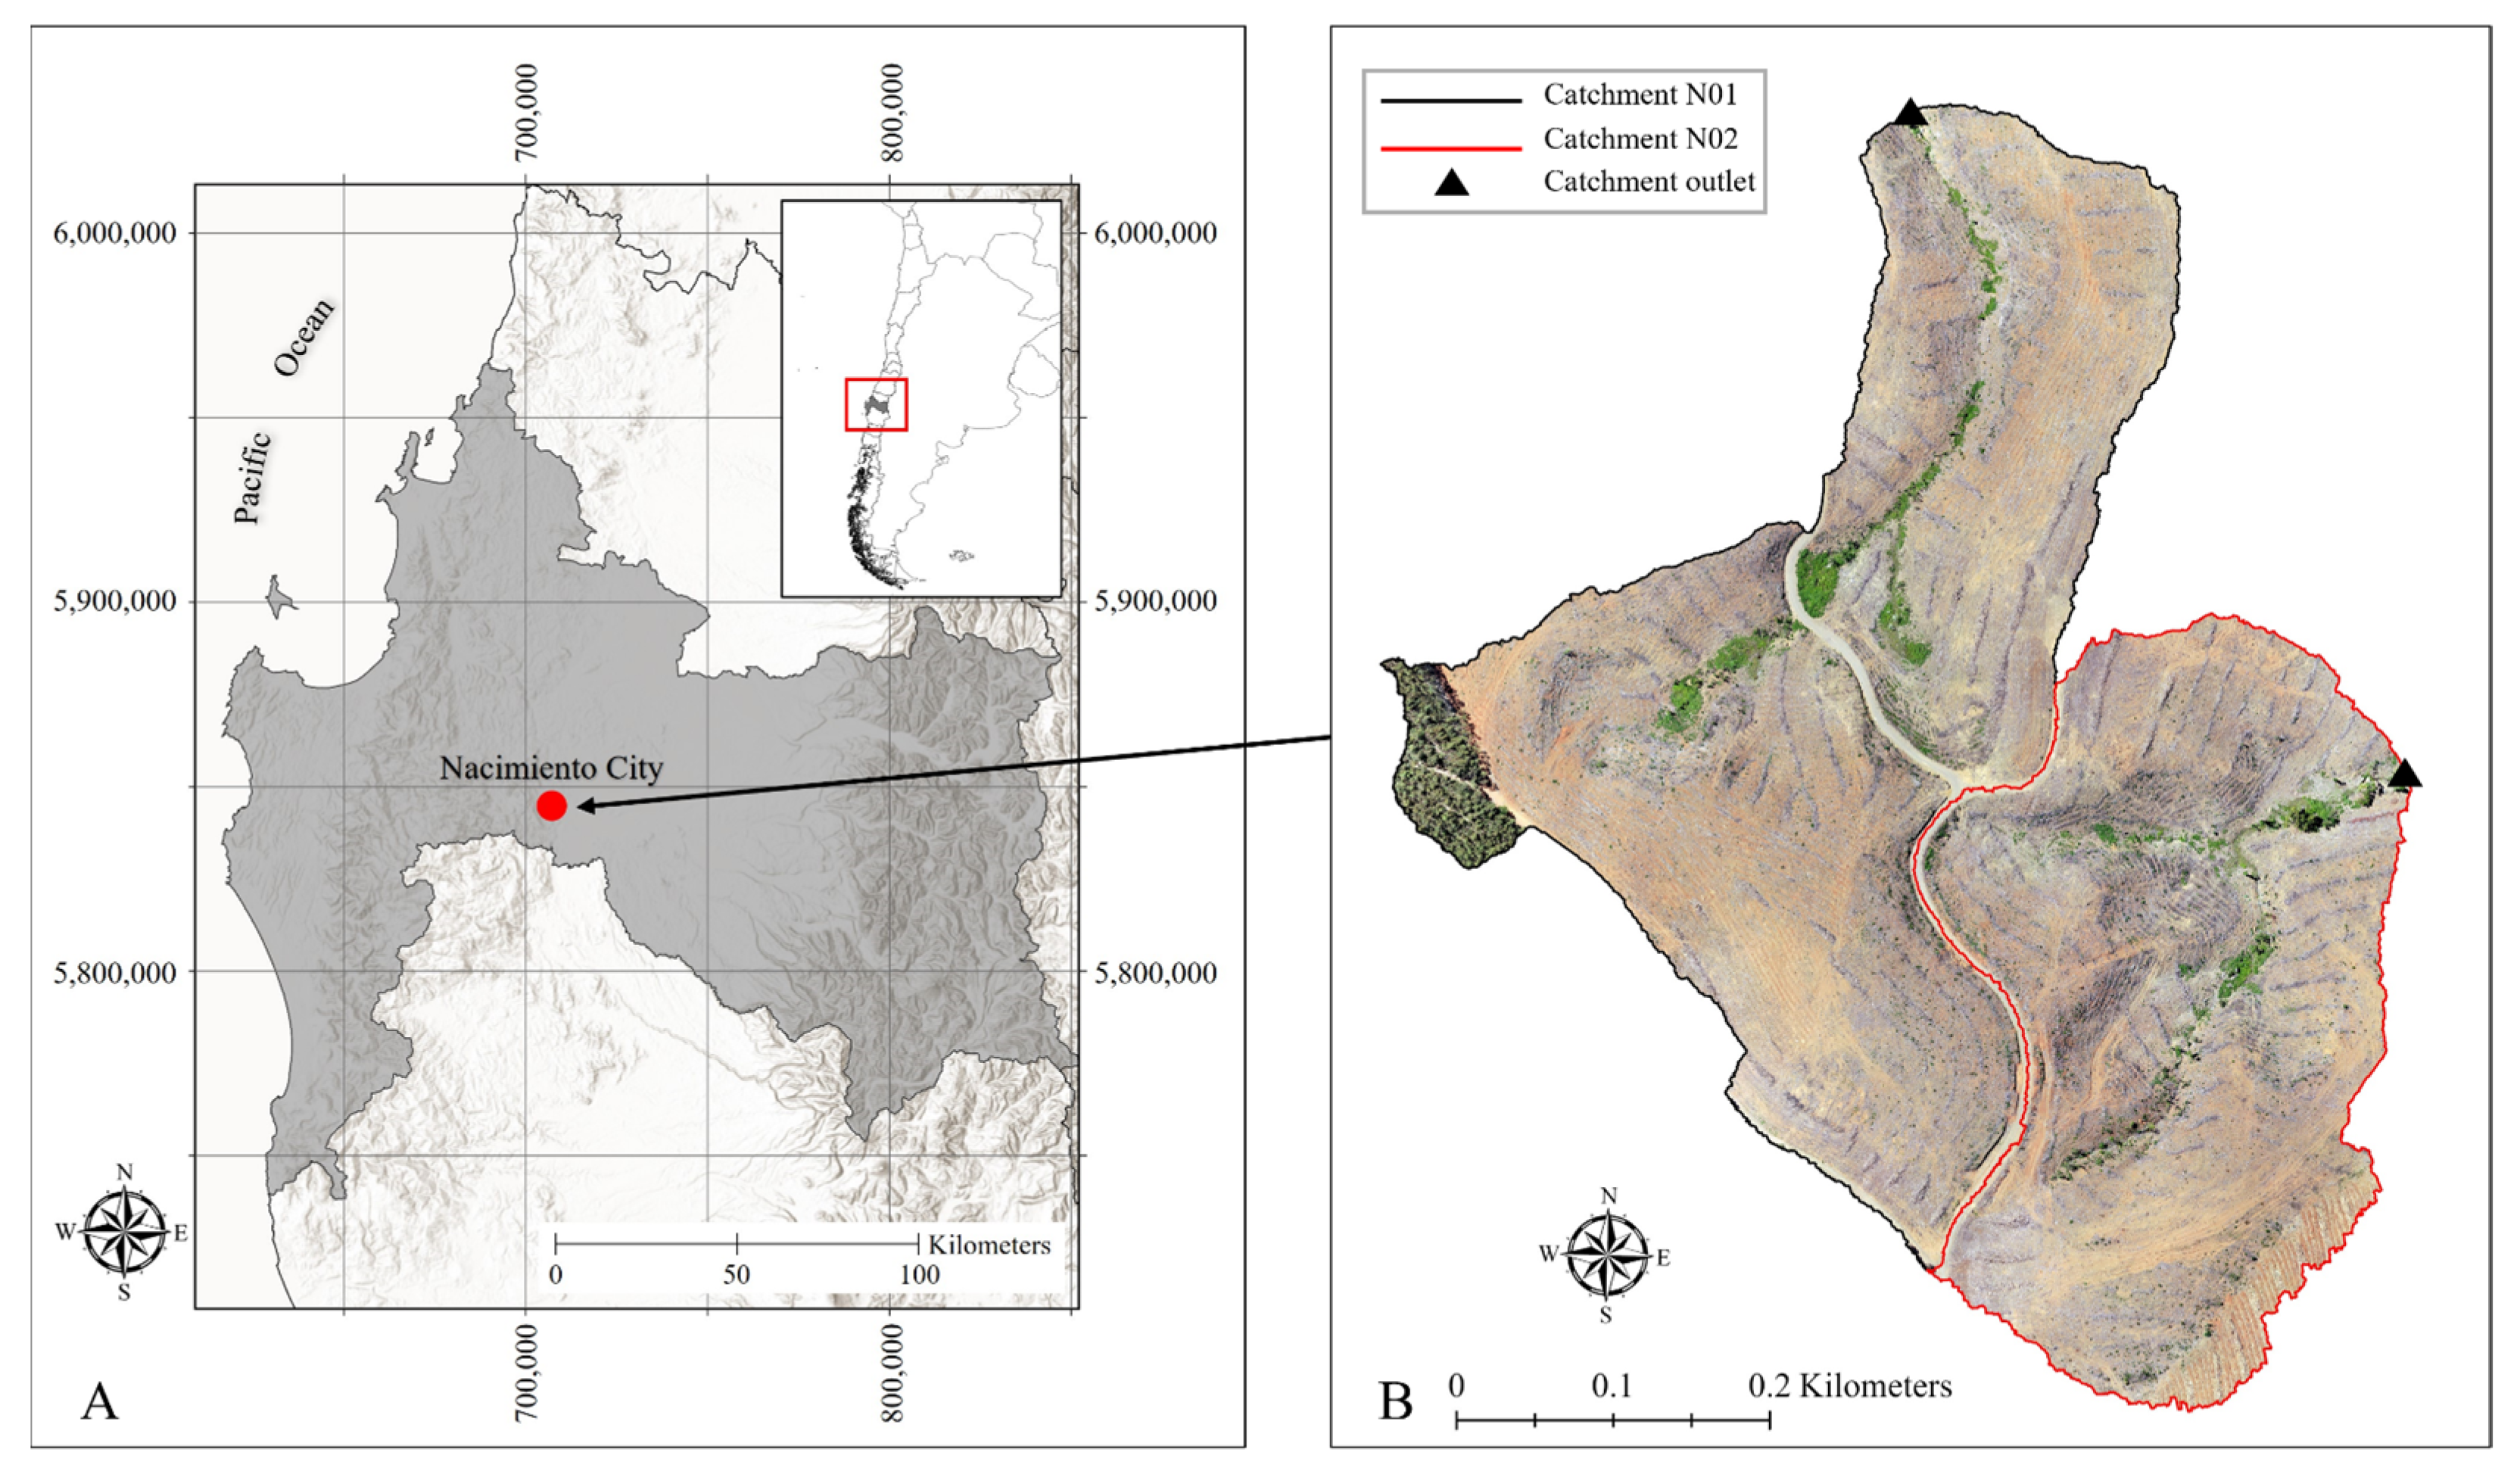
This study was conducted in two forest catchments (denoted N01 and N02) located in the central-southern region of Chile, west of the city of Nacimiento, in the Biobío Region (
Figure 2). These catchments belong to the forest company Forestal Mininco SpA. (Los Angeles, Chile) and are situated within the Chilean Coastal Range, with elevations ranging from 149 to 373 m a.s.l. The dominant soil type in the study area is a clay to silty Luvisol underlined by deeply weathered saprolite over a schist bedrock.
The area is characterized by a subtropical Mediterranean climate with a dry summer (from December to March) and a long-term average annual precipitation of 1381 mm, mostly concentrated (95%) between April and September [
18]. Precipitation events can last several days, but intensities exceeding 20 mm h
−1 rarely occur. Temperatures range from −3 °C in winter to over 40 °C in summer [
18]. The region has been affected by a prolonged drought since 2010, with a precipitation deficit exceeding 20% of the long-term annual average [
19,
20].
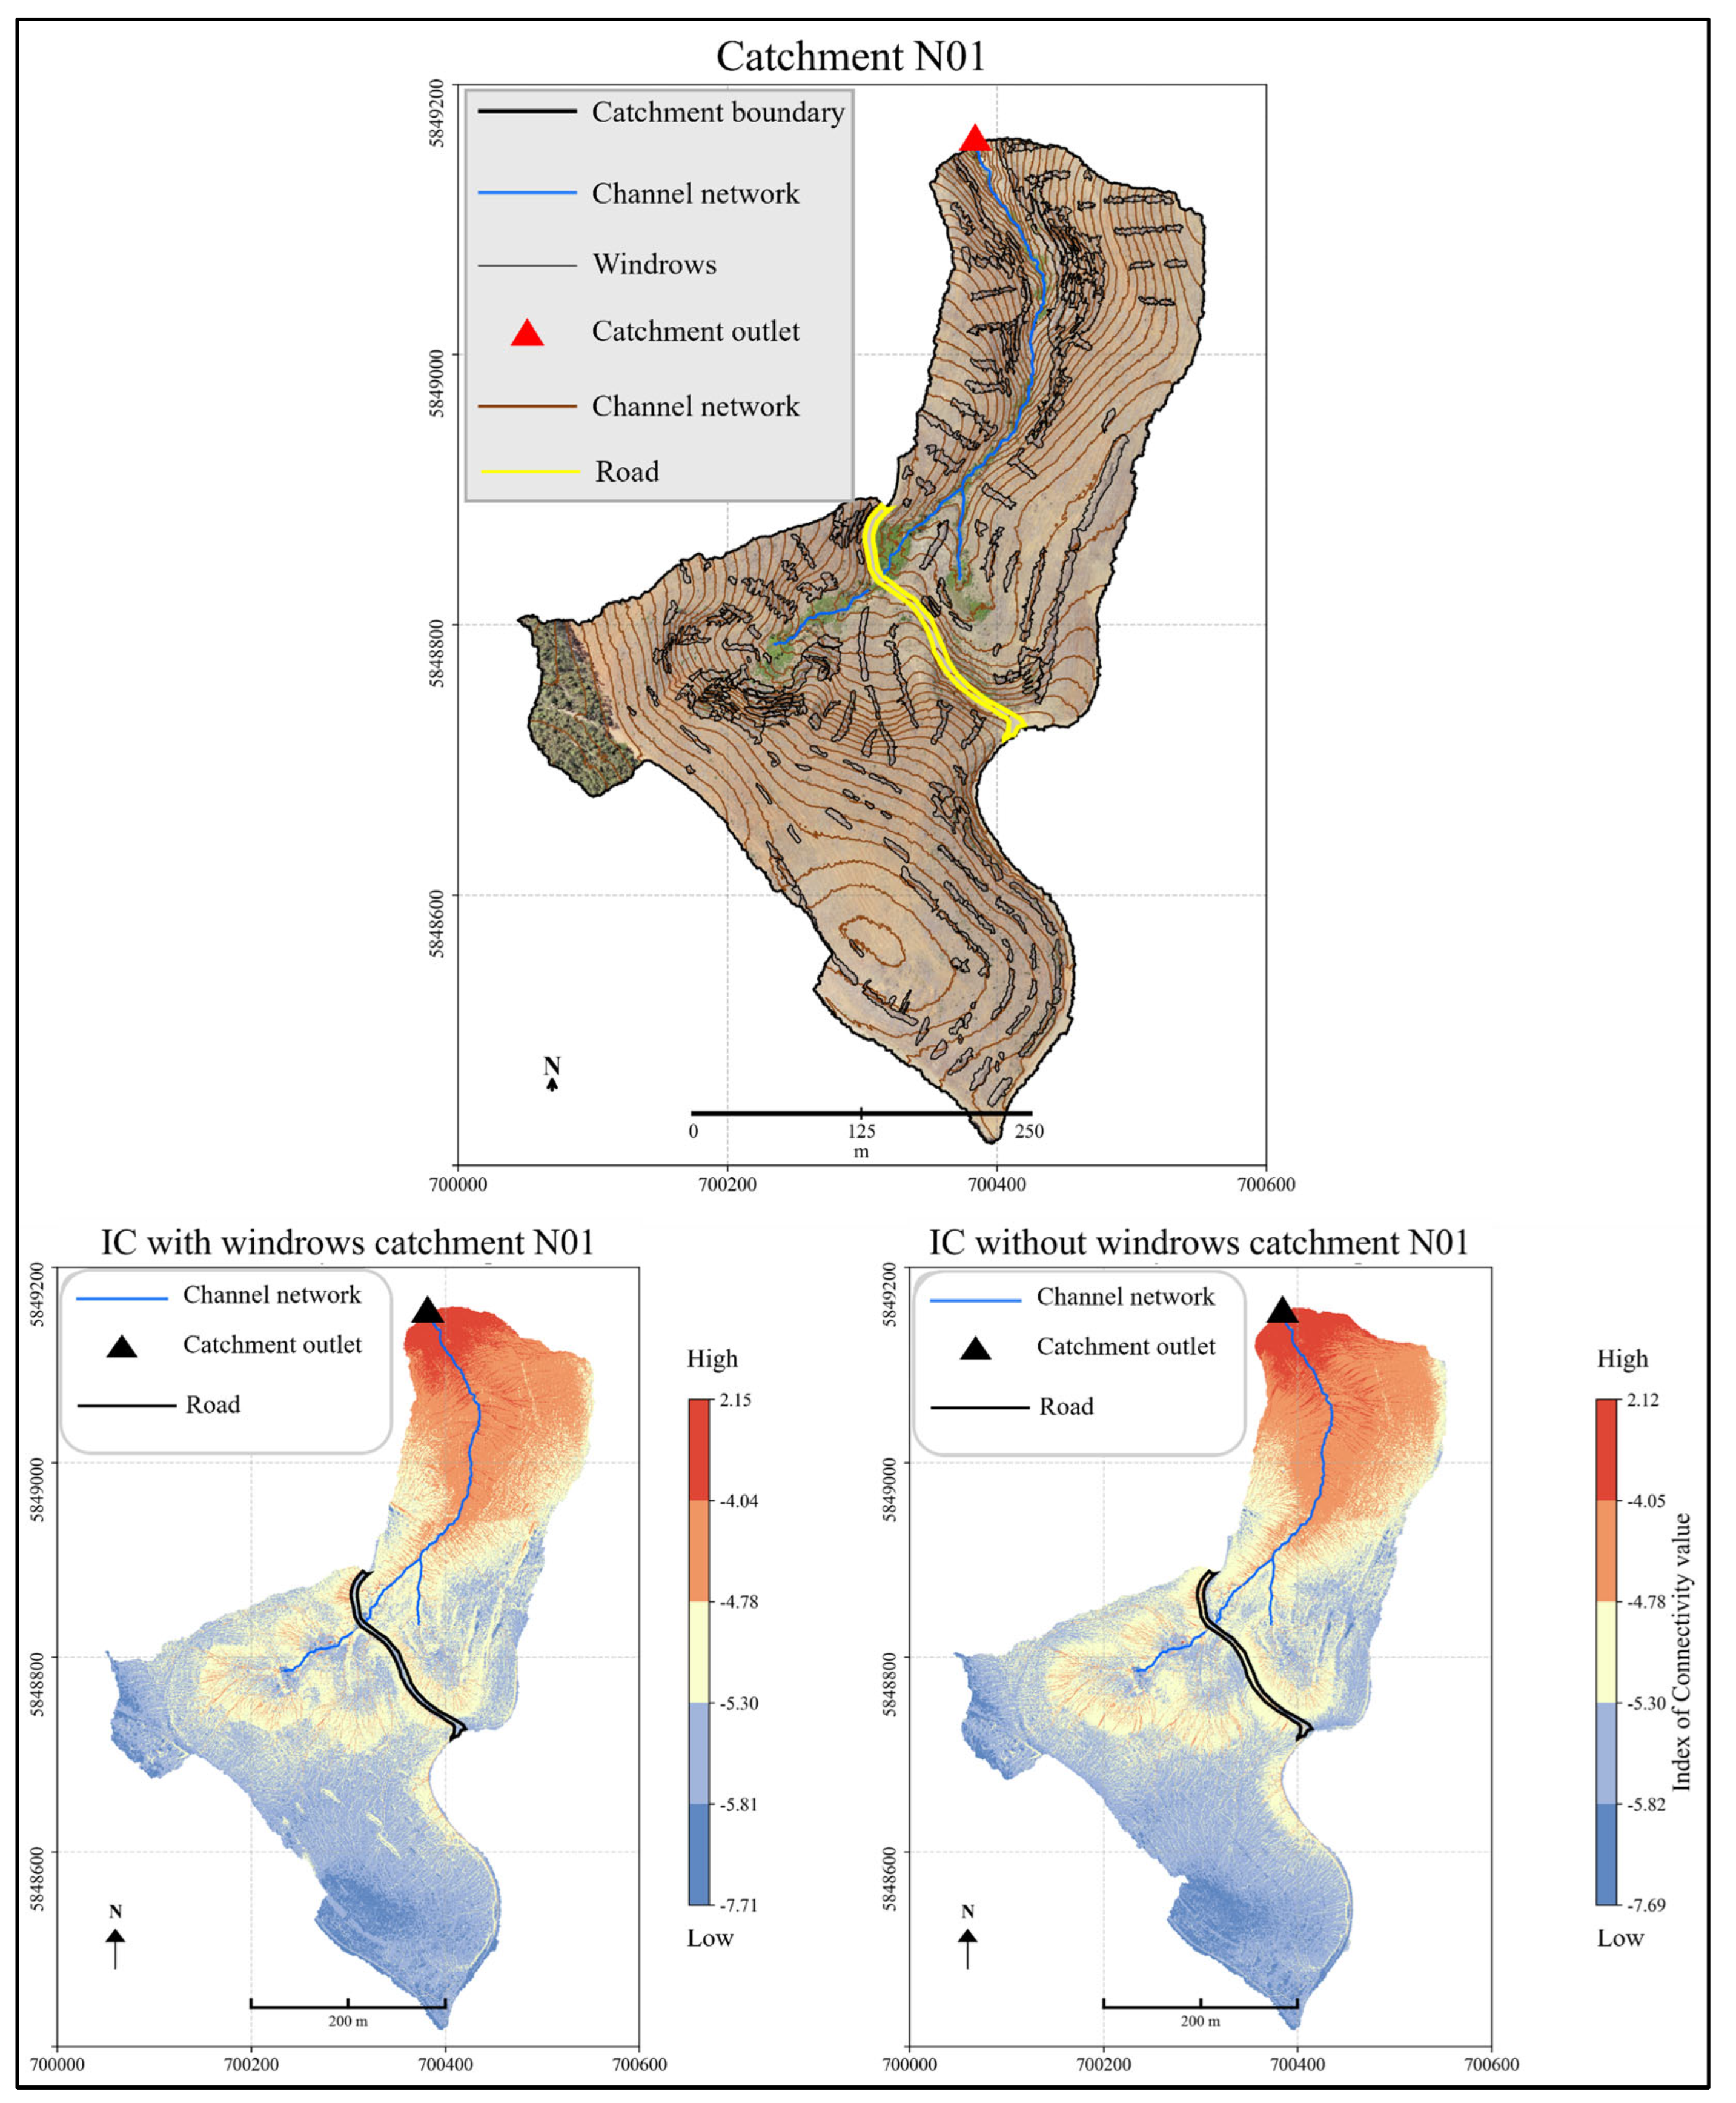
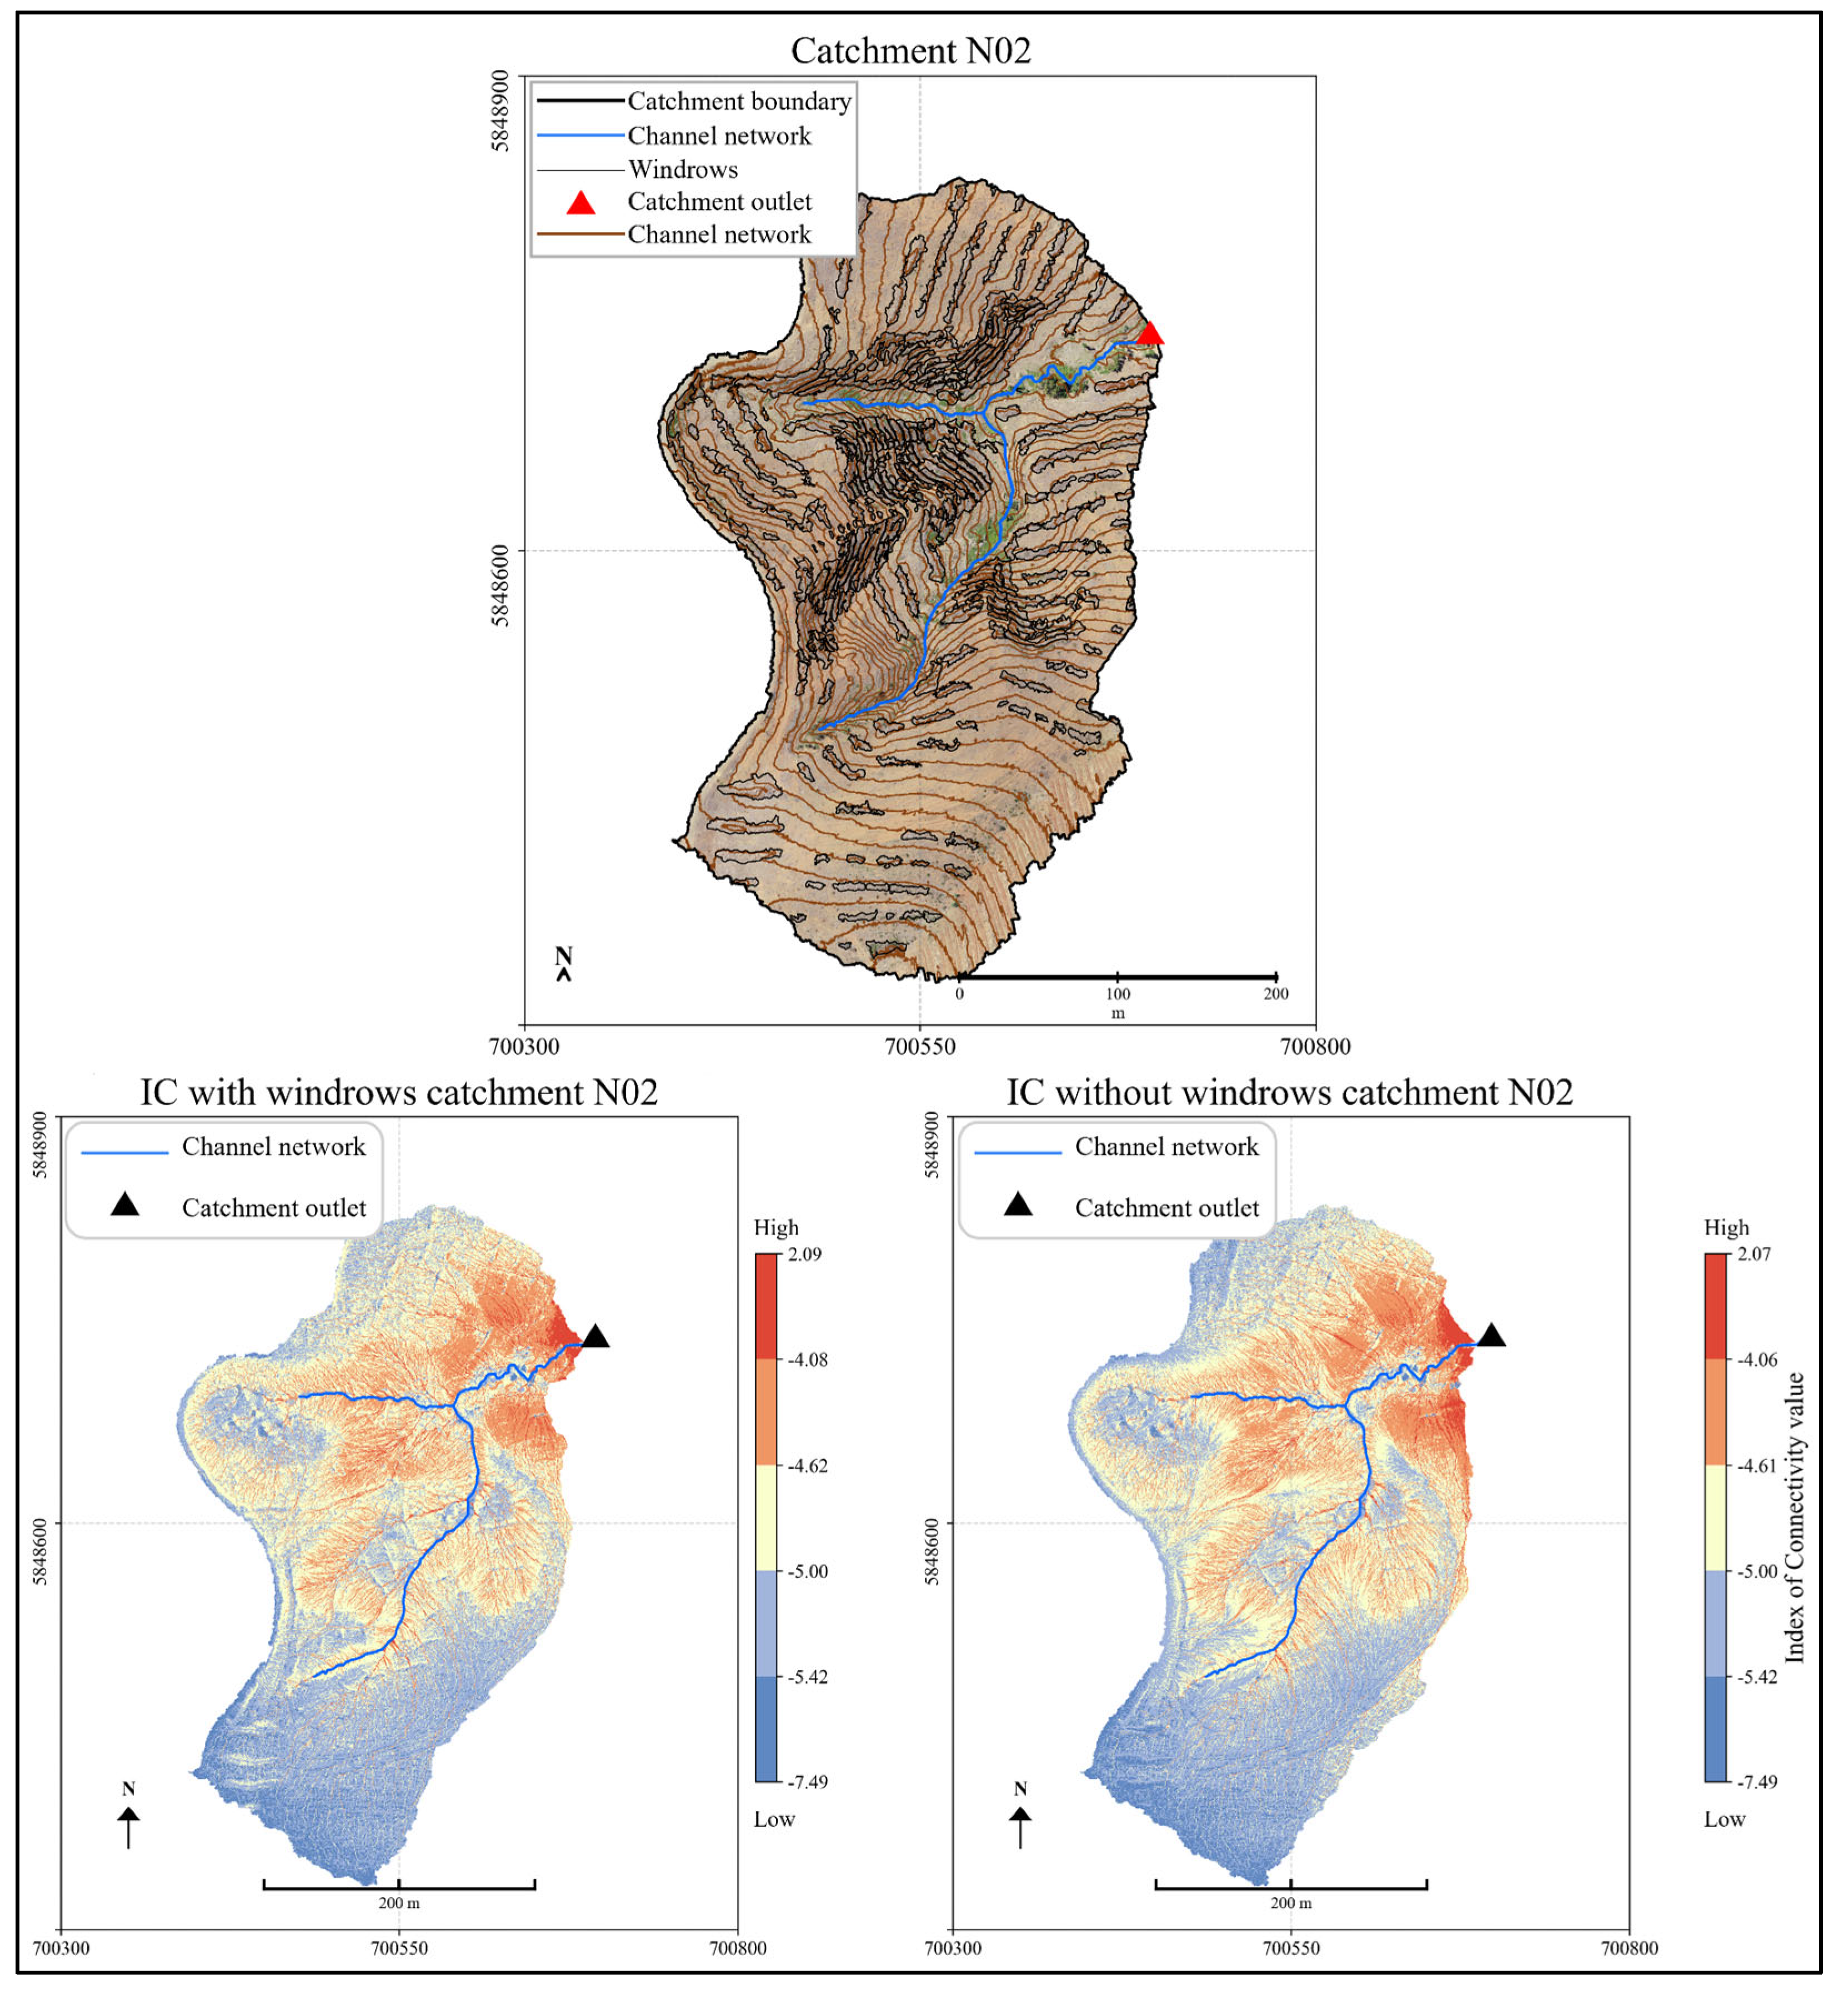
N01 has an area of 12.6 ha, an elevation range of 275–400 m a.s.l., an average catchment slope of 0.28 m m−1, and a channel with an average slope of 0.16 m m−1. N02 has an area of 14 ha, an elevation range of 280–380 m a.s.l., an average catchment slope of 0.27 m m−1, and a channel with an average slope of 0.08 m m−1. Both catchments were predominantly planted with Pinus radiata D. Don established in 1987, covering 93.7% and 93.5% of catchment areas in N01 and N02, respectively.
In September 2020, the plantations in both catchments were harvested, involving manual felling with chainsaws, logging with rubber-tired skidders on slopes below 30%, cable yarding in steeper areas, and replanting with
P. radiata in June 2021. To minimize the effects of harvesting on the environment, management practices were adopted before, during, and after operations in both catchments, complying with the procedures for sustainable harvesting operations. These include road and stream crossing (bridges, culverts) maintenance before the harvesting to guarantee the prohibition of skidder crossings over streams and preserve the riparian zone in accordance with national certifications and regulations during operations [
21]. Logging residues were piled in windrows along the hillslopes. In addition, soil preparation with disking and subsoiling along the contour lines was conducted before planting.
After harvesting, a mechanized equipment coupled to a forestry-type excavator was used to arrange residue windrows throughout the catchments. Slope plays a key role in determining windrow locations and orientations, as it determines the machine’s operational capacity. In areas with slopes of less than 45%, the machine can move along contour lines, allowing the windrows to be arranged in this direction. However, on slopes greater than 45%, safety considerations require the machine to move uphill and downhill, resulting in windrows being arranged along the steepest gradient.
3. Materials and Methods
3.1. Data Collection
In December 2021 (after harvesting), a survey with an Unmanned Aerial Vehicle (UAV) in the catchments N01 and N02 was conducted. The catchments were flown at an altitude of 120 m above ground for a photogrammetric and LiDAR flight.
A DJI® Matrice 350 RTK, (SZ DJI Technology Co., Ltd., Shenzhen, China) equipped with RGB and LiDAR sensors, was used. Point clouds were obtained and processed in Cloud Compare® (version 2.12.0) software to create digital terrain models (DTMs) with a resolution of 0.2 m. The photographs were processed in Metashape® (version 2.2.1) software, producing one orthomosaic with a resolution of 0.03 m.
3.2. Residue Windrows Characterization
To estimate the typical dimensions of the windrows, a manual digitization process was conducted using ArcGIS Pro® (version 3.4.2) based on the high-resolution orthomosaic obtained from the December 2021 UAV-LiDAR survey. Each visible windrow was outlined as a polygon, allowing for the calculation of its morphometric properties, including length, area, and width.
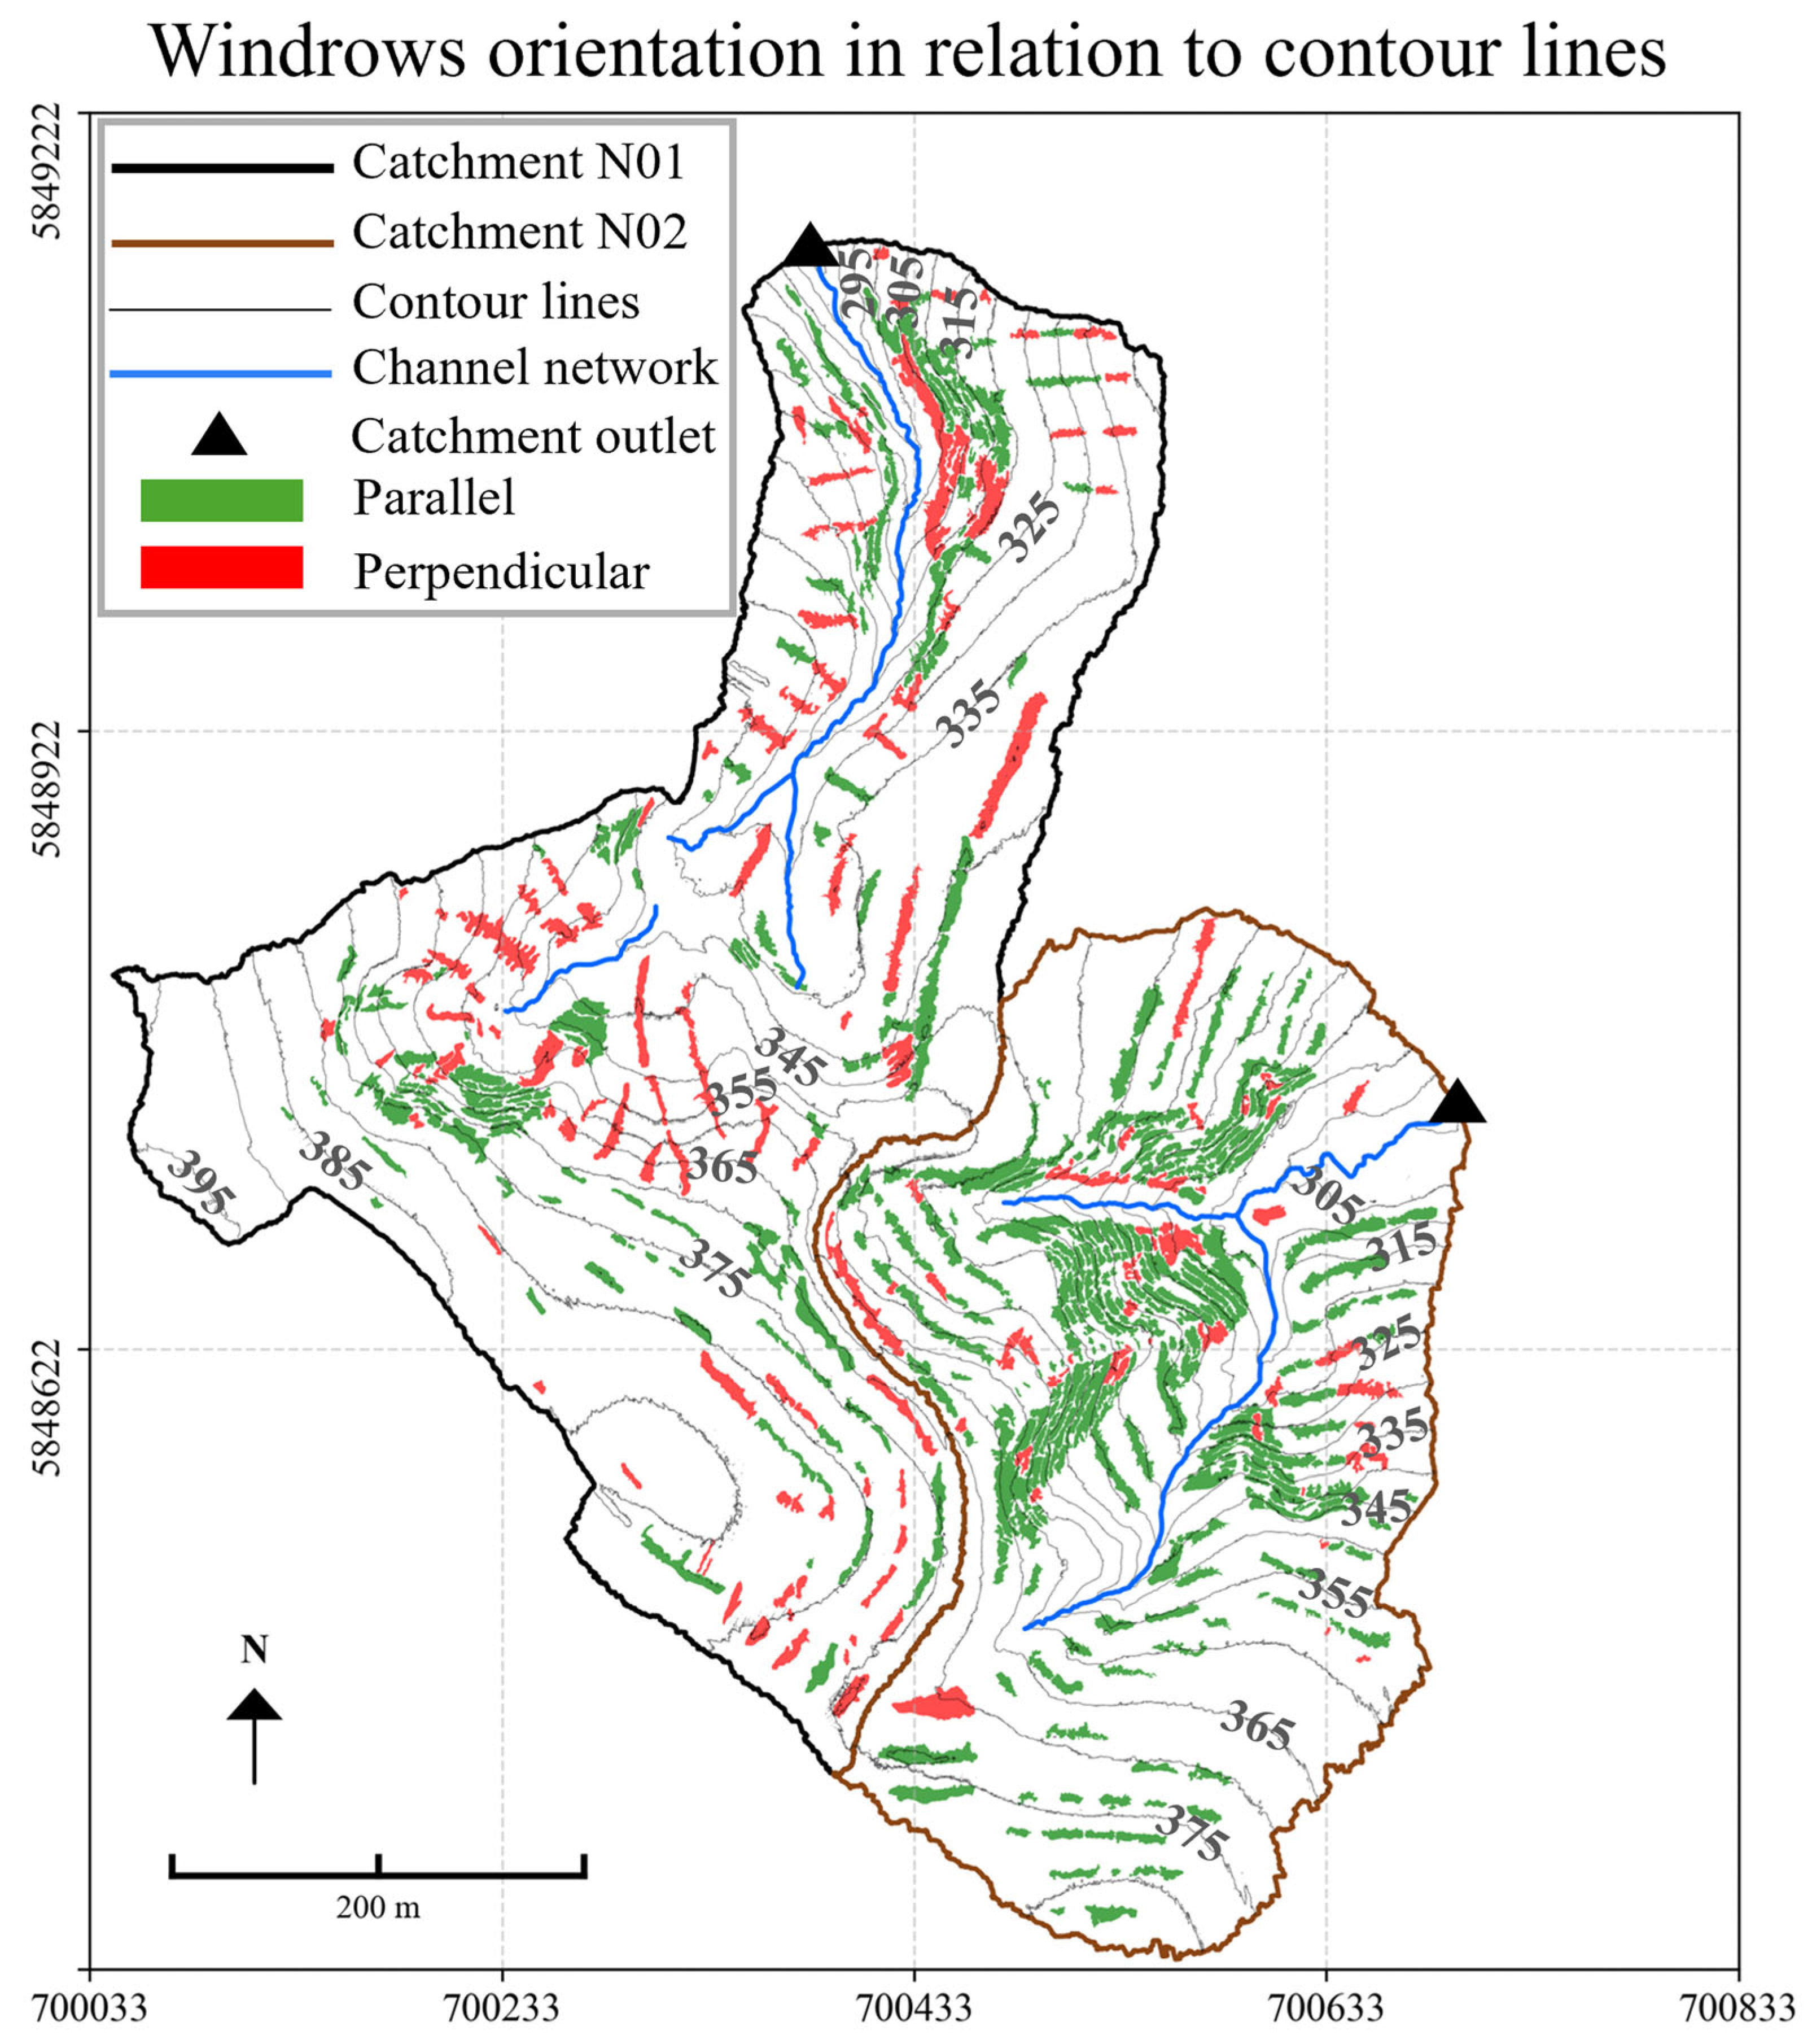
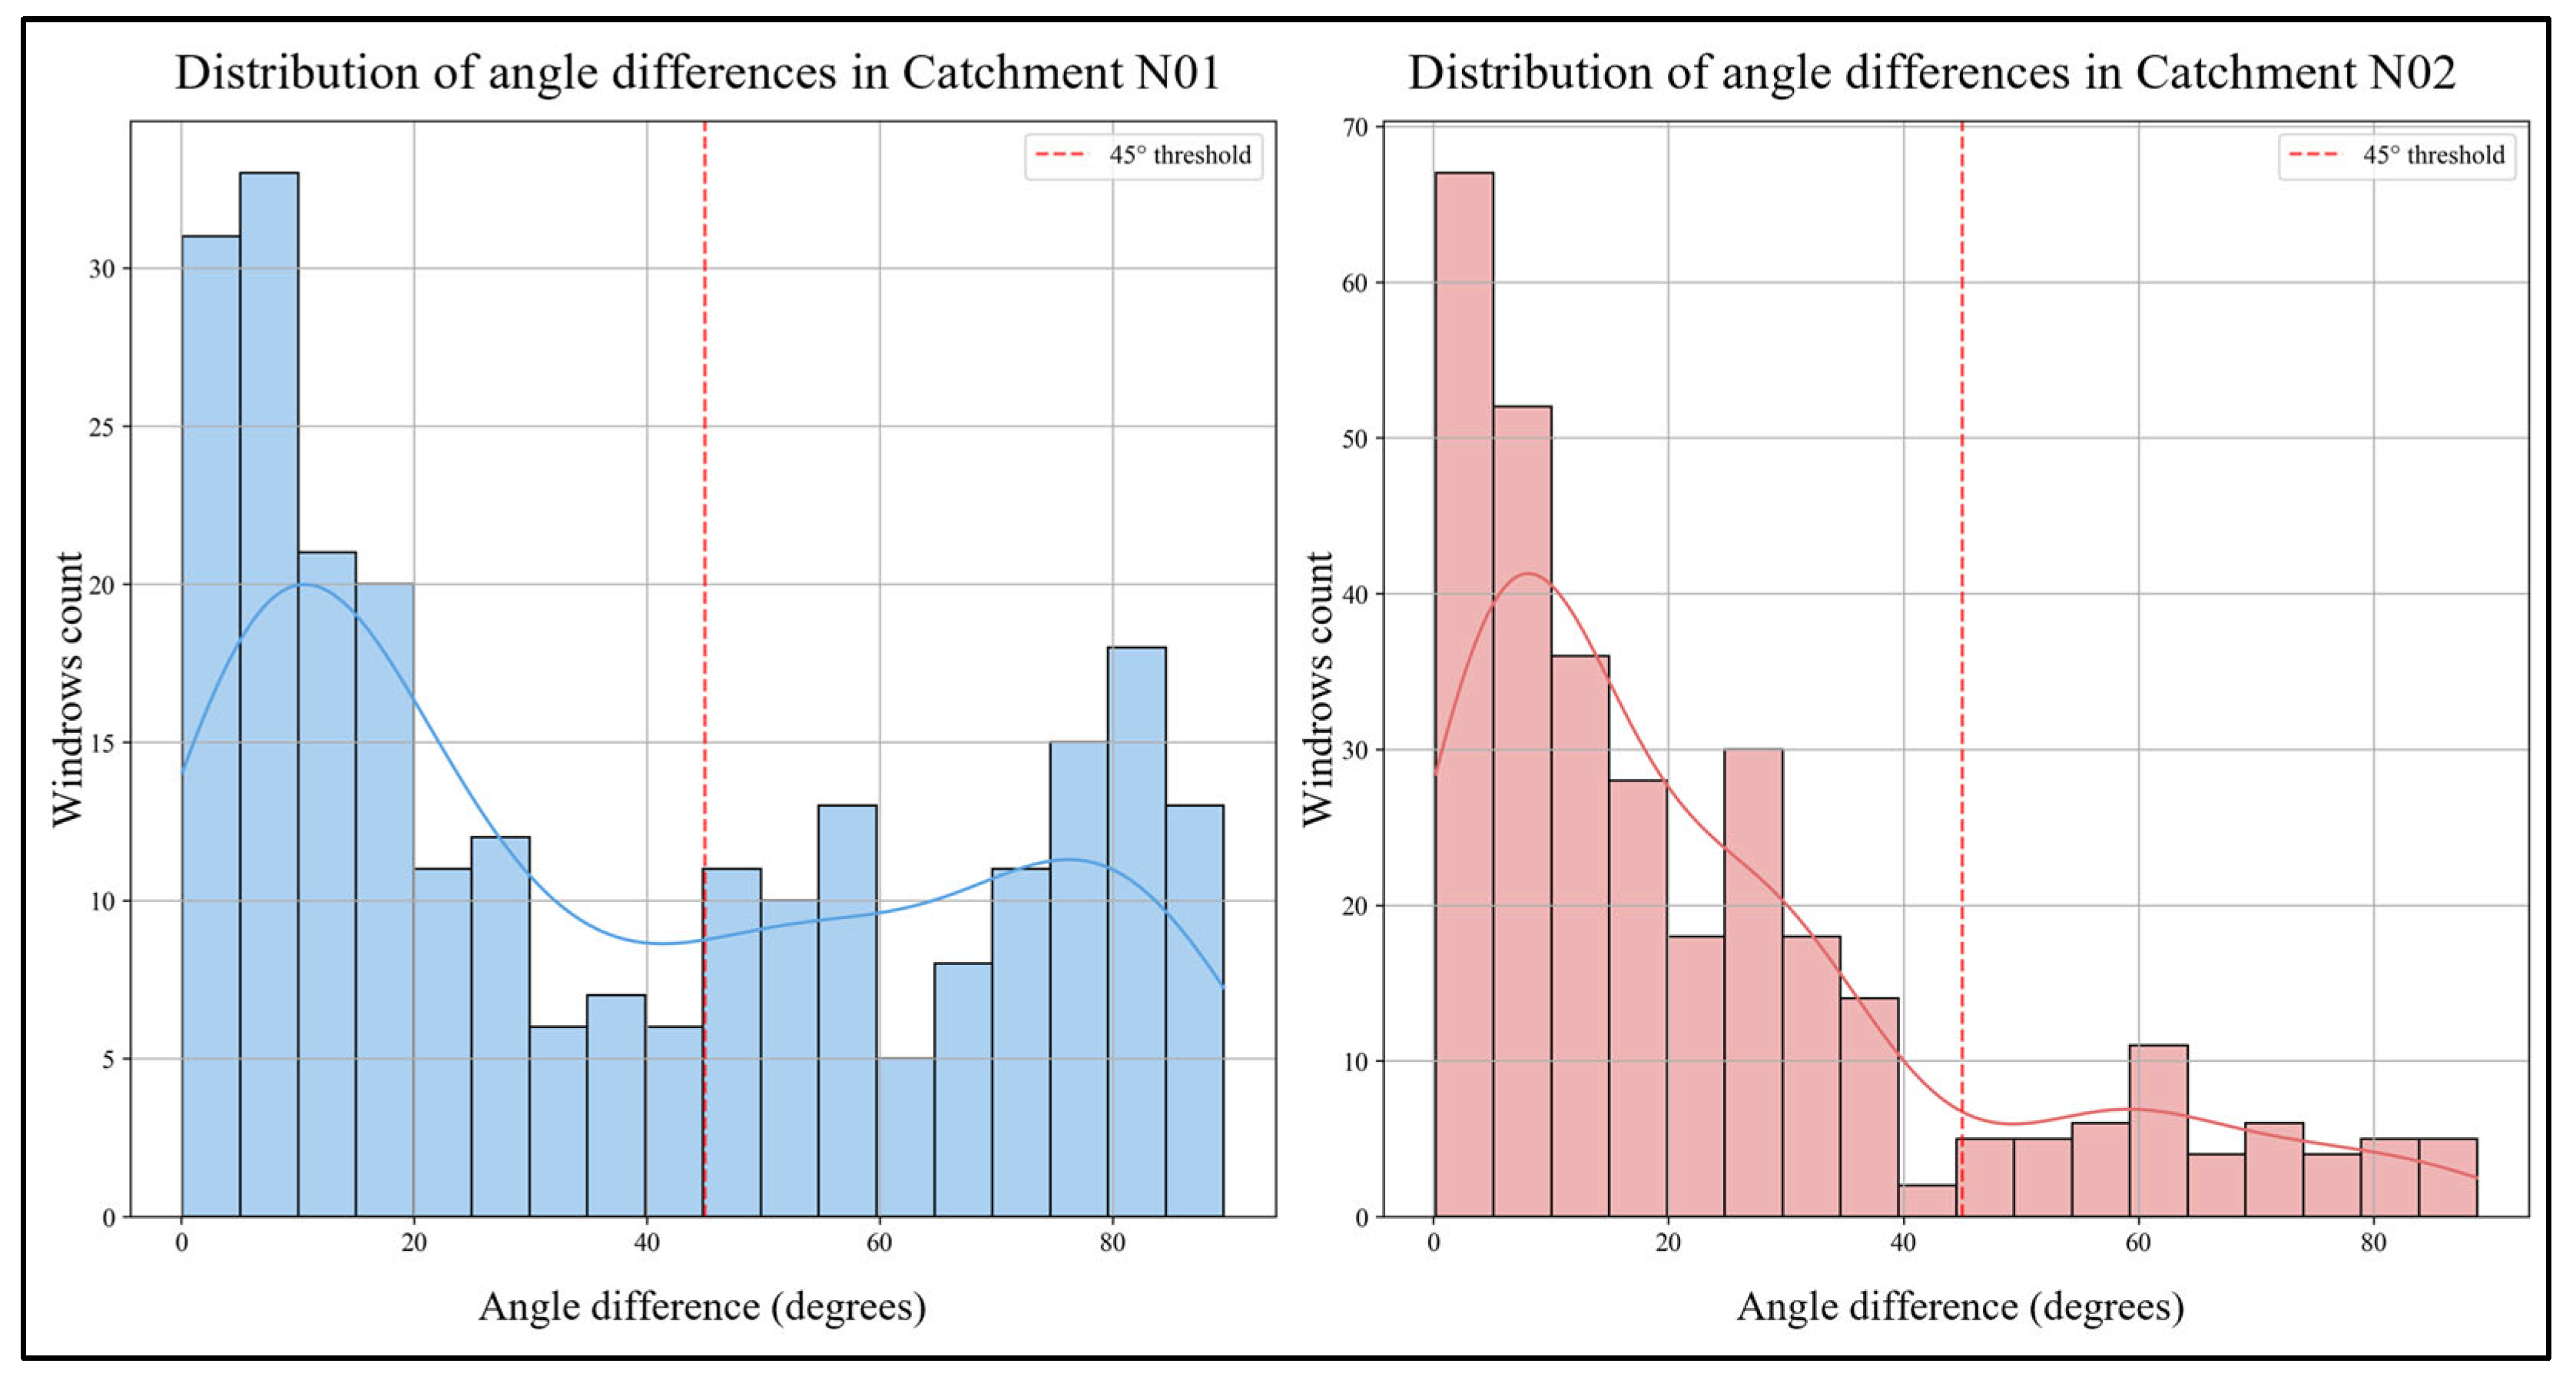
In addition, the effect of the orientation of the residue windrows on the connectivity of the catchments was analyzed. To calculate their orientation, the central axis of each windrow was estimated using Principal Component Analysis (PCA). For this, the exterior coordinates of each digitized polygon were centered relative to their centroid, and a covariance matrix was computed. The first principal component, i.e., the eigenvector associated with the largest eigenvalue, was taken to represent the main directional axis of each windrow. This axis was converted into an azimuth angle and compared to the local contour lines to determine orientation. Windrows with central axis angles less than 45° with respect to the nearest contour line were classified as parallel, while those with angles greater than 45° were classified as perpendicular. To evaluate the slope conditions of the area where the windrows are located, a slope analysis of the windrows was conducted, classifying the slopes into ranges: 0–15° (slight to moderate), 15–30° (moderate to steep), and 30–45° (steep).
3.3. Evaluation of the Effect of Residue Windrows on Structural Sediment Connectivity
To assess the impact of the forest residue windrows on structural sediment connectivity, two scenarios were implemented using the DTM: (i) with the presence of windrows and (ii) without the presence of windrows.
For the scenario with windrows, the original DTM (DTMo) was used. Generating a scenario without windrows posed a significant challenge, as they often form dense structures that are impenetrable to laser pulses. The scenario without residue windrows was simulated by filtering out these structures from the DTMo. This was performed using a common surface smoothing technique with focal statistics (FS) (raster processing technique that calculates a statistical measure for each cell using the values of its neighboring cells within a defined moving window) [
12], calculating the average elevation of neighboring cells from the original DTM. The size of the moving window (MW) was defined according to the maximum width measured between the windrows, following the criteria for smoothing surfaces of [
22]. From the morphometric analysis of the windrows, a maximum width of thirteen meters was calculated. Based on this value, several MW sizes were evaluated, systematically increasing their size by 0.5 m. Finally, an MW size of twenty meters was determined for the smoothing process, and a filtered DTM (DTMf) was obtained.
In summary, the DTMo represents the terrain with windrows (original UAV-derived DTM), while the DTMf corresponds to a simulated version without windrows, obtained by applying surface smoothing to remove the topographic influence of the residue piles.
The Index of Connectivity (IC) was computed for the scenarios with windrows (DTMo) and without windrows (DTMf), respectively, using the SedInConnect Tool [
17].
The Index of Connectivity (IC) used in this study follows the morphometric formulation by [
12], which combines upslope contributing area with a downslope component that includes a weighting factor to account for surface impedance. The IC expresses the potential for a sediment particle at a given cell to reach a target zone (in our case, the catchment outlet) and is widely used to assess structural sediment connectivity.
Due to the unvegetated condition in both catchments after harvesting, the IC was computed using the roughness index (RI) as a weighting factor (W) to analyze the potential effects of the windrows on sediment connectivity. The RI was adopted in this context due to the lack of vegetation, making the local topography and residue windrows the main sources of impedance for potential sediment flows.
To calculate the RI, the residual topography (RT) was first calculated by subtracting the DTMf from the DTMo. Then, the RI was calculated by determining the standard deviation of the RT using an MW of 0.6 × 0.6 m (3 × 3 cells) as specified below.
where RI is the roughness index,
n is the number of processing cells within the defined moving window,
xi is the value of the residual topography grid, and
xm is the average value of the cells in the moving window. The RI was used to calculate the weighting factor (W) as in [
12].
In the SedInConnect tool, the weighting factor (W) represents an impedance to sediment flow. In this study, the RI was used as W to capture topographic resistance related to windrow structures. Higher RI values indicate greater surface roughness and, consequently, lower connectivity potential. This allowed us to integrate the spatial effect of windrows directly into the IC estimation, making the index more sensitive to their presence and configuration.
3.4. Statistical Analysis
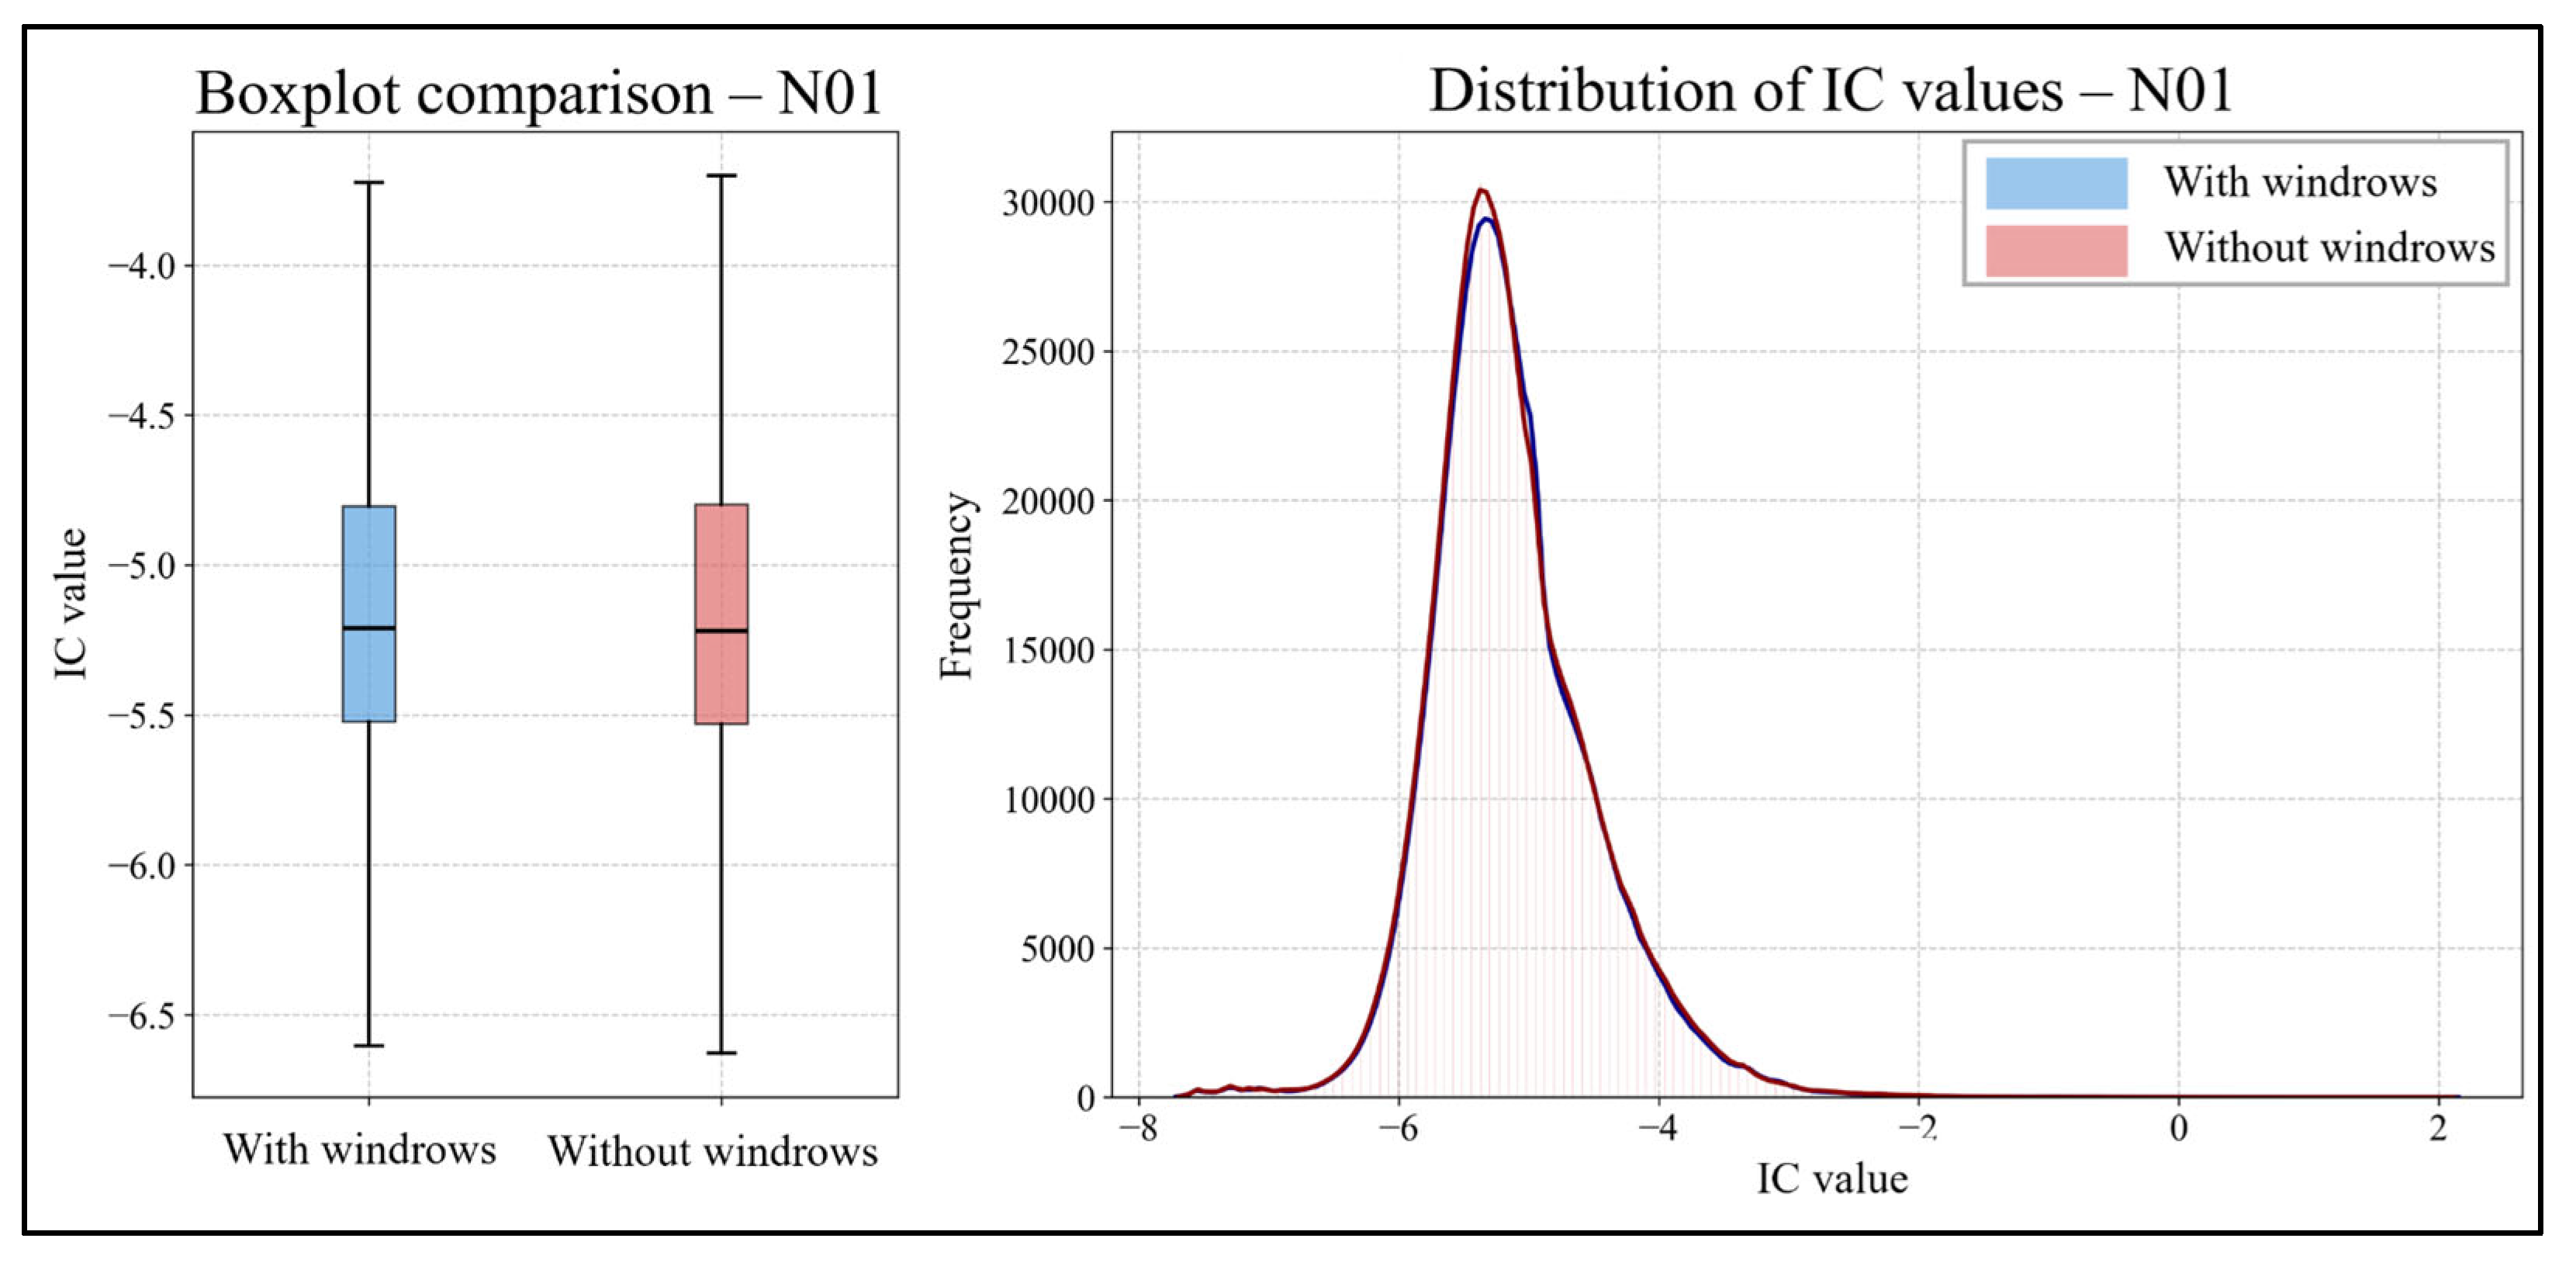
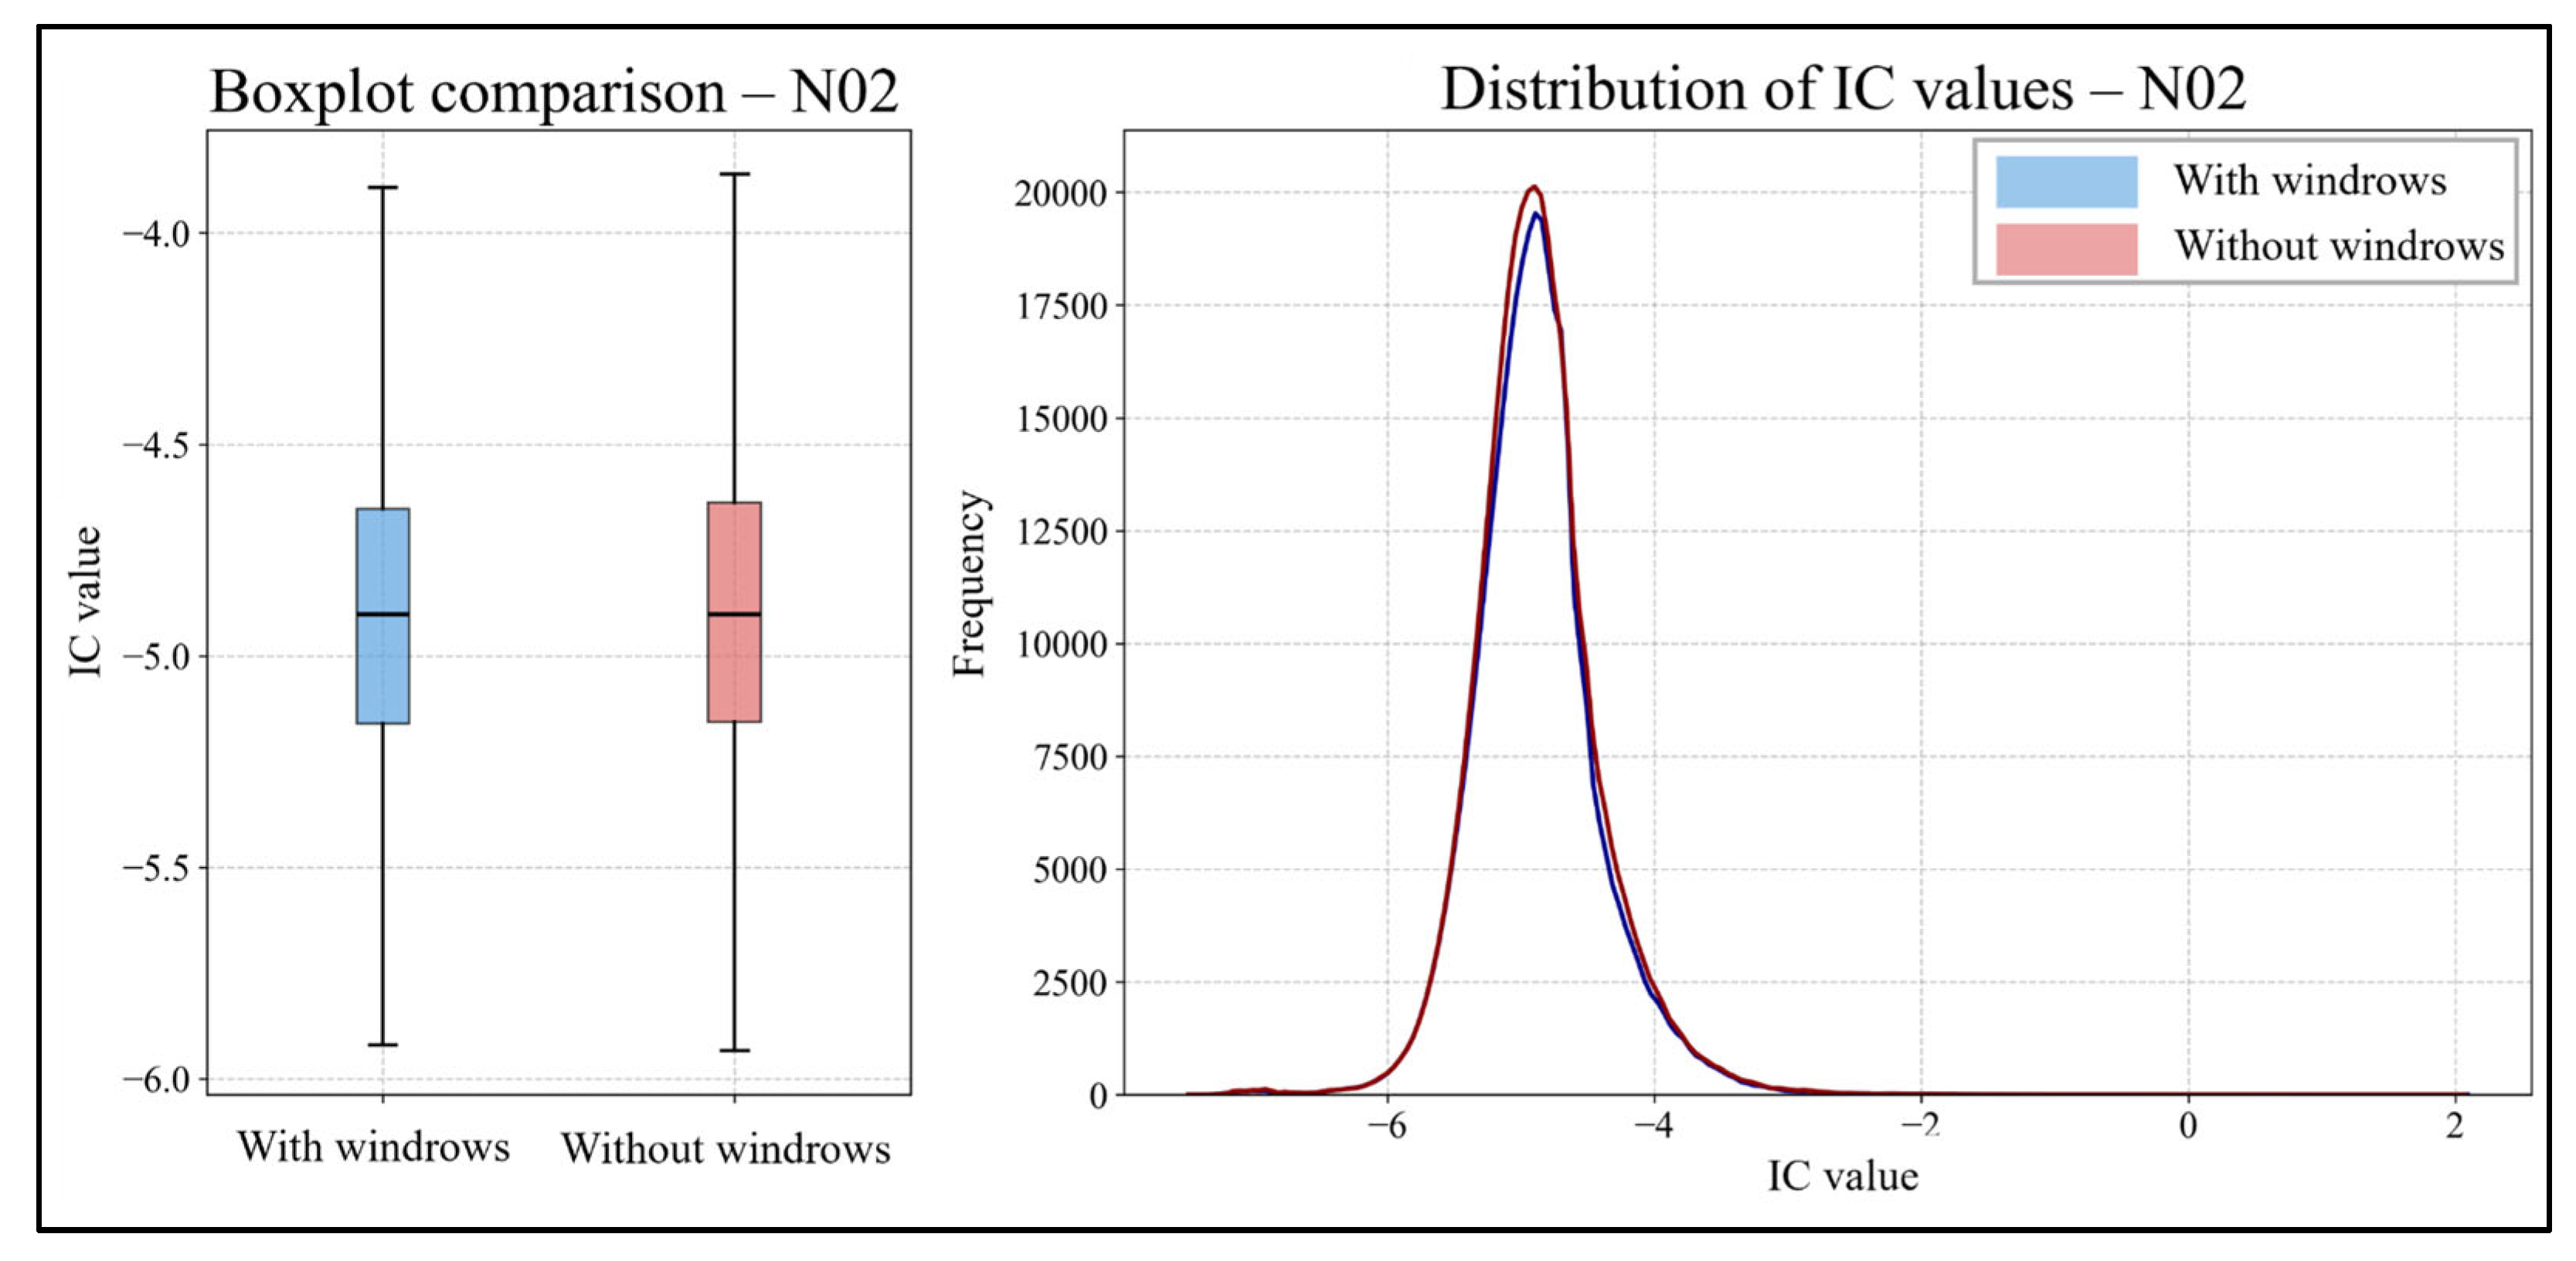
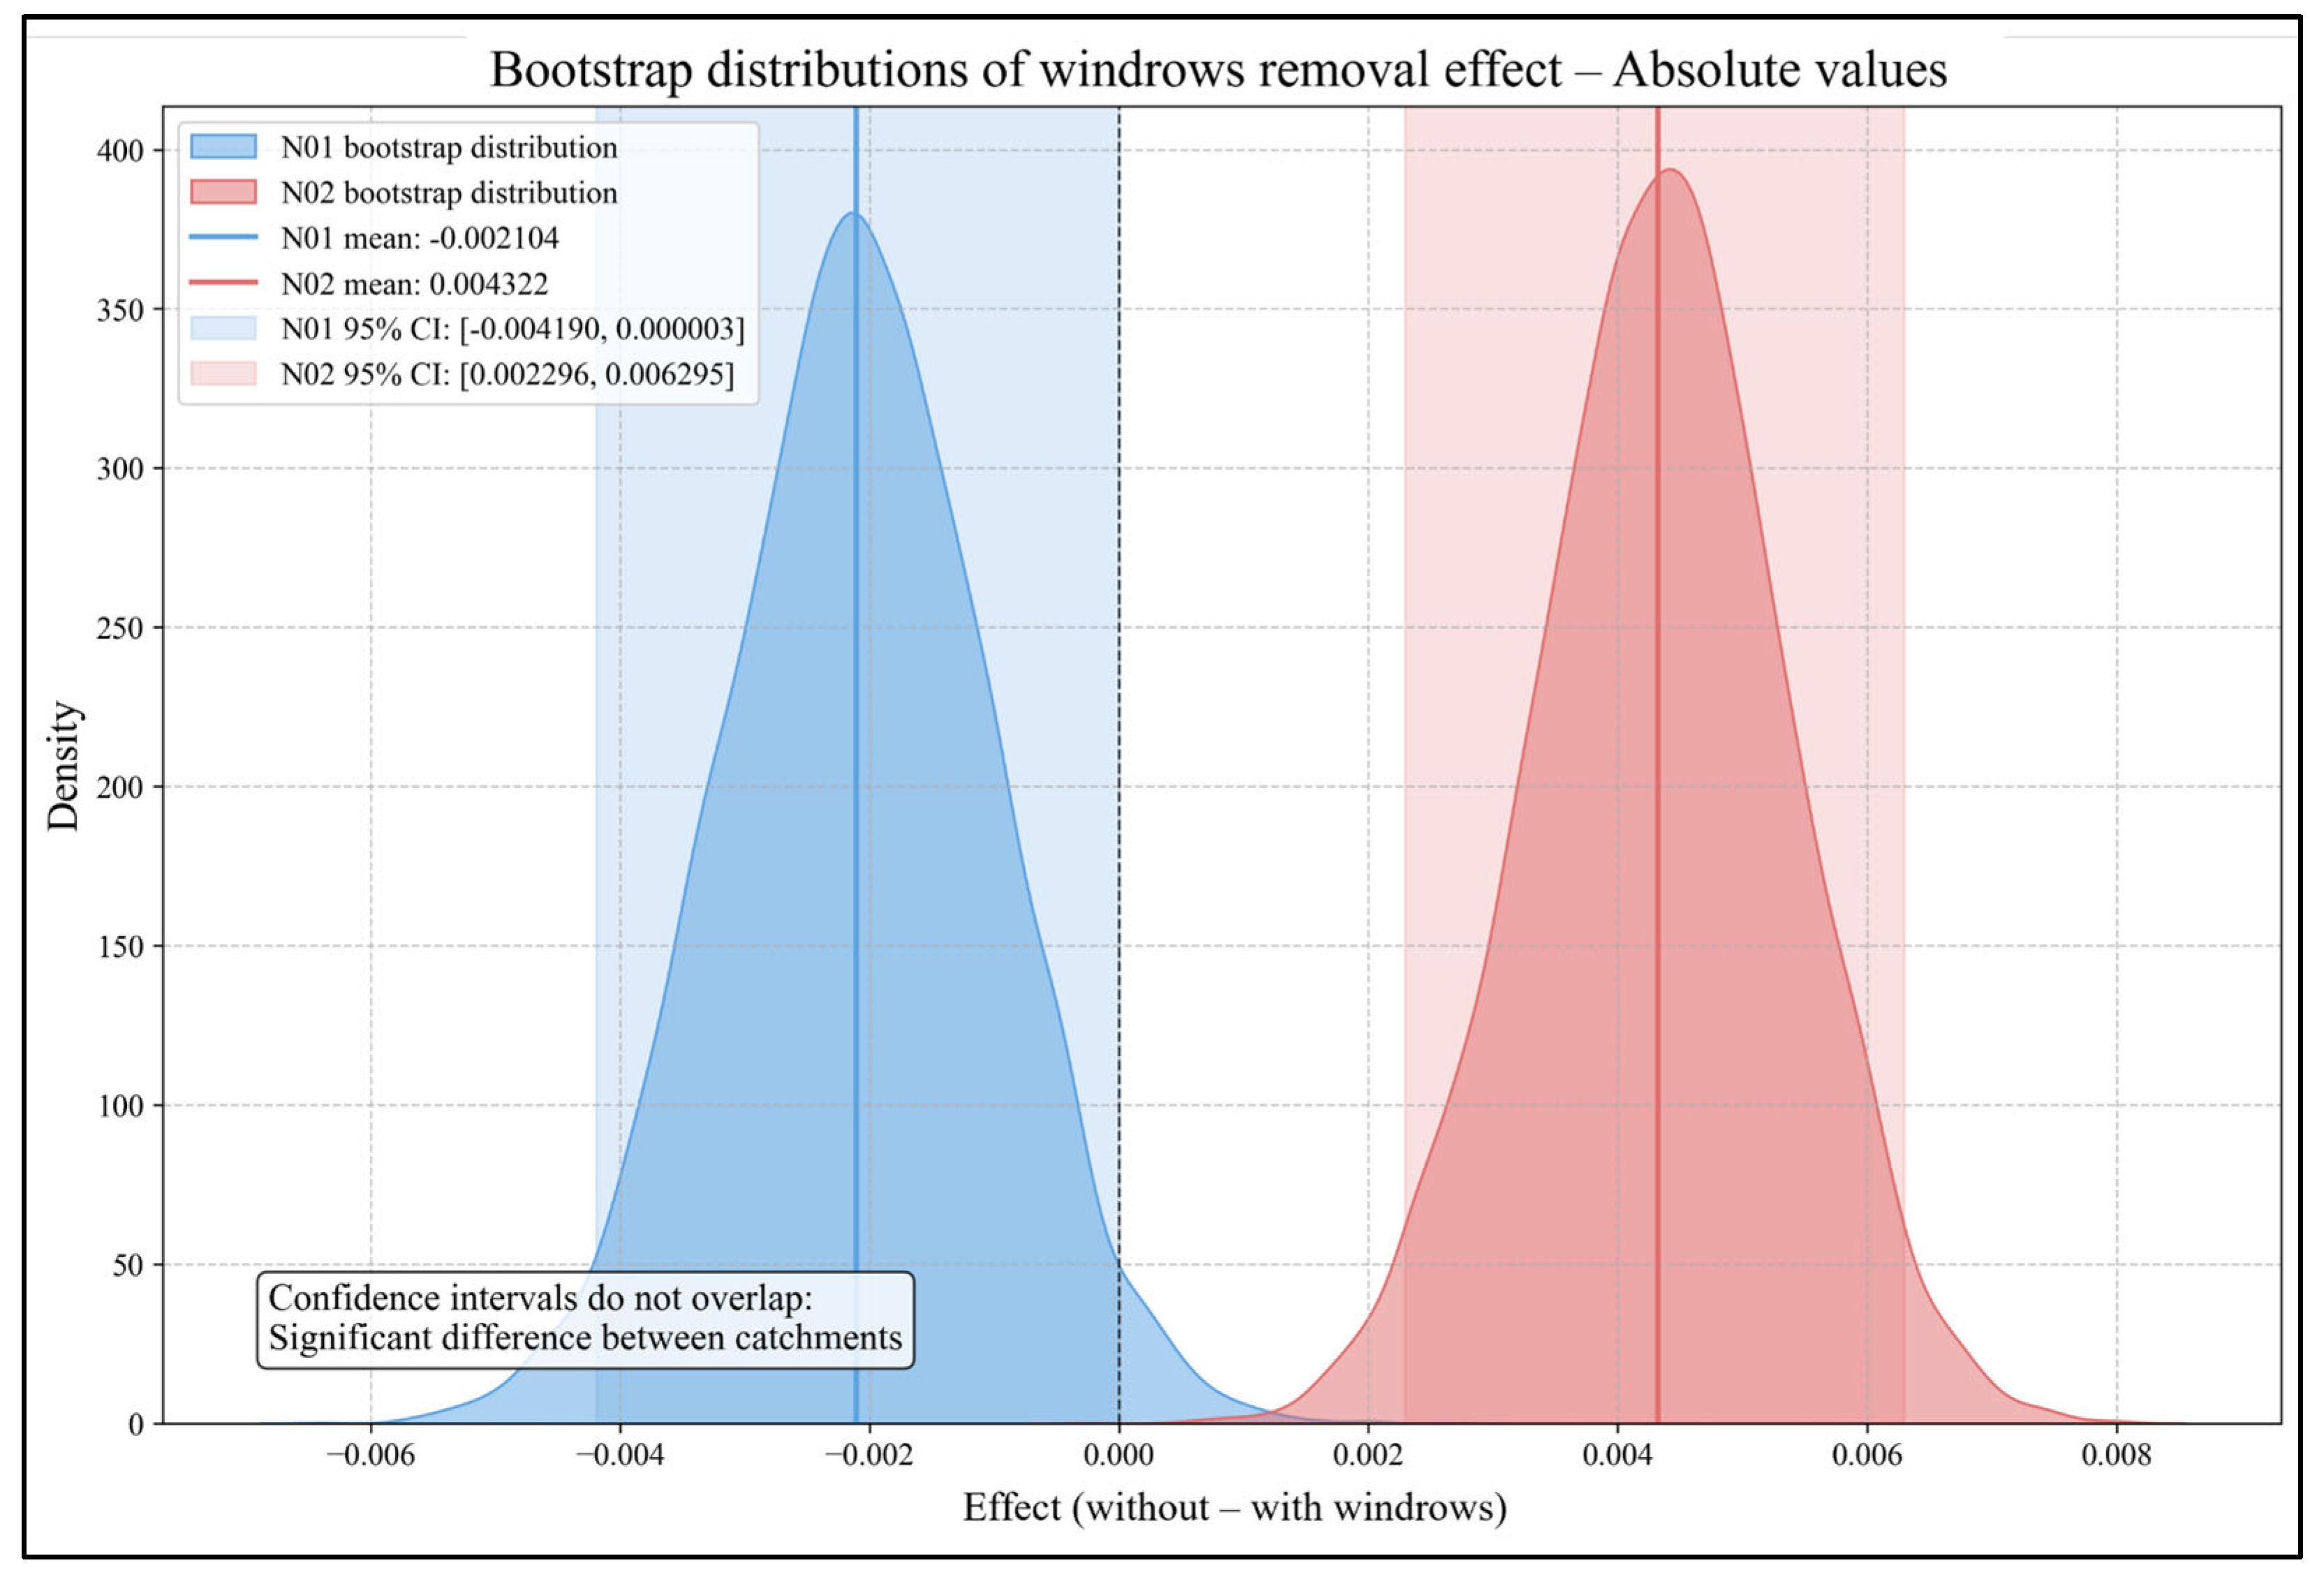
Descriptive statistical analyses were conducted on the IC values obtained for both scenarios (with and without residue windrows) in each catchment. The IC values were compared between the scenarios using one Mann–Whitney U test per catchment. To assess the consistency of windrow effects across the entire catchment area, we applied a bootstrap resampling analysis (10,000 iterations) to the difference in IC values between scenarios with and without windrows in both catchments. This approach allowed us to compute 95% confidence intervals and compare them between catchments, providing a robust non-parametric inference of effect variability and significance.
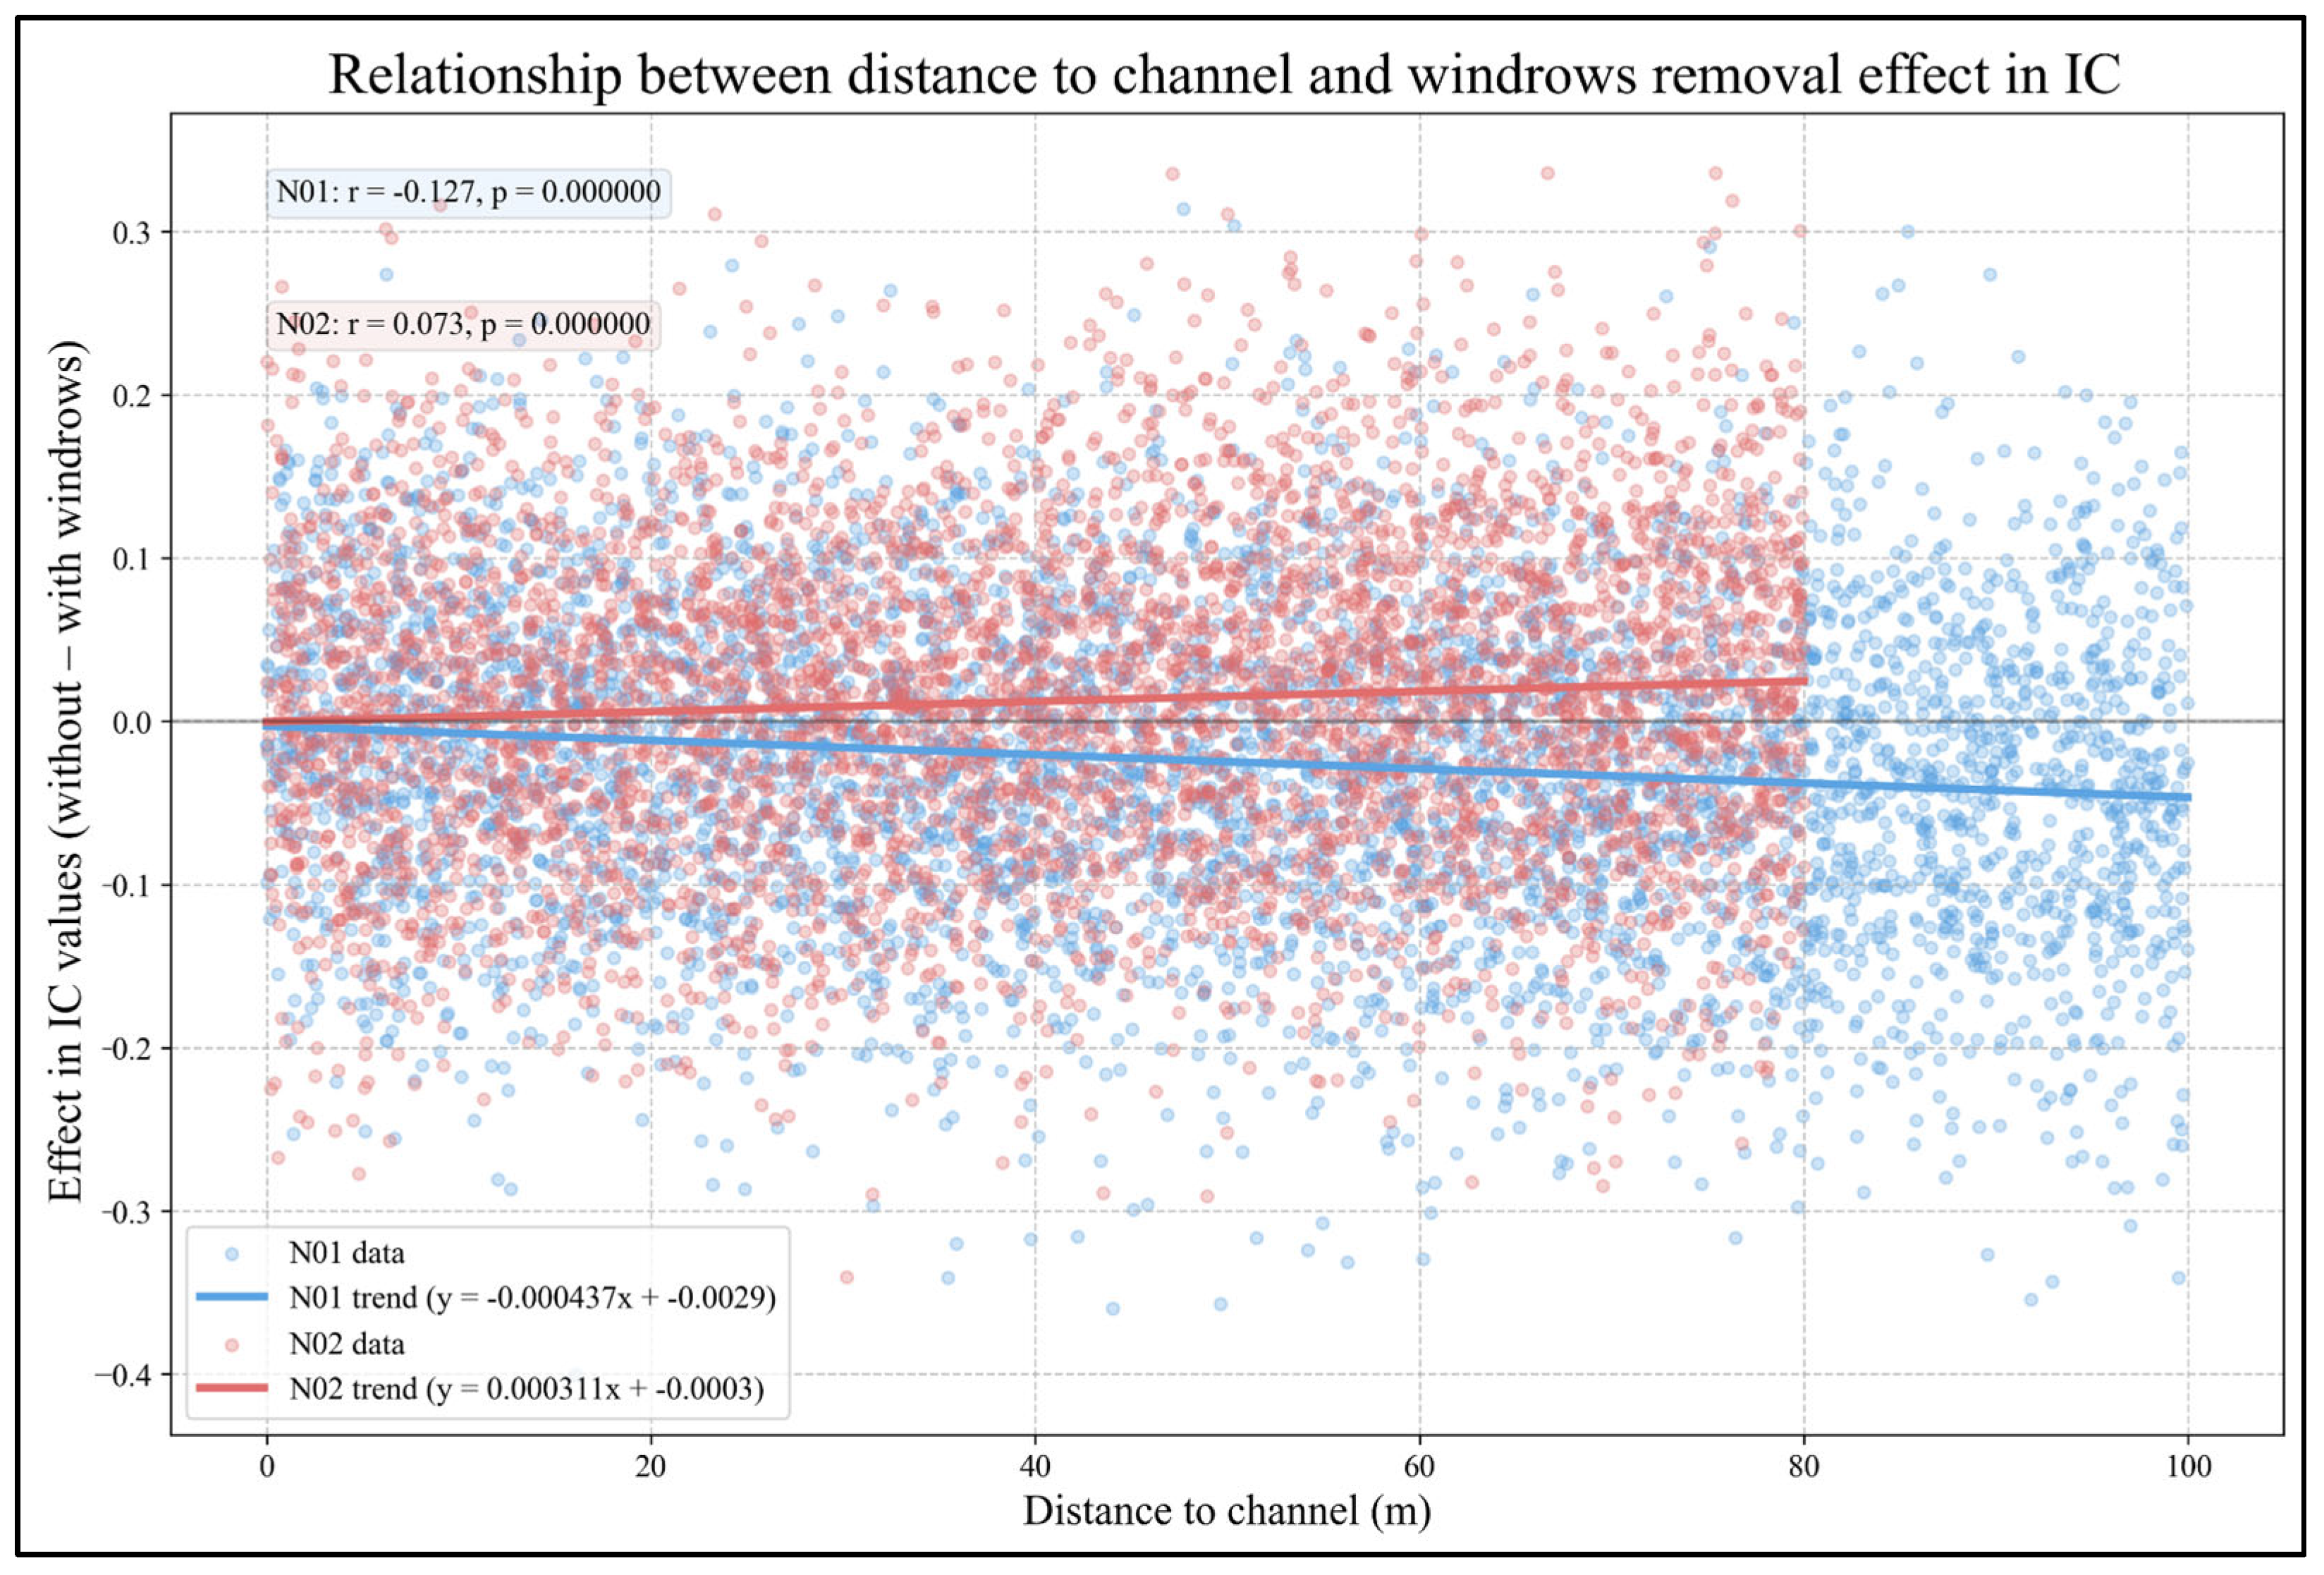
To evaluate how the effect of residue windrows on connectivity varies with distance to drainage channels, we calculated the pixel-level difference between the IC values of the no-windrows and with-windrows scenarios. This value, referred to as the effect, indicates the change in connectivity potential attributable to the presence of windrows at each pixel. Positive values represent a reduction in connectivity, and negative values indicate an increase.
Each pixel distance to the nearest mapped drainage channel was calculated, and effect values were grouped into 10-meter intervals (e.g., 0–10 m, 10–20 m, etc.). For each interval, we computed the average effect, standard error, and pixel count. Pearson’s correlation coefficients were also calculated between distance and effect. Additionally, a t-test was used to compare the average effect between areas close to channels (≤20 m) and farther away (>20 m). This analysis allowed us to identify spatial trends in windrows’ effectiveness relative to drainage proximity.
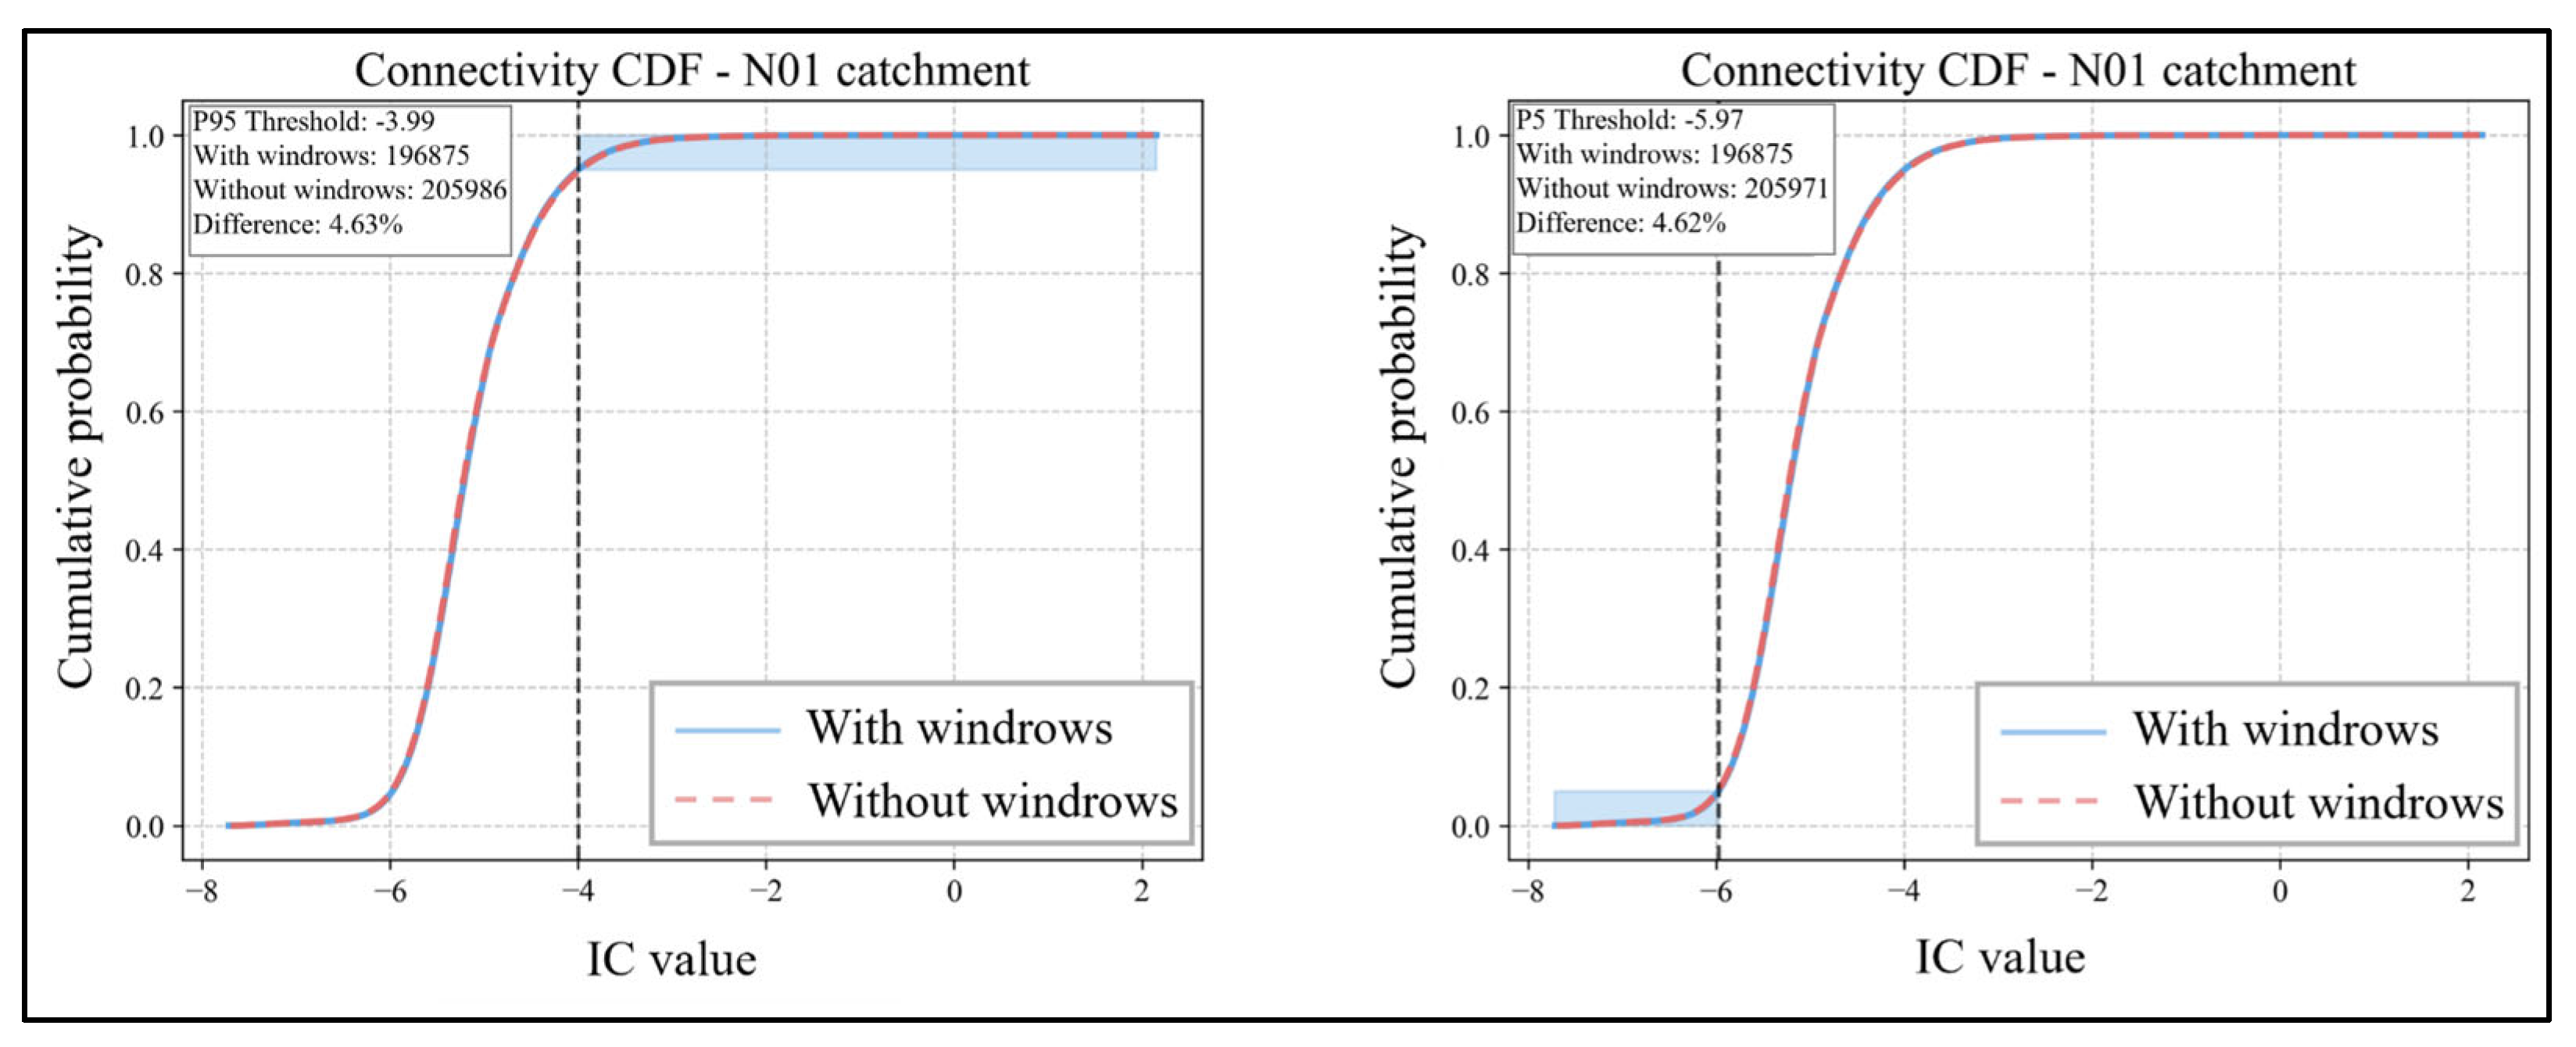
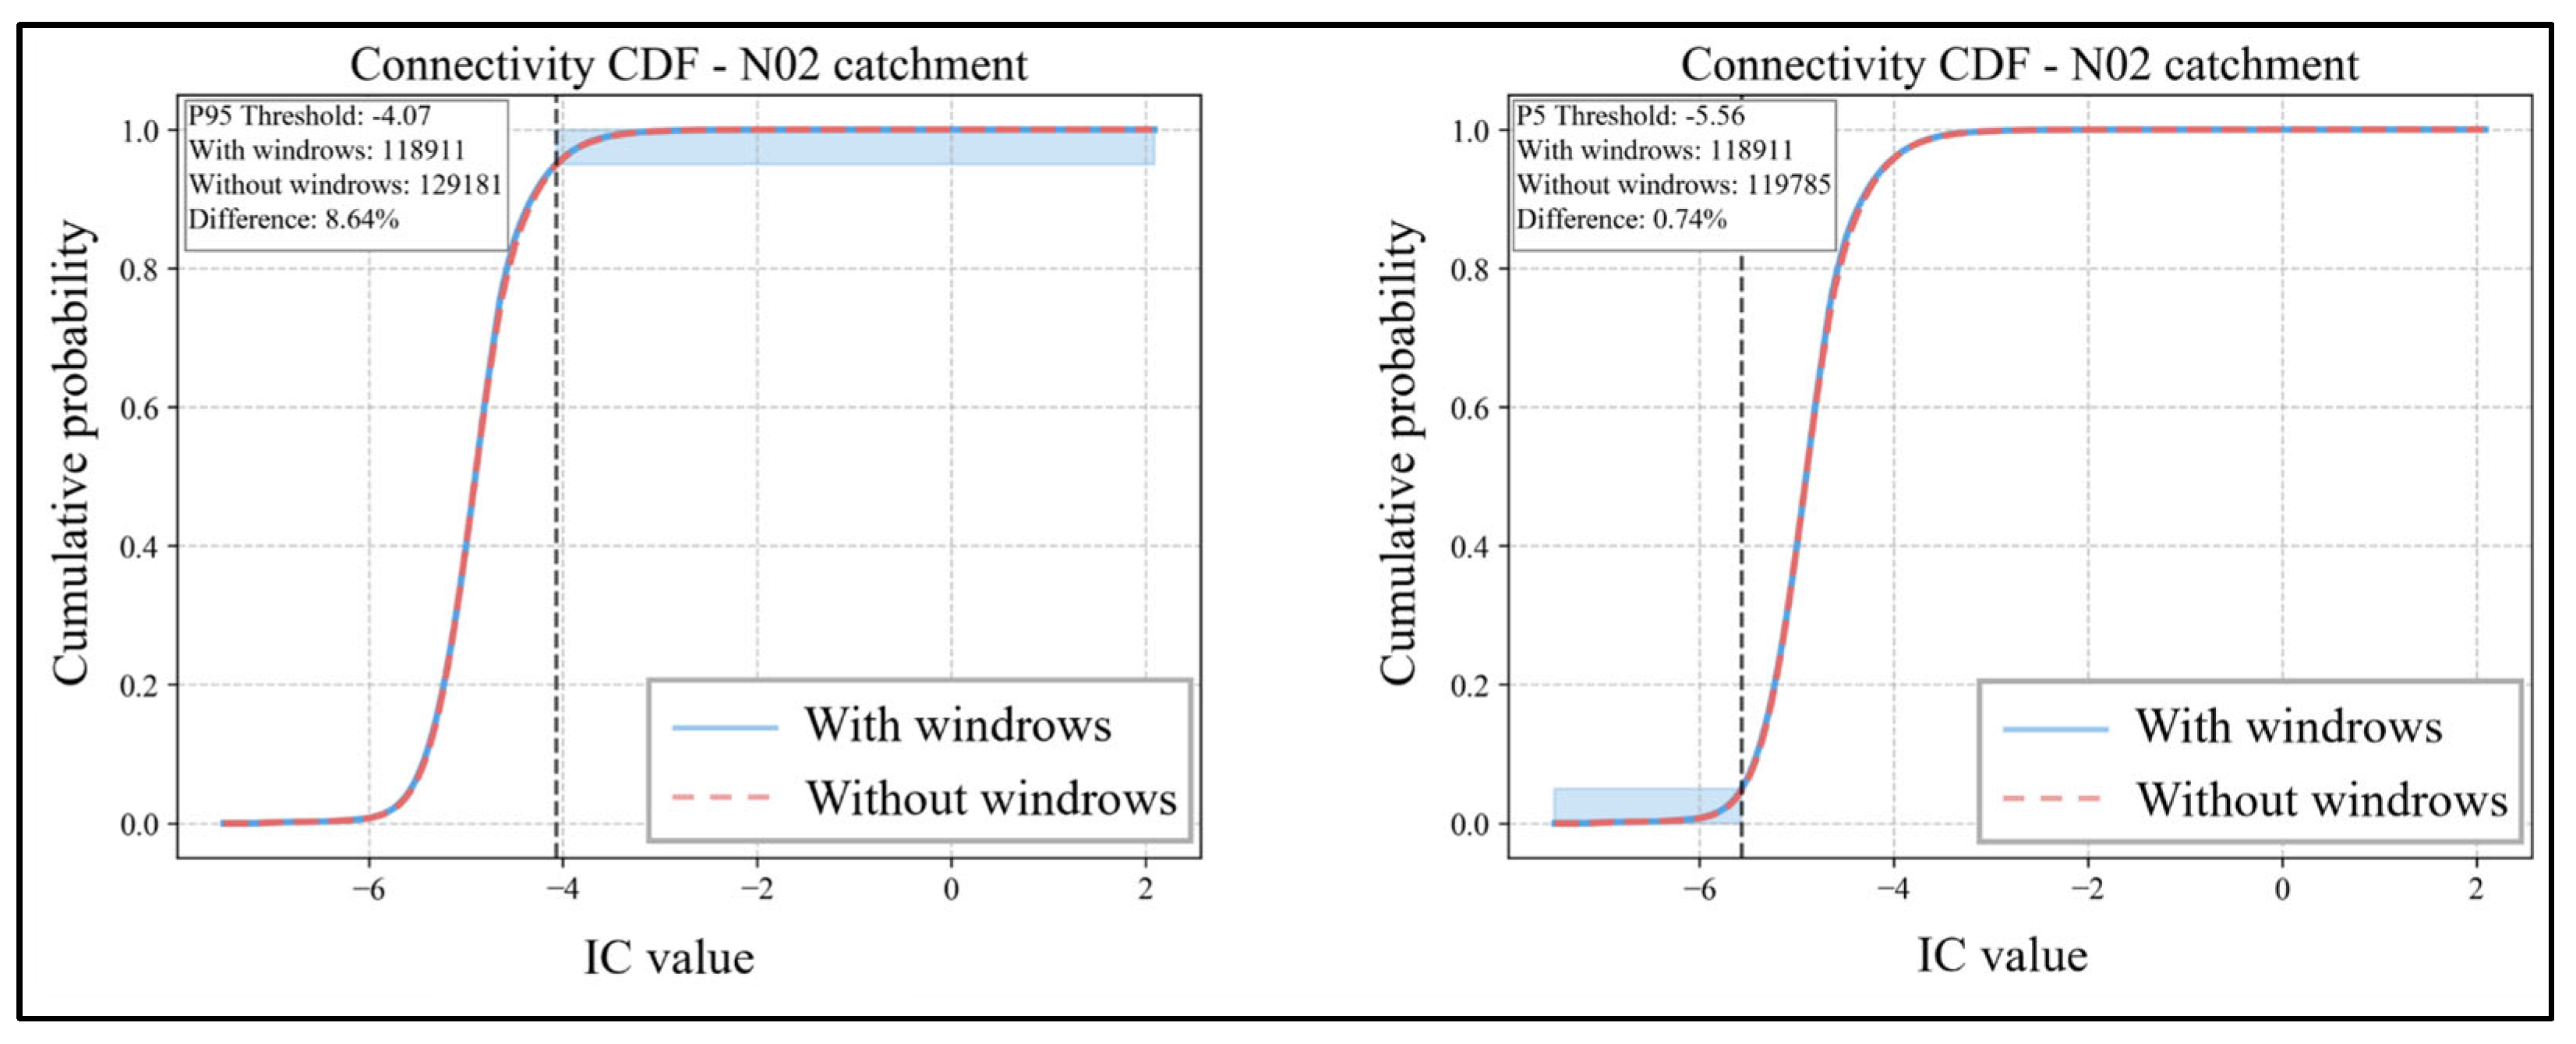
A fixed threshold analysis based on the 95th percentile (high connectivity) and the 5th percentile (low connectivity) of the IC values was also conducted to examine changes in the spatial distribution of high and low connectivity areas between scenarios. Furthermore, a spatial analysis was performed relating the distance to drainage channels with the effect of the windrows (difference in IC values between scenarios) to understand how the effectiveness of the windrows varies with distance from the channels.
5. Discussion
The analysis of residue windrows as a post-harvest management practice revealed some catchment-specific effects on structural sediment connectivity. In N01, the residue windrows covered 14% of the catchment area, with an average size of 82 m2, while in the N02 catchment, they covered 22%, with an average size of 72 m2. Despite similar physical characteristics of the residue windrows between the catchments, their effects on the Index of Connectivity (IC) differed significantly.
The statistical comparison between the scenarios with and without residue windrows in the N01 catchment showed no significant differences in the IC values, with only a slight decrease of 0.06% in the average IC. This result aligns with the findings of [
7], who reported that the effectiveness of woody debris barriers (windrows), particularly under extreme erosive situations, can depend on factors such as their spacing and site-specific characteristics, such as slope and topography. Several studies have emphasized the importance of site-specific conditions in determining the effectiveness of erosion and channel control measures [
14,
16,
23,
24]. When [
14] developed the Index of Connectivity, they noted that subtle changes in landscape configuration can influence connectivity patterns in ways not readily apparent through average values.
In contrast, IC values between scenarios were statistically different (
p-value < 0.05) in catchment N02, although the practical magnitude of this difference was small (0.15%). This is consistent with the findings of [
25,
26], who observed that even modest interventions in sediment transport pathways can produce statistically detectable effects, especially when strategically located. Likewise, ref. [
23] found that forest management practices can subtly but meaningfully alter hydrological connectivity depending on catchment-specific features. In this context, the development of predictive and planning tools is essential.
The contrast in responses between catchments is highlighted by the bootstrap analysis, which showed non-overlapping confidence intervals in the effects of windrows removal. As [
27] reported in their study on the effectiveness of mulching, the efficiency of forest residue management for controlling erosion and connectivity depends on landscape conditions and topography. Ref. [
28] further emphasized that the effectiveness of erosion control measures varies significantly depending on local conditions, including soil type, slope, precipitation patterns, and existing drainage networks. In their research, ref. [
29] linked this variability to differences in the dominant mechanisms of runoff generation and flow pathways between catchments with similar land uses but different geomorphological configurations.
The orientation of residue windrows relative to contour lines emerged as a factor that could potentially explain the difference in effectiveness between catchments. In N02, where windrows showed a significant effect on reducing connectivity, although with very small differences, 84% of them were oriented parallel to the contour lines, compared to only 59% in N01. This pattern aligns with best practices recommended by [
5,
21], which emphasizes that residue barriers oriented parallel to contour lines intercept and control sediment movement more effectively downhill. However, the implementation of the recommendations must consider and facilitate physical constraints for the safe movement of equipment used for the management and sorting of harvest residues on the surface.
In addition, ref. [
9] found that logs placed along contour lines reduced sediment production by 68–99% in areas affected by wildfires, especially when correctly oriented to intercept downhill runoff. Although this study focused on managed forest harvests rather than post-fire conditions, the underlying principle of strategic residue placement appears consistent: well-oriented barriers interrupt hydrological connectivity on slopes. Ref. [
8] expanded this concept by demonstrating that the effectiveness of erosion barriers depends not only on their orientation but also on their spacing and the erosivity of rainfall events after treatment. Similarly, ref. [
30] reported that the effectiveness of barriers oriented along contour lines increases with rainfall intensity, highlighting their particular value during high-risk erosion events. Trenches have also been used to reduce erosion and runoff in steep agricultural areas. Ref. [
31] estimated that trenches were able to reduce runoff and soil loss by 40.4% and 33.8%, respectively.
The spatial distribution of windrow effectiveness in relation to drainage channels also revealed important patterns. In catchment N02, where windrows were more effective, maximum reduction in connectivity occurred at intermediate distances (50–60 m) from channels. This optimal distance effect aligns with findings by [
32], who observed that sediment control structures are most effective when placed in locations where they can intercept concentrated flow before it reaches the drainage network but not too close to the channel to be easily overwhelmed. Ref. [
33] further explored this spatial relationship by analyzing critical sediment source areas and found that distance-dependent effects can significantly influence sediment delivery rates at the catchment scale. Ref. [
34] established that sediment transport capacity varies non-linearly with distance to channels, which could explain the distance-dependent effectiveness patterns observed in this study.
The slope analysis provides additional insight into the functioning of residue windrows. In both catchments, more than 90% of windrows oriented perpendicular to the contour lines were located on moderate to steep slopes (>15°). Ref. [
35] noted that on steeper slopes, the orientation of erosion barriers becomes increasingly critical, as poorly oriented structures may concentrate rather than disperse runoff. Ref. [
36] determined that slope gradient significantly influences barrier efficiency, with a sharp decrease in effectiveness on slopes greater than 30°. Ref. [
37] demonstrated that on steeper gradients, flow concentration patterns change drastically, which could explain why windrow effectiveness varied with their orientation and slope. The effect of this orientation could be stronger in catchment N01 since compared with N02, the proportion of windrows oriented perpendicular to contour lines is more than double (41% vs. 16%). This may explain why N01, despite having substantial windrow coverage, did not achieve a significant reduction in connectivity.
It is worth noting that findings on windrows’ orientation effectiveness coincide with experimental studies by [
32,
38], who reported that residue barriers aligned parallel to contour lines reduced sediment movement by 60–80% compared to controls. In contrast, barriers not aligned with the contour were significantly less effective. The preferential placement of contour-parallel windrows on steeper terrain in catchment N02 reflects the application of this principle in operational forestry practices. Similarly, ref. [
39] investigated soil moisture spatial distribution in Mediterranean catchments and found that vegetative barriers can substantially alter spatial connectivity patterns by enhancing moisture retention and trapping sediments.
Threshold analysis provided a more detailed view of changes in connectivity beyond average values. In N02, areas of high connectivity increased by 8.6% when residue windrows were removed, compared to a smaller increase of 4.6% in N01. This suggests that, although changes in average connectivity were subtle, windrows may play an important role in limiting the expansion of high-connectivity areas that contribute disproportionately to sediment delivery. This pattern is consistent with findings by [
40], who determined that the effectiveness of erosion barriers is particularly evident during intense rainfall events that activate preferential flow paths. Ref. [
41] demonstrated that landscape elements that hinder flow connectivity are especially influential during extreme events, and [
42] highlighted the non-linear relationship between connectivity and sediment transport, suggesting that small changes in connectivity can lead to substantial variations in sediment export.
Cumulative distribution function (CDF) curves revealed that differences in connectivity were primarily concentrated at the extremes of the distribution, reflecting changes in extreme values rather than central trends. This finding aligns with observations by [
43], who found that landscape interventions tend to affect connectivity extremes more significantly than median values. Ref. [
44] explained this phenomenon through the concept of sediment disconnectivity, where certain landscape elements function as barriers that selectively modify connectivity under different flow conditions.
The practical implications of these findings for forest management are significant. Strategic placement of residue windrows appears more important than the coverage percentage, with orientation relative to contour lines and distance to channels as key factors. As [
45] pointed out, the cost-effectiveness of erosion control measures depends not only on their implementation but also on their strategic location within the landscape. The results suggest that the higher proportion of windrows parallel to the contour lines in N02 (84% compared to 59% in N01) could explain much of the difference in effectiveness between catchments, supporting the observations by [
46] about the importance of quality in implementing management practices over their mere presence.
These findings support the recommendations of [
47], who advocate for strategic residue management considering topographical position, orientation, and integration with other management practices. For sustainable forest operations seeking to optimize the benefits of residue windrows for sediment control, the results suggest prioritizing parallel orientation to contour lines, especially on moderate to steep slopes, and considering optimal distances relative to drainage networks. This orientation aligns with landscape-scale approaches to erosion control [
48,
49] and with connectivity management principles described by [
26]. However, it is necessary to implement these practices in a safe way, complementing them with other direct actions on the surface that favor the reduction in sediment surface flow velocity and infiltration, such as disking and subsoiling along contour lines.
Comparing the results with other studies on forest management practices, the subtle effects on connectivity observed could reflect the generally good condition of the studied catchments and already implemented management practices. Refs. [
50,
51] found that well-maintained riparian protection zones can significantly reduce sediment connectivity between slopes and channels, potentially moderating the additional benefit of residue windrows. Ref. [
52] observed that the cumulative effect of multiple optimal management practices typically surpasses the sum of individual effects, suggesting that residue windrows should be considered as part of an integrated potential post-harvest sediment management approach.
One limitation of this study is that the analysis is based on a single UAV-LiDAR survey. However, the objective was not to assess long-term changes in connectivity but rather to evaluate windrow effectiveness during the short and critical post-harvest phase before vegetation regrowth begins to stabilize sediment transport. In this region, ref. [
53] observed that sediment export reaches its maximum the year after harvesting and tends to stabilize in the pre-harvesting period by the third year after harvesting, as new forest cover becomes established. Therefore, the window of interest for evaluating residue management practices, such as windrows, is inherently narrow. Additional surveys within this early post-harvest period, rather than over multiple years, could help better characterize the short-term spatial variability of structural connectivity during this vulnerable stage.
While the Index of Connectivity is a widely accepted tool, it provides a structural proxy based on topography and roughness rather than direct measurements of sediment transport. Finally, the study focused exclusively on windrows and did not evaluate the interaction of this practice with others, such as subsoiling, plowing, or road drainage features. These considerations suggest the need for future studies that combine structural and functional approaches, multi-temporal monitoring, and direct field validation.
6. Conclusions
This study evaluated the effects of post-harvest residue windrows on structural sediment connectivity in two forest catchments located in central-southern Chile, a region characterized by a Mediterranean climate with distinct seasonal rainfall and extended drought conditions. The analysis yielded several key findings with important implications for sustainable forest management as follows:
The effectiveness of residue windrows in reducing connectivity differed notably between the two catchments, despite their similar physical characteristics. In catchment N01, where windrows covered 14% of the area, the change in the IC was negligible (−0.06%). In contrast, in catchment N02, 22% coverage led to a significant IC reduction of 0.15%.
The orientation of the windrows emerged as a potential factor explaining these differences in effectiveness. In catchment N02, where windrows achieved a significant reduction in connectivity, 84% were oriented parallel to the contour lines, compared to only 59% in N01. This finding suggests that proper orientation relative to the topography could be of equal relevance to the coverage percentage.
The spatial relationship between windrows and drainage networks also influenced their effectiveness. In N02, the greater reduction in connectivity occurred at intermediate to high distances from the channels (50–60 m), suggesting the existence of an optimal placement zone for windrows that balances proximity to sediment source areas with adequate distance from channels.
The influence of windrows on connectivity was more pronounced at the extremes of the IC distribution (areas of high and low connectivity), rather than at the median values. This indicates that these structures may be particularly effective in limiting the expansion of highly connected areas.
These findings demonstrate that the configuration and strategic placement of residue windrows can significantly influence their effectiveness as a post-harvest sediment management practice. To achieve optimal results, forest managers should prioritize orientation parallel to contour lines, especially on moderate to steep slopes, and consider their placement at intermediate distances from drainage networks. However, this practice must consider the application of quality and safety parameters of the operations. The subtle yet statistically significant effects observed highlight the importance of evaluating both the statistical relevance and practical implementation of management interventions.
Given that more than 90% of residue windrows oriented perpendicular to contour lines are situated in areas with moderate to steep slopes due to excavator operational capacity, it may be essential to implement alternative placement methodologies, involving field operation crews for manual establishment of these structures or the development and implementation of new technologies.
From a methodological perspective, this study demonstrates the value of high-resolution digital terrain models and connectivity indices for assessing the effectiveness of management practices. The approach developed to simulate scenarios with and without residue windrows provides a useful framework for future studies examining the impact of other landscape features and management practices on sediment and hydrological connectivity.
These findings and methods are applicable to other regions with similar topographic and climatic conditions, such as Mediterranean-type environments around the world, offering valuable insights for forest managers and researchers working in post-harvest erosion control.
While this study is based on a single post-harvest survey, the timing corresponds to a critical period when sediment connectivity is most sensitive. Therefore, the results offer practical guidance for improving erosion control strategies during this vulnerable phase, before vegetation regrowth takes place.
Given that this study focused solely on the role of residue windrows and recognizing that other practices such as intense site preparation (plowing) may also influence connectivity, future research should aim to validate these findings through direct measurements of sediment production, assess the combined effects of residue windrows with other post-harvest practices, and explore performance under varying rainfall regimes and across different landscape contexts. Additionally, long-term studies to evaluate how windrows’ effectiveness changes as they decompose and vegetation regenerates should be conducted, which is critical to determining insights into the optimal replacement timing or integration with additional erosion control measures.
Finally, the results of this study also have operational implications. Forest companies can use this approach to make more informed decisions about windrow orientation and placement, thereby mitigating short-term post-harvest effects on soils.


 ,
, 
