Article

Endophytic Bacterial Consortia Isolated from Disease-Resistant Pinus pinea L. Increase Germination and Plant Quality in Susceptible Pine Species (Pinus radiata D. Don)

1
Department of Life Sciences, Centre for Functional Ecology, Associate Laboratory TERRA, Faculty of Sciences and Technology, University of Coimbra, 3000-456 Coimbra, Portugal
2
Biology Department, Centre for Environmental and Marine Studies, University of Aveiro, 3810-193 Aveiro, Portugal
*
Author to whom correspondence should be addressed.
Forests 2025, 16(7), 1161; https://doi.org/10.3390/f16071161
Submission received: 28 May 2025 / Revised: 4 July 2025 / Accepted: 10 July 2025 / Published: 14 July 2025
(This article belongs to the Section Forest Ecology and Management)

Abstract

The nursery phase is vital for forest regeneration, yet studies on plant growth-promoting (PGP) bacteria to enhance sustainable nursery production in forest species are scarce. This study explores whether endophytic bacteria from disease-resistant Pinus pinea L. can improve germination and seedling quality in susceptible Pinus radiata D. Don. Root endophytes were isolated, screened for PGP traits, and identified via 16S rRNA gene sequencing. Bacterial formulations were applied to P. radiata seeds to determine their impact on germination and plant quality indicators (photosynthetic pigments and other metabolites). Paenibacillaceae (19%) and Bacillaceae (13%) were predominant among 68 isolates, with 94% producing indole-3-acetic acid, and Burkholderiaceae showing the broadest PGP trait diversity. Seedlings inoculated with formulation C3 (Caballeronia R.M3R3, Rhodococcus T.M4R4, and Mesorhizobium R.M1R2) displayed an improved germination rate (89% compared to 71% from the uninoculated control), while those inoculated with formulation P4 (Paenibacillus T.M5R4, Bacillus R.M2R7, Acinetobacter T.M2R22, and Paraburkholderia R.M1R3) showed an improved germination rate (81%), increased amount of starch (0.4-fold), and free amino acids (1.5-fold). This study presents a comprehensive approach, from endophyte isolation to in vivo tests, highlighting two bacterial formulations as candidates for further proof-of-concept nursery trials. Ultimately, these bioinoculants represent eco-friendly strategies to enhance forest seedling establishment and support sustainable forest management.

1. Introduction

Pine species are economically relevant worldwide, being the most planted forest species in the world [1]. They also have a prominent role in the Mediterranean ecosystem, with species such as Pinus pinea L. and Pinus pinaster Aiton being widely distributed throughout the Iberian Peninsula. Pinus pinea, in particular, holds a significant economic and ecological importance in this region [2]. In recent decades, the nursery production and plantation of non-native Pinus radiata D. Don have increased significantly in the Mediterranean region [3,4] due to its fast-growing nature. Over the same period, there has also been an increase in risks associated with pests and pathogens in forests [5], particularly for non-native species. Forest species from the same genus can differ in their tolerance to diseases. For example, P. pinea is considered more resistant to pathogens such as Fusarium circinatum Nirenberg & O’Donnell, Bursaphelenchus xylophilus (Steiner & Bührer) Nickle, and Lecanosticta acicula (Thüm.) Syd., while P. radiata is more susceptible [6,7,8]. There are many aspects that contribute to a higher resistance profile of P. pinea compared to P. radiata. Some of them include increased basal levels of phenolic compounds and hormones and increased expression of defense-related genes, as well as increased stomatal openings and transpiration rates post-infection [6,9] and the protective potential of the rhizobiome [10]. In a previous study by [11] it was observed that the rhizospheric bacterial communities of P. pinea nursery seedlings were enriched with bacterial groups displaying beneficial traits for the host plant associated with protection against fungal pathogens. In the rhizosphere of P. radiata, these beneficial groups were under-represented, suggesting that these seedlings could potentially benefit from microbial-based strategies aimed at enhancing their quality, including growth and resistance to diseases.
Fertilizers enriched with plant growth-promoting bacteria (PGPB) are emerging as nature-based crop protection products. They contain bacteria known for synthesizing compounds that foster plant host development, growth, and resilience [12]. The use of PGPB in agriculture has been expanding, particularly in crops such as wheat, potatoes, and cucumbers [13,14,15]. In recent years, significant advancements have been made, progressing from single bacterial inoculants to more effective bacterial consortia [12,16]. However, despite their potential benefits for nutrient assimilation and biocontrol, PGPB application in forest species remains limited. Still, a few promising studies exist, such as the use of Azospirillum brasilense or Bacillus spp. to improve the root growth and nutritional quality of Araucaria angustifolia (Bertol.) Kuntze seedlings [17]. In nurseries, the most common method of delivering nutrients to seedlings is through inorganic fertilizers that contain phosphorous, nitrogen, or potassium [18]. Moreover, plant nursery phytosanitary management, a critical challenge throughout plant production, is heavily reliant on conventional pesticides [19] and is now embracing new challenges due to regulatory restrictions. Increasing knowledge of PGPB-based strategies for forest species helps producers make informed decisions based on scientific evidence. This potentiates the adoption of PGPB-based strategies, which is an important step in advancing sustainable forest plant nursery production [20].
Endophytes inhabit the inner tissues of the plant without harming it [21]. Their plant growth-promoting traits are often more efficient due to better communication with the host plant [22]. Although some studies have investigated bacterial endophytes in Pinus spp. [23,24], few have specifically focused on plant growth-promoting bacteria (PGPB), leaving a limited understanding of their diversity and potential application.
To the authors’ knowledge, there are no published studies on the use of PGPB in P. radiata seeds to improve germination and plant quality. Only a few publications exist on the use of PGPB in P. radiata seedlings, which mostly focus on biocontrol strategies. Such studies include one by [25], who used rhizosphere native bacteria from P. radiata to confer protection against common forest fungal pathogens (Heterobasidion annosum s.s. (Fr.) Bref. and Armillaria mellea (Vahl) P. Kumm), resulting in a 35% to 50% reduction in pathogen incidence (respectively) and lower plant mortality. Another example is the study by [26], in which the use of PGPB isolated from healthy P. radiata trees results in smaller lesions in seedlings inoculated with Fusarium circinatum.
This study aims to address the knowledge gaps in the role of PGPB in forest species, particularly pine species, focusing on their potential to enhance plant nursery production. Based on our previous results [11], we hypothesize that endophytes from a disease-resistant pine species, P. pinea, can enhance the germination and development of P. radiata seedlings. To validate this hypothesis, we propose to isolate endophytic bacteria from the roots of P. pinea, assess their diversity, and evaluate their plant growth-promoting characteristics. Based on the results, a bottom-up strategy will be used to formulate bacterial consortia and assess their impact on P. radiata seed germination and seedling performance. Plant quality indicators include morphology data (shoot and root size), biochemical compounds from both primary (energy and growth related) and secondary (defense-related) metabolism, such as soluble sugars and starch, phenolic and flavonoids compounds, photosynthetic pigments (chlorophyll a, b and carotenoids), amino acids, and malondialdehyde.

2. Materials and Methods

2.1. Collection and Characterization of Endophytic Bacteria from Pinus pinea L. Roots

2.1.1. Sampling and Isolation

Plant material was collected in Figueiró dos Vinhos, Portugal (40°02′29.6″ N 8°14′20.1″ W). Roots from five adult trees of P. pinea (approx. 20 years old), without any disease symptoms, were sampled using sterile pruning shears. Sampling was performed at a depth of approximately 30 cm, and both root tips and basal root segments were collected. Plant material was transported to the laboratory under refrigerated conditions and processed.
For endophyte isolation, 10 g of roots was washed with tap water and surface sterilized as follows: the samples were sequentially immersed in 70% ethanol (2 min), 2.5% NaOCl (2 min), and 70% ethanol (2 min) and rinsed in sterile distilled water three times. Surface sterilization was confirmed by inoculating 100 μL of water from the final rinse onto Tryptic Soy Agar (TSA, Merck, Darmstadt, Germany) and Reasoner’s 2A agar (R2A, Merck, Germany) culture media. The plates were examined for bacterial growth after incubation at 28 °C for 7 days. After periderm removal, the surface-sterilized roots were cut into small pieces using a sterile chisel and processed according to a protocol adapted from [27]. Briefly, root samples were homogenized in a sterilized blender jar with 100 mL of phosphate-buffered saline (PBS, phosphate buffer, 0.01 M; potassium chloride, 0.0027 M; sodium chloride, 0.137 M) for 5 min. The homogenized mixture was filtered using five layers of sterile gauze, and the liquid macerate was collected and centrifuged at 600× g for 5 min; the supernatant was then centrifuged at 10,000× g for 10 min to pellet the bacterial cells [27]. The bacterial cells were resuspended in 1 mL of PBS solution, and 100 μL was plated in triplicate onto R2A and TSA plates containing cycloheximide at 0.2 mg/mL (Sigma-Aldrich, St. Louis, MO, USA). The plates were incubated at 28 °C, and after a period of 7 days, morphologically distinct bacterial colonies were purified by streaking and stored at −80 °C in 20 % glycerol.

2.1.2. Molecular Typing and Identification

BOX-PCR with BOXA1 primer (5′-CTACGGCAAGGCGACGCTGAC-3′; [28]) was used for molecular typing of all isolates. PCR reactions were performed in a Bio-Rad Thermal Cycler (Bio-Rad Laboratories, Hercules, CA, USA), in a total volume of 25 μL, using 6.25 μL of NZYTaq 2× Green Master Mix (2.5 mM of MgCl2; 200 μM of dNTPs; 0.2 U/μL of DNA polymerase) (NZYTech, Lisbon, Portugal), 1.5 μL of BOXA1 primer (10 μM), 16.25 μL of ultrapure water, and 50–100 ng of template DNA, which was obtained by cell suspension in 20 μL of ultrapure water boiled at 100 °C for 5 min. The amplification conditions were as follows: one cycle at 95 °C (7 min), 30 cycles at 94 °C (1 min), 53 °C (1 min), 65 °C (8 min), and a final cycle at 65 °C (16 min). The products were analyzed by electrophoresis on a 1.5% agarose gel and stained with ethidium bromide. The isolates displaying genetic fingerprinting patterns (n = 35) were analyzed using GelCompar II software (version 5.10, Applied Maths, Sint-Martens-Latem, Belgium). Similarity between banding patterns was calculated using the Dice correlation coefficient, and clustering was performed with the unweighted pair group method with the arithmetic mean (UPGMA) algorithm. A position tolerance of 1% was applied for band matching. The resulting dendrogram was used to identify groups of isolates with ≥90% similarity. This similarity threshold was established to ensure that patterns known to be identical (e.g., molecular size markers) were grouped. Representative isolates were selected from each cluster defined by this cutoff. For the 53 isolates that did not produce fingerprinting patterns, grouping was performed based on colony morphology characteristics. From each group of isolates with visually similar colonies, representative strains were randomly selected for further analysis. These were subjected to PCR amplification of the 16S rRNA gene using the universal primers 27f (5′-AGAGTTTGATCCTGGCTCAG-3′; [29], 0.75 μL, 10 μM) and 1492r (5′-GGTTACCTTGTTACGACTT-3′; [29], 0.75 μL, 10 μM), and the NZYTaq 2× Green Master Mix (NZYTech, Portugal, 16.25 μL) in 25 μL of reactions, as described above. The amplification conditions were as follows: one cycle at 94 °C (5 min), 30 cycles at 94 °C (1 min), 55 °C (1 min), 72 °C (1.5 min), and a final cycle at 72 °C (10 min). The amplification products were purified with an NZYGelpure kit (NZYTech, Portugal) according to the manufacturer’s instructions. Amplicons were sequenced by Eurofins Genomics (Germany). Sequences were edited manually and affiliated using both BLAST software (version 2.15.0, National Center for Biotechnology Information, Bethesda, MD, USA) [30] against the GenBank database and the EZTaxon (version available at march of 2024, ChunLab, Inc., Seoul, Republic of Korea) tool available at http://www.ezbiocloud.net/eztaxon (accessed on the 20 March 2024) [31]. The partial 16S rRNA gene sequences obtained in this study were submitted to GenBank and are available under the submission numbers present in Table S1.

2.1.3. Screening of Endophytic Bacteria for Plant Growth-Promoting Traits

The representative isolates were individually screened according to [32] for different PGP traits: 1-aminocyclopropane-1-carboxylate (ACC) deaminase activity, indole-3-acetic acid (IAA) production, phosphate solubilization, and siderophore production. Isolates were incubated in adequate growth media at 28 °C until sufficient growth was obtained. The strains used for negative and positive controls were isolated and characterized [32].
To determine ACC deaminase activity, isolates were tested for their ability to use ACC as the sole nitrogen source. Therefore, the representative isolates were grown in Dworkin and Foster (DF) salt minimal medium [32,33], either with no nitrogen source or supplemented with 3 mM of ACC (DF + ACC) or with 2 g of L−1 (NH4)2SO4 (DF + ammonium sulphate).
To test for IAA production, the method of [34] was used: For each isolate, 500 μL of the supernatant obtained from the cultures grown in nutrient broth (NB, Merck, Germany) or Tryptic Soy Broth (TSB, Merck, Germany) + L-tryptophan (1%) was mixed with 1 mL of Salper solution. After incubating in the dark for 30 min, the Optical Density (OD) was read at 535 nm. Using the calibration curve of pure IAA as a standard, IAA concentrations (μg mL−1) were obtained for each isolate.
The ability of isolates to solubilize phosphate was screened on the National Botanical Research Institute’s Phosphate (NBRIP) solid growth medium [35]. After inoculation and appropriate incubation, phosphate solubilization was observed as a clear halo surrounding the bacterial growth.
Siderophore production was tested, as described by [32]. After growth at 28 °C in either TSA or R2A, the plates were overlaid with Chrome Azurol S (O-CAS; [36]) and incubated for 2 h. Siderophore production was detected by color changes from blue to orange or purple.
Twenty isolates were selected for an antifungal activity test based on their PGP traits. This included ten isolates with the highest IAA production and ten isolates with the lowest. Additionally, to ensure a diverse range of PGP traits, isolates with different trait combinations (e.g., IAA production with siderophore production, phosphate solubilization, or ACC deaminase activity) were included. This selection aimed to ensure comprehensive PGP trait coverage in the consortia tested on plants. Antagonism assays against Fusarium circinatum were adapted from a study by [37]. Briefly, bacterial strains were streaked as 1 cm perpendicular lines on Potato Dextrose Agar (PDA, Merck) plates, positioned 3 cm from the center, where a 5 mm plug of Fusarium circinatum (FcCa6; mating type 2; [38]) was placed. A control plate inoculated with only F. circinatum FcCa6 was included. Assays were performed in triplicate. Fungal growth was recorded daily. The assay ended after 7 days, when the fungus fully colonized the control plate. Strains were classified as positive for fungal inhibition if no mycelial growth was observed around the bacterial streak. The inhibition zone was measured using Inkscape image software (version 1.3.2; Inkscape Project, open-source software; available at inkscape.org), with digital distances calibrated against a 5-cent Euro coin. The percentage of fungal growth inhibition was calculated according to the following formula:
Inhibition   Percentage % = ControlFung Growth IsolateFung growth ControlFung Growth * 100
where Inhibition Percentage is the percentage of fungal inhibition; ControlFungGrowth is the radius (in cm) of the fungal growth on the control plate (no bacteria) and IsolateFungGrowth is the radius (in cm) of the fungal growth on the test plate (with bacteria).

2.2. Bacterial Formulations and PGPB Inoculation in Pinus radiata D. Don Seeds

2.2.1. Bacterial Formulations

The bacterial formulations were developed using a bottom-up approach: ten bacterial isolates were selected according to their plant growth-promoting traits to test their impact on Pinus radiata seed germination and subsequent seedling quality. Strains Paenibacillus T.M5R4 and Caballeronia R.M3R3 were initially selected due to producing only IAA and no other PGP traits. These strains were tested individually and in combination (consortia), with up to four additional strains (a maximum of five strains per consortium) exhibiting several plant growth-promoting traits, as summarized in Table 1. The first letter in the consortium designation corresponds to the strain that is always present, e.g., Paenibacillus T.M5R4 is represented by “P” and Caballeronia R.M3R3 by “C”. The numbers indicate the total number of strains included in each consortium, ranging from 2 to 5. To maintain naming consistency, formulations P1 and C1 contain the strains Paenibacillus T.M5R4 and Caballeronia R.M3R3, respectively, even though they represent single bacterial formulations.
To ensure that there was no growth inhibition among them, bacterial strains from the same consortium were co-cultivated on Tryptic Soy Agar (TSA) at 25 °C and monitored for 14 days. Afterwards, each bacterial strain was individually cultivated in Erlenmeyer flasks containing 50 mL of Tryptic Soy Broth (TSB) for 24 h at 25 °C in a rotary shaker at 180 rpm. The bacterial concentration (cells/mL) was measured at OD600. A culture volume corresponding to 108 cells/mL was transferred to a Falcon tube (50 mL) and centrifuged at 4000× g for 10 min at room temperature, with the supernatant discarded afterwards. For each isolate, the pellet was resuspended in sterile water to a concentration of 108 cells/mL. Then, from these tubes, an equal volume of culture was transferred into a new Falcon tube according to the formulation of each bacterial consortium, with a final concentration of 108 cells/mL.

2.2.2. Pinus radiata Seed Inoculation and Climatic Chamber Experiment

Seeds from P. radiata (prov. Galicia, Spain) were acquired from a certified forestry nursery producer and kept at cold temperatures until sowing (Sociedade Agrícola e Pecuária Melo & Cancela, Anadia, Portugal). After harvest, the seeds were kept at the same temperature according to standard nursery operational practices. Afterwards, these seeds were treated according to an adaptation of the protocol by [39]. First, the seeds were soaked in water for 24 h (the water was renewed after 12 h) and hydrogen peroxide (3%) for 15 min, with three subsequent washes using sterile distilled water. Following a 30 min submersion in distilled water, the seeds were placed in a laminar flow hood to dry (for 2 h) and then submerged in solutions containing the bacterial formulations (with 108 cells/mL) for 2 h. Finally, the seeds were planted in a 1:1 peat/vermiculite (v/v) mixture that had been previously autoclaved twice and placed in a climatic growth chamber (conditions detailed below). For each formulation and the control group, forty-eight seeds were used.

2.2.3. Seedling Emergence

The germination conditions were set according to [39] with the following adaptations: 80% humidity, temperature: 21.5 °C, and 16/8 h light/dark photoperiod. Forty-eight seeds per treatment were sown. Seeds were watered daily (10 mL). Seedling emergence was defined as the visible aboveground emergence of the hypocotyl from the seed, and this was monitored daily. After 30 days, fully developed seedlings (root, stem, and needles) were carefully separated from the soil and sampled for further measurements. All remaining seeds were inspected to confirm the total germination percentage.

2.2.4. Seedling Height, Root Size, and Biomass

For shoot and root measurement, seedlings (8 seedlings per treatment) were placed on a dark plastic cover and measured with a 40 cm ruler. To clearly identify the root starting point, the root was defined as the part of the plant that was previously located underground. A different set of 6 seedlings per treatment was used for biomass measurement. To measure biomass, each seedling was placed in an empty Falcon tube (50 mL) without the cap and placed inside a drying oven at approximately 50 °C for 5 days. Afterwards, the dry weight was recorded.

2.3. Plant Biochemical Profile

For each treatment, 6 previously measured seedlings were selected. To measure various plant-related metabolites, the protocol from [40] was used, as it requires a smaller sample amount while allowing the detection of a wide range of metabolites. The whole aboveground part of the plant was used.
First, one milliliter of cold (4 °C) 80% ethanol was added to 50–70 mg of frozen tissue (aboveground tissue) and ground for a short amount of time. Afterwards, the samples were centrifuged at 10,000× g for 10 min at 4 °C. The resulting pellet was used for starch quantification, and the supernatant was used for the remaining measurements, as detailed below. For all absorbance measurements, a microplate reader was used (Synergy HT, BioTek Instruments, Winooski, VT, USA).

2.3.1. Photosynthetic Pigments

Three hundred microliters of previously obtained supernatant were diluted in 80% cold ethanol (1:1) for chlorophyll a, chlorophyll b, and carotenoid content determination. Each sample (150 µL) was transferred to a 96-well microplate, and absorbances were measured at 470, 649, and 664 nm in a microplate reader.

2.3.2. Total Soluble Sugars and Starch

For starch quantification, the pellet was transferred to a new 1.5 mL tube, where 1 mL of 30% perchloric acid was added, followed by a 1-h incubation at 60 °C. Seventy-five microliters of the supernatant resulting from previous starch hydrolysis was added to 750 µL of anthrone reagent and incubated at 100 °C for 10 min. For total soluble sugar quantification, 50 µL of the supernatant (resulting from photosynthetic pigment extraction) was added to 750 µL of anthrone reagent and incubated at 100 °C for 10 min. The blank tube was prepared by replacing the volume of the supernatant with 80% ethanol, following the same procedure. For both total soluble sugars and starch, 150 µL of each sample was transferred to a respective 96-well microplate, and the absorbance was read at 625 nm using a microplate reader. The total soluble sugar content was calculated against a D-glucose standard curve in 80% ethanol (0–1 mg/mL). The starch content was calculated with a D-glucose standard curve in 30% perchloric acid (0–1 mg/mL).

2.3.3. Total Phenolic Compounds

For the total phenolic content, a total of 20 µL of the supernatant (resulting from photosynthetic pigment quantification), 90 µL of distilled water, and 10 µL of Folin–Ciocalteu reagent solution were added to a 96-well microplate and left in the dark at room temperature for 6 min. Then, 80 µL of a 7% sodium carbonate solution was added to each well and incubated in the dark at room temperature for 2 h. The absorbance was measured at a wavelength of 750 nm. Gallic acid was used as a standard to build a calibration curve (0–1 mg/mL).

2.3.4. Total Flavonoid Content

For the total flavonoid content, 60 µL of the supernatant (resulting from photosynthetic pigment quantification) and 28 µL of a 5% sodium nitrite solution were added to a 96-well microplate and left in the dark at room temperature for 6 min. Then, 28 µL of a 10% aluminum chloride solution was added to each well and incubated again for 6 min in the dark. Afterwards, 120 µL of a 4% sodium hydroxide solution was added to each well. The absorbance was measured at 370 nm. Catechin (Merck, Germany) was used as a standard to calculate the calibration curve (0–1 mg/mL).

2.3.5. Free Amino Acids

For free amino acid quantification, 75 µL of ninhydrin was added to 150 µL of the supernatant resulting from photosynthetic pigment quantification. Then, the samples were placed under incubation (100 °C) for 10 min and cooled. Three hundred and seventy-five microliters of 95% ethanol was added to the tubes. Finally, the samples were transferred to 96-microwell plates and measured at the following absorbances: 440, 520, and 570 nm. L-Proline + L-Glycine (Merck, Germany) was used as a standard to calculate the calibration curve (0–1 mg/mL).

2.3.6. Malondialdehyde (MDA) Content

For lipid peroxidation, estimated by the amount of malondialdehyde (MDA), 250 μL of the supernatant was transferred to a microcentrifuge tube with an equal volume of positive reaction solution [0.5% thiobarbituric acid and TBA in 20% (w/v) trichloroacetic acid (TCA)]. Another 250 μL of supernatant was added to an equal volume of negative reaction solution [20% (w/v) TCA]. Both tubes were incubated at 95 °C for 30 min and centrifuged at 3000× g for 10 min at 4 °C. The supernatant absorbance was read at 440, 532, and 600 nm. The MDA content was determined by applying the formula described by [41].

2.4. Statistical Analysis

Statistical analyses were conducted using R software (version 4.0; R Core Team, Vienna, Austria). Morphological data (root and shoot length), biomass (dry weight), and biochemical data (photosynthetic pigments, malondialdehyde, sugars, amino acids, phenolic compounds, and flavonoids) were analyzed as follows: The normality of the data was assessed using the Shapiro–Wilk test, and homoscedasticity (equal variances) was checked using Levene’s test. If both normality and equal variances were confirmed, an Analysis of Variance (ANOVA) was performed. When the data did not follow a normal distribution but had homogeneous variances, a Kruskal–Wallis test was applied instead. All tests were conducted with a significance threshold of 0.05.
In this study, seedling emergence was used as a proxy to determine the germination-related parameters (mean germination time and germination speed).
The R package germinationmetrics (version 0.1.8; Germinationmetrics; available at https://cran.r-project.org/package=germinationmetrics (accessed on the 20 March 2024)) was used to assess the mean germination time, which represents the average time required for seeds to germinate. The mean germination time was calculated as follows:
T = i = 1 k N i T i i = 1 k N i
where T is the mean germination time, Ni is the number of seeds germinated in each time interval (non-cumulative), Ti is the time from the start of the experiment to each interval, and k is the total number of intervals.
For germination speed, which expresses the rate of germination as the number of seeds germinating within a given time interval, the formula is as follows:
S = i = 1 k N i T i
where S is the germination speed, Ni is the number of seeds germinated in each time interval (non-cumulative), Ti is the time from the start of the experiment to each interval, and k is the total number of intervals.
The total germination percentage, calculated as the number of germinated seeds divided by the total number of sown seeds and multiplied by 100, was confirmed at the end of the experiment by visually inspecting all remaining seeds.
The probability of seedling emergence over time for each treatment was analyzed using a Kaplan–Meier survival analysis. In this context, “survival” was defined as the non-emergence of a seedling, and the “event” was defined as seedling emergence. For each seed, the time to emergence (in days from sowing) was recorded. Seeds that did not emerge by the end of the experimental period (30 days) were considered censored observations at the last observation day. Kaplan–Meier survival curves were generated to visualize the cumulative probability of non-emergence over time for each treatment group.
To assess the effect of the different pretreatments on the rate of seedling emergence, a Cox Proportional Hazards (CPH) model was employed. The model used pretreatments (the bacterial formulations) as a categorical predictor, with the control group set as the reference. All statistical analyses, including Kaplan–Meier curves and Cox Proportional Hazards regression, were performed using R statistical software (version 4.0) with the survival and survminer packages.
Data from morphology, biochemistry, and germination was transformed using a logarithm (base 2). Afterwards, a heatmap of the logarithm (base 2) of the fold-change difference between the average value of the control and the average value of each formulation was calculated using the ComplexHeatmap package (version 1.3.3; Z. Gu, German Cancer Research Center, Heidelberg, Germany).

2.5. Data Visualization

All figures were constructed using R software (version 4.0; R Core Team, Vienna, Austria). The package “ggplot2” (version 3.4.4; Posit PBC, Boston, MA, USA) was used to create all figures apart from the upset plot, which was created using the “ComplexUpset” R software package (version 2.15.4 ; Posit PBC, Boston, MA, USA).

3. Results

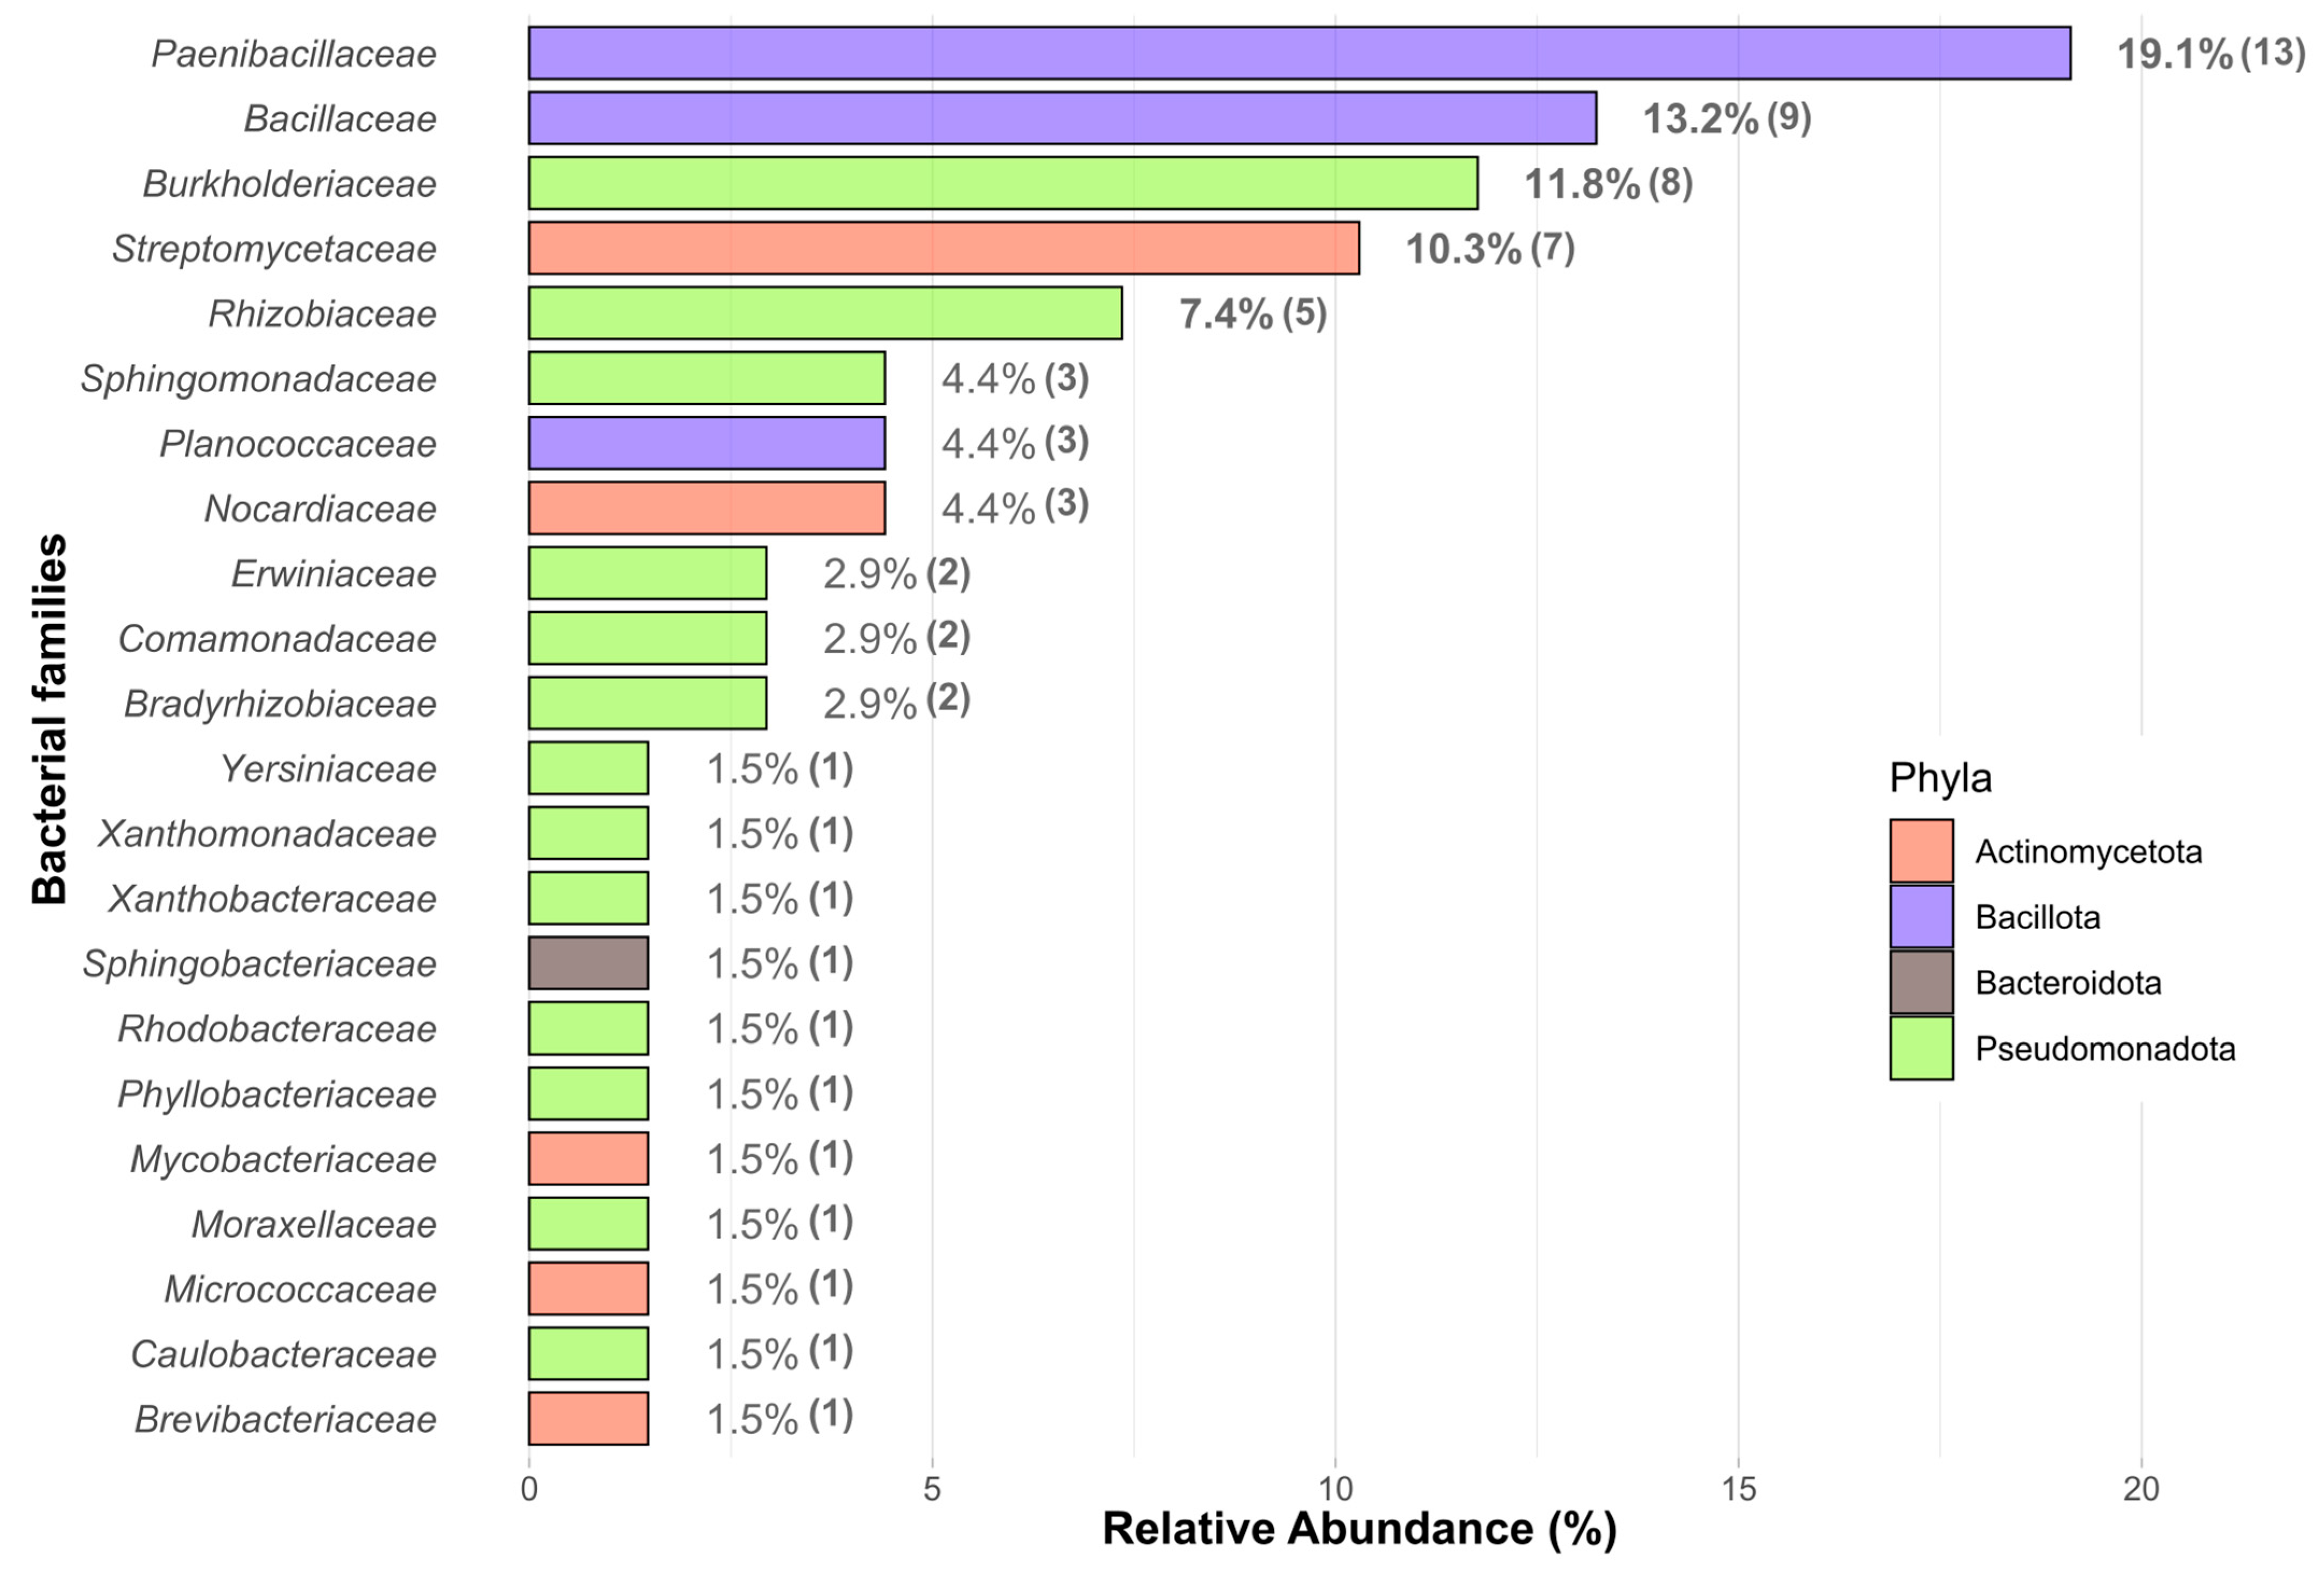
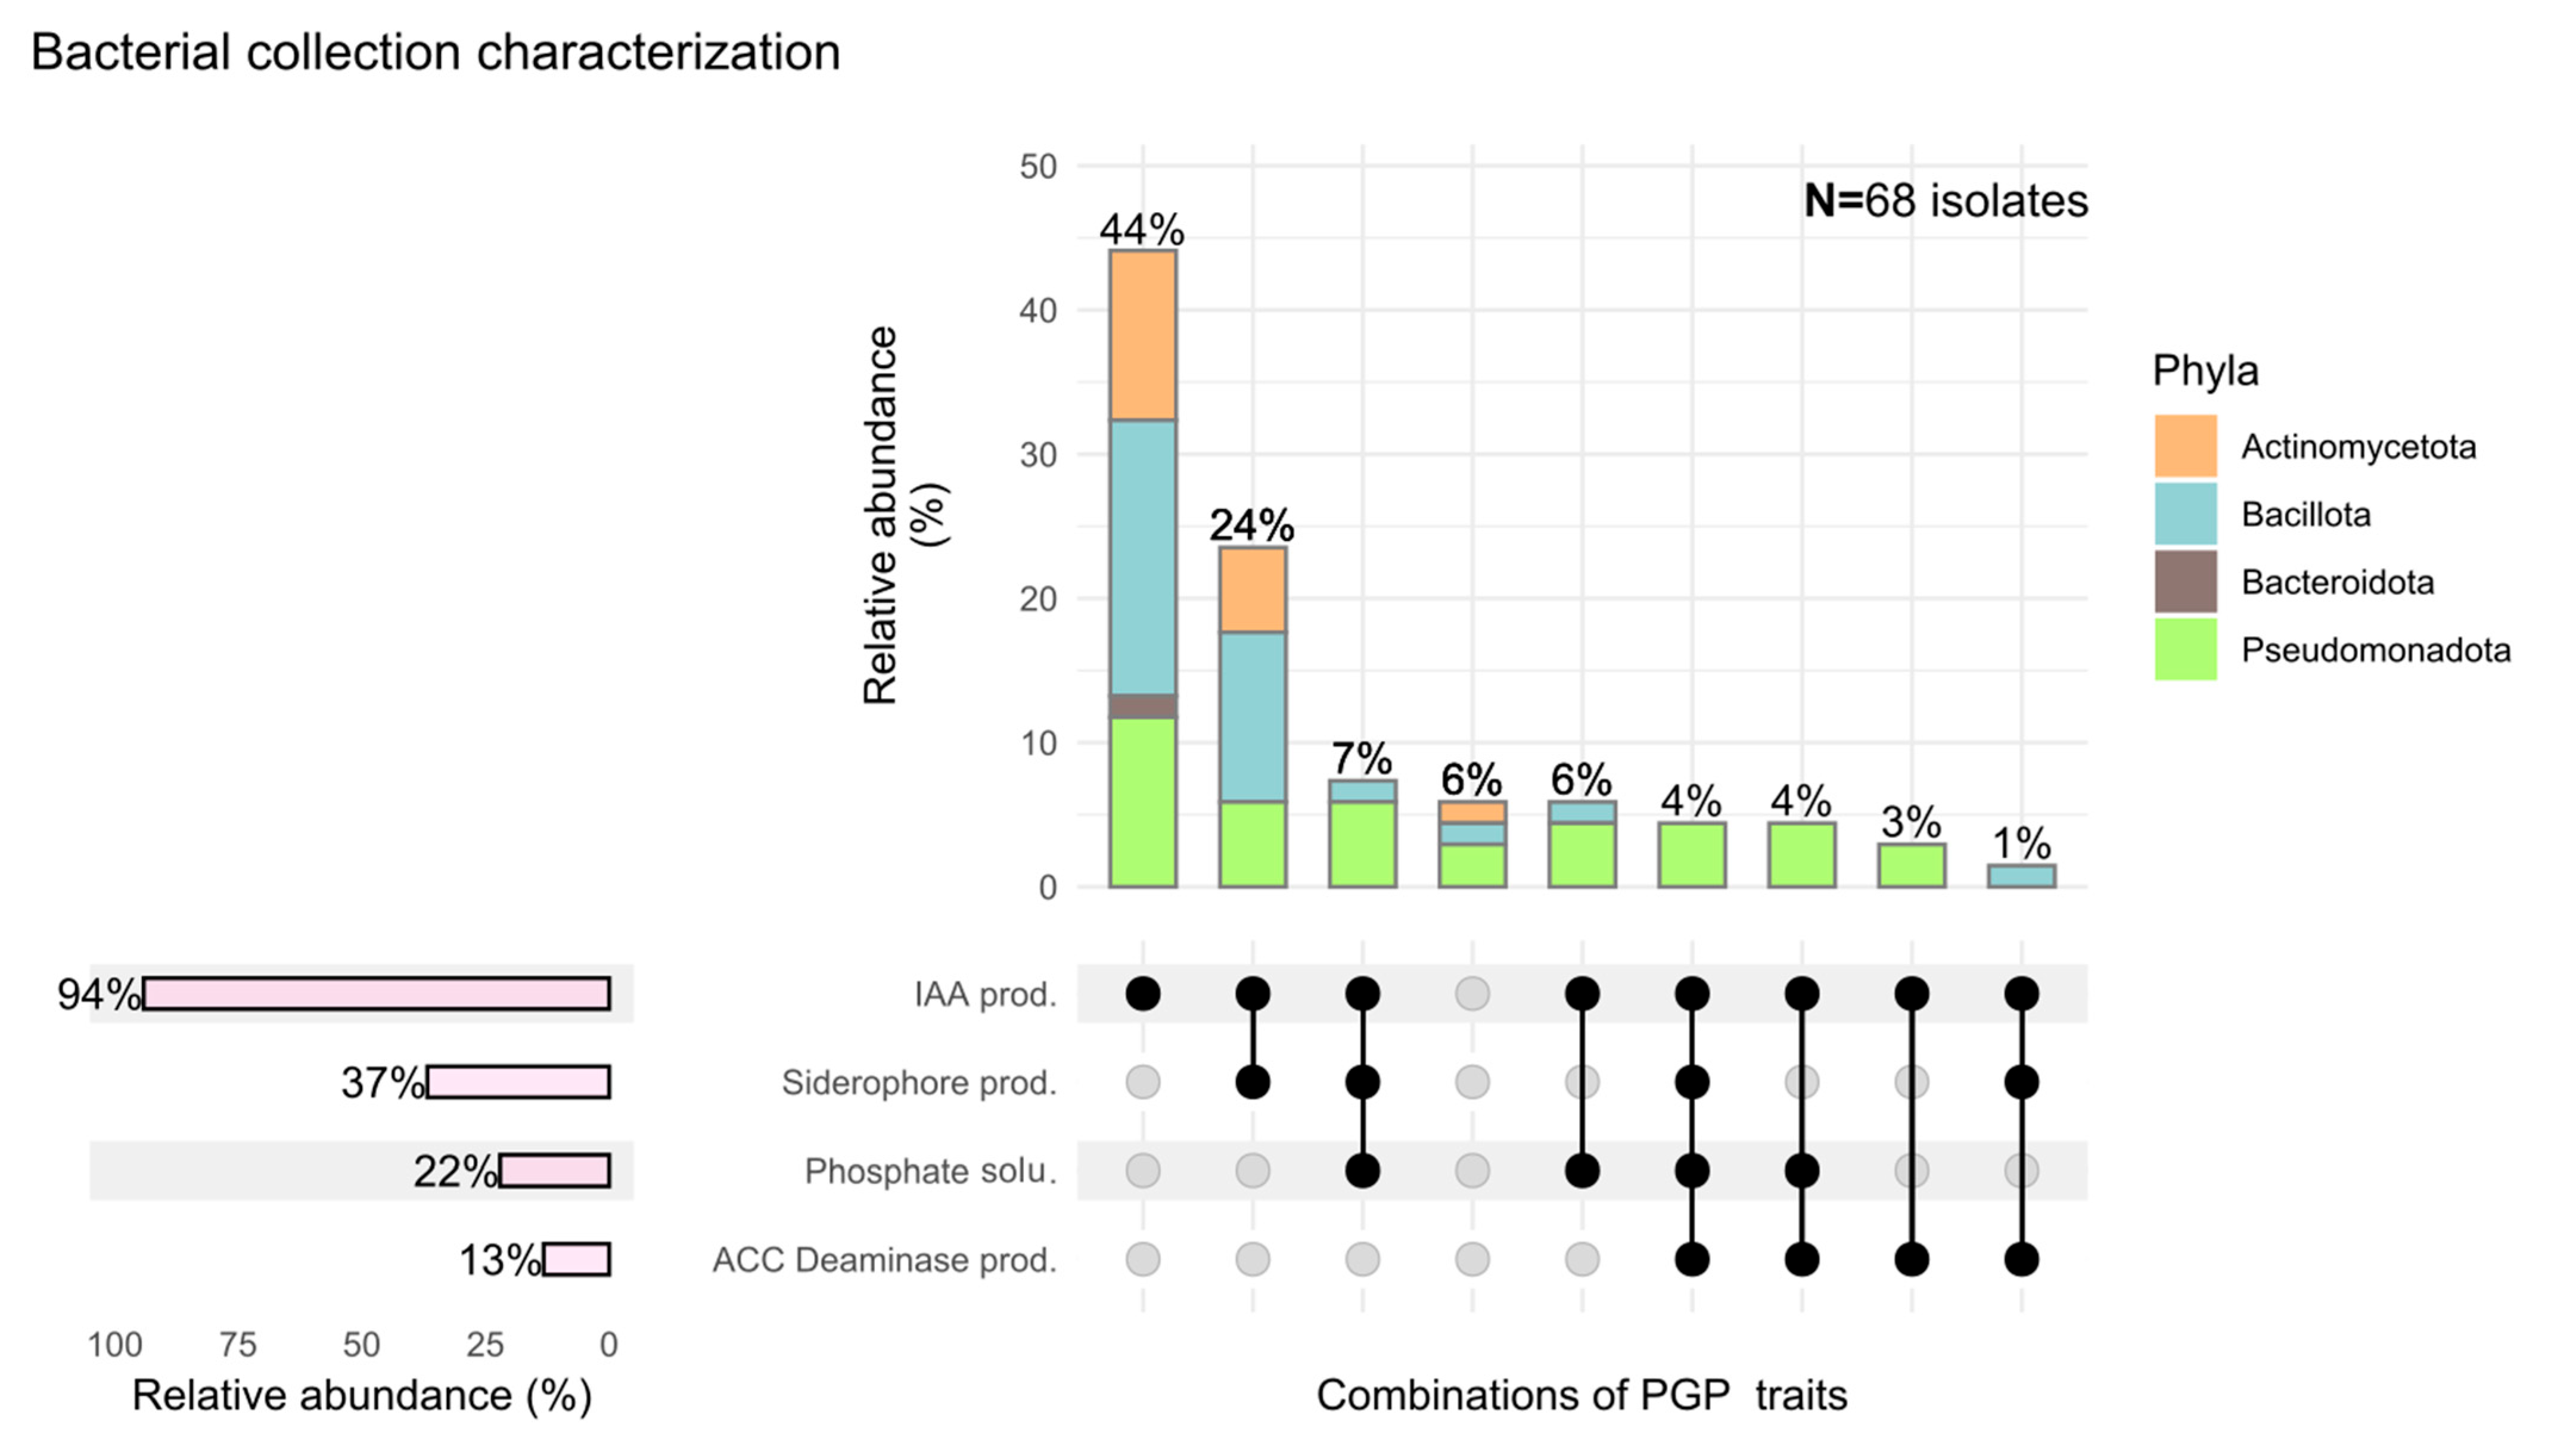
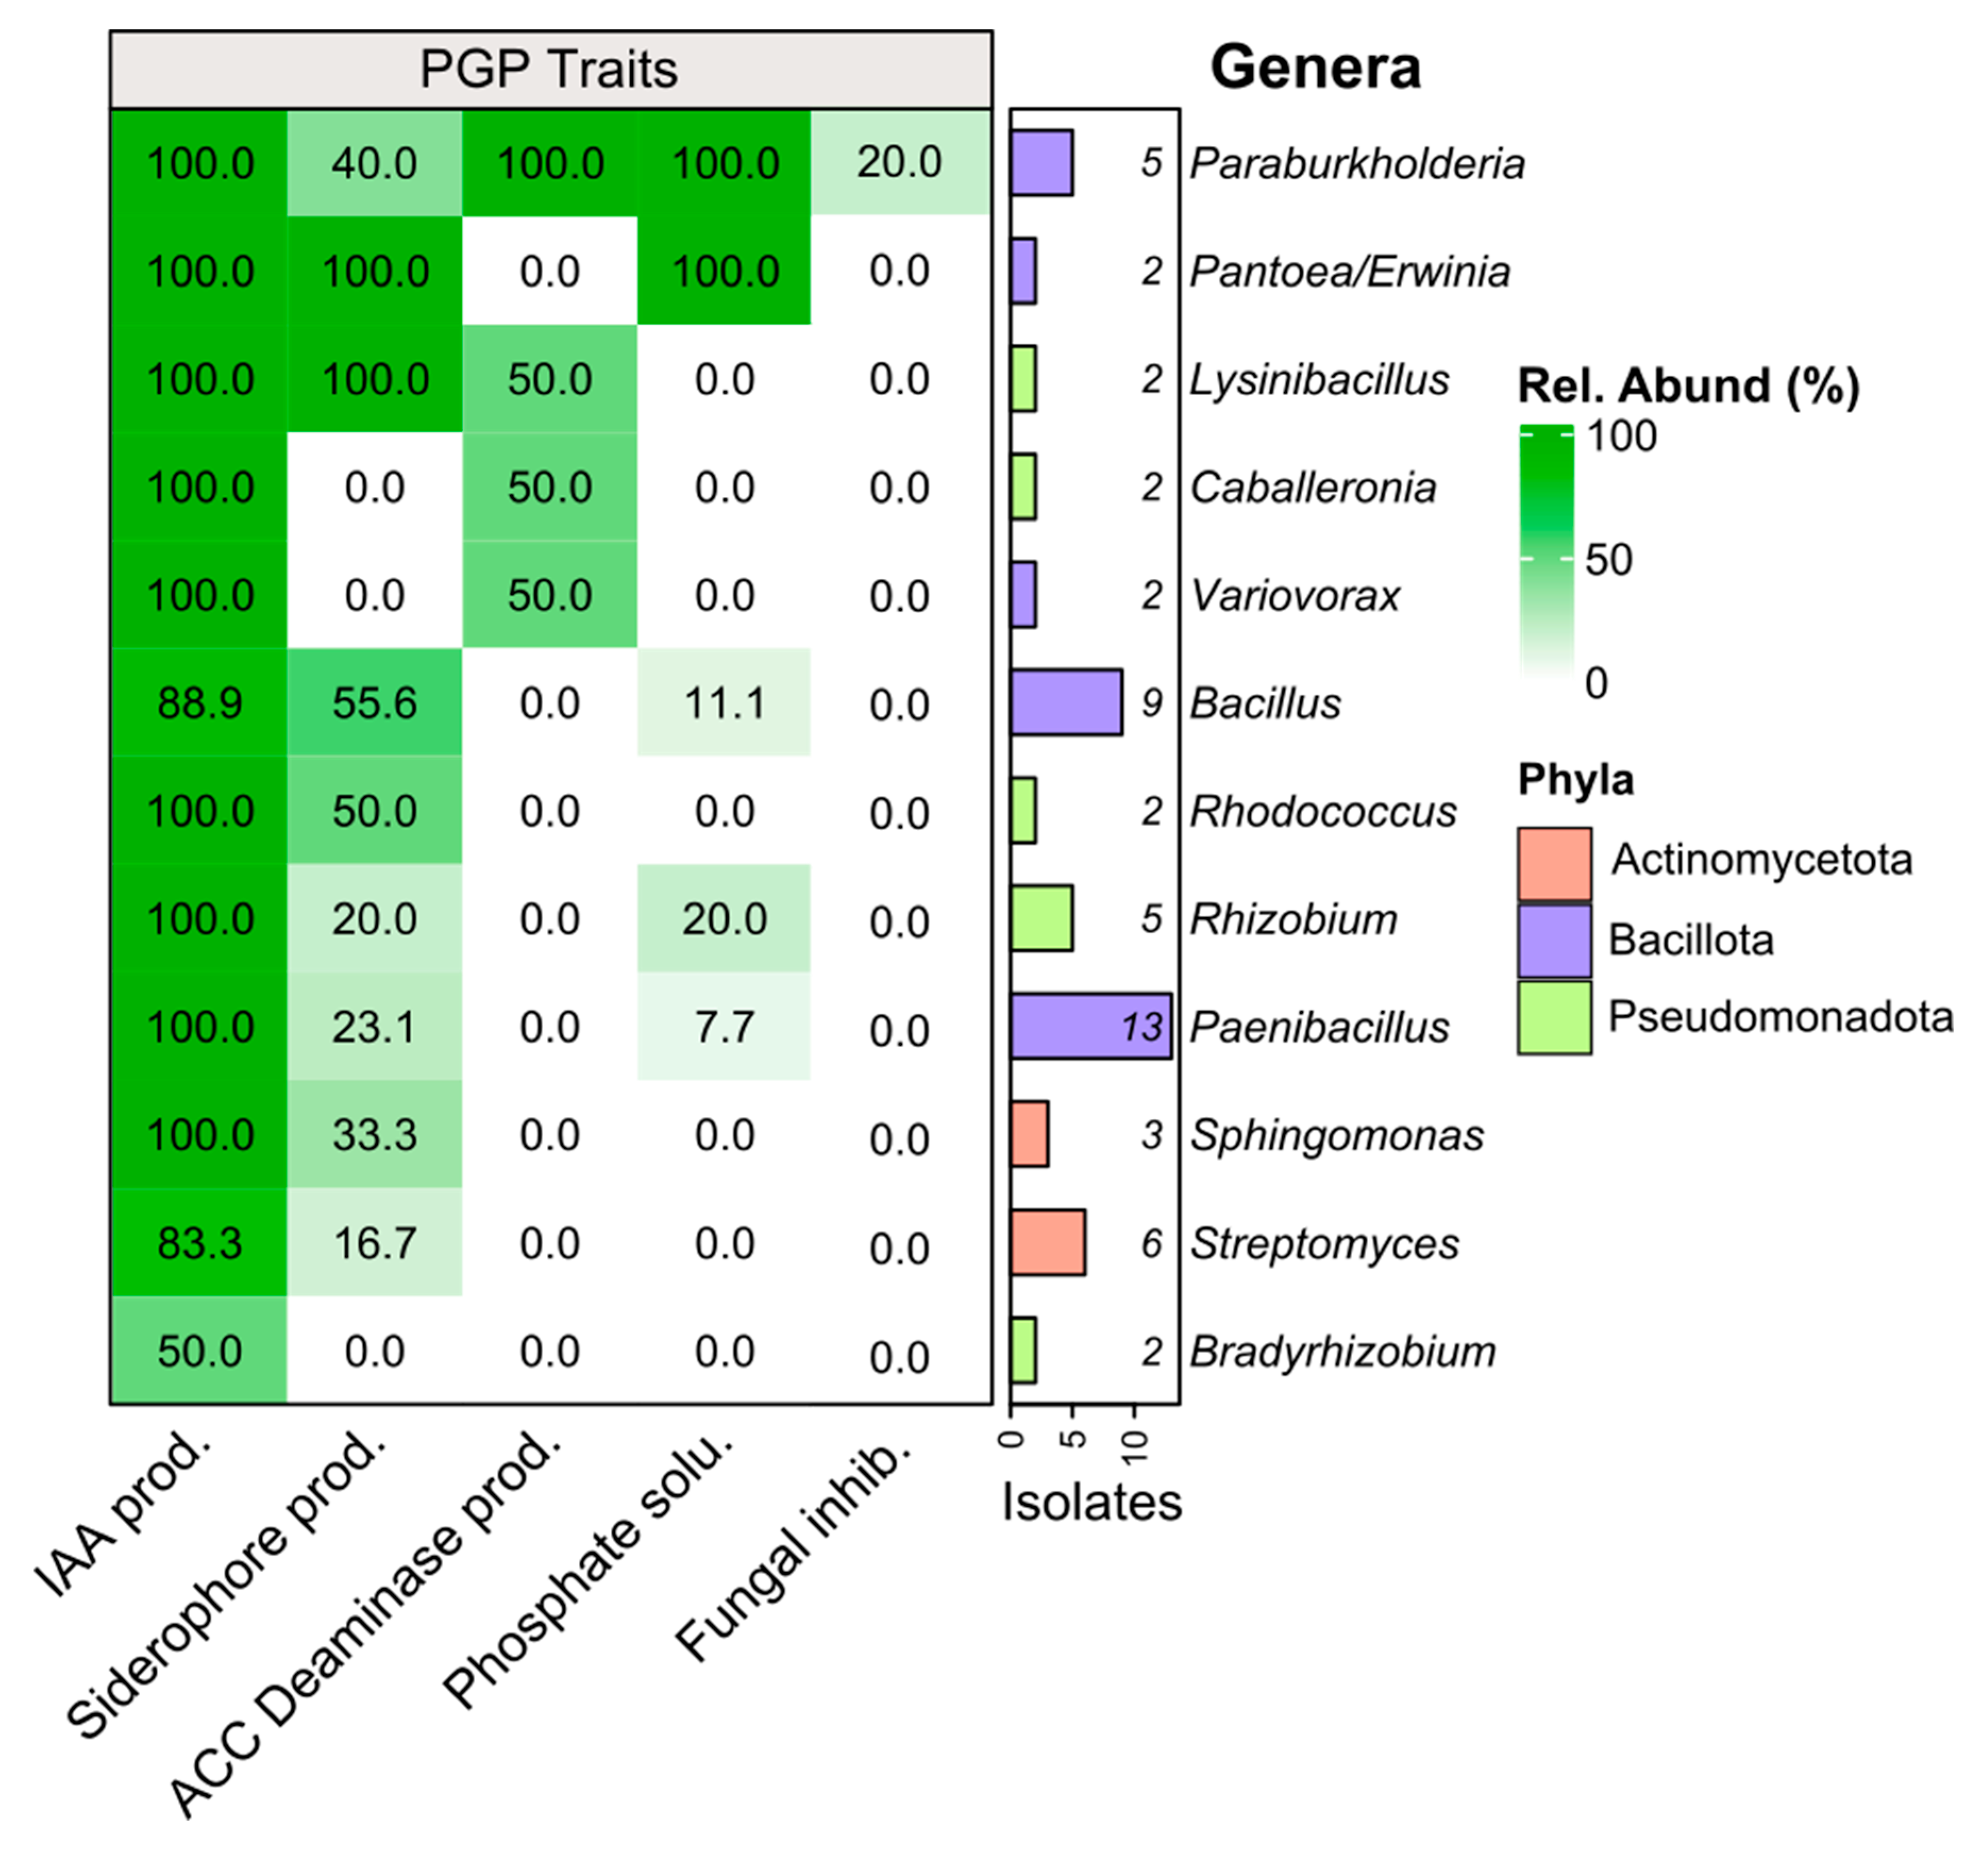
3.1. Diversity and PGP-Related Functions of Pinus pinea L. Endophytes

A total of 88 bacterial endophytic isolates were obtained from P. pinea roots. Based on molecular typing, 33 representative isolates displaying distinct BOX-PCR profiles were selected (Figure S1). An additional 35 representative isolates were chosen from the group without fingerprinting profile results, based on colony morphology characteristics. In total, 68 representative isolates were selected for further characterization (Table S1).
These wereaffiliated with four phyla (Figure 1): Pseudomonadota (29 isolates; 43% relative abundance), Bacillota (25; 37%), Actinomycetota (13; 19%), and Bacteroidota (1; 1%). Of the 22 bacterial families found, Paenibacillaceae (13 isolates; 19%), Bacillaceae (9; 13%), Burkholderiaceae (8;12%), Streptomycetaceae (7; 10%), and Rhizobiaceae (5; 7%) displayed the highest number of isolates. Eleven families only had one representative isolate. Of the 27 genera, Paenibacillus (13 isolates; 19%), Bacillus (9; 13%), Streptomyces (8; 11%), Paraburkholderia (5; 7%), and Rhizobium (5; 7%) showed the highest number of isolates. Fifteen genera showed only one representative isolate.
In all the bacterial collections, IAA was the most expressed trait (found in 94% of the isolates), while ACC deaminase production was the least expressed (found in 13%), as shown in Figure 2. Almost all isolates (64; 94%) displayed PGP traits, with only four isolates (6%) not showing any traits. These latter isolates belonged to the genera Pseudoxanthomonas (Pseudomonadota), Bradyrhizobium (Pseudomonadota), Streptomyces (Actinomycetota), and Bacillus (Bacillota). Among Pseudomonadota, 93% of the isolates (n = 27) tested positive for at least one PGP trait. Additionally, at least one Pseudomonadota isolate tested positive for each PGP trait evaluated. Furthermore, among the isolates of this phylum, almost all possible combinations of the assessed traits were observed, except IAA production paired with siderophore production and ACC deaminase production. For Bacillota, at least one isolate tested positive for each PGP trait, including ACC deaminase production, which was only found in this phylum and Pseudomonadota.
Actinomycetota isolates mainly expressed IAA production (n = 8; 62%) and IAA production paired with siderophore production (4; 31%). The isolates obtained from this phylum did not display any phosphate solubilization or ACC deaminase production.
Finally, Bacteroidota was represented by a single isolate that displayed only IAA production (Figure 2).
As for the 27 bacterial genera, 12 were represented by more than one isolate, as listed in Figure 3, with 15 genera only being represented by one isolate. Paenibacillus (13 isolates; 19%) and Bacillus (9; 13%) were the most prominent, followed by Streptomyces (6; 8%), Rhizobium (5; 7%), and Paraburkholderia (5; 7%). For the most abundant genera, Paenibacillus (n = 13) and Bacillus (n = 9) showed a similar profile of PGP traits, with most isolates testing positive for IAA production, followed by siderophore production. Paraburkholderia displayed the highest number of isolates (five) with all tested PGP traits (IAA production, ACC deaminase production, phosphate solubilization, and siderophore production), with one isolate (Paraburkholderia R.M2R9) also showing antifungal activity. In Bradyrhizobium, represented by two isolates, IAA production was the only trait expressed and only for one of its isolates. Most of the other genera present in Figure 3 displayed at least two PGP traits, with the most common pairing being IAA production and siderophore production. For the fungal activity, of the twenty tested strains (Table S2), only two isolates displayed fungal inhibition (Paraburkholderia R.M1R3 and Rahnella T.M2R17, both belonging to Pseudomonadota).

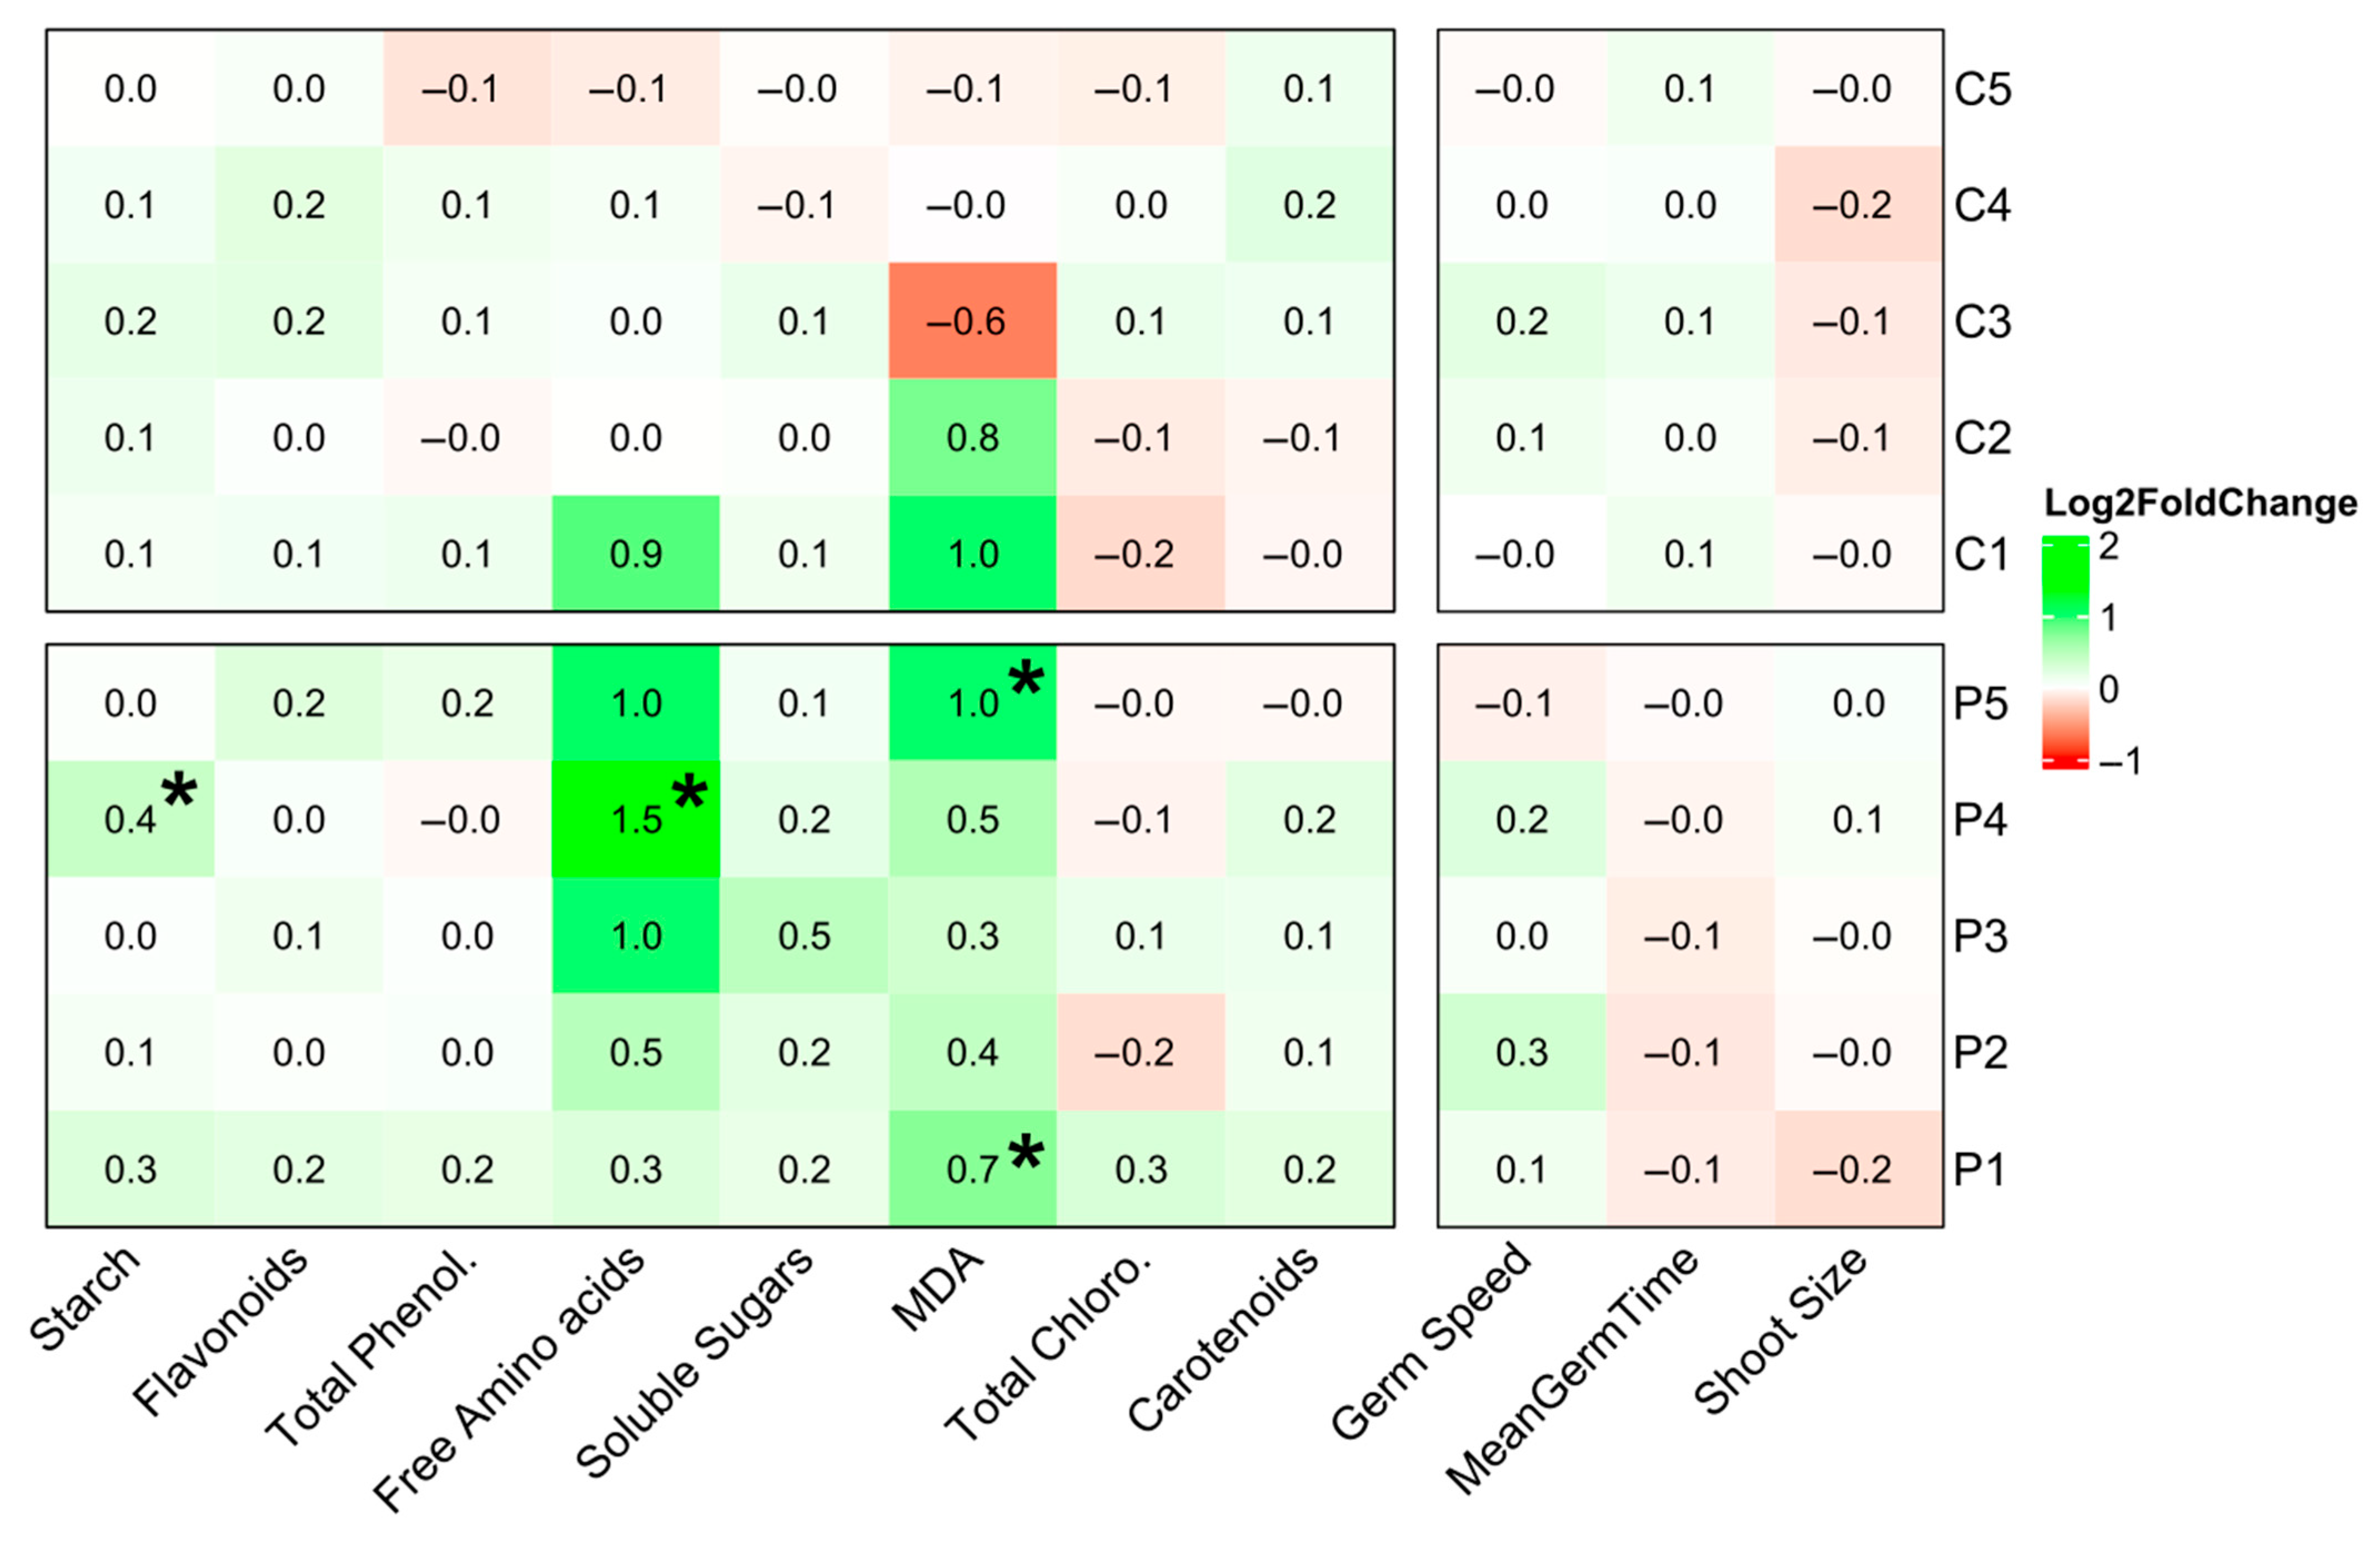
3.2. Pinus radiata D. Don Seeds Germination, Morphology, and Plant Quality After PGPB Inoculation

To evaluate the effect of plant PGPB on Pinus radiata, ten strains, individually and in consortia, were selected based on their plant growth-promoting profiles (Table 1) and tested. Their impact on P. radiata seed germination and plant quality in terms of biochemical profile was assessed.
The consortium that resulted in the highest seed germination percentage was C3 (Caballeronia R.M3R3, Rhodococcus T.M4R4, and Mesorhizobium R.M1R2; 89% germination), followed by P2 (Paenibacillus T.M5R4 and Bacillus R.M2R7; 83%) and P4 (Paenibacillus T.M5R4, Bacillus R.M2R7, Acinetobacter T.M2R22, and Paraburkholderia R.M1R3; 81%), compared to the control group (70.8%), as can be seen in Table 2. On the other hand, there were two consortia that displayed a lower germination percentage than the control group (P3, Paenibacillus T.M5R4, Bacillus R.M2R7, and Acinetobacter T.M2R22 with 69% germination and P5, Paenibacillus T.M5R4, Bacillus R.M2R7, Acinetobacter T.M2R22, Paraburkholderia R.M1R3, and Rahnella T.M2R17 with 68% germination). Total germination did not consistently increase with a higher number of PGP traits. For instance, consortia with three or more PGP traits, such as C4 (73% total germination) and C5 (75%) did not have a higher germination percentage (Table 2) compared to formulation C1 (one PGP trait) with 77% total germination, as well as P3 (69%; three PGP traits) and P5 (67%; three PGP traits) compared to P1 (71%; one PGP trait). Furthermore, the germination speed of seeds inoculated with formulations C3, C2, P4, P2, and P1 was positively impacted, increasing their logarithmic fold change by 0.1-0.3, despite no statistical significance (Figure 4). Among these formulations, seeds treated with consortia C3 showed a higher mean germination time (0.1 log2 fold change). In P1-P5 formulations, the seeds’ mean germination time decreased, indicating less time needed to germinate. A more detailed look at seedling emergence throughout the experiment can be seen in Figures S2–S4.
There were no significant differences in shoot and root size (fresh weight) between seedlings treated with bacterial formulations and the control group. Furthermore, only seedlings treated with the P4 consortium exhibited a more developed secondary root system (Figure S5), with 19 seedlings (40%) exhibiting this root structure compared to only 4 seedlings (8%) in the control group. As for biomass, all inoculated groups, except for P3, showed higher biomass values than the control, though the differences were not statistically significant. Plants inoculated with bacterial formulations, when compared to the control group, exhibited statistically significant differences in three metabolites: starch, malondialdehyde (MDA), and free amino acids (Figure 4). Of these compounds, plants corresponding to consortium P4 inoculation displayed a higher amount of starch (log fold change of 0.4) and free amino acids (log fold change of 1.5), while those inoculated with consortiumP5 and formulation C1 displayed higher MDA amounts (log fold change of 0.7 and 1.0) than the control. Differences for the remaining analyzed metabolites, although not statistically different, still displayed meaningful patterns that can help understand the impact of bacterial inoculation. The flavonoid and total phenolic levels in inoculated seedlings were similar to or slightly higher than the control (0.1–0.2 log fold change), except for consortium C5, which reduced the phenolic content (log fold change of −0.1). The soluble sugar log fold change values increased by 0.1 to 0.5 in seedlings treated with P1–P5 formulations, while those treated with C1–C5 showed values generally comparable to the control. Total chlorophylls were negatively impacted in half of the formulations, with log fold change values ranging from −0.1 to −0.2. Nonetheless, formulation P1 and consortia P3 and C3 positively affected the amounts of chlorophyll in seedlings (ranging from a 0.1 to 0.3 log fold change). Lastly, carotenoids were mostly positively increased in seedlings inoculated with most consortia, with log fold change values ranging from 0 to 0.2, excluding consortium C2, where carotenoids were impacted negatively by a log fold change of 0.01.

4. Discussion

Endophytes represent an important source of PGPB, with significant potential to enhance plant development [12]. While their usage has been extensively researched in agricultural crops [42,43], PGPB usage in forest species is still underexplored. The increased drive for plant production, combined with restrictions on the use of chemical fertilizers, makes biofertilizers a more fitting, eco-friendly alternative [20]. Endophytes exhibiting PGP traits may represent a viable component in such biofertilizer formulations. This study provides a comprehensive methodology, ranging from the isolation of endophytes from disease-resistant Pinus pinea L. and the assessment of their PGP traits to subsequent tests in an economically relevant, yet more susceptible, pine species (Pinus radiata D. Don).

4.1. Endophyte Diversity and Plant Growth-Promoting Traits

The bacterial collection obtained in this study was isolated from Pinus pinea, a species resistant to F. circinatum. The majority of isolated bacteria belonged to the phylum Pseudomonadota, followed by Bacillota (Figure 1). Among the isolated, the families Paenibacillaceae, Bacillaceae, and Burkholderiaceae were the most represented. However, it is well established that most bacteria (almost ninety-nine percent) cannot be cultured using standard laboratory media [44]. This limitation may have biased the results toward the phyla and families that are more readily culturable under the conditions applied in this study. Similar studies [45,46] have also found endophytic bacteria predominantly belonging to the phylum Bacillota in Pinus sylvestris and Pinus contorta, with the most abundant isolates belonging to the Paenibacillaceae and Bacillaceae families. The prevalence of these two families in culture-based studies may be related to the fact that they form endospores, which enable them to endure harsh conditions [47]. In a study where endophytes were isolated from the roots/needles/stems of four different pine species (Pinus densiflora, Pinus koraiensis, Pinus rigida, and Pinus thunbergii), there was also a prevalence of Bacillaceae isolates [48]. On the other hand, metagenomic studies of the Pinus flexibilis root endophytic community revealed that the family Oxalobacteraceae was predominant, followed by Comamonadaceae and Burkholderiaceae [49]. In Pinus massoniana, the most abundant bacterial families found were Xanthomonadaceae, Burkholderiaceae, and Rickettsiaceae [50]. In Pinus pinea’s rhizosphere, bacterial families such as Acidimicrobioaceae and Acidobacteriaceae were the predominant ones [11]. Metagenomic studies generally reveal greater diversity in bacterial communities compared to culture-dependent methods, which are limited to bacteria that can be isolated and grown on culture media [44]. This may explain the limited diversity of bacterial families in our endophyte collection. Moreover, as most of the identified families are commonly known to exhibit plant growth-promoting traits, it may help explain their prevalence compared to other non-plant growth-promoting bacteria (e.g., Pseudoxanthomonas).
IAA production was the most frequently observed trait in the studied bacterial collection (Figure 2). It is an important compound for plant cell division, cell expansion, and cell differentiation. It has been described that about 80% of rhizospheric bacteria are capable of synthesizing IAA [51]. Since most of the endophytic root bacteria derive from the rhizosphere [52], the high prevalence of isolates (94%) with IAA production in our study was expected. However, there was high variability in the amount of IAA produced within the bacterial collection, ranging from 4.10 μg/mL (the strain Bacillus T.M3R18) to 67.00 μg/mL (Rahnella T.M2R17). Despite this variance, the observed range of values is in line with other studies. For instance, in wheat, Triticum aestivum, inoculation with bacterial strains of Bacillus, Pseudomonas, and Staphylococcus genera (producing 0.6–8.22 μg/mL IAA) increased shoot length by up to 29% [53]. In rice (cultivar Naveen), bacterial strains of Bacillus (producing 37 μg/mL of IAA) also showed a positive correlation with root elongation [54]. For genera such as Bacillus or Rhizobium, the ideal IAA production temperature ranges from 30 to 37 °C [55,56,57], which is higher than the temperatures tested in this study. Other factors, such as pH, also affect IAA production [58] and were not accounted for in the tested conditions. Moreover, gene clusters for IAA production (iac) have been identified in many representative bacterial strains (e.g., Pseudomonas putida KT2440, Burkholderia sp. 383, and Rhodococcus sp. RHA1), which further corroborates the high number of positive results for this specific trait [59]. However, the method used in this study may be affected by cross-reactions with other indole derivatives present in the medium. Since the bacterial growth medium was supplemented with L-tryptophan, which can stimulate the production of various indole compounds, this could lead to a high number of false positives [60]. Techniques such as High-Performance Liquid Chromatography (HPLC) or Liquid Chromatography–Mass Spectrometry (LC-MS) are suitable alternatives to more accurately quantify IAA levels.
For the remaining traits, a qualitative approach was taken, possibly affecting the number of positive results for those traits. For example, for phosphate solubilization, bacterial strains can perform poorly on qualitative assays compared to more accurate quantitative colorimetric assays [61]. This might explain the difference in prevalence of IAA producers (94%) versus the isolates positive for other PGP traits (less than 40%).
The genus with the highest number of isolates was Paenibacillus (13 isolates), as seen in Figure 3, followed by Bacillus (9 isolates), Streptomyces (6 isolates), and Paraburkholderia (5 isolates). Almost all isolates from these genera displayed IAA production, in line with what was previously discussed. The low number of siderophore-producing isolates is in accordance with some PGPB screening studies. In groundnut (Arachis hypogaea L.), only 16% of the screened PGP bacteria displayed this trait [62]. The genus Bacillus has many members that are able to produce siderophores [63,64], which was also observed in this study, with the Bacillus genus displaying the highest number of isolates (five) with siderophore production. This trait can be important in biocontrol as siderophore production helps to outcompete pathogens for iron and inhibit their growth [65]; however, none of the bacteria that produced siderophores were able to inhibit Fusarium circinatum growth in this study.
Of all the genera tested, Paraburkholderia was the only genus with isolates that exhibited all the analyzed PGP traits (Figure 3). This might be correlated with Paraburkholderia’s close association with plants [66], which foments their PGP potential. Consequently, this genus has been consistently associated with many PGP traits, primarily phosphate solubilization [67] and IAA production [68], both of which were observed in this study. Furthermore, one Paraburkholderia isolate showed the inhibition of Fusarium circinatum growth. Previous studies have also found moderate inhibition of Fusarium species by Paraburkholderia strains through either the release of volatile organic compounds or siderophore production [69,70]. Since this strain did not produce siderophores, fungal inhibition might have occurred through volatile compound production.
While culture-based studies give a partial outlook on community diversity, they are essential for understanding the bacterial communities’ function and allowing for in vivo tests such as the ones performed in this study.

4.2. Bacterial Formulations Impact on Germination and Seedling Quality Profiles

To fill the knowledge gap regarding studies of PGPB and their impact on Pinus radiata germination, selected strains were tested individually or as consortia. Their impact on P. radiata seeds’ total germination percentage and seedlings’ physiological performance was assessed.
Of all the bacterial formulations tested, seeds inoculated with consortium C3 (Caballeronia R.M3R3, Rhodococcus T.M4R4, and Mesorhizobium R.M1R2) displayed a higher germination percentage compared to the control (Table 2). This consortium was composed of bacteria closely related to Caballeronia udeis, Rhodococcus erythropolis, and Mesorhizobium qingshengii (Table 1). Members of the genus Caballeronia have been found to improve plant growth in lodgepole pine [71] due to nitrogen fixation. We did not assess nitrogen fixation in this study; however, we assessed other PGP traits that can improve germination. Bacteria in this consortium (C3) tested positive for siderophore production, a relevant method of scavenging metal, which has been proven to improve germination in crops such as tomato, okra, and wheat [72,73]. Additionally, strains in this consortium also tested positive for phosphate solubilization, which is a trait that increases inorganic phosphate in the soil, making it more available for plant uptake [74]. In terms of metabolites, plants inoculated with consortia C3 showed a decrease in malondialdehyde, an indicator of oxidative stress [75], suggesting lower stress levels compared to control seedlings, which may have positively impacted total germination percentages.
Forty percent of plants inoculated with consortia P4 (Paenibacillus T.M5R4, Bacillus R.M2R7, Acinetobacter T.M2R22, and Paraburkholderia R.M1R3) showed secondary root development, which was not observed in other treatments (Figure S5). The bacteria present in consortia P4 exhibited the same PGP as C3; however, they also expressed ACC deaminase production. Excessive ethylene can hamper seed germination [76], and ACC deaminase reduces ethylene levels by breaking down ACC, an ethylene precursor [77]. By reducing ethylene levels around the root, it might potentiate the root growth, as seen in Figure S5. Additionally, these plants exhibited a significantly higher amount of free amino acids and starch (Figure 4). The increase in primary metabolites, such as amino acids, may explain this consortium’s positive effect on the total seed germination percentage, as they are essential in pine seed development [78]. The same applies to starch, an essential carbohydrate in pine development [79].
Lastly, there were two formulations that negatively impacted the seeds’ total germination percentage: P1 (Paenibacillus T.M5R4) and P5 (Paenibacillus T.M5R4, Bacillus R.M2R7, Acinetobacter T.M2R22, Paraburkholderia R.M1R3, and Rahnella T.M2R17). In this case, the strain in formulation P1 only displayed one PGP trait (IAA production), while in P5, all five PGP traits studied (IAA, siderophore, ACC deaminase production, antifungal activity, and phosphate solubilization) were present. This indicates that an increase in the number of PGP traits does not always lead to better germination or improved plant metabolite profiles. It is possible that the PGP traits were not expressed as expected while the bacteria were in the seed/soil, given the potential variations in environmental conditions or interaction dynamics between the bacteria and the plant. Nevertheless, in our study, several measures were taken to maximize the establishment of the added bacterial strains after sowing. First, to avoid interference from native bacteria, the soil was twice autoclaved. Second, to ensure that the bacteria would natively interact in field conditions [80], all the bacteria in this collection were isolated from the root of Pinus pinea. The fact that the bacteria were isolated from Pinus was also an important step for improving bacteria-plant affinity, since PGPB can be host-specific [81]. Nonetheless, a final assessment of strain prevalence in the soil/seedling at the end of the experiment should have been conducted to ensure that the inoculated strains remained viable. This should be included in future studies.
In summary, there were a few bacterial consortia (C1, C3, P3, and P4) that showed promising potential regarding seed germination and seedling quality, as shown by the increase in important primary metabolism compounds. Among those, two consortia stand out, consortia C3 and P4, whose seeds displayed a higher germination rate, while consortium P4’s seedlings also displayed higher free amino acids and starch, which may suggest a strategy for energy/resource allocation that may support better quality plants. On the other hand, P1 and P5’s seedlings displayed high levels of MDA, a key indicator of oxidative stress, concomitant with a negative impact on seed germination.
This work provides insight into the diversity and plant growth-promoting traits of endophytes isolated from the root of the more resilient Pinus pinea. Furthermore, it shows the impact of PGP bacteria, isolated from P. pinea, on improving Pinus radiata seed germination and plant quality. The resulting bacterial collection was mainly composed of Pseudomonadota and Bacillota, with the most abundant bacterial families being Paenibacillaceae, Bacillaceae, and Burkholderiaceae. For plant-growth promotion, a high prevalence of IAA production was found in most of the collections, with ACC deaminase production being the lowest prevalent trait. Isolates from the genus Paraburkholderia tested positive for the highest number of plant growth-promoting traits, including Fusarium circinatum inhibition. The subsequent in vivo tests in Pinus radiata seeds showed two bacterial consortia—C3 (Caballeronia R.M3R3, Rhodococcus T.M4R4, and Mesorhizobium R.M1R2) effective on seed germination and P4 (Paenibacillus T.M5R4, Bacillus R.M2R7, Acinetobacter T.M2R22, and Paraburkholderia R.M1R3)—with a promising impact on both seed germination and improved seedling quality, with a higher starch level and free amino acid content, which are both important for plant development. Nonetheless, two formulations negatively impacted seed germination—P1 (Paenibacillus T.M5R4) and P5 (Paenibacillus T.M5R4, Bacillus R.M2R7, Acinetobacter T.M2R22, Paraburkholderia R.M1R3, and Rahnella T.M2R17)—reinforcing that formulations can be very specific and that more plant growth-promoting traits do not always increase plant development.

5. Conclusions

This study represents an initial step towards the practical integration of plant growth-promoting bacteria (PGPB) into forest management strategies. By implementing a comprehensive methodology that involved the isolation and characterization of endophytes, followed by testing their effectiveness in in vivo experiments, our experiment shows the potential of leveraging natural microbial diversity to enhance plant quality traits at the nursery stage. Among the tested isolates, two bacterial formulations emerged as promising bioinoculants for Pinus radiata. Our findings highlight that forest species host functionally relevant PGPB with cross-species applicability, offering an eco-friendly strategy to support early plant development. Future research should assess the role of these bioinoculants in promoting disease resistance, as well as validate their performance under field and operational nursery conditions.

Supplementary Materials

The following supporting information can be downloaded at: https://www.mdpi.com/article/10.3390/f16071161/s1, Table S1. The characterization of endophytic bacteria isolated from the root of Pinus pinea and growth-promoting traits; Table S2. A table of the bacteria selected for in vivo trials containing the taxonomic information on the isolates and the respective inhibition percentage values against F. circinatum; Table S3. The morphological traits of seedlings inoculated with consortia and controls (no consortia). No asterisks are included since there were no significant differences for each consortium vs. controls (p-value < 0.05 and N = 18). Mean: average; SD: standard deviation; Figure S1. A dendrogram of the BOX-PCR fingerprinting patterns of 3568 bacterial endophytes isolated from Pinus pinea roots. The analysis was performed using GelCompar II software (Applied Maths, Belgium), employing the Dice similarity coefficient and UPGMA clustering method with a 1% band-position tolerance. The isolate codes indicate the isolation culture media (R-R2A; T-TSA), the tree (M1, M2, etc.), sample type (R: root), followed by the number of the isolate. Figure S2. Seedling emergence percentage of Pinus radiata across bacterial formulations P1 to P5 and respective controls. Figure S3. Seedling emergence percentage of Pinus radiata across bacterial formulations C1 to C5 and respective controls. Figure S4. (a, b) Kaplan–Meier curves depicting the cumulative probability of non-emergence over time (days) for seedlings (n = 48) under different bacterial formulation applications (P1-P5 in a; C1-C5 in b) and a control group. (c, d) The forest plots of the Hazard Ratios (HRs) from the Cox Proportional Hazards models, showing the effect of different bacterial formulation applications (P1-P5 in c; C1-C5 in d) on emergence rates relative to controls. Squares represent HRs, and horizontal lines denote 95% Confidence Intervals. Asterisks (*) indicate statistical significance (p < 0.05). Below each plot are the total number of emergence events, the global p-value (Log-Rank) for the model, AIC, and Concordance Index. Figure S5. Representative photos of root structure for control treatment (a) and P4 consortium (b). Table S4. Summary of germination metrics for seeds pretreated with bacterial formulation. Formulations correspond to different bacterial formulations (C1–C5, P1–P5) applied prior to sowing; Control indicates untreated seeds. Mean germination time and germination speed were calculated using seedling emergence data as a proxy for germination.

Author Contributions

F.L.: Writing—original draft, Visualization, Software, Methodology, Investigation, Data curation. M.A.: Writing—review and editing, Methodology, Data curation. G.P.: Writing—review and editing, Supervision, Funding acquisition, Data curation, Conceptualization. I.H.: Writing—review and editing, Supervision, Funding acquisition, Data curation, Conceptualization. All authors have read and agreed to the published version of the manuscript.

Funding

This work is funded by national funds through FCT – Fundação para a Ciência e a Tecnologia I.P., under the project/grant UID/50006 (Centro de Estudos do Ambiente e Mar, CESAM) + LA/P/0094/2020, the Centre for Functional Ecology [grant number UIDB/04004/2025], and the Associate Laboratory TERRA [grant number LA/P/0092/2020]; PhD (grant number 2021.06400.BD; https://doi.org/10.54499/2021.06400.BD). Marta Alves is supported by national funds through FCT under the Scientific Employment Stimulus—Individual Call—(CEECIND/2022.07790).

Data Availability Statement

The datasets generated during and/or analyzed during the current study are available in the GenBank repository (the respective accession numbers can be found in Table S1).

Conflicts of Interest

The authors declare no conflicts of interest.

Abbreviations

The following abbreviations are used in this manuscript:
PGPPlant growth-promoting
PGPBPlant growth-promoting bacteria
IAAIndole-3-acetic acid
ACC1-aminocyclopropane-1-carboxylate
TSBTryptic soy broth
TSATryptic soy agar
R2AReasoner’s 2A agar
PDAPotato dextrose agar
CASChrome Azurol S
NBRIP National Botanical Research Institute’s phosphate
ODOptical density
MDA Malonaldehyde

References

  1. Mead, D.J. Sustainable Management of Pinus Radiata Plantations.; FAO Forestry Paper No. 170; FAO: Rome, Italy, 2013. [Google Scholar]
  2. Ayrilmis, N.; Buyuksari, U.; Avci, E.; Koc, E. Utilization of Pine (Pinus pinea L.) Cone in Manufacture of Wood Based Composite. For. Ecol. Manage. 2009, 259, 65–70. [Google Scholar] [CrossRef]
  3. Pignatti, G.; Facciotto, G.; Incollu, G.; Maltoni, S.; Marongiu, M.; Sperandio, G.; Verani, S.; Puxeddu, M. Sustainable Forest Management in Radiata Pine Plantations: A Case Study in Sardinia (Italy). Environ. Sci. Proc. 2020, 3, 51. [Google Scholar] [CrossRef]
  4. Mosquera-Losada, M.R.; Rigueiro-Rodríguez, A.; Ferreiro-Domínguez, N. Effect of Liming and Organic and Inorganic Fertilization on Soil Carbon Sequestered in Macro-and Microaggregates in a 17-Year Old Pinus Radiata Silvopastoral System. J. Environ. Manage. 2015, 150, 28–38. [Google Scholar] [CrossRef] [PubMed]
  5. Balla, A.; Silini, A.; Cherif-Silini, H.; Bouket, A.C.; Moser, W.K.; Nowakowska, J.A.; Oszako, T.; Benia, F.; Belbahri, L. The Threat of Pests and Pathogens and the Potential for Biological Control in Forest Ecosystems. Forests 2021, 12, 1579. [Google Scholar] [CrossRef]
  6. Amaral, J.; Correia, B.; António, C.; Rodrigues, A.M.; Gómez-Cadenas, A.; Valledor, L.; Hancock, R.D.; Alves, A.; Pinto, G. Pinus Susceptibility to Pitch Canker Triggers Specific Physiological Responses in Symptomatic Plants: An Integrated Approach. Front. Plant Sci. 2019, 10, 509. [Google Scholar] [CrossRef]
  7. Monteiro, P.; Valledor, L.; Osorio, S.; Camisón, Á.; Vallarino, J.G.; Gómez-Cadenas, A.; Díez, J.J.; Pinto, G. Physiological, Metabolic and Hormonal Responses of Two Pinus Spp. with Contrasting Susceptibility to Brown-Spot Needle Blight Disease. Tree Physiol. 2024, 44, tpae003. [Google Scholar] [CrossRef]
  8. Pimentel, C.S.; Gonçalves, E.V.; Firmino, P.N.; Calvão, T.; Fonseca, L.; Abrantes, I.; Correia, O.; Máguas, C. Differences in Constitutive and Inducible Defences in Pine Species Determining Susceptibility to Pinewood Nematode. Plant Pathol. 2017, 66, 131–139. [Google Scholar] [CrossRef]
  9. Zamora-Ballesteros, C.; Pinto, G.; Amaral, J.; Valledor, L.; Alves, A.; Diez, J.J.; Martín-García, J. Dual Rna-Sequencing Analysis of Resistant (Pinus pinea) and Susceptible (Pinus radiata) Hosts during Fusarium Circinatum Challenge. Int. J. Mol. Sci. 2021, 22, 5231. [Google Scholar] [CrossRef]
  10. Feng, Z.; Liang, Q.; Yao, Q.; Bai, Y.; Zhu, H. The Role of the Rhizobiome Recruited by Root Exudates in Plant Disease Resistance: Current Status and Future Directions. Environ. Microbiome 2024, 19, 91. [Google Scholar] [CrossRef]
  11. Leitão, F.; Pinto, G.; Amaral, J.; Monteiro, P.; Henriques, I. New Insights into the Role of Constitutive Bacterial Rhizobiome and Phenolic Compounds in Two Pinus Spp. with Contrasting Susceptibility to Pine Pitch Canker. Tree Physiol. 2021, 42, 600–615. [Google Scholar] [CrossRef]
  12. Santoyo, G.; Moreno-Hagelsieb, G.; del Carmen Orozco-Mosqueda, M.; Glick, B.R. Plant Growth-Promoting Bacterial Endophytes. Microbiol. Res. 2016, 183, 92–99. [Google Scholar] [CrossRef] [PubMed]
  13. Pavlo, A.; Leonid, O.; Iryna, Z.; Natalia, K.; Maria, P.A. Endophytic Bacteria Enhancing Growth and Disease Resistance of Potato (Solanum tuberosum L.). Biol. Control 2011, 56, 43–49. [Google Scholar] [CrossRef]
  14. Glandorf, D.C.M.; Verheggen, P.; Jansen, T.; Jorritsma, J.-W.; Smit, E.; Leeflang, P.; Wernars, K.; Thomashow, L.S.; Laureijs, E.; Thomas-Oates, J.E.; et al. Effect of Genetically Modified Pseudomonas Putida WCS358r on the Fungal Rhizosphere Microflora of Field-Grown Wheat. Appl. Environ. Microbiol. 2001, 67, 3371–3378. [Google Scholar] [CrossRef] [PubMed]
  15. Abro, M.A.; Sun, X.; Li, X.; Jatoi, G.H.; Guo, L.-D. Biocontrol Potential of Fungal Endophytes against Fusarium oxysporum f. Sp. Cucumerinum Causing Wilt in Cucumber. Plant Pathol. J. 2019, 35, 598. [Google Scholar] [CrossRef]
  16. Sarma, B.K.; Yadav, S.K.; Singh, S.; Singh, H.B. Microbial Consortium-Mediated Plant Defense against Phytopathogens: Readdressing for Enhancing Efficacy. Soil Biol. Biochem. 2015, 87, 25–33. [Google Scholar] [CrossRef]
  17. Kondo, Y.R.; da Cruz, S.P.; Chanway, C.; Kaschuk, G. Inoculation with Azospirillum brasilense or Bacillus Spp. Improves Root Growth and Nutritional Quality of Araucaria (Araucaria angustifolia) Seedlings. For. Ecol. Manage. 2024, 568, 122092. [Google Scholar] [CrossRef]
  18. Bahramov, R.; Mamatyusupov, A.; Tokhtaboeva, F.; Khomidov, J.; Yuldashev, H. A Comprehensive Application of Fertilizers for Growing Plantations in Forest Nurseries: A Brief Review. IOP Conf. Ser. Earth Environ. Sci. 2020, 614, 12117. [Google Scholar] [CrossRef]
  19. Jung, T.; Orlikowski, L.; Henricot, B.; Abad-Campos, P.; Aday, A.G.; Aguín Casal, O.; Bakonyi, J.; Cacciola, S.O.; Cech, T.; Chavarriaga, D.; et al. Widespread Phytophthora Infestations in European Nurseries Put Forest, Semi-Natural and Horticultural Ecosystems at High Risk of Phytophthora Diseases. For. Pathol. 2016, 46, 134–163. [Google Scholar] [CrossRef]
  20. Boix-Fayos, C.; de Vente, J. Challenges and Potential Pathways towards Sustainable Agriculture within the European Green Deal. Agric. Syst. 2023, 207, 103634. [Google Scholar] [CrossRef]
  21. Hallmann, J.; Quadt-Hallmann, A.; Mahaffee, W.F.; Kloepper, J.W. Bacterial Endophytes in Agricultural Crops. Can. J. Microbiol. 1997, 43, 895–914. [Google Scholar] [CrossRef]
  22. Ali, S.; Charles, T.C.; Glick, B.R. Delay of Flower Senescence by Bacterial Endophytes Expressing 1-Aminocyclopropane-1-Carboxylate Deaminase. J. Appl. Microbiol. 2012, 113, 1139–1144. [Google Scholar] [CrossRef] [PubMed]
  23. Khan, M.S.; Gao, J.; Chen, X.; Zhang, M.; Yang, F.; Du, Y.; Munir, I.; Xue, J.; Zhang, X. Isolation and Characterization of Plant Growth-Promoting Endophytic Bacteria Paenibacillus polymyxa SK1 from Lilium lancifolium. Biomed Res. Int. 2020, 2020, 8650957. [Google Scholar] [CrossRef] [PubMed]
  24. Proença, D.N.; Francisco, R.; Kublik, S.; Schöler, A.; Vestergaard, G.; Schloter, M.; Morais, P. V The Microbiome of Endophytic, Wood Colonizing Bacteria from Pine Trees as Affected by Pine Wilt Disease. Sci. Rep. 2017, 7, 4205. [Google Scholar] [CrossRef]
  25. Mesanza, N.; Iturritxa, E.; Patten, C.L. Native Rhizobacteria as Biocontrol Agents of Heterobasidion annosum Ss and Armillaria mellea Infection of Pinus Radiata. Biol. Control 2016, 101, 8–16. [Google Scholar] [CrossRef]
  26. Iturritxa, E.; Trask, T.; Mesanza, N.; Raposo, R.; Elvira-Recuenco, M.; Patten, C.L. Biocontrol of Fusarium circinatum Infection of Young Pinus radiata Trees. Forests 2017, 8, 32. [Google Scholar] [CrossRef]
  27. Shen, S.Y.; Fulthorpe, R. Seasonal Variation of Bacterial Endophytes in Urban Trees. Front. Microbiol. 2015, 6, 427. [Google Scholar] [CrossRef]
  28. Versalovic, J. Genomic Fingerprinting of Bacteria Using Repetitive Sequence-Based Polymerase Chain Reaction. Methods Mol. Cell Biol. 1994, 5, 25–40. [Google Scholar] [CrossRef]
  29. Lane, D.J. 16S/23S RRNA Sequencing. In Nucleic acid Techniques in Bacterial Systematics; Stackebrandt, E., Goodfellow, M., Eds.; John Wiley and sons: New York, NY, USA, 1991; pp. 115–175. [Google Scholar]
  30. Altschul, S.F.; Madden, T.L.; Schäffer, A.A.; Zhang, J.; Zhang, Z.; Miller, W.; Lipman, D.J. Gapped BLAST and PSI-BLAST: A New Generation of Protein Database Search Programs. Nucleic Acids Res. 1997, 25, 3389–3402. [Google Scholar] [CrossRef]
  31. Kim, O.; Cho, Y.; Lee, K.; Yoon, S.; Kim, M.; Na, H.; Park, S.; Jeon, Y.S.; Lee, J.; Yi, H.; et al. Introducing EzTaxon-e: A Prokaryotic 16S RRNA Gene Sequence Database with Phylotypes That Represent Uncultured Species. Int. J. Syst. Evol. Microbiol. 2012, 62, 716–721. [Google Scholar] [CrossRef]
  32. Fidalgo, C.; Henriques, I.; Rocha, J.; Tacão, M.; Alves, A. Culturable Endophytic Bacteria from the Salt Marsh Plant Halimione portulacoides: Phylogenetic Diversity, Functional Characterization, and Influence of Metal (Loid) Contamination. Environ. Sci. Pollut. Res. 2016, 23, 10200–10214. [Google Scholar] [CrossRef]
  33. Dworkin, M.; Foster, J. Experiments with Some Microorganisms Which Utilize Ethane and Hydrogen. J. Bacteriol. 1958, 75, 592–603. [Google Scholar] [CrossRef] [PubMed]
  34. Gordon, S.A.; Weber, R.P. Colorimetric Estimation of Indolacetic Acid. Plant Physiol. 1951, 26, 192–195. [Google Scholar] [CrossRef] [PubMed]
  35. Nautiyal, C.S. An Efficient Microbiological Growth Medium for Screening Phosphate Solubilizing Microorganisms. FEMS Microbiol. Lett. 1999, 170, 265–270. [Google Scholar] [CrossRef] [PubMed]
  36. Pérez-Miranda, S.; Cabirol, N.; George-Téllez, R.; Zamudio-Rivera, L.S.; Fernández, F.J. O-CAS, a Fast and Universal Method for Siderophore Detection. J. Microbiol. Methods 2007, 70, 127–131. [Google Scholar] [CrossRef]
  37. Anith, K.N.; Nysanth, N.S.; Natarajan, C. Novel and Rapid Agar Plate Methods for In Vitro Assessment of Bacterial Biocontrol Isolates’ Antagonism Against Multiple Fungal Phytopathogens. Lett. Appl. Microbiol. 2021, 73, 229–236. [Google Scholar] [CrossRef]
  38. Martínez-Álvarez, P.; Alves-Santos, F.M.; Diez, J.J. In Vitro and In Vivo Interactions Between Trichoderma viride and Fusarium circinatum. Silva Fenn. 2012, 46, 303–316. [Google Scholar] [CrossRef]
  39. Silva-Castro, I.; Diez, J.J.; Martín-Ramos, P.; Pinto, G.; Alves, A.; Martín-Gil, J.; Martín-García, J. Application of Bioactive Coatings Based on Chitosan and Propolis for Pinus Spp. Protection against Fusarium circinatum. Forests 2018, 9, 685. [Google Scholar] [CrossRef]
  40. López-Hidalgo, C.; Meijón, M.; Lamelas, L.; Valledor, L. The Rainbow Protocol: A Sequential Method for Quantifying Pigments, Sugars, Free Amino Acids, Phenolics, Flavonoids and MDA from a Small Amount of Sample. Plant Cell Environ. 2021, 44, 1977–1986. [Google Scholar] [CrossRef]
  41. Heath, R.L.; Packer, L. Photoperoxidation in Isolated Chloroplasts: I. Kinetics and Stoichiometry of Fatty Acid Peroxidation. Arch. Biochem. Biophys. 1968, 125, 189–198. [Google Scholar] [CrossRef]
  42. Ramakrishna, W.; Yadav, R.; Li, K. Plant Growth Promoting Bacteria in Agriculture: Two Sides of a Coin. Appl. Soil Ecol. 2019, 138, 10–18. [Google Scholar] [CrossRef]
  43. Reed, L.; Glick, B.R. The Recent Use of Plant-Growth-Promoting Bacteria to Promote the Growth of Agricultural Food Crops. Agriculture 2023, 13, 1089. [Google Scholar] [CrossRef]
  44. Stewart, E.J. Growing Unculturable Bacteria. J. Bacteriol. 2012, 194, 4151–4160. [Google Scholar] [CrossRef] [PubMed]
  45. Izumi, H.; Anderson, I.C.; Killham, K.; Moore, E.R.B. Diversity of Predominant Endophytic Bacteria in European Deciduous and Coniferous Trees. Can. J. Microbiol. 2008, 54, 173–179. [Google Scholar] [CrossRef] [PubMed]
  46. Bal, A.; Anand, R.; Berge, O.; Chanway, C.P. Isolation and Identification of Diazotrophic Bacteria from Internal Tissues of Pinus contorta and Thuja plicata. Can. J. For. Res. 2012, 42, 807–813. [Google Scholar] [CrossRef]
  47. Harirchi, S.; Sar, T.; Ramezani, M.; Aliyu, H.; Etemadifar, Z.; Nojoumi, S.A.; Yazdian, F.; Awasthi, M.K.; Taherzadeh, M.J. Bacillales: From Taxonomy to Biotechnological and Industrial Perspectives. Microorganisms 2022, 10, 2355. [Google Scholar] [CrossRef]
  48. Liu, Y.; Ponpandian, L.N.; Kim, H.; Jeon, J.; Hwang, B.S.; Lee, S.K.; Park, S.-C.; Bae, H. Distribution and Diversity of Bacterial Endophytes from Four Pinus Species and Their Efficacy as Biocontrol Agents for Devastating Pine Wood Nematodes. Sci. Rep. 2019, 9, 12461. [Google Scholar] [CrossRef]
  49. Carper, D.L.; Carrell, A.A.; Kueppers, L.M.; Frank, A.C. Bacterial Endophyte Communities in Pinus Flexilis Are Structured by Host Age, Tissue Type, and Environmental Factors. Plant Soil 2018, 428, 335–352. [Google Scholar] [CrossRef]
  50. Zhang, W.; Wang, X.; Li, Y.; Liu, Z.; Li, D.; Wen, X.; Feng, Y.; Zhang, X. Pinewood Nematode Alters the Endophytic and Rhizospheric Microbial Communities of Pinus massoniana. Microb. Ecol. 2021, 81, 807–817. [Google Scholar] [CrossRef]
  51. Khalid, A.; Tahir, S.; Arshad, M.; Zahir, Z.A. Relative Efficiency of Rhizobacteria for Auxin Biosynthesis in Rhizosphere and Non-Rhizosphere Soils. Soil Res. 2004, 42, 921–926. [Google Scholar] [CrossRef]
  52. Edwards, J.; Johnson, C.; Santos-Medellín, C.; Lurie, E.; Podishetty, N.K.; Bhatnagar, S.; Eisen, J.A.; Sundaresan, V.; Jeffery, L.D. Structure, Variation, and Assembly of the Root-Associated Microbiomes of Rice. Proc. Natl. Acad. Sci. USA 2015, 112, E911–E920. [Google Scholar] [CrossRef]
  53. Ali, B.; Sabri, A.N.; Ljung, K.; Hasnain, S. Auxin Production by Plant Associated Bacteria: Impact on Endogenous IAA Content and Growth of Triticum aestivum L. Lett. Appl. Microbiol. 2009, 48, 542–547. [Google Scholar] [CrossRef] [PubMed]
  54. Bal, H.B.; Das, S.; Dangar, T.K.; Adhya, T.K. ACC Deaminase and IAA Producing Growth Promoting Bacteria from the Rhizosphere Soil of Tropical Rice Plants. J. Basic Microbiol. 2013, 53, 972–984. [Google Scholar] [CrossRef] [PubMed]
  55. Mohite, B. Isolation and Characterization of Indole Acetic Acid (IAA) Producing Bacteria from Rhizospheric Soil and Its Effect on Plant Growth. J. Soil Sci. Plant Nutr. 2013, 13, 638–649. [Google Scholar] [CrossRef]
  56. Lebrazi, S.; Fadil, M.; Chraibi, M.; Fikri-Benbrahim, K. Screening and Optimization of Indole-3-Acetic Acid Production by Rhizobium Sp. Strain Using Response Surface Methodology. J. Genet. Eng. Biotechnol. 2020, 18, 21. [Google Scholar] [CrossRef]
  57. Liu, W.H.; Chen, F.F.; Wang, C.E.; Fu, H.H.; Fang, X.Q.; Ye, J.R.; Shi, J.Y. Indole-3-Acetic Acid in Burkholderia pyrrocinia JK-SH007: Enzymatic Identification of the Indole-3-Acetamide Synthesis Pathway. Front. Microbiol. 2019, 10, 484770. [Google Scholar] [CrossRef]
  58. Ait Bessai, S.; Bensidhoum, L.; Nabti, E. hafid Optimization of IAA Production by Telluric Bacteria Isolated from Northern Algeria. Biocatal. Agric. Biotechnol. 2022, 41, 102319. [Google Scholar] [CrossRef]
  59. Leveau, J.H.J.; Gerards, S. Discovery of a Bacterial Gene Cluster for Catabolism of the Plant Hormone Indole 3-Acetic Acid. FEMS Microbiol. Ecol. 2008, 65, 238–250. [Google Scholar] [CrossRef]
  60. Zarkan, A.; Liu, J.; Matuszewska, M.; Gaimster, H.; Summers, D.K. Local and Universal Action: The Paradoxes of Indole Signalling in Bacteria. Trends Microbiol. 2020, 28, 566–577. [Google Scholar] [CrossRef]
  61. Walpola, B.C.; Hettiarachchi, R.H.A.N. Comparison of Qualitative and Quantitative Methods for Isolation of Phosphate Solubilizing Microorganisms. Vidyodaya J. Sci. 2020, 23, 14–22. [Google Scholar]
  62. Sarwar, S.; Khaliq, A.; Yousra, M.; Sultan, T.; Ahmad, N.; Khan, M. Screening of Siderophore-Producing PGPRs Isolated from Groundnut (Arachis hypogaea L.) Rhizosphere and Their Influence on Iron Release in Soil. Commun. Soil Sci. Plant Anal. 2020, 51, 1680–1692. [Google Scholar] [CrossRef]
  63. Khan, A.; Doshi, H.V.; Thakur, M.C. Bacillus Spp.: A Prolific Siderophore Producer. In Bacilli and Agrobiotechnology; Islam, M.T., Rahman, M., Pandey, P., Jha, C.K., Aeron, A., Eds.; Springer International Publishing: Cham, Switzerland, 2016; pp. 309–323. ISBN 978-3-319-44409-3. [Google Scholar]
  64. Tiwari, S.; Prasad, V.; Lata, C. Chapter 3—Bacillus: Plant Growth Promoting Bacteria for Sustainable Agriculture and Environment. In New and Future Developments in Microbial Biotechnology and Bioengineering; Singh, J.S., Singh, D.P., Eds.; Elsevier: New York, NY, USA, 2019; pp. 43–55. ISBN 978-0-444-64191-5. [Google Scholar]
  65. Abeysinghe, S. Effect of Combined Use of Bacillus subtilis CA32 and Trichoderma harzianum RU01 on Biological Control of Rhizoctonia Solani on Solanum melongena and Capsicum annuum. Plant Pathol. J. 2009, 8, 9–16. [Google Scholar] [CrossRef]
  66. Madhaiyan, M.; Selvakumar, G.; Alex, T.H.; Cai, L.; Ji, L. Plant Growth Promoting Abilities of Novel Burkholderia-Related Genera and Their Interactions With Some Economically Important Tree Species. Front. Sustain. Food Syst. 2021, 5, 618305. [Google Scholar] [CrossRef]
  67. Ghosh, R.; Barman, S.; Mukherjee, R.; Mandal, N.C. Role of Phosphate Solubilizing Burkholderia Spp. for Successful Colonization and Growth Promotion of Lycopodium cernuum L.(Lycopodiaceae) in Lateritic Belt of Birbhum District of West Bengal, India. Microbiol. Res. 2016, 183, 80–91. [Google Scholar] [CrossRef]
  68. Donoso, R.; Leiva-Novoa, P.; Zúñiga, A.; Timmermann, T.; Recabarren-Gajardo, G.; González, B. Biochemical and Genetic Bases of Indole-3-Acetic Acid (Auxin Phytohormone) Degradation by the Plant-Growth-Promoting Rhizobacterium Paraburkholderia phytofirmans PsJN. Appl. Environ. Microbiol. 2017, 83, e01991-16. [Google Scholar] [CrossRef]
  69. Barrera-Galicia, G.C.; Peniche-Pavía, H.A.; Peña-Cabriales, J.J.; Covarrubias, S.A.; Vera-Núñez, J.A.; Délano-Frier, J.P. Metabolic Footprints of Burkholderia sensu Lato Rhizosphere Bacteria Active against Maize Fusarium Pathogens. Microorganisms 2021, 9, 2061. [Google Scholar] [CrossRef]
  70. Carrión, V.J.; Cordovez, V.; Tyc, O.; Etalo, D.W.; de Bruijn, I.; de Jager, V.C.L.; Medema, M.H.; Eberl, L.; Raaijmakers, J.M. Involvement of Burkholderiaceae and Sulfurous Volatiles in Disease-Suppressive Soils. ISME J. 2018, 12, 2307–2321. [Google Scholar] [CrossRef]
  71. Puri, A.; Padda, K.P.; Chanway, C.P. Evidence of Endophytic Diazotrophic Bacteria in Lodgepole Pine and Hybrid White Spruce Trees Growing in Soils with Different Nutrient Statuses in the West Chilcotin Region of British Columbia, Canada. For. Ecol. Manage. 2018, 430, 558–565. [Google Scholar] [CrossRef]
  72. Pahari, A.; Mishra, B.B. Characterization of Siderophore Producing Rhizobacteria and Its Effect on Growth Performance of Different Vegetables. Int. J. Curr. Microbiol. Appl. Sci. 2017, 6, 1398–1405. [Google Scholar] [CrossRef]
  73. Kumar, P.; Thakur, S.; Dhingra, G.K.; Singh, A.; Pal, M.K.; Harshvardhan, K.; Dubey, R.C.; Maheshwari, D.K. Inoculation of Siderophore Producing Rhizobacteria and Their Consortium for Growth Enhancement of Wheat Plant. Biocatal. Agric. Biotechnol. 2018, 15, 264–269. [Google Scholar] [CrossRef]
  74. Zou, X.; Binkley, D.; Doxtader, K.G. A New Method for Estimating Gross Phosphorus Mineralization and Immobilization Rates in Soils. Plant Soil 1992, 147, 243–250. [Google Scholar] [CrossRef]
  75. Davey, M.W.; Stals, E.; Panis, B.; Keulemans, J.; Swennen, R.L. High-Throughput Determination of Malondialdehyde in Plant Tissues. Anal. Biochem. 2005, 347, 201–207. [Google Scholar] [CrossRef] [PubMed]
  76. Lin, Z.; Zhong, S.; Grierson, D. Recent Advances in Ethylene Research. J. Exp. Bot. 2009, 60, 3311–3336. [Google Scholar] [CrossRef] [PubMed]
  77. Belimov, A.A.; Safronova, V.I.; Sergeyeva, T.A.; Egorova, T.N.; Matveyeva, V.A.; Tsyganov, V.E.; Borisov, A.Y.; Tikhonovich, I.A.; Kluge, C.; Preisfeld, A.; et al. Characterization of Plant Growth Promoting Rhizobacteria Isolated from Polluted Soils and Containing 1-Aminocyclopropane-1-Carboxylate Deaminase. Can. J. Microbiol. 2001, 47, 642–652. [Google Scholar] [CrossRef] [PubMed]
  78. Silveira, V.; Balbuena, T.S.; Santa-Catarina, C.; Floh, E.I.S.; Guerra, M.P.; Handro, W. Biochemical Changes during Seed Development in Pinus taeda L. Plant Growth Regul. Plant Growth Regul. 2004, 44, 147–156. [Google Scholar] [CrossRef]
  79. Pullman, G.S.; Buchanan, M. Identification and Quantitative Analysis of Stage-Specific Carbohydrates in Loblolly Pine (Pinus taeda) Zygotic Embryo and Female Gametophyte Tissues. Tree Physiol. 2008, 28, 985–996. [Google Scholar] [CrossRef]
  80. Timofeeva, A.M.; Galyamova, M.R.; Sedykh, S.E. Plant Growth-Promoting Bacteria of Soil: Designing of Consortia Beneficial for Crop Production. Microorganisms 2023, 11, 2864. [Google Scholar] [CrossRef]
  81. Pascale, A.; Proietti, S.; Pantelides, I.S.; Stringlis, I.A. Modulation of the Root Microbiome by Plant Molecules: The Basis for Targeted Disease Suppression and Plant Growth Promotion. Front. Plant Sci. 2020, 10, 1741. [Google Scholar] [CrossRef]
Figure 1. Relative abundance (in percentage) of bacterial families of P. pinea L. root’s representative isolates (N = 68). Number of isolates is shown in parentheses.
Forests 16 01161 g001
Figure 2. The relative abundance of plant growth-promoting (PGP) traits in bacterial isolates from Pinus pinea L. The horizontal barplot (pink bars) shows the percentage of isolates exhibiting each plant growth-promoting trait. The matrix represents different PGP profiles (combination of PGP traits), with dots indicating the traits present in each combination. The upper barplot illustrates the relative abundance of each PGP profile, with the total percentage displayed at the top of each bar, and colors representing different bacterial phyla. IAA prod.: indole-3-acetic acid production; Siderophore prod.: siderophore production; Phosphate solu.: phosphate solubilization; ACC Deaminase prod.: 1-aminocyclopropane-1-carboxylate deaminase production; N: number of the representative isolates.
Forests 16 01161 g002
Figure 3. The relative abundance of each PGP trait for each bacterial genus (only genera with N > 1 were considered). The barplot indicates the number of isolates per genus, with bar colors representing different phyla. IAA prod.: indole-3-acetic acid production; Siderophore prod.: siderophore production; Phosphate solu.: phosphate solubilization; ACC Deaminase prod.:1-aminocyclopropane-1-carboxylate deaminase production. Fungal inhib: in vitro fungal inhibition of Fusarium circinatum. Each phylum is represented by a color.
Forests 16 01161 g003
Figure 4. The log (base 2) of the fold change of plant-related metabolites and attributes (in the x-axis) when compared to the control group (not displayed) for the different bacterial formulations (C1–5, P1–5) tested in P. radiata D. Don seedlings. The numbers are rounded up to the nearest decimal case. Asterisks indicate significant differences from the control (p < 0.05). Phenol: phenolic compounds; MDA: malondialdehyde; Total Chloro: total chlorophyll; Germ speed: germination speed; MeanGermTime: mean germination time. Asterisks (*) indicate a statistically significant difference (p < 0.05) compared to the control group.
Forests 16 01161 g004
Table 1. Functional and taxonomic characterization of endophytic bacteria selected for in vivo trials.
Plant Growth-Promoting Traits
StrainsGeneraBacterial FormulationPhosphate Solu.IAA (µg/mL)SiderophoresFungal Inhib.
Paenibacillus T.M5R4PaenibacillusP1; P2; P3; P4; P5-21.7--
Bacillus R.M2R7BacillusP2; P3; P4; P5-6.46Positive-
Acinetobacter T.M2R22AcinetobacterP3; P4; P5Positive13.5Positive-
Paraburkholderia R.M1R3ParaburkholderiaP4; P5Positive12.65Positive-
Rahnella T.M2R17RahnellaP5Positive67.01-Positive
Caballeronia R.M3R3CaballeroniaC1; C2; C3; C4; C5-16.44--
Rhodococcus T.M4R4RhodococcusC2; C3; C4; C5-35.5Positive-
Mesorhizobium R.M1R2MesorhizobiumC3; C4; C5Positive33.15Positive-
Burkholderia R.M1R13BurkholderiaC4; C5Positive13.01Positive-
Paraburkholderia R.M2R9ParaburkholderiaC5Positive11.35-Positive
Strains: bacterial strains; Genera: taxonomic identification at the genus level based on 16S rRNA gene sequencing; Phosphate solu.: phosphate solubilization; IAA (µg/mL): indole acetic acid production; Siderophores: siderophore Production; ACC: 1-aminocyclopropane-1-carboxylate deaminase production; Fungal inhib.: Fusarium circinatum inhibition.
Table 2. A table indicating the final values of total germination percentage per treatment at the end of the experiment (30 days post-sowing). The values indicated are in percentages. Cont.: control; Germ.: germination.
Cont.C5C4C3C2C1P5P4P3P2P1
Total Germ. Percentage70.8%75%72.9%89.5%79.2%77.1%66.7%81.3%68.8%83.3%70.8%
Disclaimer/Publisher’s Note: The statements, opinions and data contained in all publications are solely those of the individual author(s) and contributor(s) and not of MDPI and/or the editor(s). MDPI and/or the editor(s) disclaim responsibility for any injury to people or property resulting from any ideas, methods, instructions or products referred to in the content.

