Article

Response Mechanism of Carbon Fluxes in Restored and Natural Mangrove Ecosystems Under the Effects of Storm Surges

1
National Ocean Technology Center, Tianjin 300112, China
2
School of Marine Science and Technology, Tianjin University, Tianjin 300072, China
3
SANYA Oceanographic Laboratory, Sanya 572000, China
4
Institute of Forest Resource Information Techniques, Chinese Academy of Forestry, Beijing 100091, China
5
State Forestry and Grassland Administration, Key Laboratory of Forest Management and Growth Modelling, Beijing 100091, China
6
Key Laboratory of Marine Spatial Planning Technology (KLMSP), China Oceanic Development Foundation, Tianjin 300112, China
*
Author to whom correspondence should be addressed.
Forests 2025, 16(7), 1115; https://doi.org/10.3390/f16071115
Submission received: 8 June 2025 / Revised: 30 June 2025 / Accepted: 4 July 2025 / Published: 5 July 2025
(This article belongs to the Special Issue Advances in Forest Carbon, Water Use and Growth Under Climate Change)

Abstract

As climate change intensifies the frequency and magnitude of extreme weather events, such as storm surges, understanding how extreme weather events alter mangrove carbon dynamics is critical for predicting the resilience of blue carbon ecosystems under climate change. Mangrove forests are generally recognized for their resilience to natural disturbances, a characteristic largely attributed to the evolutionary development of species-specific functional traits. However, limited research has explored the impacts of storm surges on carbon flux dynamics in both natural and restored mangrove ecosystems. In this study, we analyzed short-term responses of storm surges on carbon dioxide flux and methane flux in natural and restored mangroves. The results revealed that following the storm surge, CO2 uptake decreased by 51% in natural mangrove forests and increased by 20% in restored mangroves, while CH4 emissions increased by 14% in natural mangroves and decreased by 22% in restored mangroves. GPP is mainly driven by PPFD and negatively affected by VPD and RH, while Reco and CH4 flux respond to a combination of temperature, humidity, and hydrological factors. NEE is primarily controlled by GPP and Reco, with environmental variables acting indirectly. These findings highlight the complex, site-specific pathways through which extreme events regulate carbon fluxes, underscoring the importance of incorporating ecological feedbacks into coastal carbon assessments under climate change.

1. Introduction

Mangrove wetlands exhibit significant carbon storage potential, in spite of their restricted area [1]. The annual CO2 absorption rate of mangroves is about eight times that of inland wetlands [2]. However, their role in the global carbon cycle is complex, as mangroves also emit methane (CH4), a potent greenhouse gas with a warming potential 27–29.8 times higher than CO2 over a 100-year timescale [3]. The net ecosystem exchange (NEE) of CO2 and CH4 fluxes in mangroves thus represents a delicate balance between carbon absorption and greenhouse gas emissions, which can be upset by extreme climatic events such as storm surges. With climate change amplifying the frequency and intensity of storm surges [4], particularly in vulnerable coastal regions, it is increasingly vital to understand how different types of mangrove ecosystems—both restored and natural—respond to such extreme events. This study provides novel insights into the distinct response mechanisms of NEE and CH4 fluxes under storm surge stress, highlighting the contrasting carbon dynamics between restored and natural mangroves. These findings are critical for refining blue carbon budgets and offer a scientific foundation for evidence-based coastal management, restoration strategies, and long-term climate mitigation planning.
NEE serves as a key indicator of mangrove carbon sink strength. Methane emissions, though comparatively smaller in magnitude, are a critical component of mangrove greenhouse gas budgets due to CH4’s high global warming potential [3]. Natural mangrove forests, with their complex root systems and anoxic soils, have evolved mechanisms to balance carbon sequestration and methane production. In contrast, restored mangroves—typically established in degraded or anthropogenically altered habitats—may exhibit divergent carbon cycling behaviors due to differences in community structure, microbial community composition, and soil nutrient cycling [5]. Ecosystem and atmospheric CO2 exchange is commonly measured using the eddy covariance technique (EC), which allows long-term, continuous, large-scale monitoring of carbon flux data to quantify the carbon source-sink function of ecosystems [6,7].
Mangrove ecosystems are particularly susceptible to storm surges given their coastal position. Despite mangroves being regarded as disturbance-adapted ecosystems, the increasing intensity and numbers of storm surges will exacerbate threats to mangrove ecosystems [8]. Storm surges, characterized by rapid seawater inundation and sediment deposition, can transiently or permanently alter these processes by modulating oxygen availability, salinity stress, and organic matter decomposition rates. Such disturbances may shift mangrove ecosystems from net carbon sinks to temporary sources, with implications for their role in climate mitigation [9]. Storm surges introduce abrupt salinity changes, which suppress sulfate-reducing bacteria while favoring methanogens. For instance, Zhu et al. [10] found that drought-induced salinity spikes reduced both CO2 sequestration and CH4 emissions in mangroves, but storm surges may reverse this trend by diluting soil salinity temporarily. Storm surges inundate mangroves with saline water, prolonging anaerobic conditions in soils. This suppresses aerobic respiration but promotes CH4 production. In the Pearl River Delta, restored mangroves with low salinity exhibited elevated CH4 emissions (24.7–26.3 g C m−2 yr−1) due to prolonged flooding, contrasting with natural mangroves that act as stronger carbon sinks [11].
However, existing studies on mangrove carbon fluxes often focus on baseline conditions, neglecting episodic disturbances such as storm surges, especially for the natural and restored mangroves. Chen et al. (2000) [12] demonstrated that typhoon-induced damage to mangrove forests is influenced by stand origin, stand density, and stand age. Notably, their study revealed a significant vulnerability disparity in Sonneratia apetala populations, with mature trees exhibiting higher susceptibility to structural damage compared to younger individuals during typhoon events [13]. Thus, this study focuses on (1) unraveling the temporal dynamics of CO2 sequestration and CH4 emission patterns during storm surge disturbances in natural and restored mangroves, (2) analyzing the differences in the impact of environmental variables on CO2 and CH4 fluxes before, during, and after storm surges, and (3) assessing post-disturbance recovery in mangrove carbon sink resilience. To address each of these objectives, we integrate in situ flux monitoring using eddy covariance towers with environmental variables in natural and restored mangroves. Our findings will advance predictive models of mangrove blue carbon stability under intensifying storm regimes and inform targeted restoration strategies to enhance ecosystem-scale carbon-climate feedback buffering capacity.

2. Materials and Methods

2.1. Study Sites

The two eddy covariance (EC) flux towers are located in restored and natural mangrove forest (Figure 1). The restored mangrove forest (120.57° E, 27.58° N) is located at the estuary of the Aojiang River in Zhejiang province, a region dominated by a subtropical monsoon climate. This area experienced an average annual rainfall and temperature of 1588 mm and 20.4 °C during 2020–2022 [14]. The estuary is influenced by tidal dynamics, with semidiurnal tides that are crucial in nutrient transport and sediment deposition. The dominant plant species is Kandelia obovata, which was planted in two phases (2014 and 2018) as part of a coastal restoration project. The young age of the restored mangroves is reflected in their relatively low canopy height, ranging from 0.54 to 2.57 m, occupying an area of 11 ha.
In contrast, the natural mangrove forest (114.03° E, 22.5° N) is located at Mai Po Nature Reserve in Hong Kong SAR, a Ramsar-listed wetland of international importance [15]. This area experienced a mean annual temperature and mean annual precipitation of 23.5 °C and 2431.2 mm, respectively, during the 30-year period from 1991 to 2020 (https://www.hko.gov.hk/en/cis/normal/1991_2020/normals.htm, accessed on 15 April 2025). The dominant species is Kandelia obovate, but the trees are significantly older, with an age range of 20–25 years. This mature forest has a well-developed canopy structure, with a mean height of 6.5 m, and a dense root system that enhances sediment stabilization and carbon sequestration [15]. The natural mangrove forest covers an area of 115 ha.

2.2. Data Collection and Preprocessing

The flux data of the restored and natural mangrove are obtained from Xu et al. [14] and FLUXNET2015 [16], respectively. A 4-m tall EC tower was established at Pingyang and continuously acquires flux and environmental data from 2017. The molar concentrations of CO2 and CH4 have been recorded at 10 Hz via an open-path CO2/H2O analyzer (LI-7500A, LI-COR Biosciences, Lincoln, NE, USA) and a CH4 analyzer (LI-7700, LI-COR Biosciences, Lincoln, NE, USA). The environmental variables were continuously measured by the Biomet system (7900-101, LI-COR Biosciences, Lincoln, NE, USA), including photosynthetic photon flux density (PPFD, μmol m−2 s−1), vapor pressure deficit (VPD, hPa), soil temperature (TS, °C) at 5 cm depth, wind speed (WS, m/s), air temperature (TA, °C), and relative humidity (%).
A 9.5-m tall EC tower was mounted at the Mai Po Nature Reserve and continuously measured fluxes of CO2 and CH4, as well as meteorological variables, from 2016 [2]. The fluxes of CO2 and CH4 were measured with an open-path CO2/H2O analyzer (LI-7500A, LI-COR Biosciences, Lincoln, NE, USA) and a CH4 analyzer (LI-7700, LI-COR Biosciences, Lincoln, NE, USA), respectively. The biophysical variables we used are photosynthetic photon flux density (PPFD, LI-190R, LI-COR Biosciences, Lincoln, NE, USA), vapor pressure deficit (VPD), soil temperature (CS107, Campbell Scientific, Logan, UT, USA) at 5 cm depth, wind speed (HS-50, Gill instruments, Lymington, UK), air temperature (TA), and relative humidity (HMP155, Vaisala, Helsinki, Finland). The EC system also recorded high-frequency raw data at 10 Hz, which were subsequently processed into 30-min averaged fluxes.
All environmental and flux data were checked for quality and consistency and converted to consistent units (Table 1). Missing data were handled using appropriate gap-filling methods: NEE and CH4 flux gaps at the PYR site were filled using the REddyProc online tool [17] and random forest, respectively, while gaps at the HK site were filled using look-up tables and artificial neural networks. More details of flux data preprocessing and gap-filling at two sites are given in [2,14,18].

2.3. Storm Surge Impacts on Carbon Exchange

Storm surges that could affect the PYR and HK sites were screened (Figure 1) during 2020−2022 and 2016−2018, respectively. According to Chen et al. [19] and the official database of the Zhejiang Provincial Typhoon and Flood Information Center (https://typhoon.slt.zj.gov.cn/slt.htm, accessed on 9 March 2025), only storm events whose tracks passed within 350 km of either study site were retained for analysis. This distance threshold was chosen to ensure that each selected event had the potential to generate significant hydrological or ecological impacts on the local mangrove ecosystems. For each event, we extracted key characteristics, including the international storm number, name, time of closest approach, duration, maximum wind speed, and minimum distance to the flux tower. These parameters were used to assess storm intensity and proximity and are summarized in Table 2. The storm surge information was meticulously extracted from the official bulletins of marine disasters published by Zhejiang Province (https://zrzyt.zj.gov.cn/col/col1289933/index.html, accessed on 9 March 2025) and Guangdong Province (https://nr.gd.gov.cn/zwgknew/sjfb/tjsj/, accessed on 9 March 2025) (Figure 2). To assess the influence of storm surges on carbon flux processes, the mean values of key environmental and flux variables were calculated, including air temperature, soil temperature, photosynthetic photon flux density (PPFD), relative humidity, wind speed, vapor pressure deficit (VPD), as well as carbon flux components such as NEE, gross primary productivity (GPP), ecosystem respiration (Reco), and CH4 flux [20].

2.4. Statistical Analysis

To systematically evaluate the hydrodynamic response to storm surges, temporal data selection was defined based on the nearest point of storm tracks to EC sites. The temporal framework is structured as follows: (1) the storm surge event window spans 4 days centered at time T (T ± 2 days), corresponding to the nearest trajectory passage to the monitoring site; (2) both pre-surge (14 days prior to T − 2 days) and post-surge (14 days after T + 2 days) phases are designated to capture antecedent and residual effects. Data within these intervals were extracted to quantify storm-induced variations and validate predictive models.
Key statistical measures—mean, standard deviation, median, minimum, and maximum—were obtained for all variables, including air temperature, soil temperature, PPFD, relative humidity, wind speed, VPD, NEE, GPP, Reco, and CH4 flux. Violin plots were employed to analyze variations in data distribution before, during, and after storm surges. Pearson correlation coefficients were calculated to assess relationships between environmental variables (e.g., PPFD, VPD, TS, TA, WS, and RH) and carbon fluxes (NEE, GPP, Reco, and CH4 flux) and displayed in a heat map. Non-parametric Kruskal–Wallis tests were first performed to assess overall differences among storm phases (before, during, and after). For significant results (p < 0.05), post-hoc Dunn tests with Bonferroni correction were conducted for pairwise comparisons. All statistical analyses were executed using Python (version 3.8).

3. Results

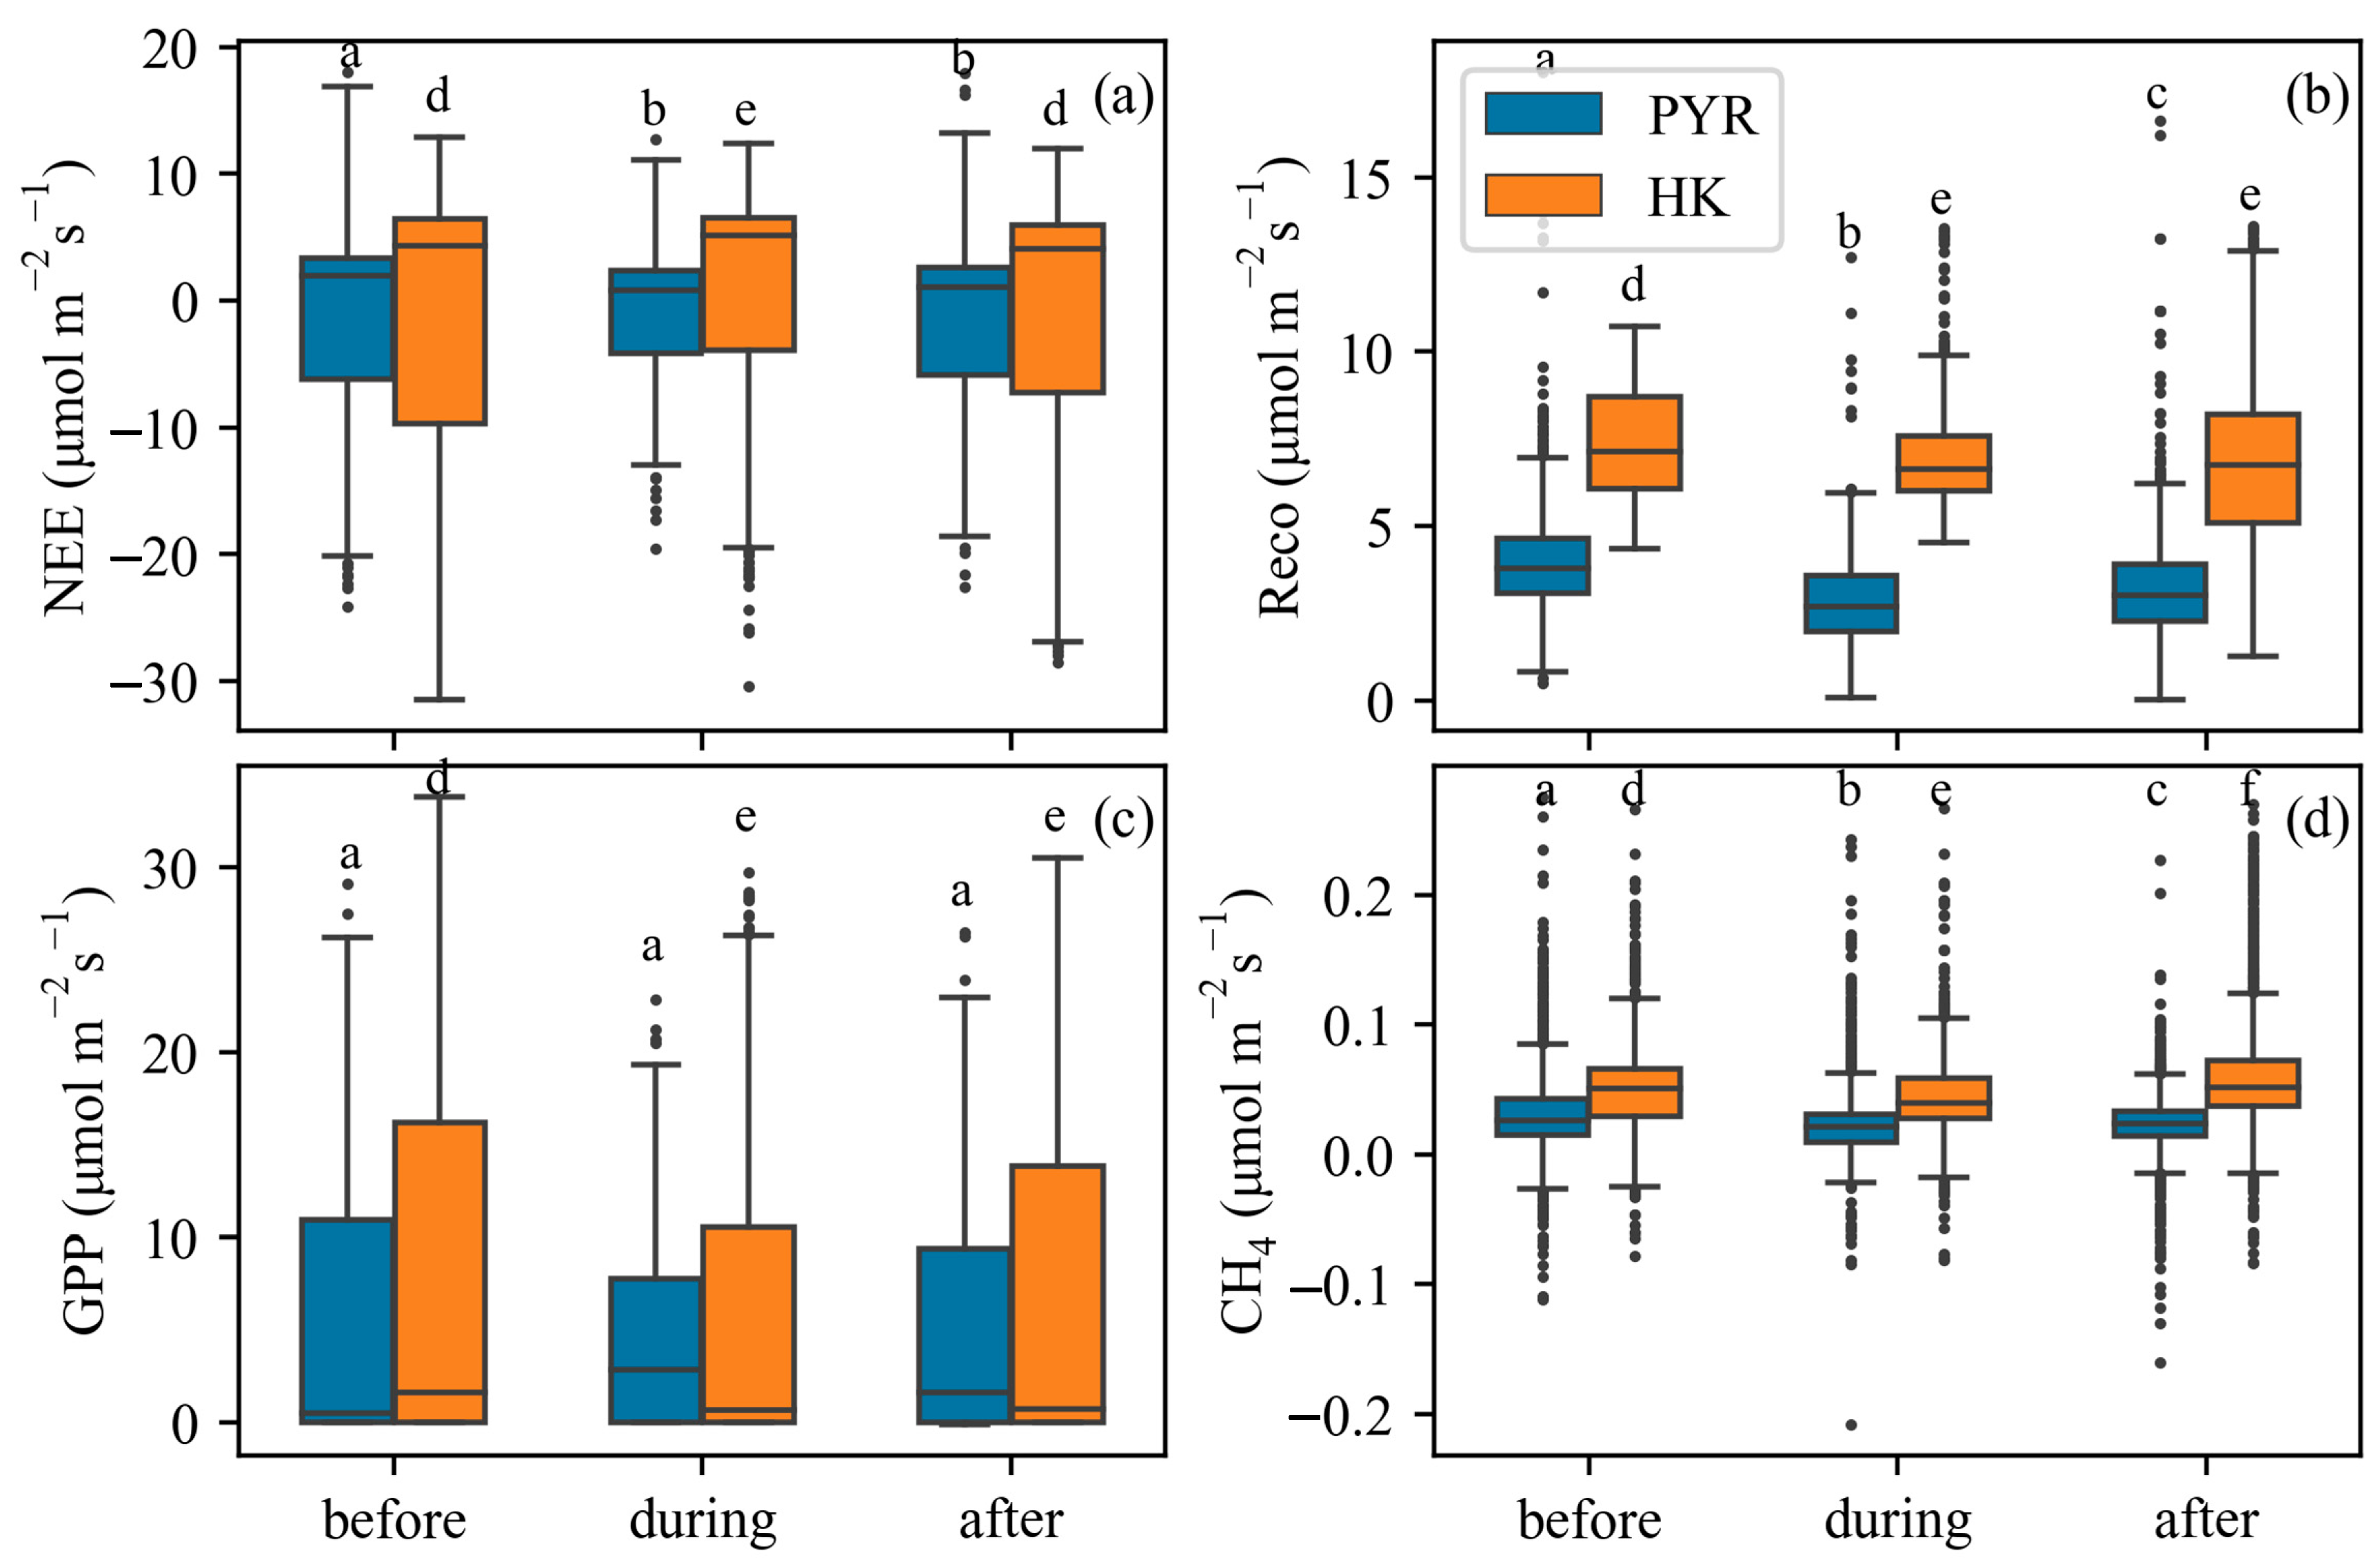
3.1. Temporal Variations of Carbon Fluxes Before and After Storm Surges

Four storm surges occurred at the PYR site during 2020−2022 (Figure 3a), and seven storm surges occurred at HK stations during 2016−2018 (Figure 3b). For the PYR site, it generally behaved as a carbon sink, but the intensity of carbon dioxide absorption was temporarily weakened during the storm surge, with NEE of −1.36 μmol m−2 s−1 (Figure 3a). It was generally a methane source (0.03 μmol m−2 s−1), but methane emissions decreased during storm surges (0.02 μmol m−2 s−1) at the PYR site. For the HK site, CO2 absorption decreased or even turned into a CO2 source during the storm surge landfall. The mean CH4 flux before, during, and after the storm surge was 0.05, 0.04, and 0.06 μmol m−2 s−1, respectively, indicating that methane emissions decreased during the storm surge at the HK site.

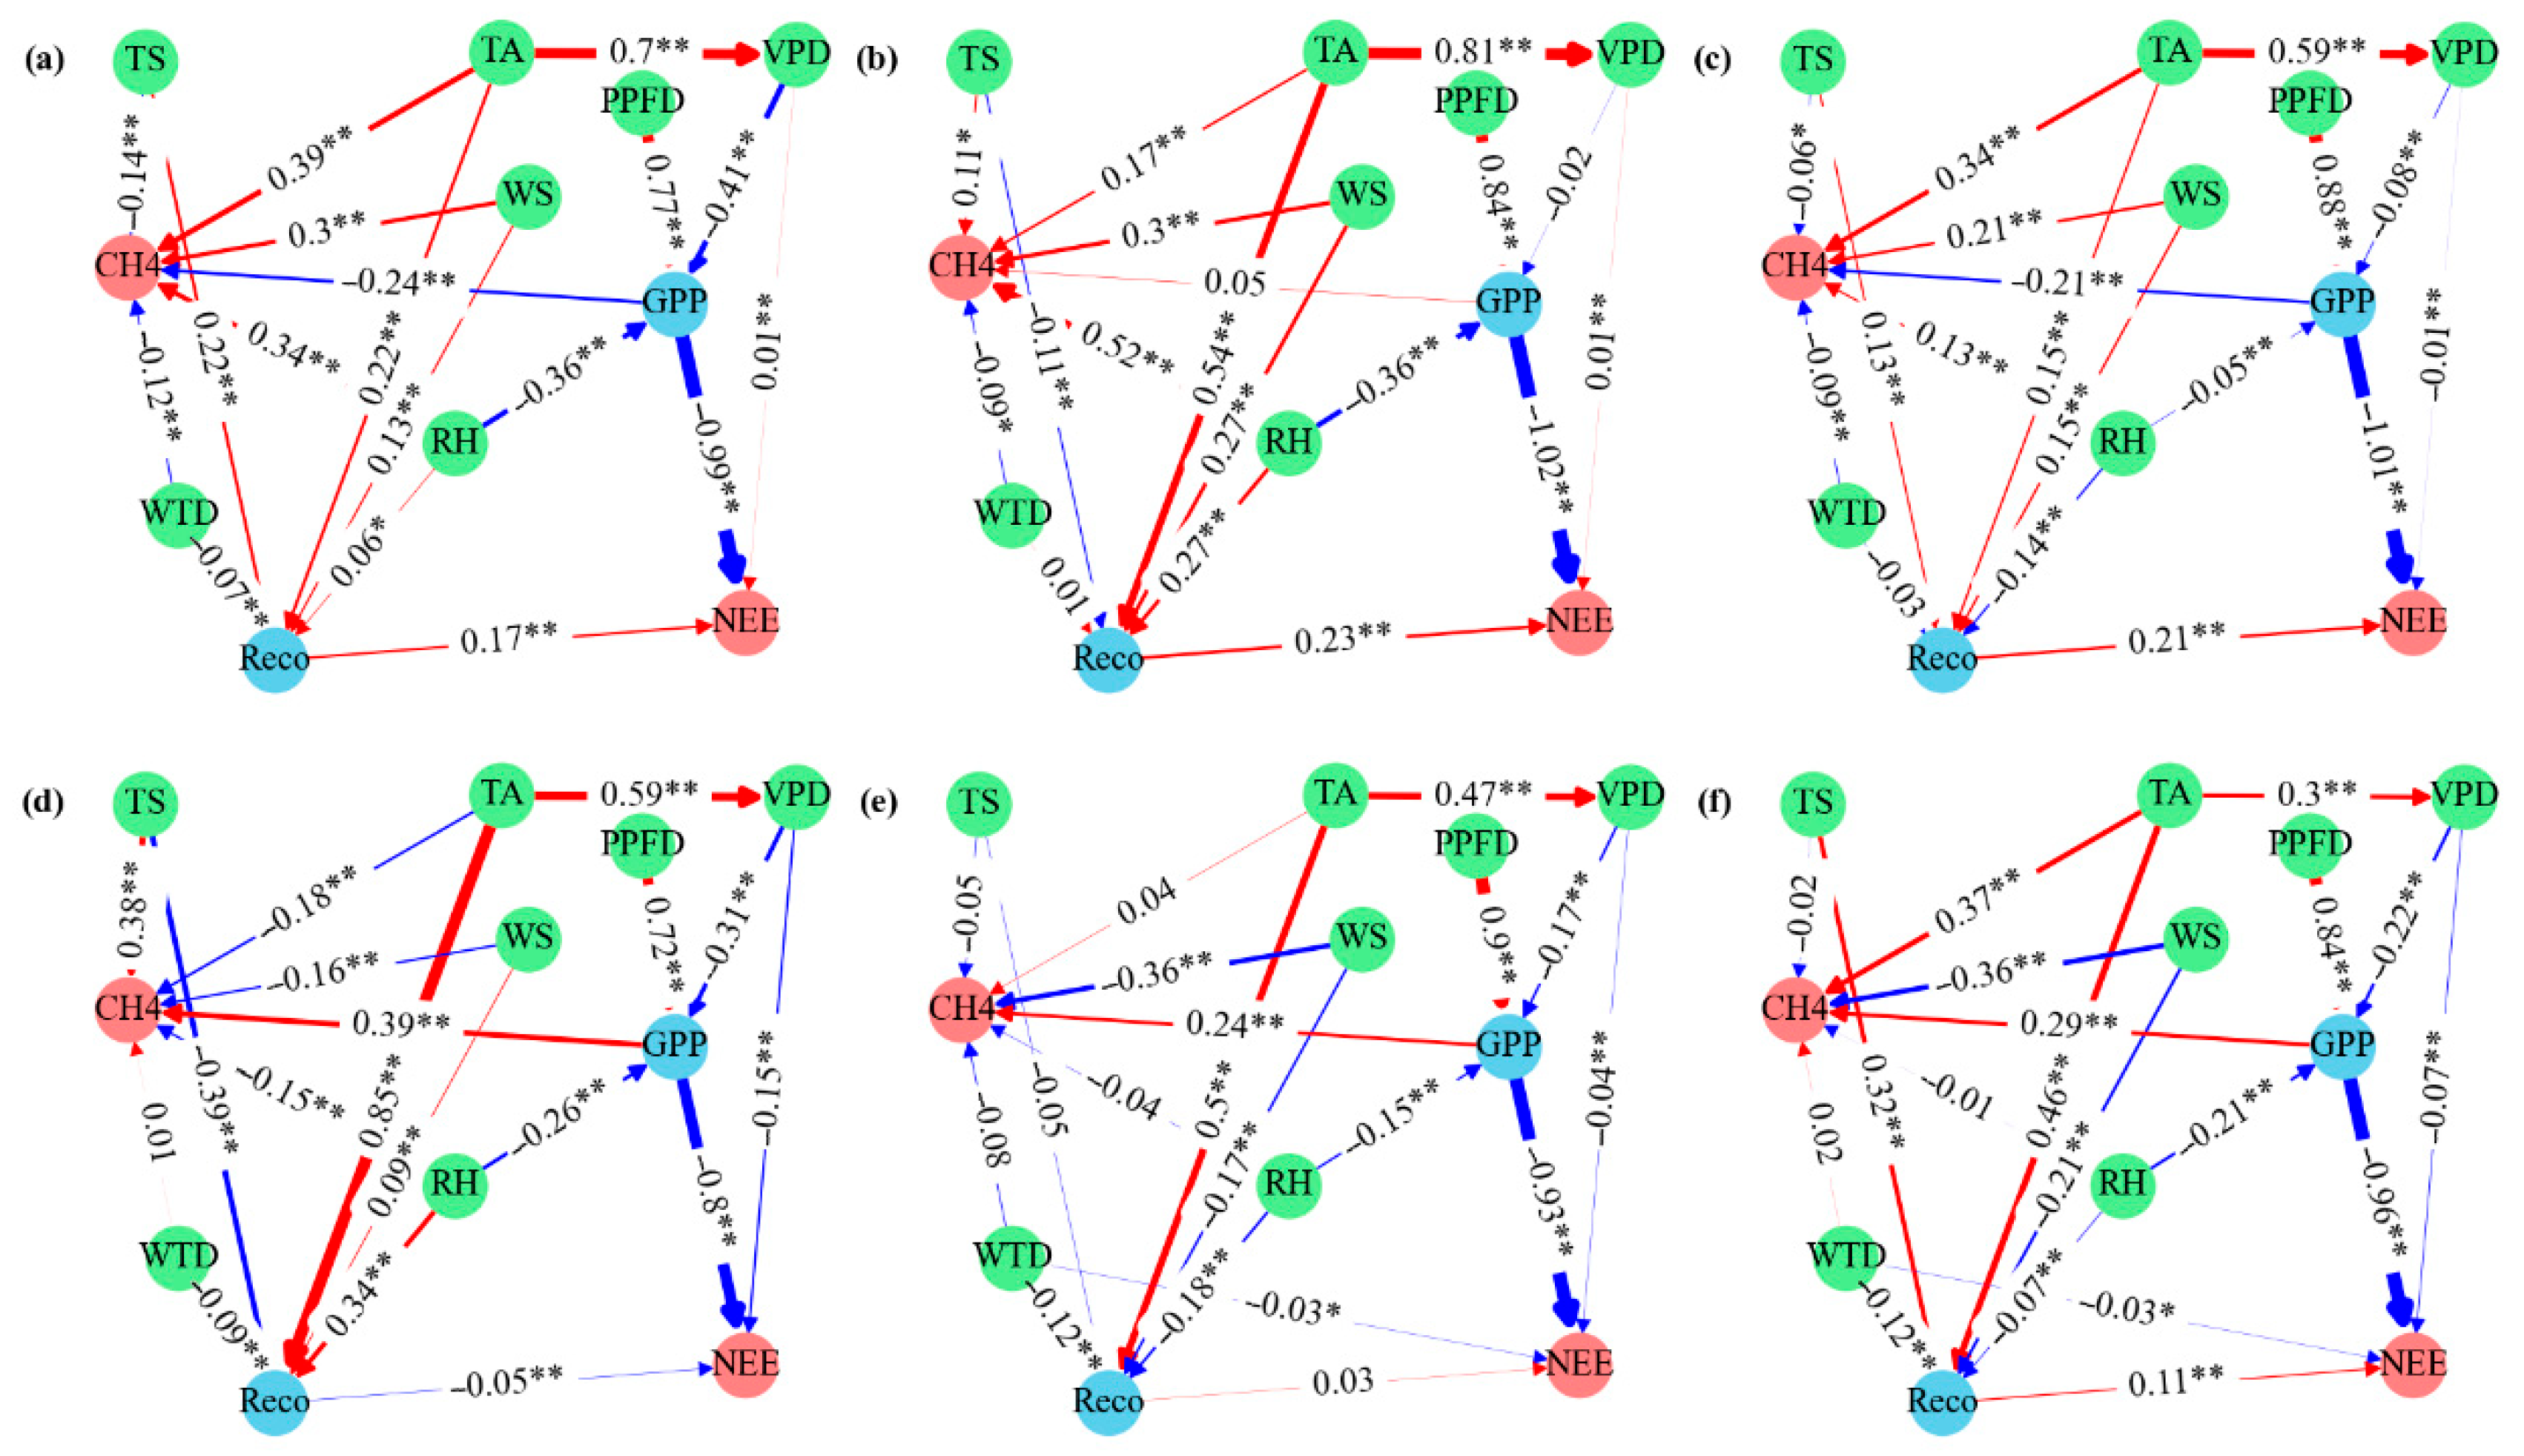
3.2. Storm Surges on Carbon Fluxes and Meteorological Variables

The boxplot analysis showed that, during the storm surge, carbon uptake decreased, as indicated by an increase in NEE and a decline in GPP and Reco, and the Kruskal–Wallis and Dunn post-hoc tests revealed distinct patterns of storm phase impacts at both sites (Figure 4). The reduction in carbon assimilation was more pronounced at the HK site, where NEE increased significantly from −1.39 to 1.03 μmol m−2 s−1 during the storm surge (p < 0.01), experiencing a stronger storm impact. Methane emissions (CH4) showed relatively minor but significant fluctuations during the storm (p < 0.01), with a slight decrease from 0.05 to 0.04 μmol m−2 s−1 and from 0.03 to 0.02 μmol m−2 s−1 at the HK and PYR sites, respectively. After the storm, carbon uptake increased, with GPP and Reco showing signs of recovery, although they had not yet returned to pre-storm levels. In contrast, CH4 emissions increased post-storm, exceeding pre-storm levels, with mean CH4 fluxes rising to 0.06 μmol m−2 s−1 at the HK site and 0.03 mg μmol m−2 s−1 at the PYR site. These findings suggest that storm surges significantly disrupt carbon flux dynamics in mangrove ecosystems, with lingering effects on both CO2 and CH4 fluxes even after the storm subsides.
The violin plots illustrate significant differences in environmental responses between the two mangrove sites, HK (natural mangrove forest) and PYR (restored mangrove forest), across different storm surge phases (Figure 5). Notable shifts were observed in light and temperature conditions during the storm period. At both sites, PPFD declined significantly during the storm, with median values dropping from 48.59 to 12.66 μmol m−2 s−1 at the PYR site and from 32.88 to 11.29 μmol m−2 s−1 at the HK site, but the after-storm phase showed a gradual recovery (Figure 5a). Both sites exhibited similar post-storm recovery trends, with gradual stabilization of temperature (TA, TS) in the aftermath of the event (Figure 4b,c). The VPD distributions revealed a marked decrease during the storm, which may be due to increased atmospheric moisture and reduced evaporative demand during extreme weather conditions (Figure 5d). After the storm, VPD values increased, indicating a post-storm drying effect as wind speeds and solar radiation levels recovered. Relative humidity (RH) demonstrated an inverse relationship with VPD, peaking during the storm phase at both sites due to increased atmospheric moisture (Figure 5e). However, RH at the PYR site exhibited great variability, with a minimum value of 40.91% and a maximum value of 97.34%. The post-storm declines in RH at both sites. Wind speed (WS) peaked during the storm, particularly at the HK site, increased sharply during the storm at both sites but gradually decreased after the storm (Figure 5f).

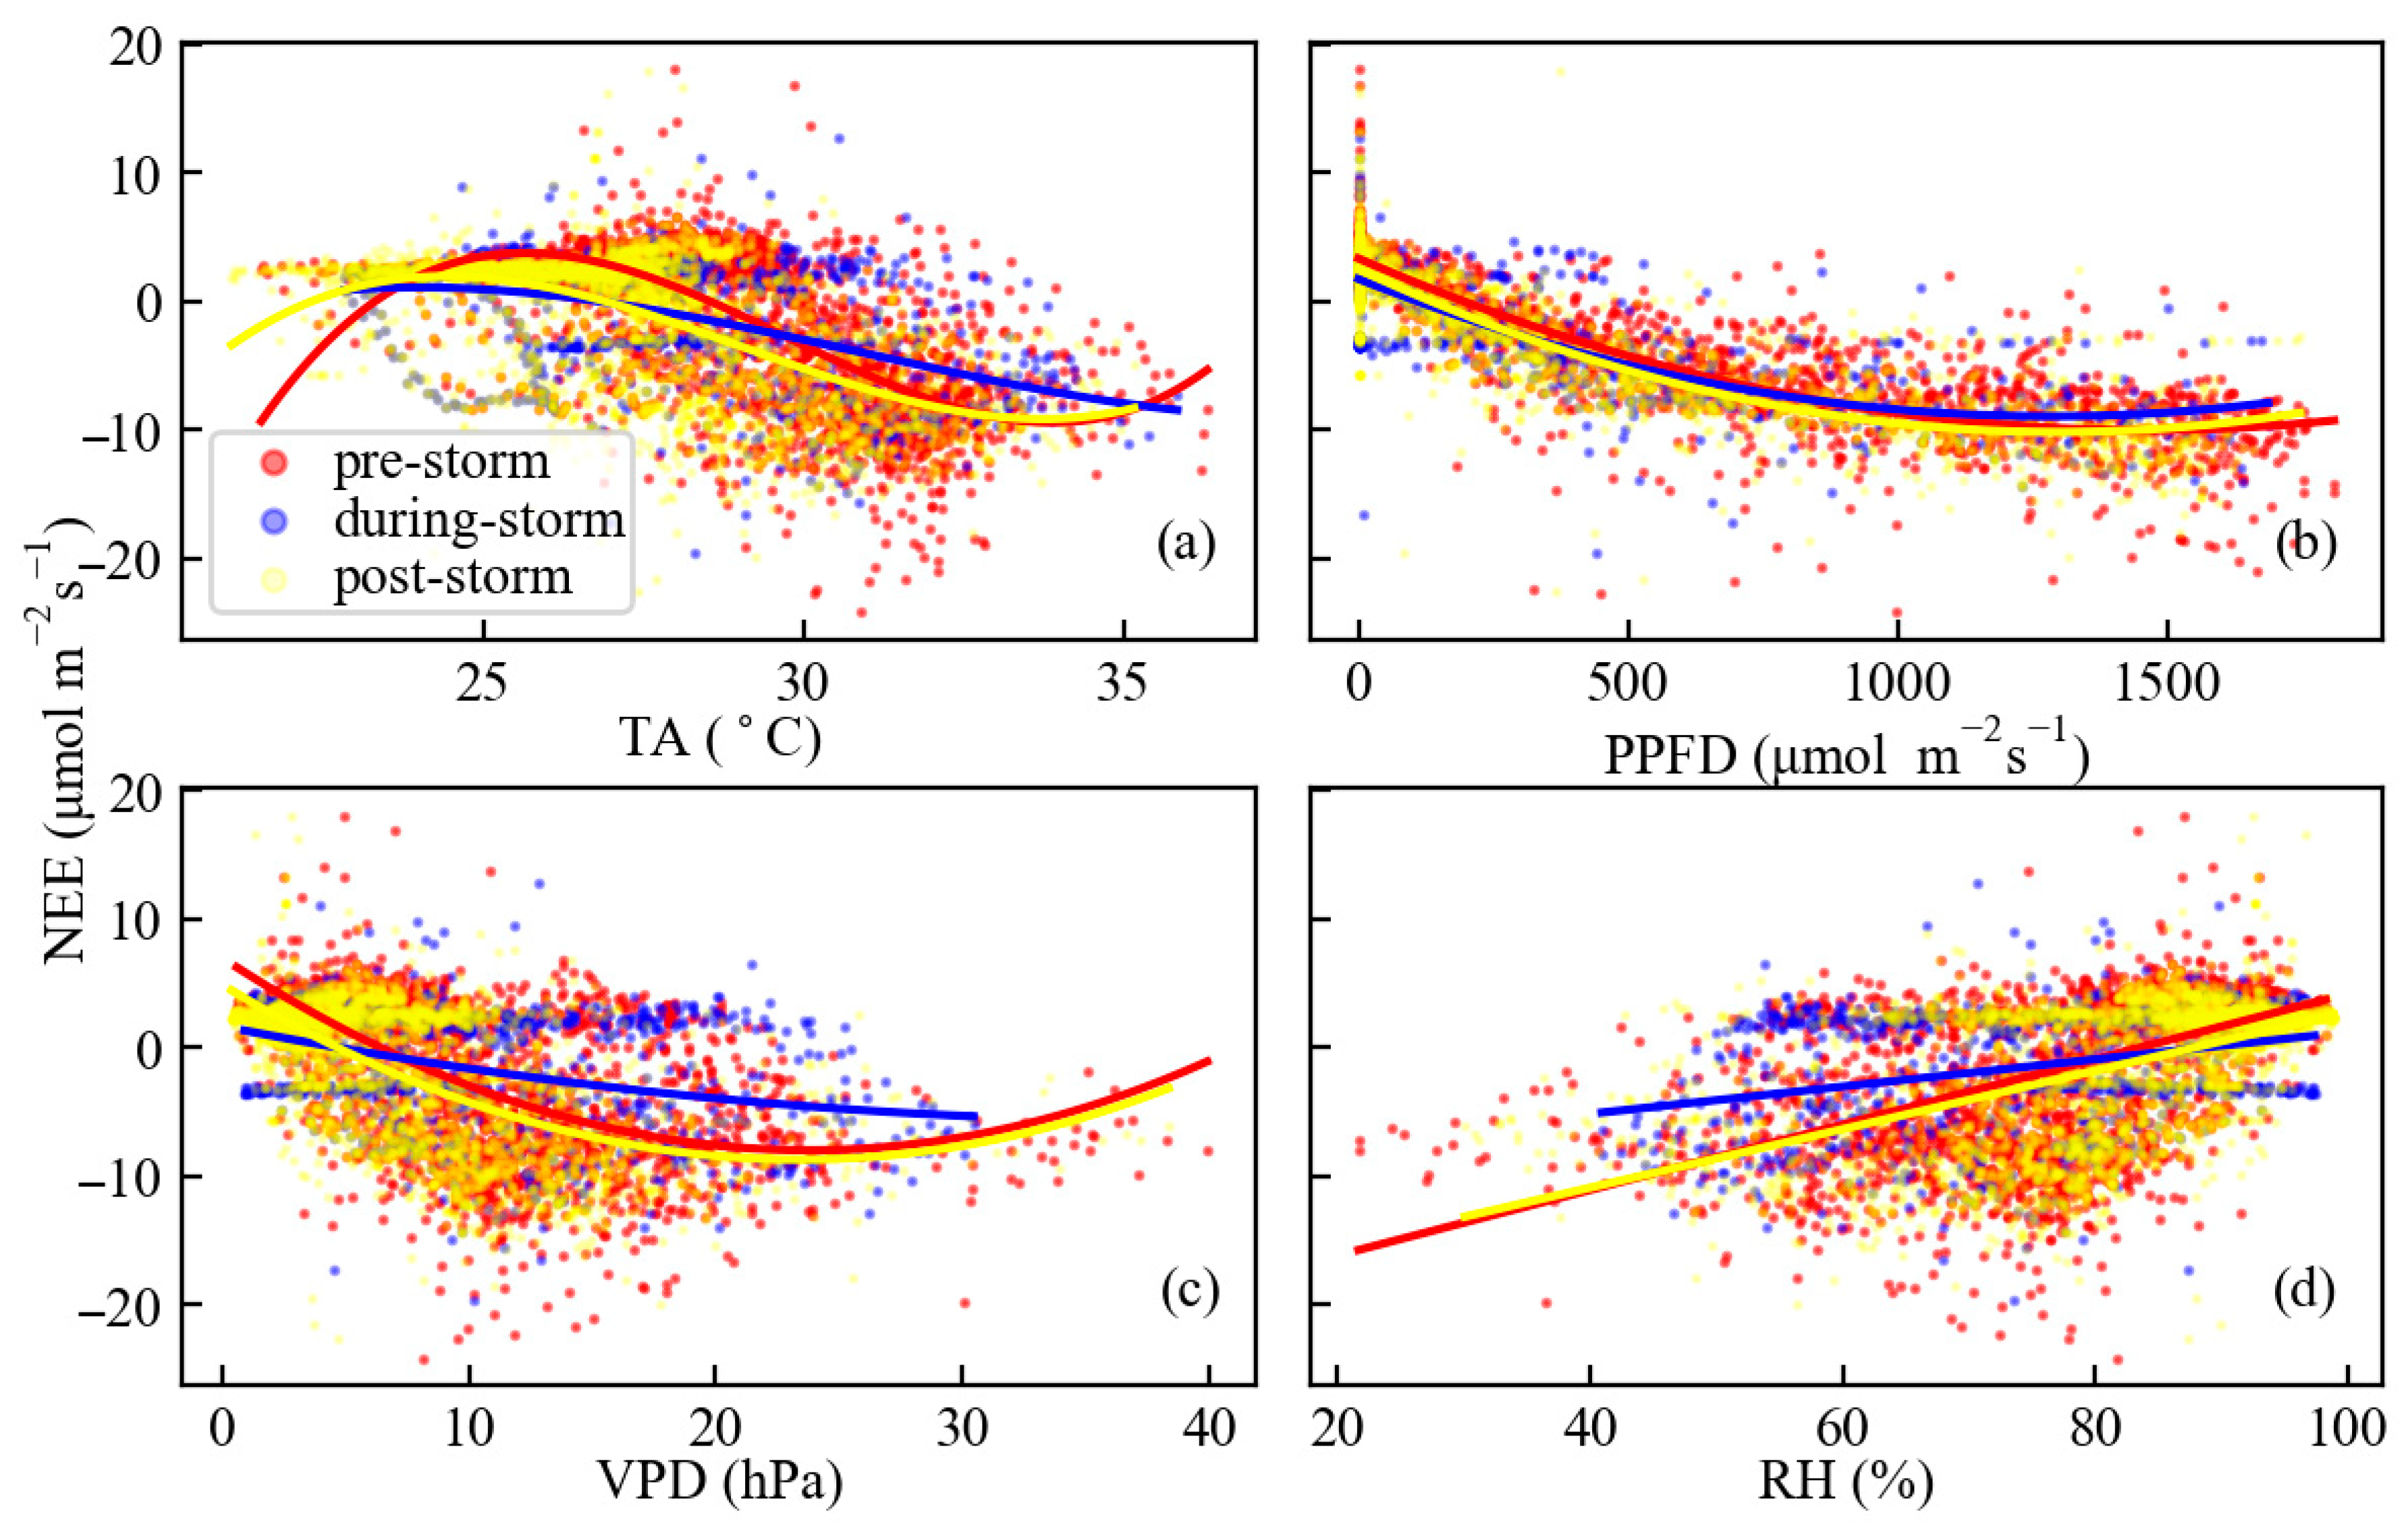
3.3. Relationships Between Carbon Fluxes and Meteorological Variables

The heatmap analysis reveals distinct site-specific responses to storm surge impacts (Figure 6), with PYR experiencing a temporary weakening of carbon flux-environment relationships that quickly recovered, whereas HK experienced stronger disruptions and more complex correlation shifts due to greater storm exposure. At the PYR site, NEE exhibited strong negative correlations with PPFD (r = −0.88), TA (r = −0.63), and VPD (r = −0.60) before the storm. However, these associations weakened markedly during the storm. Most correlations recovered close to pre-storm levels post-storm. Meanwhile, Reco became more closely correlated with TA, VPD, LE, and H during the storm. In contrast, GPP exhibited a significant decline in correlation with RH, VPD, PPFD, and TA, but partially recovered post-storm. At the HK site, pre-storm NEE showed strong correlations with RH (r = 0.63), VPD (r = −0.70), PPFD (r = −0.90), and TA (r = −0.51), but during the storm, correlations with RH (r = 0.31), VPD (r = −0.45), and WS (r = 0.02) significantly weakened, while the negative correlation between TA and NEE strengthened. Similarly, Reco became more strongly correlated with TA (r = 0.54), VPD (r = 0.36), LE (r = 0.37), and H (r = 0.41) during the storm. For GPP at the HK site, RH, VPD, and WS correlations weakened during the storm, while TA showed a slight increase in correlation with GPP (r = 0.66). CH4 flux at HK also exhibited notable shifts, with stronger negative correlations with WS (r = −0.37) and WTD (r = −0.13), accompanied by a decrease in correlation with TA and TS.
At the PYR site, during the storm surge, the direct effects of air temperature (TA) and water table depth (WTD) on CH4 flux decreased, while relative humidity (RH) had an enhanced direct effect (standardized path coefficient: α = 0.53, p < 0.001) on CH4 flux (Figure 7a–c). Additionally, wind speed (WS), RH, and TA showed increased direct effects on ecosystem respiration (Reco), whereas the direct effect of soil temperature (TS) on Reco decreased. PPFD continued to play a significant direct role in regulating gross primary production (GPP) (α = 0.84, p < 0.001), and TA indirectly influenced GPP by affecting VPD. NEE was primarily regulated by GPP and Reco, with all other factors exerting indirect effects on NEE through their influence on GPP and Reco.
At the HK site, during the storm surge, the direct effects of TS, RH, and WTD on CH4 flux all decreased (Figure 7d–f). However, the direct effect of TA and WS on CH4 flux increased, with TA having a positive impact on CH4 flux (α = 0.24, p < 0.001) and WS showing a negative effect (α = −0.35, p < 0.001). Compared to the PYR site, GPP at the HK site was directly controlled by PPFD, RH, and VPD, with PPFD playing a dominant positive role (α = 0.9, p < 0.001), while VPD and RH were negatively correlated with GPP. During the storm surge, the regulation of GPP by PPFD became more pronounced, and the direct effects of VPD and RH on GPP decreased. Additionally, TA influenced GPP indirectly through its effect on VPD. Reco was primarily regulated by the direct effects of WTD, TA, TS, and RH. During the storm surge, TA exhibited a weakened direct effect on Reco (α = 0.5, p < 0.001), while the negative effect of WTD on Reco became stronger (α = −0.12, p < 0.001).

4. Discussion

4.1. Impact of Storm Surges on Carbon Fluxes (NEE, GPP, Reco, and CH4)

The response of carbon balance to storm surges in restored and natural mangrove ecosystems varied significantly between the HK and the PYR site. Our findings suggest that the magnitude of storm surge impact was more pronounced at the HK site given its more immediate exposure to the storm event, while the PYR site exhibited a more moderate response. The storm surge significantly disrupted carbon exchange in the mangrove ecosystems, leading to a reduction in carbon uptake, as indicated by an increase in NEE and a decline in GPP and Reco during the storm (Figure 4). The decline in GPP was likely due to reduced photosynthetic efficiency and defoliation or tree mortality under storm surge disturbances [19]. Meanwhile, Reco suppression suggests reduced microbial and root respiration, possibly due to lower temperatures and water saturation [21,22].
After the storm, NEE, GPP, and Reco showed signs of recovery but had not yet returned to the levels before storm surges within 14 days, indicating legacy impacts of storm surges on mangrove carbon cycling. Studies reported that the leaf area index (LAI) of disturbed mangroves can return to pre-disturbance levels within one year, whereas ecosystem respiration and maximum photosynthetic rates may require a longer recovery period to reach their peak, and all lost carbon can be recovered within four years in most mangroves [23]. The spatial and temporal dynamics of mangrove recovery are largely governed by pre-disturbance forest structural characteristics—such as canopy height, vegetation density, and gap fraction—as well as by ecological and environmental factors, including species composition, sapling recruitment capacity, site topography, tidal connectivity, and exposure to sea-level rise [24,25,26]. According to Xiong et al. [27], taller mangrove forests (>20 m in height) required up to 2.5 years for canopy recovery due to factors such as greater structural damage, higher hydraulic failure risk in complex xylem networks, and lower resprouting capacity in mature trees. In contrast, shorter mangroves (<5 m) experienced less damage and exhibited quicker recovery owing to their flexible stems, higher bud bank activity, and faster nutrient cycling in associated soils [24]. Quebbeman et al. [28] also observed an 18% rise in soil CO2 emissions along with a transition of CH4 fluxes from net uptake to net release seven months after the hurricane. This shift was particularly evident in mature stands where extended waterlogging suppressed root respiration and stimulated sulfate-reducing microbial activity, whereas juvenile mangroves exhibited quicker soil redox recovery due to their shallower root systems [25]. The HK site represents a mature, natural mangrove forest with a taller canopy structure and greater exposure to storm surge intensity due to its proximity to the coastline. In contrast, the PYR site is a restored mangrove stand with lower canopy height and more sheltered positioning, resulting in comparatively milder disturbance impacts. These structural and spatial differences likely contributed to the greater reduction in NEE and CH4 fluxes at HK during the storm surge period, as well as the slower recovery in the 14 days that followed.
CH4 fluxes exhibited a different pattern, with relatively minor changes before the storm, a slight reduction during the storm, and a notable increase afterward. This post-storm increase in CH4 emissions was likely driven by prolonged inundation and enhanced anaerobic conditions, favoring methanogenesis [29]. Storm surge-induced precipitation and elevated water levels can create hypoxic conditions [30], while simultaneously facilitating the influx of allochthonous nutrients and carbon [31]. These processes promote the accumulation of fermentable organic substrates, potentially altering microbial processes and biogeochemical cycles [32,33].

4.2. Environmental Drivers of Carbon Flux Variability

The correlation coefficients and SEM analysis of CH4 flux, GPP, Reco, and NEE across the PYR and HK sites during storm surge events reveal distinct site-specific responses to environmental variables, highlighting the complex interactions between carbon fluxes and climatic variables in extreme conditions (Figure 6 and Figure 7). NEE is primarily regulated by the direct effects of GPP and Reco [34,35]. At both sites, the response patterns of NEE to TA, PPFD, VPD, and RH were generally consistent before and after the storm surge (Figure 8 and Figure 9). The major differences observed during the storm surge period were primarily associated with the response curves of NEE to VPD and RH. Notably, at the PYR site, NEE exhibited an approximately linear response to TA during the storm surge. Previous research also has demonstrated a nonmonotonic relationship between air temperature (Ta) and ecosystem productivity, with an optimal temperature range of 25–30 °C that maximizes productivity, while deviations below or above this range result in diminished performance [36,37]. Hydrological disturbances such as flooding have been shown to extend the upper limit of this optimal TA range by approximately 3 °C and concurrently raise the light saturation threshold of NEE [9]. Flooding events triggered by storms or hurricanes have been shown to cause a rapid and substantial increase in CO2 efflux, often elevating emissions by a factor of 2 to 10 over short timescales [38].
The strong pre-storm correlations between NEE and factors such as LE, H, TA, PPFD, VPD, and RH suggest that NEE is tightly coupled with both energy fluxes and atmospheric drivers under normal conditions (Figure 6). However, the reduction in these correlations during the storm surge period indicates a decoupling of ecosystem carbon exchange from its typical environmental controls. This disruption likely reflects the dominance of abiotic stressors—such as waterlogging, salinity intrusion, and hypoxia—introduced by the storm surge, which can be attributed to both the suppression of ecosystem respiration under anoxic conditions and the restricted gas exchange caused by physical barriers during the storm surges [39,40]. Recent findings suggest that flooding, through its influence on salinity dynamics, not only exerts direct effects on carbon and water fluxes but also alters the ecosystem’s functional sensitivity to other environmental drivers, such as air temperature [41].
During the storm surge, the direct effect of WTD on CH4 flux decreased at both sites, with the reduction reaching statistical significance at the PYR site (Figure 7, p < 0.01). This attenuation of WTD control may be attributed to saturated soil conditions, where additional increases in water level no longer exert incremental influence on anaerobic processes. Under such inundated states, methanogenic activity is increasingly governed by thermal and substrate conditions, leading to a shift in dominant controls from hydrological to climatic variables [41]. Previous studies have also reported this pattern, wherein temperature becomes a stronger predictor of CH4 flux under prolonged flooding [42,43]. These findings underscore the central role of hydrological thresholds in determining the responsiveness of CH4 production to environmental factors. In future work, complementary field-based indicators such as soil redox potential, vegetation stress signs, or porewater salinity would be valuable for validating and enriching such interpretations.

4.3. Site-Specific Responses to Storm Intensity

In this study, fourteen days after the storm surge, the HK site exhibited a net ecosystem exchange (NEE) that reached 1.4 times the pre-storm baseline, indicating enhanced CO2 uptake; however, methane (CH4) emissions also increased to 1.2 times the antecedent level. In contrast, at the PYR site, NEE recovered to 1.2 times the baseline level prior to the storm surge, while CH4 emissions remained comparable to pre-disturbance conditions. Consistent with our findings, Yao, Montagna, Wetz, Staryk, and Hu [38] demonstrated that storm- or hurricane-induced inundation can lead to rapid and substantial increases in CO2 efflux, with emissions intensifying by approximately 2 to 10 times within short timeframes.
The HK site exhibited greater storm-induced disruptions in carbon flux correlations, reflecting its stronger exposure to storm impacts (Figure 4 and Table 2). The weakening of RH, VPD, and WS correlations with NEE during the storm, combined with the strengthening of the negative TA-NEE relationship, suggests that temperature fluctuations became a dominant factor influencing net CO2 exchange under high turbulence and moisture stress [19]. By comparison, the PYR site, representing a restored mangrove system, exhibited relatively modest variations in carbon flux correlations, which may be attributed to the attenuated storm intensity and its farther proximity to the storm’s core (Table 2). The overall faster post-storm recovery of carbon flux correlations at HK, despite experiencing a more intense storm, suggests that natural mangroves exhibit stronger functional resilience compared to restored mangroves. These findings support the idea that mature mangrove forests play a crucial role in buffering carbon flux disruptions following extreme weather events.

5. Conclusions

Using the flux observation data from natural (HK) and restored (PYR) mangrove ecosystems, we elucidate the differential response mechanisms of carbon flux components in restored and natural mangrove ecosystems to storm surge disturbances, emphasizing the critical role of site-specific environmental sensitivity and ecosystem structure. The differential responses of natural (HK) and restored (PYR) mangrove ecosystems to storm surges reveal critical insights into the resilience and vulnerability of coastal carbon sinks under extreme climatic events. The natural HK site, subject to more intense storm impacts, exhibited pronounced disruptions in GPP, Reco, and CH4 flux, alongside a weakening of key carbon–environment interactions. In contrast, the restored PYR site demonstrated a relatively buffered response, particularly in CH4 fluxes. GPP was primarily driven by PPFD, with RH and VPD exerting significant negative controls, while TA indirectly influenced GPP via modulation of VPD. Reco was regulated by direct effects from TA, RH, TS, and WTD, with their relative importance shifting under storm conditions. CH4 flux responded variably across sites, with RH and TA emerging as key drivers at the PYR and HK sites, respectively. NEE dynamics were governed predominantly by the direct contributions of GPP and Reco, with other variables exerting influence indirectly. Post-storm observations revealed partial recovery in both sites, but neither returned fully to pre-disturbance flux conditions within 14 days. Collectively, these findings underscore the complex regulation of carbon fluxes in mangrove ecosystems under extreme climatic events. The differential responses between natural and restored forests underscore the need to consider species traits, canopy structure, and hydrological conditions in restoration planning. Long-term monitoring of restored sites is essential to assess their functional convergence with natural systems. Future research should extend to post-disturbance recovery of CO2 and CH4 fluxes and broaden the spatial scale to improve carbon modeling under climate change.

Author Contributions

Conceptualization, H.Z.; data curation, H.Z.; formal analysis, H.Z.; investigation, H.Z.; methodology, H.Z.; validation, H.Z.; visualization, H.Z. and Z.X.; writing—original draft, H.Z.; writing—review and editing, H.Z., J.Z., Z.T., Z.C. and W.L. All authors have read and agreed to the published version of the manuscript.

Funding

This research was funded by Key Research and Development Program of Hainan Province (Research and Application of Key Technologies for Space-Air-Ground-Sea Integrated Monitoring of Coral Reefs in the South China Sea, No. ZDYF2023GXJS023), Hainan Province Science and Technology Special Fund (No. SOLZSKY2025008), and China Oceanic Development Foundation, Key Laboratory of Marine Spatial Planning Technology (KLMSP) (No. G6240QT08).

Data Availability Statement

All data are from publicly available sources. The flux data of restored mangrove in Pingyang is from Xu et al. (2024) [14], available for download via https://doi.org/10.5281/zenodo.11277065 (accessed on 28 August 2024). The flux data of natural mangrove in Hong Kong is from FLUXNET2015 (http://fluxnet.fluxdata.org, accessed on 4 December 2023).

Acknowledgments

We acknowledge the public data from Xu et al. (2024) [14] (https://doi.org/10.5281/zenodo.11277065, accessed on 28 August 2024) and FLUXNET2015 (http://fluxnet.fluxdata.org, accessed on 4 December 2023).

Conflicts of Interest

The authors declare no conflicts of interest.

References

  1. Donato, D.C.; Kauffman, J.B.; Murdiyarso, D.; Kurnianto, S.; Stidham, M.; Kanninen, M. Mangroves among the most carbon-rich forests in the tropics. Nat. Geosci. 2011, 4, 293–297. [Google Scholar] [CrossRef]
  2. Liu, J.G.; Zhou, Y.L.; Valach, A.; Shortt, R.; Kasak, K.; Rey-Sanchez, C.; Hemes, K.S.; Baldocchi, D.; Lai, D.Y.F. Methane emissions reduce the radiative cooling effect of a subtropical estuarine mangrove wetland by half. Glob. Change Biol. 2020, 26, 4998–5016. [Google Scholar] [CrossRef] [PubMed]
  3. Intergovernmental Panel on Climate Change. Climate Change 2021: The Physical Science Basis. Contribution of Working Group I to the Sixth Assessment Report of the Intergovernmental Panel on Climate Change; Cambridge University Press: Cambridge, UK, 2021. [Google Scholar]
  4. Ji, T.; Li, G.S.; Liu, Y.X.Y.; Liu, R.; Zhu, Y.Q. Spatiotemporal features of storm surge activity and its response to climate change in the southeastern coastal area of China in the past 60 years. J. Geophys. Res. Atmos. 2021, 126, e2020JD033234. [Google Scholar] [CrossRef]
  5. Lin, G.M.; He, Y.N.; Lu, J.G.; Chen, H.; Feng, J.X. Seasonal variations in soil physicochemical properties and microbial community structure influenced by Spartina alterniflora invasion and Kandelia obovata restoration. Sci. Total Environ. 2021, 797, 149213. [Google Scholar] [CrossRef] [PubMed]
  6. Baldocchi, D.D. How eddy covariance flux measurements have contributed to our understanding of Global Change Biology. Glob. Change Biol. 2019, 26, 242–260. [Google Scholar] [CrossRef]
  7. Alongi, D.M. Carbon sequestration in mangrove forests. Carbon Manag. 2012, 3, 313–322. [Google Scholar] [CrossRef]
  8. Alongi, D.M. Mangrove forests: Resilience, protection from tsunamis, and responses to global climate change. Estuar. Coast. Shelf Sci. 2008, 76, 1–13. [Google Scholar] [CrossRef]
  9. Alvarado-Barrientos, M.S.; López-Adame, H.; Lazcano-Hernández, H.E.; Arellano-Verdejo, J.; Hernández-Arana, H.A. Ecosystem-atmosphere exchange of CO2, water, and energy in a basin mangrove of the northeastern coast of the Yucatan Peninsula. J. Geophys. Res. Biogeosci. 2021, 126, e2020JG005811. [Google Scholar] [CrossRef]
  10. Zhu, X.D.; Sun, C.Y.; Qin, Z.C. Drought-induced salinity enhancement weakens mangrove greenhouse gas cycling. J. Geophys. Res. Biogeosci. 2021, 126, e2021JG006416. [Google Scholar] [CrossRef]
  11. Zhao, X.D.; Wang, C.L.; Li, T.T.; Zhang, C.Y.; Fan, X.W.; Zhang, Q.; Chen, X.Y.; Zou, X.K.; Shen, C.; Tang, Y.; et al. Net CO2 and CH4 emissions from restored mangrove wetland: New insights based on a case study in estuary of the Pearl River, China. Sci. Total Environ. 2021, 811, 151619. [Google Scholar] [CrossRef]
  12. Chen, Y.J.; Zheng, D.Z.; Liao, B.W.; Zheng, S.F.; Zan, Q.J.; Song, X.Y. Researches on typhoon damage to mangroves and preventive measures. For. Res. 2000, 13, 524–529. (In Chinese) [Google Scholar]
  13. Wang, Y.S.; Gu, J.D. Ecological responses, adaptation and mechanisms of mangrove wetland ecosystem to global climate change and anthropogenic activities. Int. Biodeterior. Biodegrad. 2021, 162, 105248. [Google Scholar] [CrossRef]
  14. Xu, Z.; Li, X.L.; Tian, P.P.; Huang, Y.T.; Zhu, Q.S.; Zou, H.M.; Huang, Y.; Zhang, Z.; Zhang, S.M.; Chen, M.N.; et al. Global warming potentials of CO2 uptake, CH4 emissions, and albedo changes in a restored mangrove ecosystem. J. Geophys. Res. Biogeosci. 2024, 129, e2023JG007924. [Google Scholar] [CrossRef]
  15. Liu, J.G.; Schäfer, K.V.R.; Lai, D.Y.F. Biosphere-atmosphere exchange of CO2 and CH4 in mangrove forests and salt marshes. In Carbon Mineralization in Coastal Wetlands; Ouyang, X., Lee, S.Y., Lai, D.Y.F., Marchand, C., Eds.; Elsevier: Amsterdam, The Netherlands, 2022; Volume 2, pp. 93–132. [Google Scholar]
  16. Lai, D.Y.F.; Liu, J.G. (2016–2018) FLUXNET-CH4 HK-MPM Mai Po Mangrove, Dataset. Available online: https://fluxnet.org/doi/FLUXNET-CH4/HK-MPM (accessed on 3 July 2025).
  17. Wutzler, T.; Lucas-Moffat, A.; Migliavacca, M.; Knauer, J.; Sickel, K.; Šigut, L.; Menzer, O.; Reichstein, M. Basic and extensible post-processing of eddy covariance flux data with REddyProc. Biogeosciences 2018, 15, 5015–5030. [Google Scholar] [CrossRef]
  18. Liu, J.G.; Lai, D.Y.F. Subtropical mangrove wetland is a stronger carbon dioxide sink in the dry than wet seasons. Agric. For. Meteorol. 2019, 278, 107644. [Google Scholar] [CrossRef]
  19. Chen, H.; Lu, W.; Yan, G.; Yang, S.; Lin, G. Typhoons exert significant but differential impacts on net ecosystem carbon exchange of subtropical mangrove forests in China. Biogeosciences 2014, 11, 5323–5333. [Google Scholar] [CrossRef]
  20. Baldocchi, D.D. Assessing the eddy covariance technique for evaluating carbon dioxide exchange rates of ecosystems: Past, present and future. Glob. Change Biol. 2003, 9, 479–492. [Google Scholar] [CrossRef]
  21. Dang, C.; Morrissey, E.M.; Neubauer, S.C.; Franklin, R.B. Novel microbial community composition and carbon biogeochemistry emerge over time following saltwater intrusion in wetlands. Glob. Change Biol. 2018, 25, 549–561. [Google Scholar] [CrossRef]
  22. Smith, R.S.; Beauvais, J.; Byers, J.E. Traits of resident saltmarsh plants promote retention of range-expanding mangroves under specific tidal regimes. Estuaries Coasts 2021, 45, 1422–1433. [Google Scholar] [CrossRef]
  23. Reed, D.; Chavez, S.; Castañeda-Moya, E.; Oberbauer, S.F.; Troxler, T.; Malone, S. Resilience to hurricanes is high in mangrove blue carbon forests. Glob. Change Biol. 2025, 31, e7024. [Google Scholar] [CrossRef]
  24. Krauss, K.W.; Osland, M.J. Tropical cyclones and the organization of mangrove forests: A review. Ann. Bot. 2020, 125, 213–234. [Google Scholar] [CrossRef]
  25. Peereman, J.; Hogan, J.A.; Lin, T. Disturbance frequency, intensity and forest structure modulate cyclone-induced changes in mangrove forest canopy cover. Glob. Ecol. Biogeogr. 2022, 31, 37–50. [Google Scholar] [CrossRef]
  26. Lagomasino, D.; Fatoyinbo, T.; Castañeda-Moya, E.; Cook, B.D.; Montesano, P.M.; Neigh, C.S.R.; Corp, L.A.; Ott, L.E.; Chavez, S.; Morton, D.C. Storm surge and ponding explain mangrove dieback in southwest Florida following Hurricane Irma. Nat. Commun. 2021, 12, 4003. [Google Scholar] [CrossRef] [PubMed]
  27. Xiong, L.; Lagomasino, D.; Charles, S.P.; Castañeda-Moya, E.; Cook, B.D.; Redwine, J.; Fatoyinbo, L. Quantifying mangrove canopy regrowth and recovery after Hurricane Irma with large-scale repeat airborne lidar in the Florida Everglades. Int. J. Appl. Earth Obs. Geoinf. 2022, 114, 103031. [Google Scholar] [CrossRef]
  28. Quebbeman, A.W.; Menge, D.N.L.; Arellano, G.; Hall, J.; Wood, T.E.; Zimmerman, J.K.; Uriarte, M. A severe hurricane increases carbon dioxide and methane fluxes and triples nitrous oxide emissions in a tropical forest. Ecosystems 2022, 25, 1754–1766. [Google Scholar] [CrossRef]
  29. Li, X.; Tang, C.Y.; Cao, Y.J.; Li, X. Carbon, nitrogen and sulfur isotopic features and the associated geochemical processes in a coastal aquifer system of the Pearl River Delta, China. J. Hydrol. 2019, 575, 986–998. [Google Scholar] [CrossRef]
  30. Jaffé, R.; Elismé, T.; Cabrera, A.C. Organic geochemistry of seasonally flooded rain forest soils: Molecular composition and early diagenesis of lipid components. Org. Geochem. 1996, 25, 9–17. [Google Scholar] [CrossRef]
  31. Li, X.Y.; Cheng, X.Y.; Cheng, K.K.; Cai, Z.H.; Feng, S.Y.; Zhou, J. The influence of tide-brought nutrients on microbial carbon metabolic profiles of mangrove sediments. Sci. Total Environ. 2024, 906, 167732. [Google Scholar] [CrossRef]
  32. Craig, H.; Antwis, R.E.; Cordero, I.; Ashworth, D.; Robinson, C.H.; Osborne, T.Z.; Bardgett, R.D.; Rowntree, J.K.; Simpson, L.T. Nitrogen addition alters composition, diversity, and functioning of microbial communities in mangrove soils: An incubation experiment. Soil Biol. Biochem. 2021, 153, 108076. [Google Scholar] [CrossRef]
  33. Wei, P.P.; Lei, A.P.; Zhou, H.C.; Hu, Z.L.; Wong, Y.S.; Tam, N.F.Y.; Lu, Q. Comparison of microbial community structure and function in sediment between natural regenerated and original mangrove forests in a National Nature Mangrove Reserve, South China. Mar. Pollut. Bull. 2021, 163, 111955. [Google Scholar] [CrossRef]
  34. Yang, Y.H.; Shi, Y.; Sun, W.J.; Chang, J.F.; Zhu, J.X.; Chen, L.Y.; Wang, X.; Guo, Y.P.; Zhang, H.T.; Yu, L.F.; et al. Terrestrial carbon sinks in China and around the world and their contribution to carbon neutrality. Sci. China Life Sci. 2022, 65, 861–895. [Google Scholar] [CrossRef] [PubMed]
  35. Xia, H.Y.; Jiang, H.L.; Zhang, C.H.; Xu, J.Y.; Xu, X.; Zhang, T.; Huang, Y.Q.; Xu, X.Q.; Zhao, Y.R.; Hu, Y.H.; et al. Light saturation and temperature jointly dominate the diurnal variation of net ecosystem exchange in grassland ecosystems. Ecol. Indic. 2024, 168, 112737. [Google Scholar] [CrossRef]
  36. Barr, J.G.; Fuentes, J.D.; Engel, V.; Zieman, J.C. Physiological responses of red mangroves to the climate in the Florida Everglades. J. Geophys. Res. Biogeosci. 2009, 114, G02008. [Google Scholar] [CrossRef]
  37. Cheeseman, J.M.; Lovelock, C.E. Photosynthetic characteristics of dwarf and fringe Rhizophora mangle L. in a Belizean mangrove. Plant Cell Environ. 2004, 27, 769–780. [Google Scholar] [CrossRef]
  38. Yao, H.M.; Montagna, P.A.; Wetz, M.S.; Staryk, C.J.; Hu, X.P. Subtropical estuarine carbon budget under various hydrologic extremes and implications on the lateral carbon exchange from tidal wetlands. Water Res. 2022, 217, 118436. [Google Scholar] [CrossRef]
  39. Barr, J.G.; Engel, V.; Fuentes, J.D.; Zieman, J.C.; O’Halloran, T.L.; Smith, T.J.; Anderson, G.H. Controls on mangrove forest-atmosphere carbon dioxide exchanges in western Everglades National Park. J. Geophys. Res. Biogeosci. 2010, 115, G02020. [Google Scholar] [CrossRef]
  40. Li, Q.; Lu, W.; Chen, H.; Luo, Y.; Lin, G. Differential responses of net ecosystem exchange of carbon dioxide to light and temperature between spring and neap tides in subtropical mangrove forests. Sci. World J. 2014, 2014, 943697. [Google Scholar] [CrossRef]
  41. Nuria, G.; Nicholas, J.D.; Evan, H.D.; Elena, B.; Elizabeth, H.B.; Jed, S.; Carl, J.B. Seasonal controls of CO2 and CH4 dynamics in a temporarily flooded subtropical wetland. J. Geophys. Res. Biogeosci. 2020, 125, e2019JG005257. [Google Scholar] [CrossRef]
  42. Yu, H.; Organ, H.; Xu, D.; Coffin, R. Tidal control and mangrove dieback impact on methane emissions from a subtropical mangrove estuary. Limnol. Oceanogr. 2023, 68, 753–766. [Google Scholar] [CrossRef]
  43. Mitsch, W.J.; Bernal, B.; Nahlik, A.M.; Mander, Ü.; Zhang, L.; Anderson, C.J.; Jørgensen, S.E.; Brix, H. Wetlands, carbon, and climate change. Landsc. Ecol. 2013, 28, 583–597. [Google Scholar] [CrossRef]
Figure 1. Flux tower location (denoted by red triangle) of restored (PYR) and natural (HK) mangrove forest.
Forests 16 01115 g001
Figure 2. Storm surge tracks. Red stars denote EC sites ((a) PYR site; (b) HK site), and curves represent storm surge paths. Labels indicate the international cyclone numbers and names (This figure is generated by Python 3.8 using the Basemap module).
Forests 16 01115 g002
Figure 3. Daily mean variations of NEE (blue bar) and CH4 (yellow bar) flux at restored (PYR site, (a)) and natural (HK site, (b)) mangrove forests. The red text indicates the number, name, and landfall date of each storm surge.
Forests 16 01115 g003
Figure 4. Distribution of (a) NEE, (b) Reco, (c) GPP, and (d) CH4 flux at two mangrove sites—PYR (restored mangrove forest, blue bar) and HK (natural mangrove forest, orange bar)—across three storm surge phases: before, during, and after. Different lowercase letters indicate significant differences between phases within each site (p < 0.01). Letters for PYR (a–c) and HK (d–f) are assigned independently.
Forests 16 01115 g004
Figure 5. Violin plots showing the distributions of environmental factors—photosynthetic photon flux density ((a), PPFD), air temperature ((b), TA), soil temperature ((c), TS), vapor pressure deficit ((d), VPD), relative humidity ((e), RH), and wind speed ((f), WS)—at a natural mangrove site (HK) and a restored mangrove site (PYR) during three stages of a storm surge (before, during, and after). Distributions are split by site ((left), PYR; (right), HK), with embedded boxplots indicating medians and interquartile ranges.
Forests 16 01115 g005
Figure 6. Correlation coefficients between half-hourly environmental variables and fluxes at restored ((ac), PYR site) and natural ((df), HK site) mangrove forest in pre-storm ((a,d)), during-storm ((b,e)), and post-storm ((c,f)). *** indicates p < 0.001, ** indicates p < 0.01, and * indicates p < 0.05.
Forests 16 01115 g006
Figure 7. Findings from the path analysis investigating the relationships between half-hourly environmental variables and fluxes at restored ((ac), PYR site) and natural ((df), HK site) mangrove forests in pre-storm ((a,d)), during-storm ((b,e)), and post-storm ((c,f)). Red lines represent positive effects, and blue lines represent negative effects. ** indicates p < 0.001 and * indicates p < 0.01.
Forests 16 01115 g007
Figure 8. NEE response curves to (a) air temperature (TA), (b) photosynthetic photon flux density (PPFD), (c) vapor pressure deficit (VPD), and (d) relative humidity (RH) at the HK site. The red, blue, and yellow curves indicate the fitted trends corresponding to the pre-storm surge, during-storm surge, and post-storm surge periods, respectively.
Forests 16 01115 g008
Figure 9. NEE response curves to (a) air temperature (TA), (b) photosynthetic photon flux density (PPFD), (c) vapor pressure deficit (VPD), and (d) relative humidity (RH) at the PYR site. The red, blue, and yellow curves indicate the fitted trends corresponding to the pre-storm surge, during-storm surge, and post-storm surge periods, respectively.
Forests 16 01115 g009
Table 1. Abbreviations and descriptions of fluxes and biophysical variables at two sites.
AbbreviationsParameters DescriptionUnits
NEENet ecosystem CO2 exchange μmol m−2 s−1
GPPGross primary productivityμmol m−2 s−1
RecoEcosystem respirationμmol m−2 s−1
CH4Flux of methaneμmol m−2 s−1
VPDVapor pressure deficithPa
RHRelative humidity%
TAAir temperature°C
WSWind speedm/s
PPFDPhotosynthetic photon flux densityμmol m−2 s−1
TSSoil temperature°C
WTDWater table depthm
Table 2. Characteristics of storm surges that landed near the Pingyang (PYR) and Hong Kong SAR (HK) sites during 2020–2022 and 2016–2018. The time, wind speed, minimum distance (min_distance), and duration denote the observational data captured at the EC site positioned nearest to the trajectory of the storm surge event.
International NumberNameTime
(yyyy–mm–dd hh:mm)
Wind Speed (m/s)Min_Distance
(km)
Duration (Hour)
PYR site
2004Hagupit2020-08-04 02:003857.68108
2106In-Fa2021-07-25 14:0038311.86234
2114Chanthu2021-09-13 01:0050242.23261
2212Uifa2022-09-14 14:0048249.03202
HK site
1604Nida2016-08-02 06:003311.584
1622Haima2016-10-21 13:0042114.89162
1702Merbok2017-06-12 22:002544.0745
1713Hato2017-08-23 10:004877.85111
1714Pakhar2017-08-27 08:003399.0878
1822Mangkhut2018-09-16 14:0048123.52237
1823Barijat2018-09-12 17:0023166.1278
Disclaimer/Publisher’s Note: The statements, opinions and data contained in all publications are solely those of the individual author(s) and contributor(s) and not of MDPI and/or the editor(s). MDPI and/or the editor(s) disclaim responsibility for any injury to people or property resulting from any ideas, methods, instructions or products referred to in the content.

