
Pedunculate Oak (Quercus robur L.) Crown Defoliation as an Indicator of Timber Value


Abstract
1. Introduction
2. Materials and Methods
2.1. Sample Preparation
2.2. Quantity and Quality Determination
2.3. Data Processing
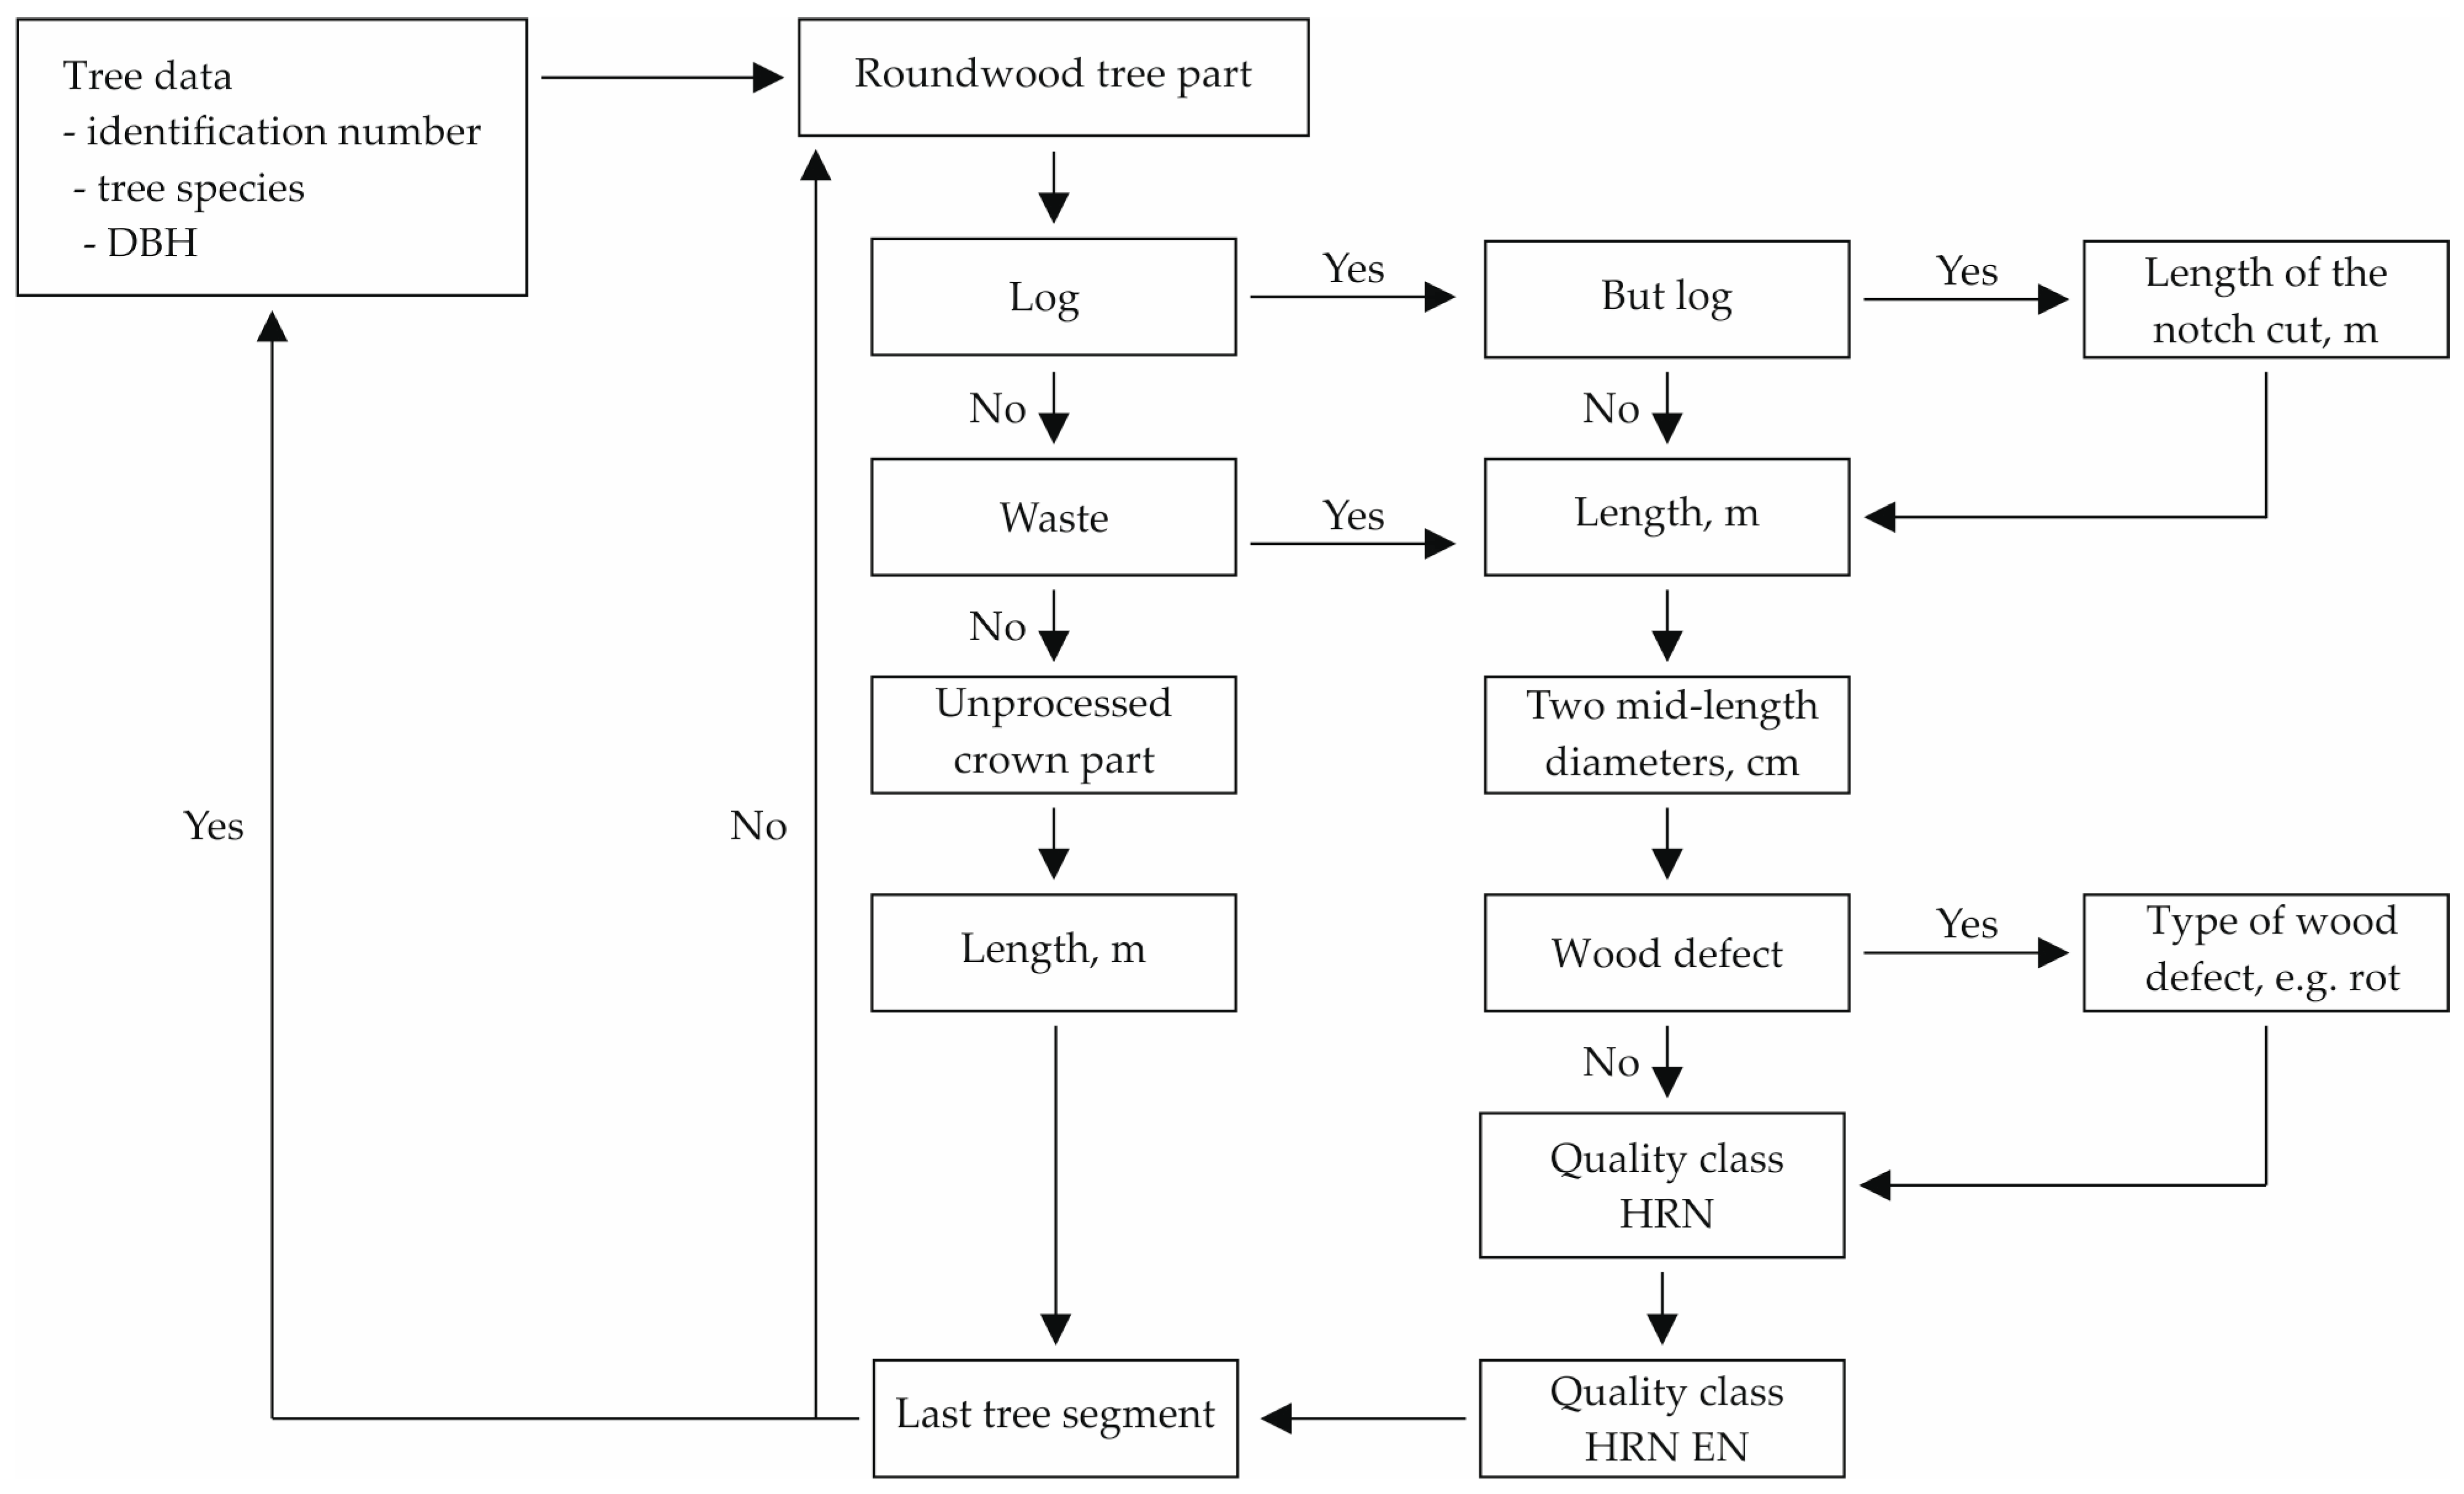
2.3.1. Processing of Collected Data
2.3.2. Calculation of Expected Harvesting Volume and Value
2.3.3. Data Analysis
3. Results
3.1. Gross and Net Volume
3.2. Round Timber Features
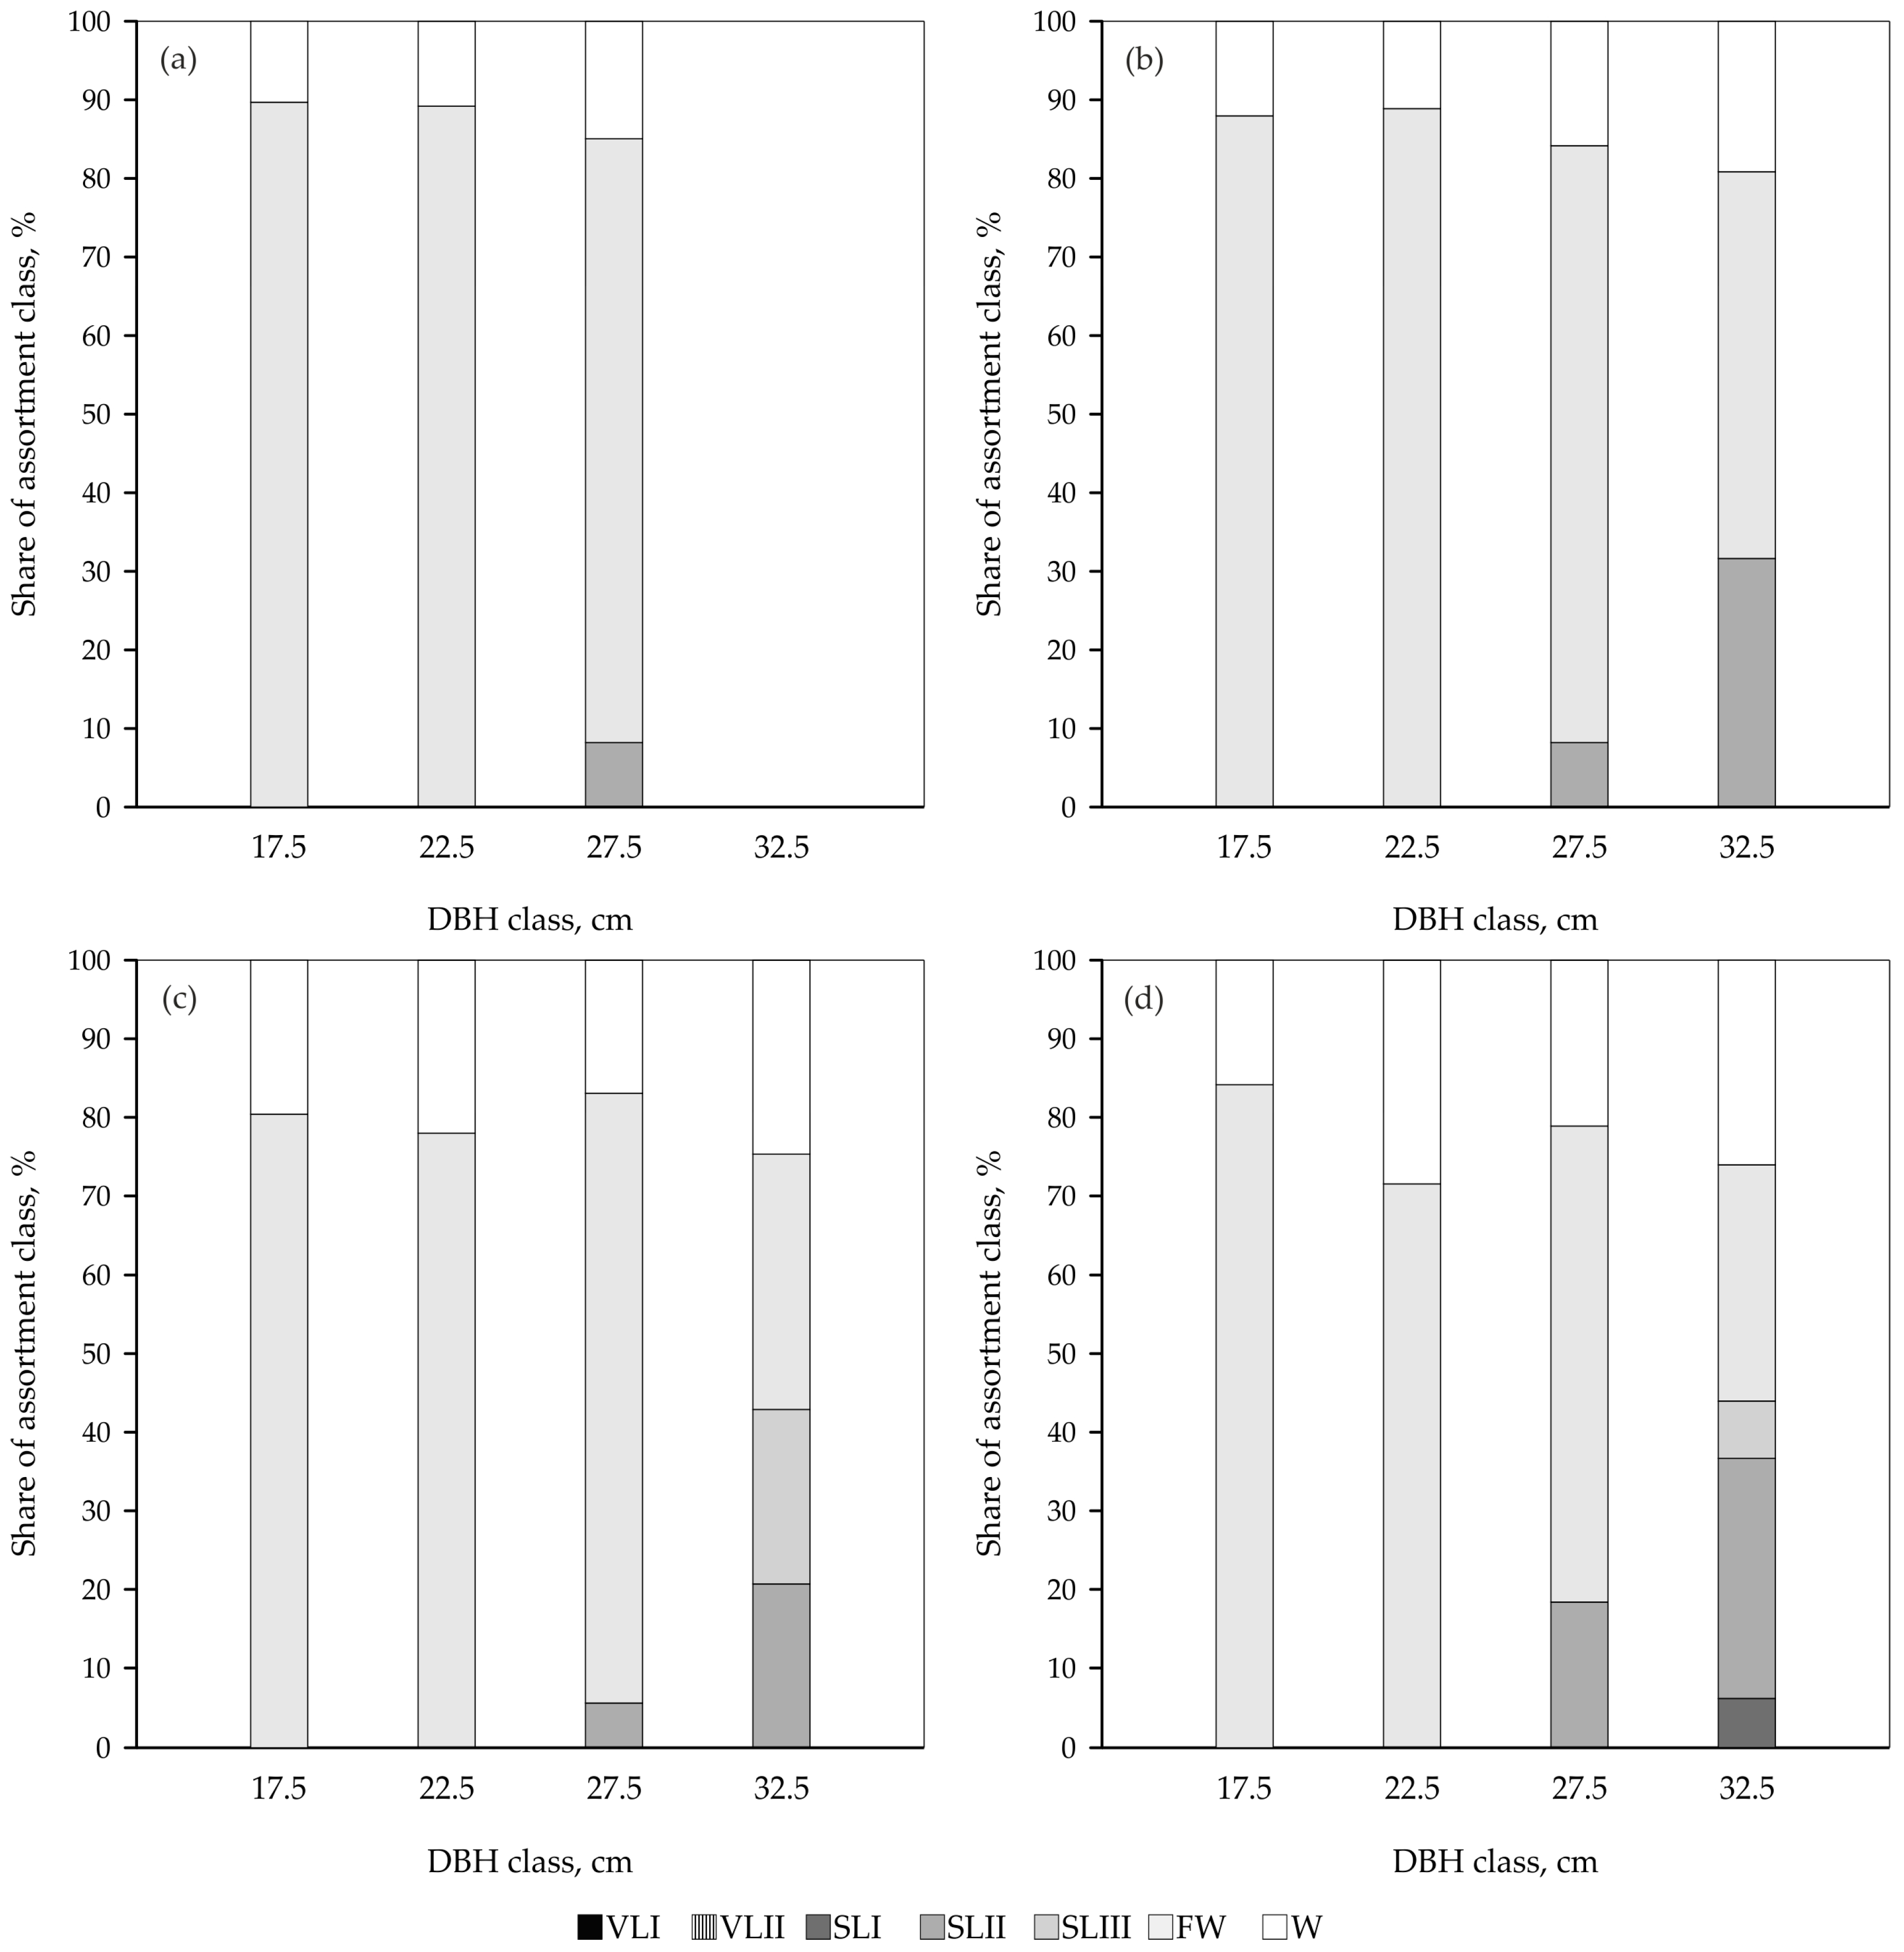
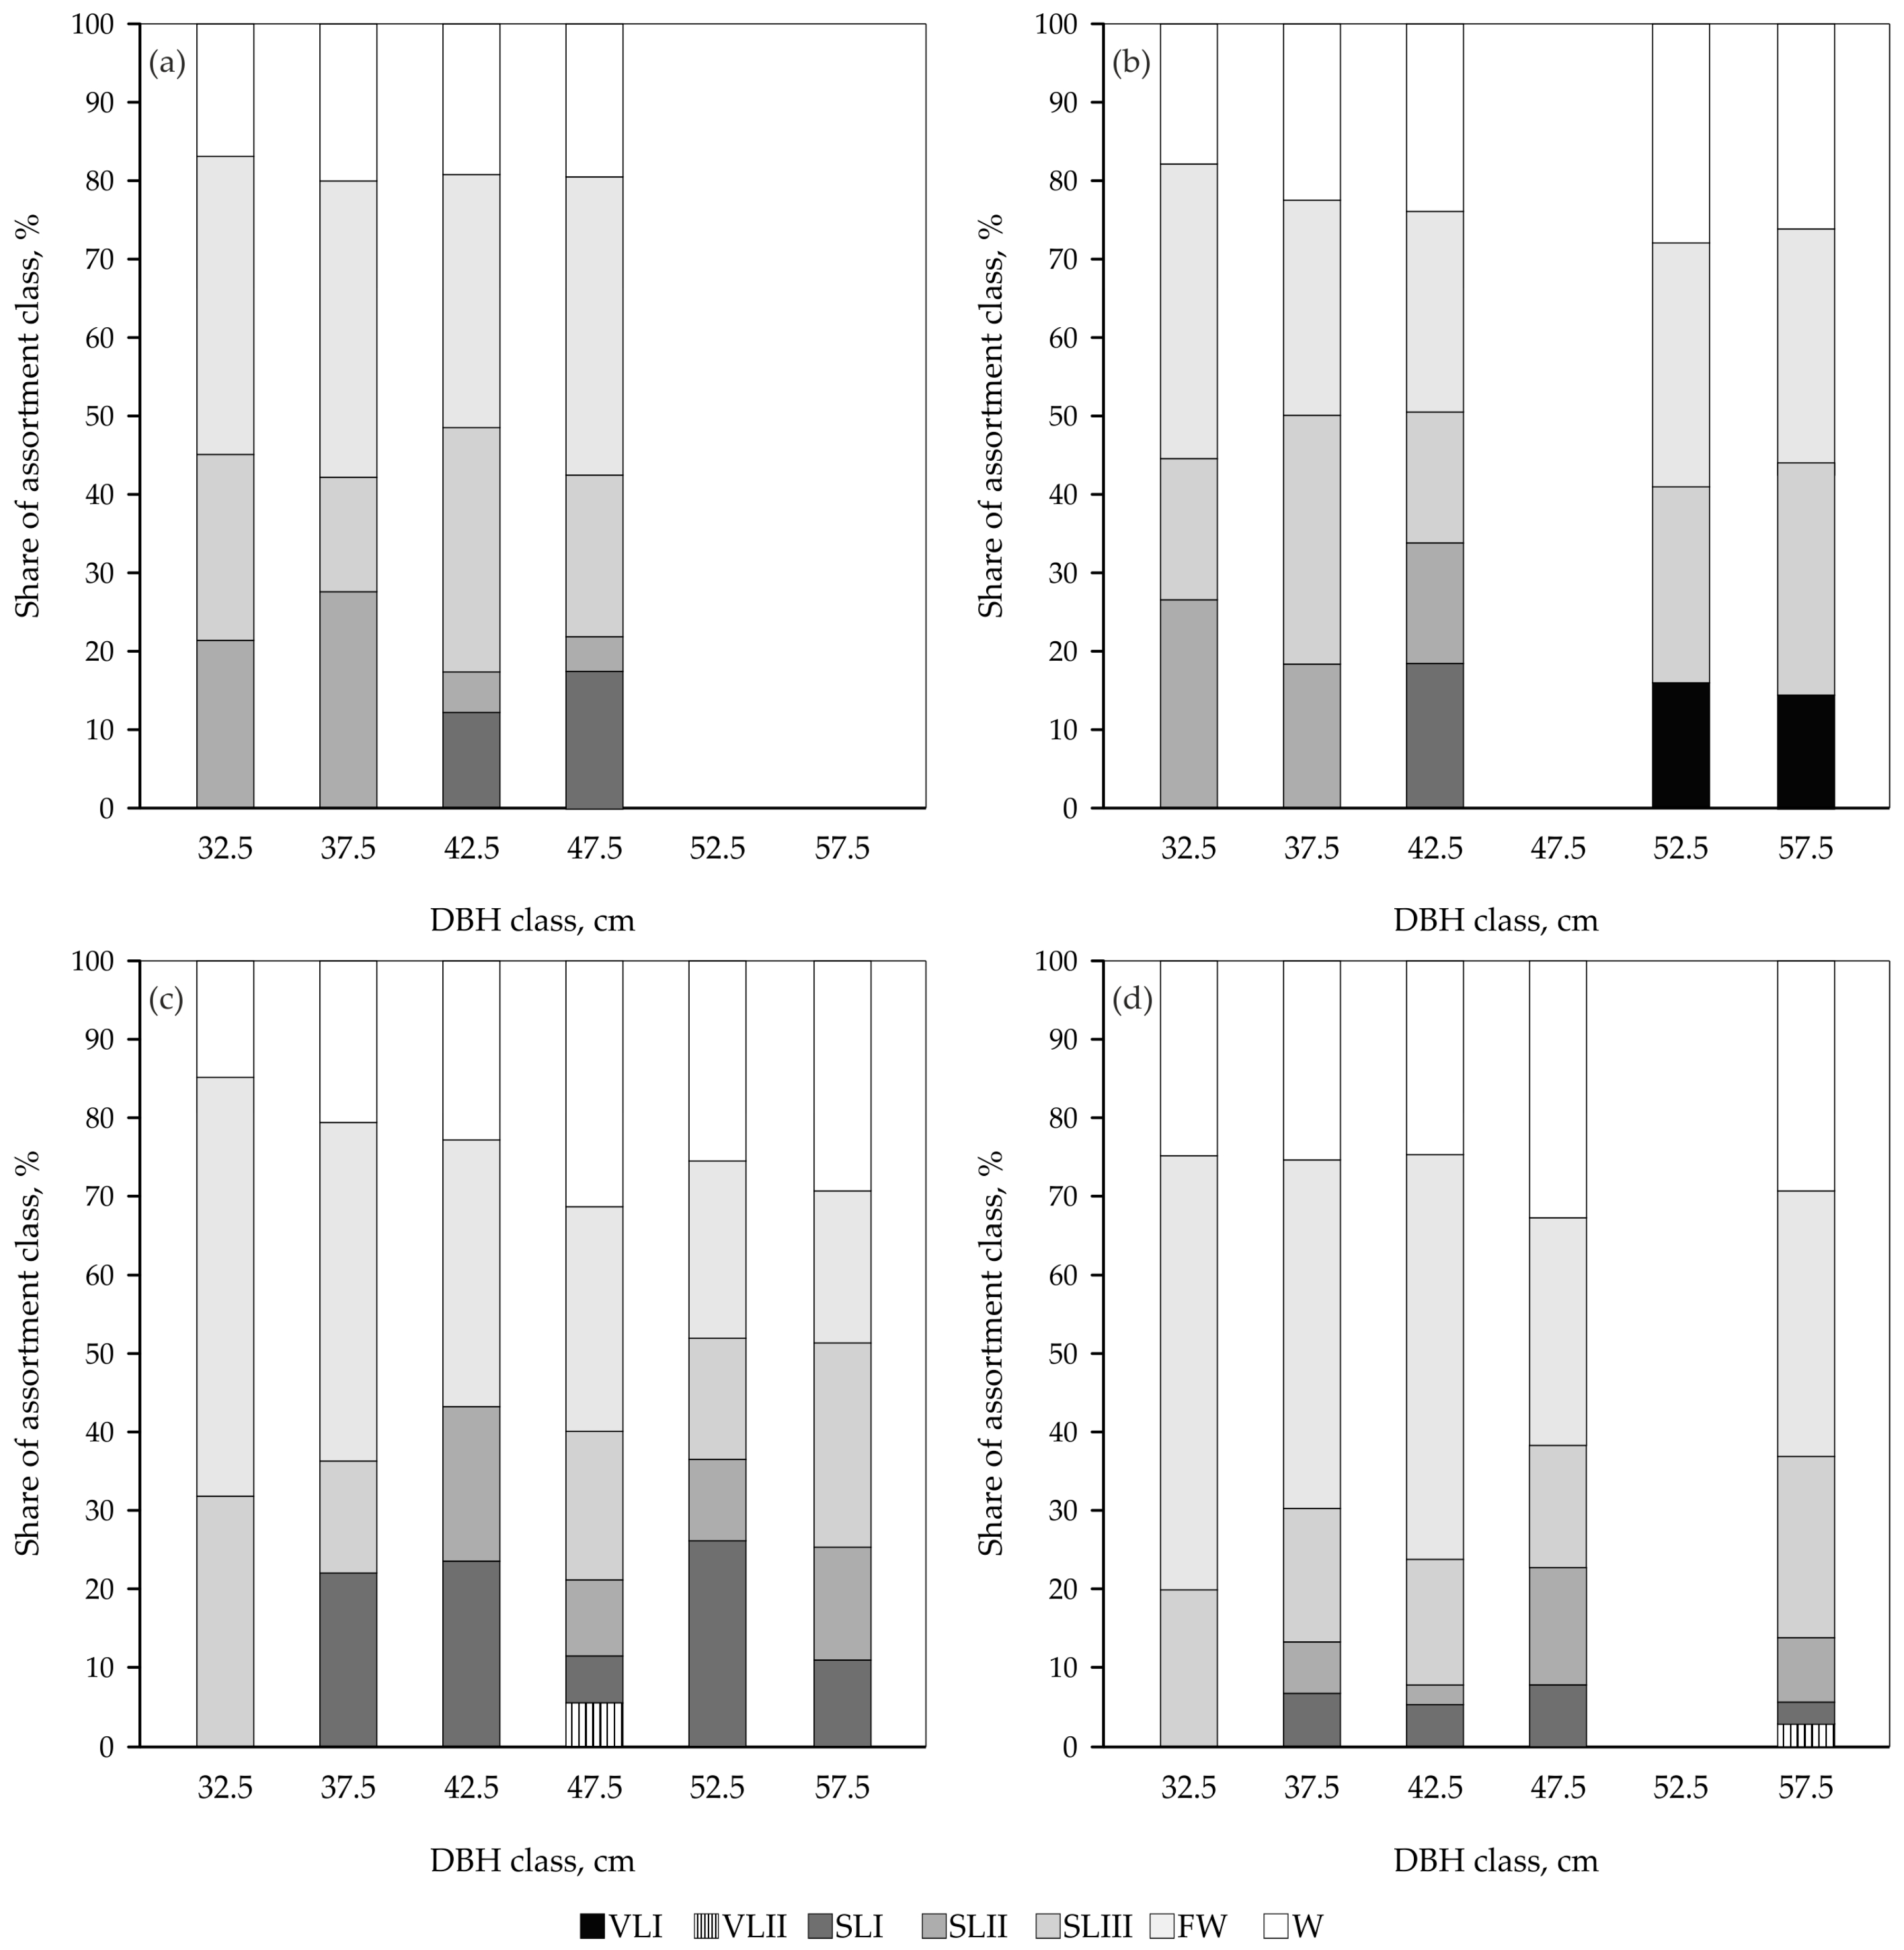
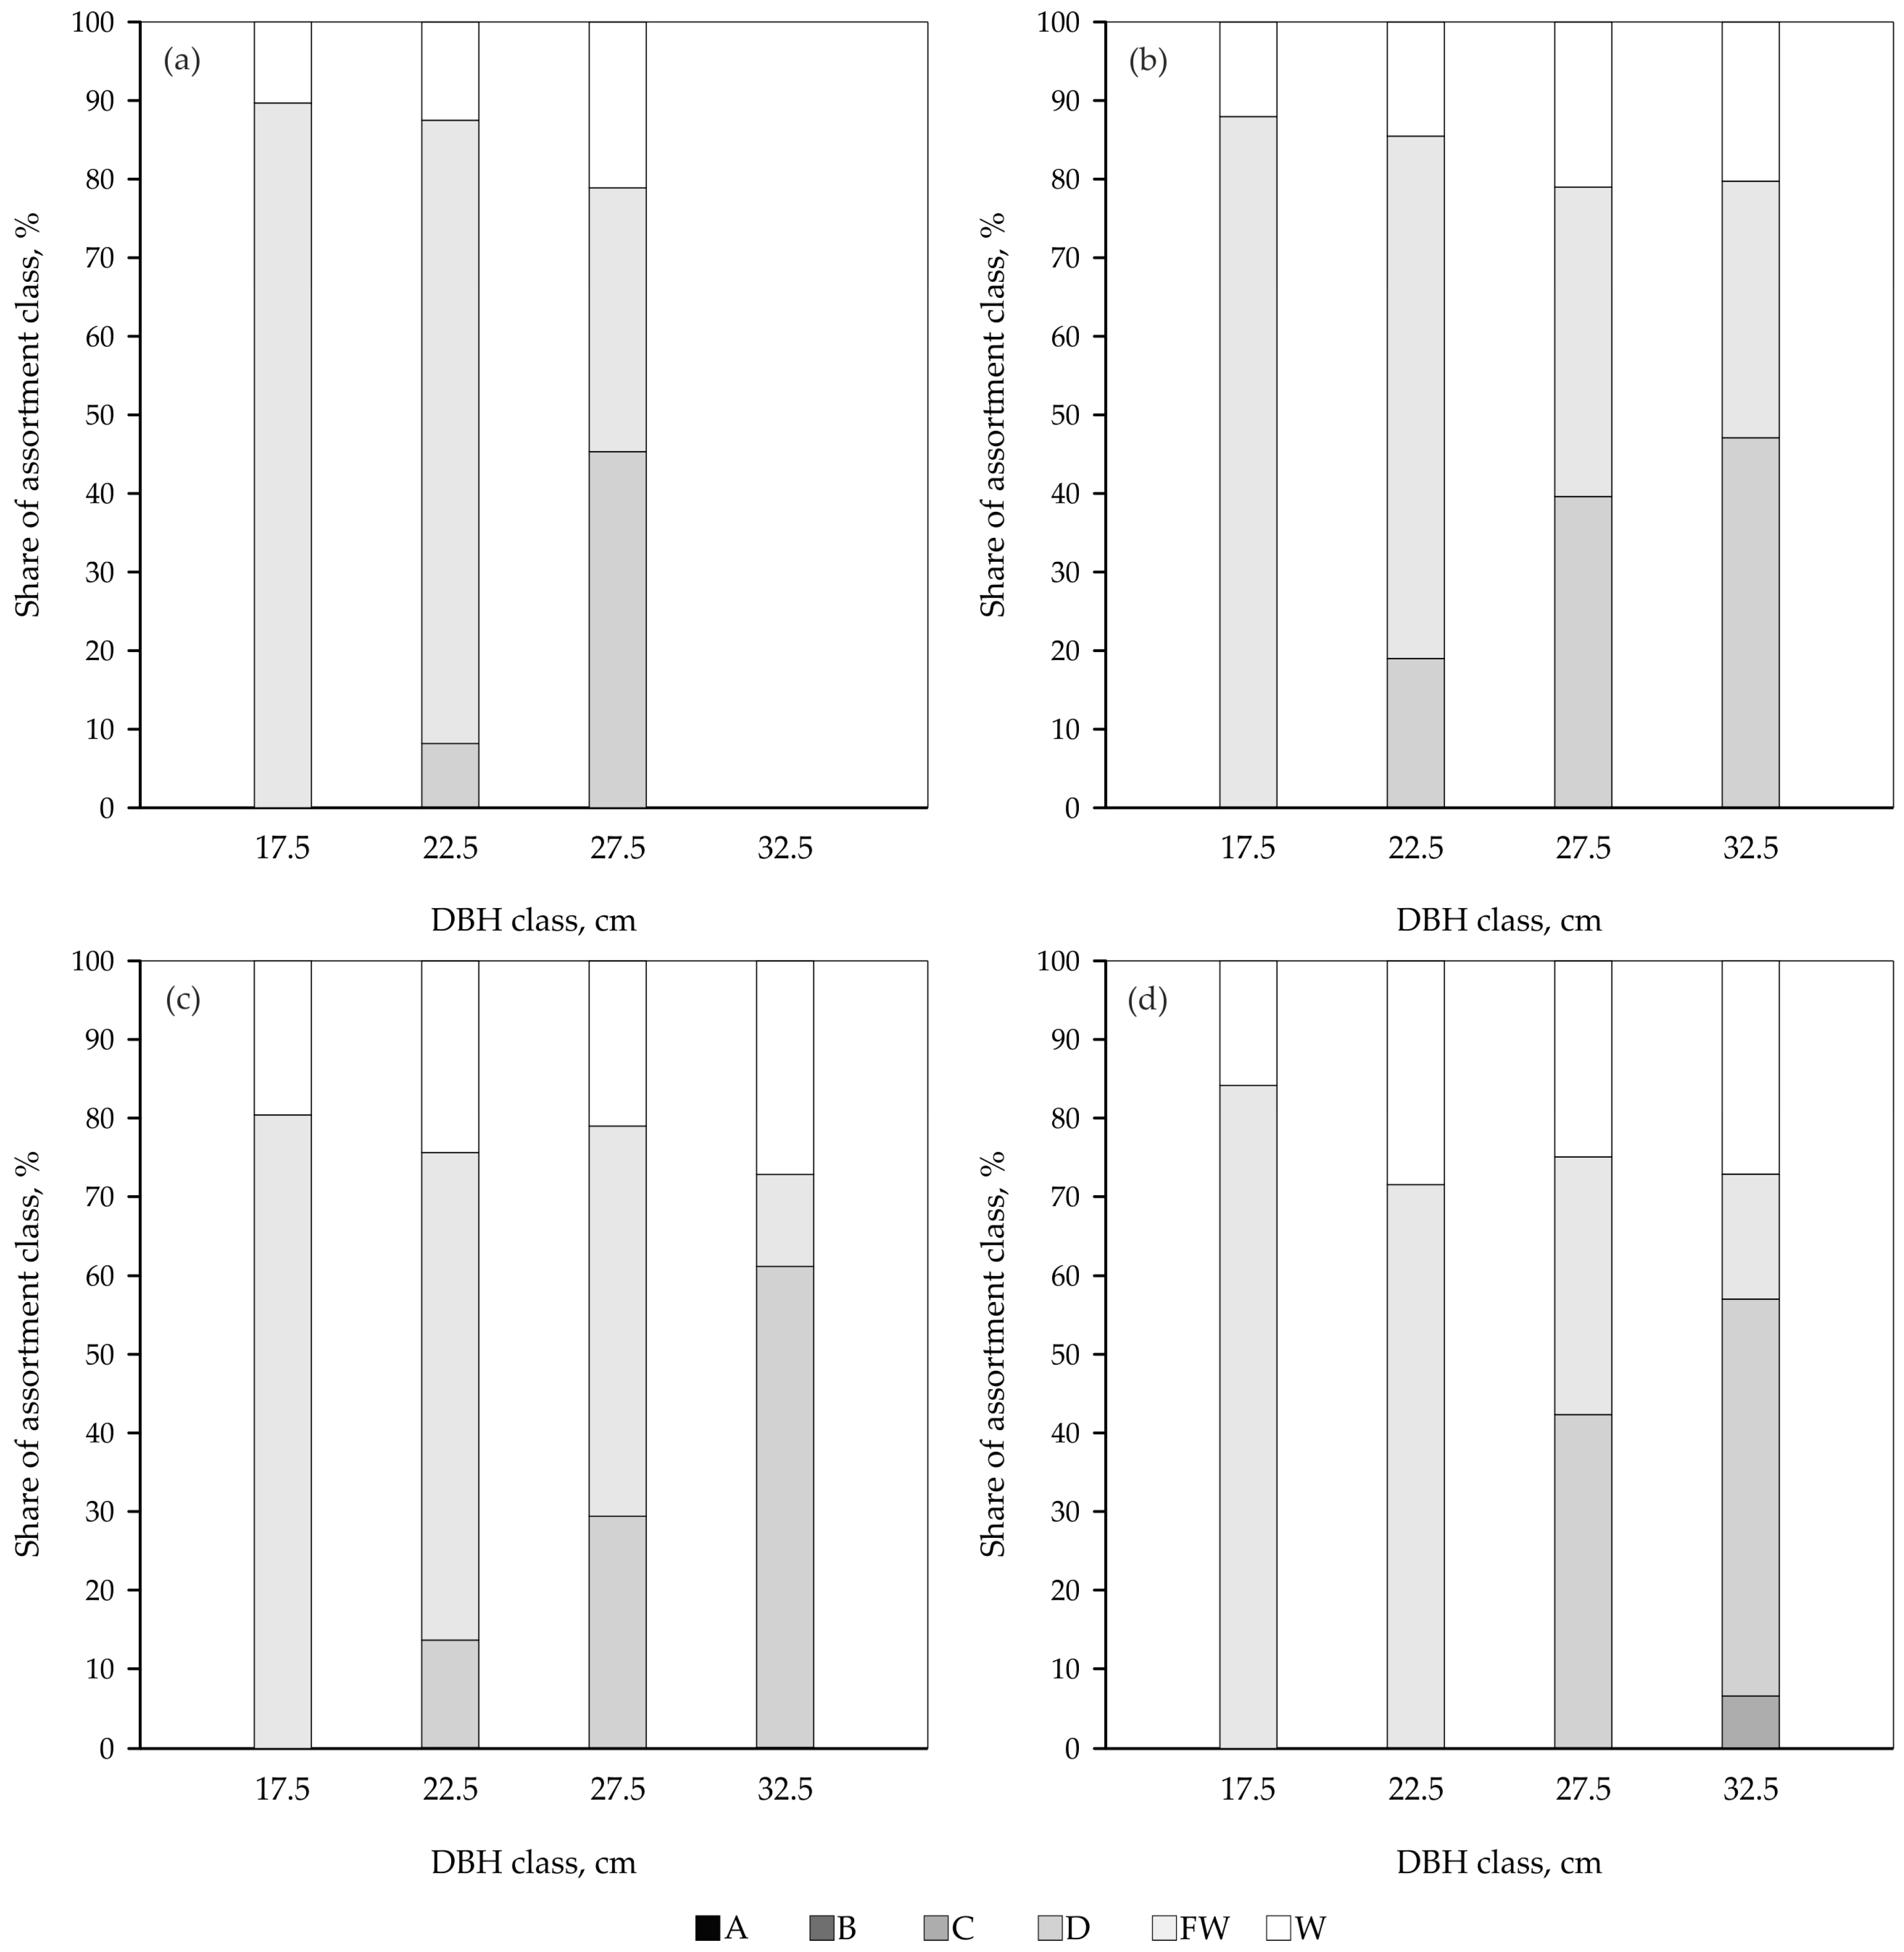
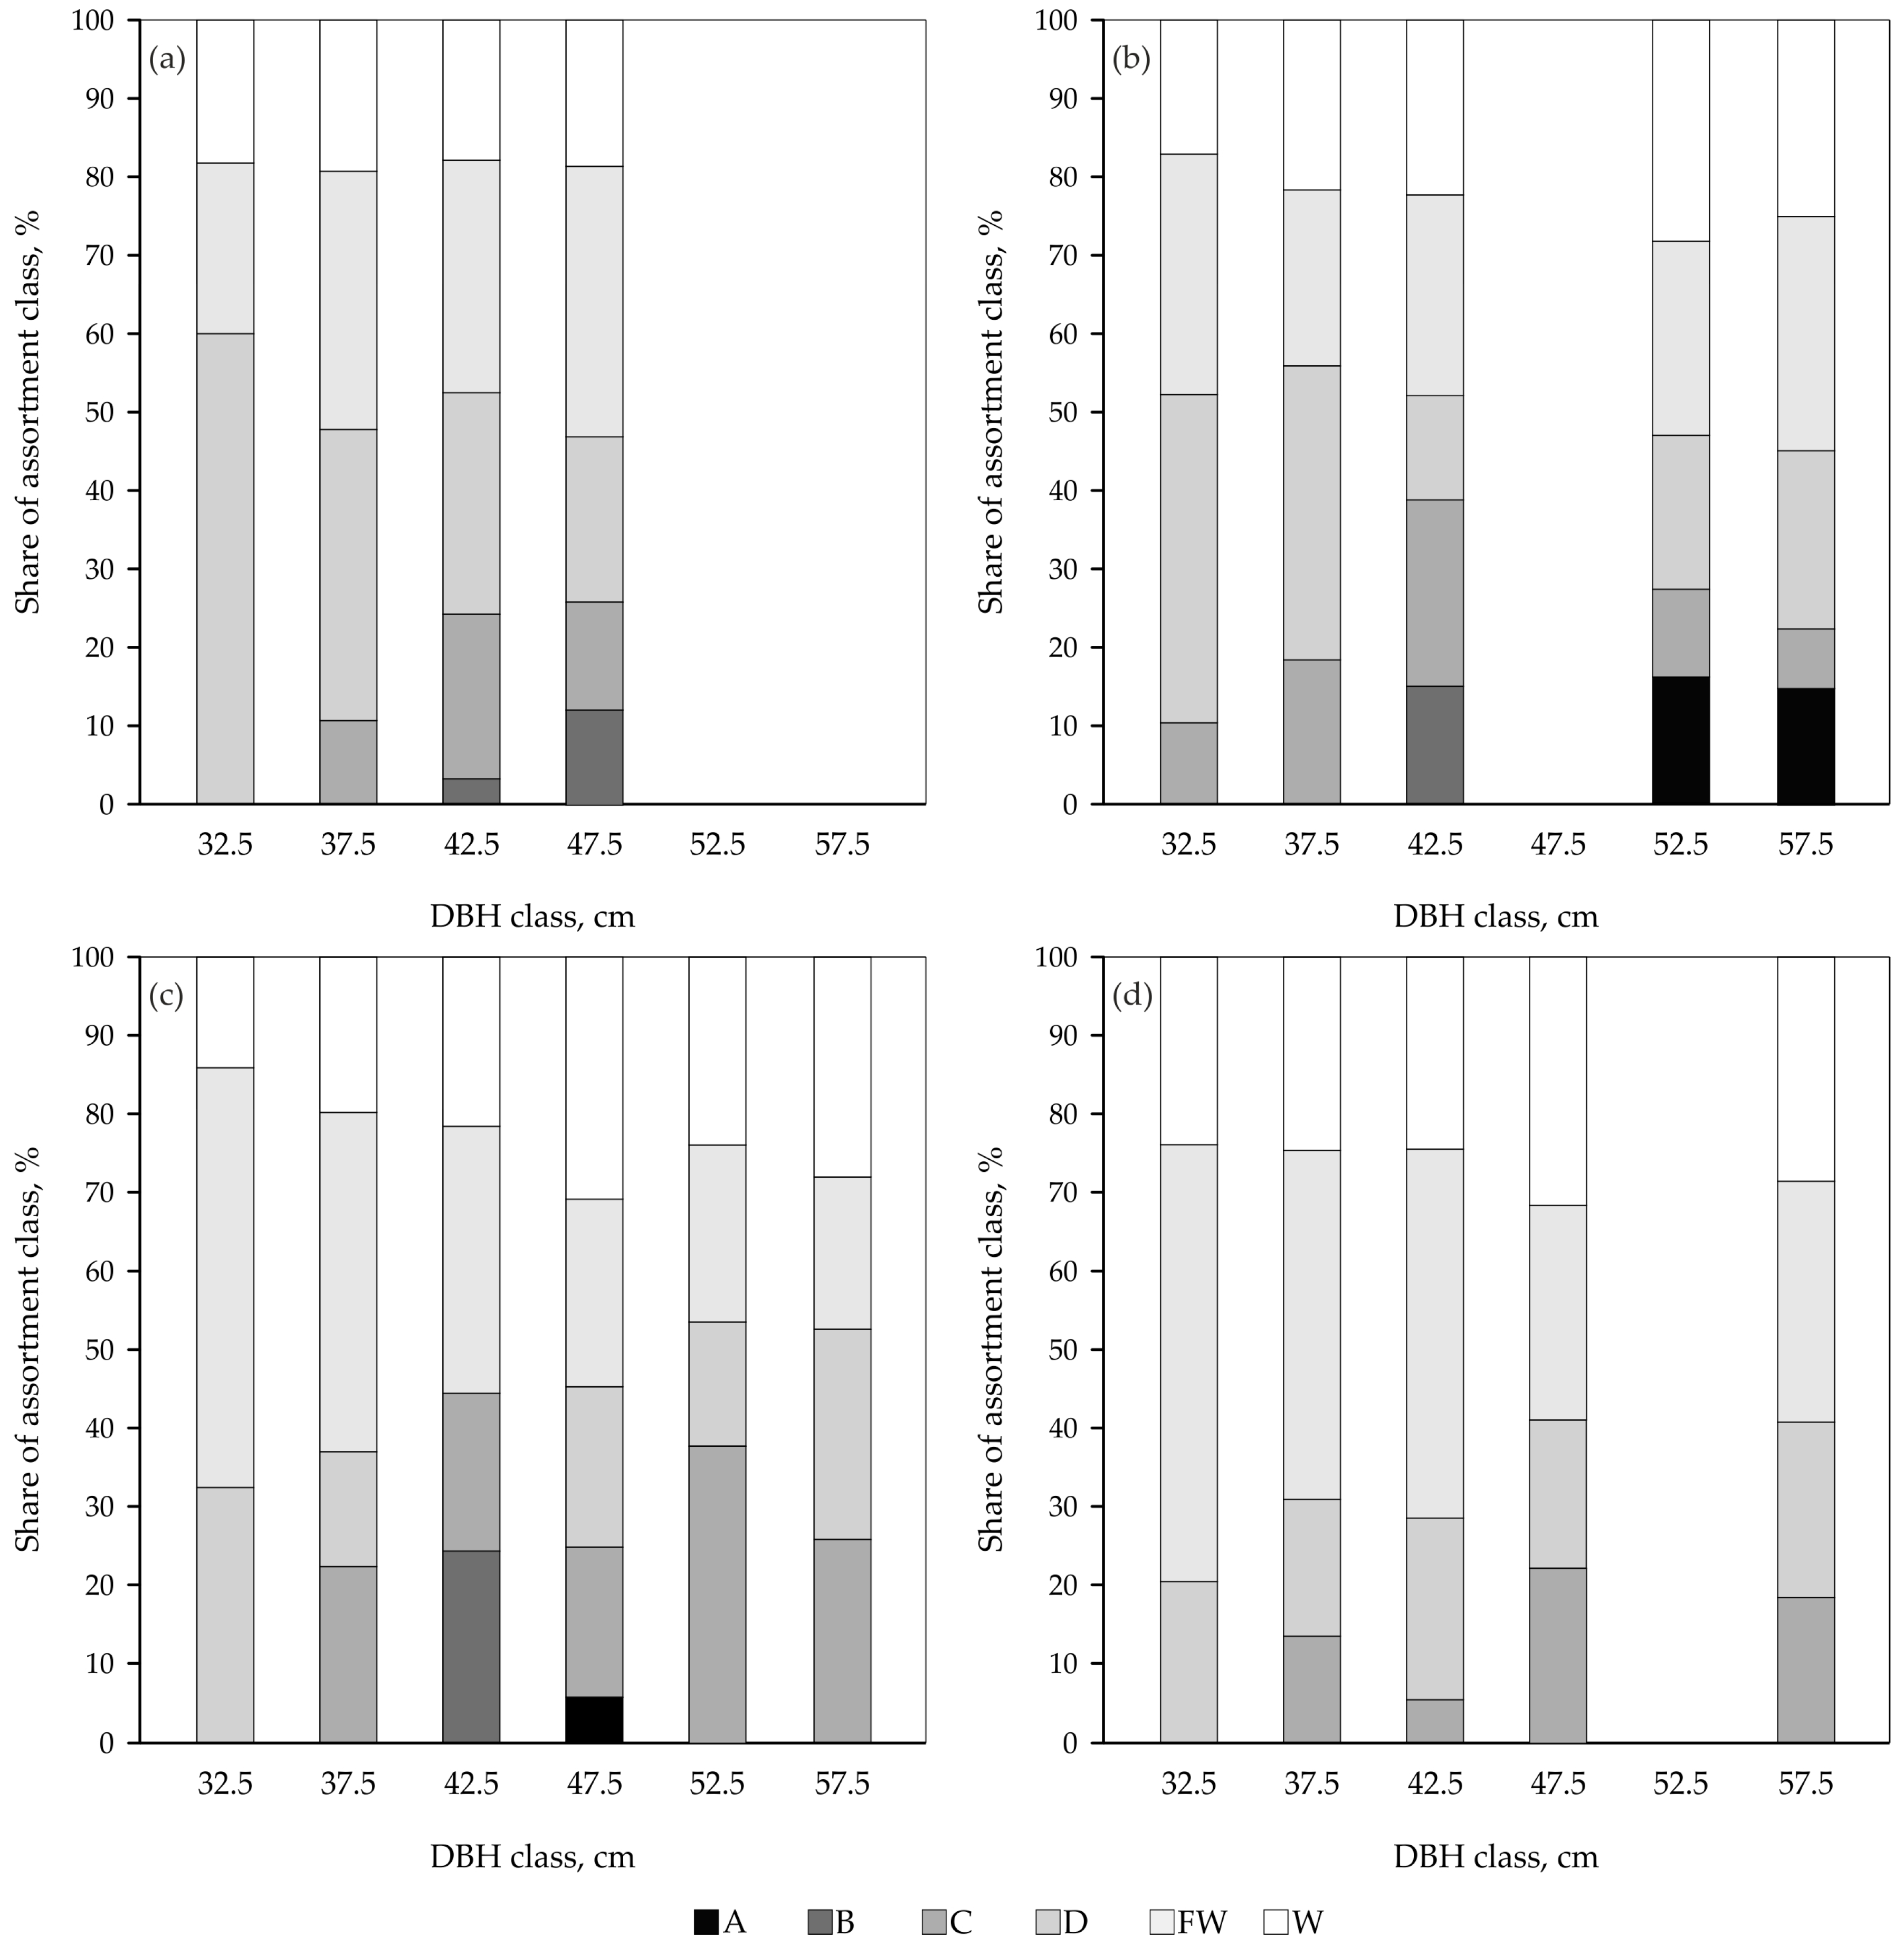
3.3. Assortment Structure
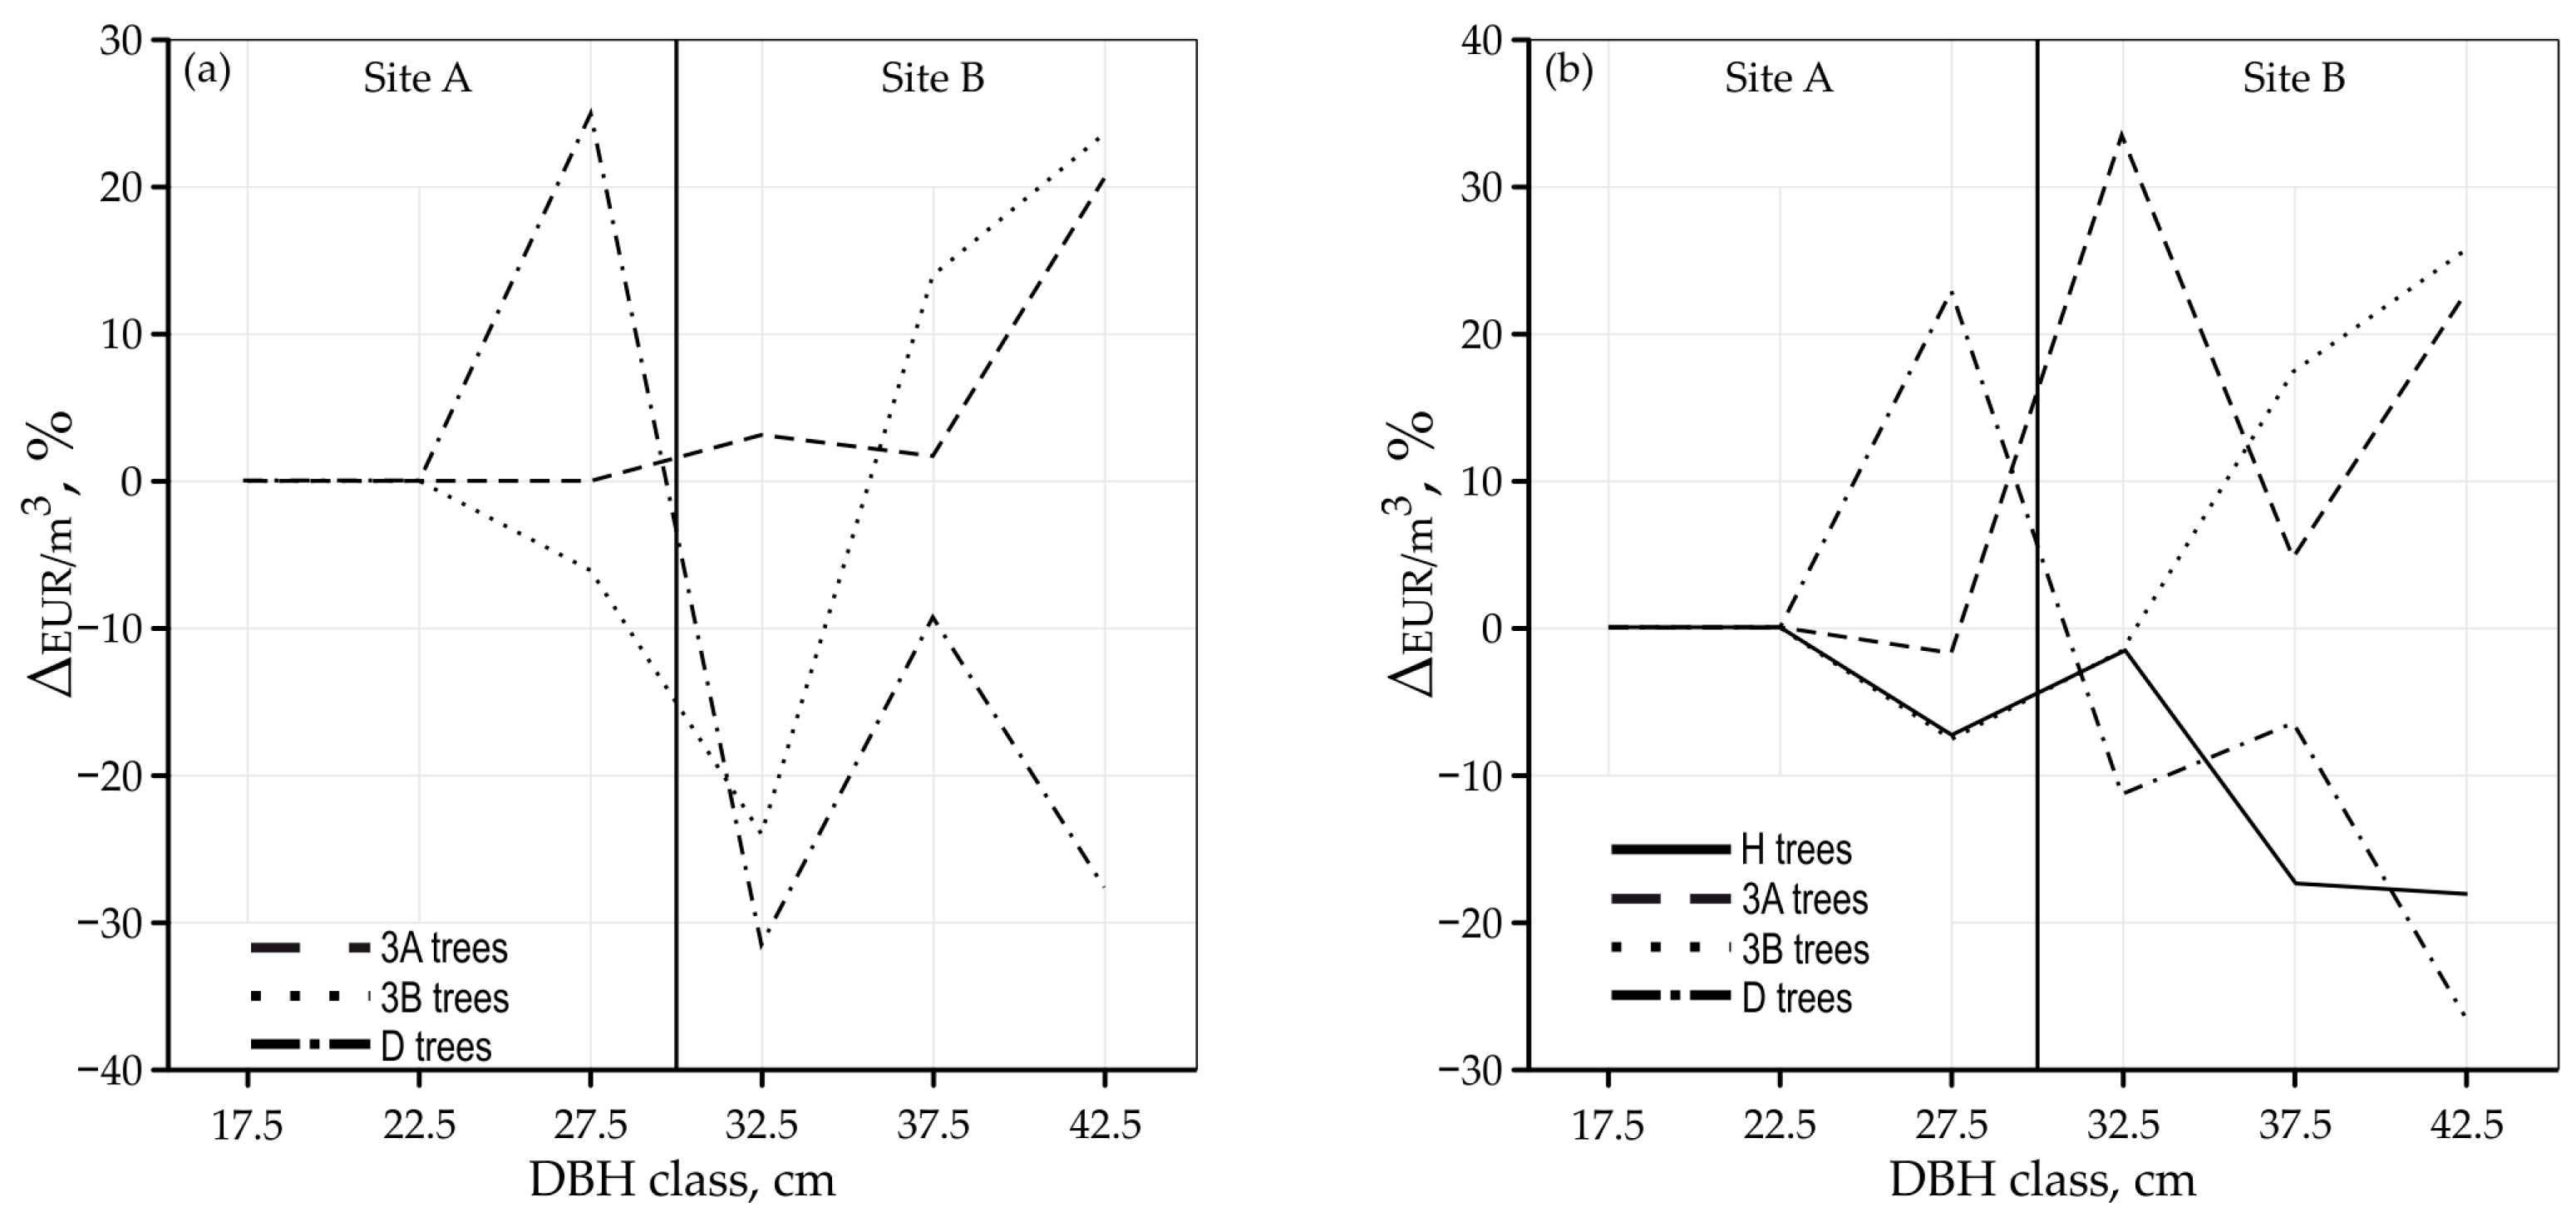
3.4. Average Tree Value
4. Discussion
5. Conclusions
- (a)
- The literature review indicates a knowledge gap about tree crown defoliation degree influence on wood quality;
- (b)
- Currently used single-entry volume tables can predict harvesting volume in pedunculate oak stands with satisfactory accuracy;
- (c)
- The ratio of present wood defects is significantly influenced by tree crown defoliation degree class;
- (d)
- Variability in average tree value along tree crown defoliation degree classes indicates the necessity of additional research to clearly define relationships between tree crown defoliation degree class and average tree value;
- (e)
- Currently used assortment tables in Croatian forestry should be revised for healthy and dead trees and expanded in order to include the tree crown defoliation degree class as an additional variable in harvesting plan preparation.
Author Contributions
Funding
Data Availability Statement
Acknowledgments
Conflicts of Interest
Abbreviations
| TCDD | Tree crown defoliation degree |
| DBH | Diameter at breast height |
| ICP | International Co-operative Program |
| H | Healthy tree |
| 3A | Defoliated tree 61%–80% |
| 3B | Defoliated tree 81%–99% |
| D | Dead tree |
| VLI | Veneer log of the first quality class |
| VLII | Veneer log of the second quality class |
| SLI | The first quality class saw log |
| SLII | The second quality class saw log |
| SLIII | The third quality class saw log |
| FW | Fuelwood |
| SD | Standard deviation |
| QC | Quality class |
| SE | Standard error |
Appendix A. Tables

| Site | Parameter | b* | SE of b* | b | SE of b | t | p | M R2 |
|---|---|---|---|---|---|---|---|---|
| A | Intercept | −0.895993 | 0.077101 | −11.6211 | <0.000001 | 0.9255 | ||
| DBH | 0.877355 | 0.055110 | 0.054270 | 0.003409 | 15.9200 | <0.000001 | ||
| TH | 0.114946 | 0.055110 | 0.009371 | 0.004493 | 2.0857 | 0.042231 | ||
| B | Intercept | −3.25230 | 0.348282 | −9.33811 | <0.000001 | 0.9219 | ||
| DBH | 0.943940 | 0.036367 | 0.11528 | 0.004441 | 25.95616 | <0.000001 | ||
| TH | 0.092623 | 0.036367 | 0.02576 | 0.010116 | 2.54692 | 0.013451 |
| Site | Parameter | b* | SE of b* | b | SE of b | t | p | M R2 |
|---|---|---|---|---|---|---|---|---|
| A | Intercept | −0.789219 | 0.064765 | −12.1858 | <0.000001 | 0.9176 | ||
| DBH | 0.756087 | 0.057965 | 0.037352 | 0.002864 | 13.0439 | <0.000001 | ||
| TH | 0.260303 | 0.057965 | 0.016948 | 0.003774 | 4.4907 | 0.000043 | ||
| B | Intercept | −2.36296 | 0.357909 | −6.60214 | <0.000001 | 0.8303 | ||
| DBH | 0.873155 | 0.053623 | 0.07432 | 0.004564 | 16.28309 | <0.000001 | ||
| TH | 0.171874 | 0.053623 | 0.03332 | 0.010395 | 3.20521 | 0.002164 |
| Site | Parameter | b* | SE of b* | b | SE of b | t | p | M R2 |
|---|---|---|---|---|---|---|---|---|
| A | Intercept | −0.703978 | 0.065842 | −10.6919 | <0.000001 | 0.9029 | ||
| DBH | 0.767185 | 0.062901 | 0.035506 | 0.002911 | 12.1966 | <0.000001 | ||
| TH | 0.237788 | 0.062901 | 0.014504 | 0.003837 | 3.7803 | 0.000426 | ||
| B | Intercept | −2.39716 | 0.365996 | −6.54970 | <0.000001 | 0.8277 | ||
| DBH | 0.871981 | 0.054023 | 0.07533 | 0.004667 | 16.14091 | <0.000001 | ||
| TH | 0.171102 | 0.054023 | 0.03367 | 0.010630 | 3.16721 | 0.002420 |
| Site | TCDD | Parameter | b* | SE of b* | b | SE of b | t | p | M R2 |
|---|---|---|---|---|---|---|---|---|---|
| A | H | Intercept | −0.944892 | 0.130021 | −7.26720 | 0.000047 | 0.9497 | ||
| DBH | 0.669850 | 0.141008 | 0.040324 | 0.008488 | 4.75044 | 0.001044 | |||
| TH | 0.339549 | 0.141008 | 0.023256 | 0.009658 | 2.40801 | 0.039377 | |||
| 3A | Intercept | −0.782452 | 0.214127 | −3.65415 | 0.004432 | 0.9401 | |||
| DBH | 1.000256 | 0.153995 | 0.063739 | 0.009813 | 6.49539 | 0.000069 | |||
| TH | −0.035699 | 0.153995 | −0.003468 | 0.014960 | −0.23182 | 0.821351 | |||
| 3B | Intercept | −0.765915 | 0.137236 | −5.58101 | 0.000234 | 0.9169 | |||
| DBH | 0.753857 | 0.134787 | 0.040095 | 0.007169 | 5.59293 | 0.000230 | |||
| TH | 0.255229 | 0.134787 | 0.016167 | 0.008538 | 1.89357 | 0.087546 | |||
| D | Intercept | −1.21219 | 0.116266 | −10.4259 | <0.000001 | 0.9816 | |||
| DBH | 0.840599 | 0.059081 | 0.05547 | 0.003898 | 14.2279 | <0.000001 | |||
| TH | 0.195145 | 0.059081 | 0.02387 | 0.007227 | 3.3030 | 0.007040 | |||
| B | H | Intercept | −2.01548 | 1.012736 | −1.99014 | 0.077779 | 0.8877 | ||
| DBH | 0.916219 | 0.183091 | 0.10037 | 0.020057 | 5.00418 | 0.000735 | |||
| TH | 0.032522 | 0.183091 | 0.00825 | 0.046433 | 0.17763 | 0.862949 | |||
| 3A | Intercept | −4.80159 | 0.741306 | −6.47720 | 0.000015 | 0.9546 | |||
| DBH | 0.896395 | 0.063435 | 0.12383 | 0.008763 | 14.13096 | <0.000001 | |||
| TH | 0.159142 | 0.063435 | 0.06325 | 0.025214 | 2.50875 | 0.025040 | |||
| 3B | Intercept | −2.13664 | 0.623551 | −3.42657 | 0.011036 | 0.9629 | |||
| DBH | 0.957435 | 0.079469 | 0.09600 | 0.007968 | 12.04794 | 0.000006 | |||
| TH | 0.056150 | 0.079469 | 0.01512 | 0.021394 | 0.70657 | 0.502670 | |||
| D | Intercept | −3.42132 | 0.623452 | −5.48770 | 0.000019 | 0.9357 | |||
| DBH | 0.962968 | 0.055930 | 0.12836 | 0.007455 | 17.21738 | <0.000001 | |||
| TH | 0.027300 | 0.055930 | 0.00977 | 0.020011 | 0.48811 | 0.630530 |
| Site | TCDD | Parameter | b* | SE of b* | b | SE of b | t | p | M R2 |
|---|---|---|---|---|---|---|---|---|---|
| A | H | Intercept | −0.817610 | 0.159722 | −5.11897 | 0.000629 | 0.9017 | ||
| DBH | 0.603633 | 0.197155 | 0.031926 | 0.010427 | 3.06171 | 0.013534 | |||
| TH | 0.382197 | 0.197155 | 0.022998 | 0.011864 | 1.93856 | 0.084504 | |||
| 3A | Intercept | −0.604190 | 0.125079 | −4.83047 | 0.000691 | 0.9672 | |||
| DBH | 1.004185 | 0.113878 | 0.050546 | 0.005732 | 8.81808 | 0.000005 | |||
| TH | −0.024047 | 0.113878 | −0.001845 | 0.008739 | −0.21117 | 0.836997 | |||
| 3B | Intercept | −0.657669 | 0.082275 | −7.99355 | 0.000012 | 0.9531 | |||
| DBH | 0.693333 | 0.101268 | 0.029425 | 0.004298 | 6.84648 | 0.000045 | |||
| TH | 0.345560 | 0.101268 | 0.017466 | 0.005118 | 3.41232 | 0.006632 | |||
| D | Intercept | −1.00378 | 0.164221 | −6.11240 | 0.000076 | 0.9378 | |||
| DBH | 0.738492 | 0.108729 | 0.03740 | 0.005506 | 6.79206 | 0.000030 | |||
| TH | 0.289376 | 0.108729 | 0.02717 | 0.010208 | 2.66145 | 0.022129 | |||
| B | H | Intercept | −1.39031 | 0.903489 | −1.53883 | 0.158230 | 0.8638 | ||
| DBH | 0.945106 | 0.201665 | 0.08386 | 0.017893 | 4.68651 | 0.001142 | |||
| TH | −0.019907 | 0.201665 | −0.00409 | 0.041424 | −0.09871 | 0.923531 | |||
| 3A | Intercept | −4.17589 | 0.821709 | −5.08196 | 0.000167 | 0.8971 | |||
| DBH | 0.790596 | 0.095502 | 0.08041 | 0.009714 | 8.27833 | 0.000001 | |||
| TH | 0.278827 | 0.095502 | 0.08160 | 0.027948 | 2.91959 | 0.011200 | |||
| 3B | Intercept | −0.318653 | 0.672547 | −0.473800 | 0.650064 | 0.8955 | |||
| DBH | 0.985283 | 0.133309 | 0.063521 | 0.008594 | 7.390951 | 0.000151 | |||
| TH | −0.111002 | 0.133309 | −0.019213 | 0.023075 | −0.832663 | 0.432522 | |||
| D | Intercept | −2.30243 | 0.585152 | −3.93476 | 0.000759 | 0.8811 | |||
| DBH | 0.931052 | 0.076054 | 0.08566 | 0.006997 | 12.24200 | <0.000001 | |||
| TH | 0.045096 | 0.076054 | 0.01114 | 0.018782 | 0.59295 | 0.559549 |
| Site | TCDD | Parameter | b* | SE of b* | b | SE of b | t | p | M R2 |
|---|---|---|---|---|---|---|---|---|---|
| A | H | Intercept | −0.715533 | 0.158848 | −4.50450 | 0.001479 | 0.8835 | ||
| DBH | 0.587337 | 0.214635 | 0.028378 | 0.010370 | 2.73645 | 0.022981 | |||
| TH | 0.388856 | 0.214635 | 0.021376 | 0.011799 | 1.81171 | 0.103455 | |||
| 3A | Intercept | −0.510605 | 0.125370 | −4.07280 | 0.002240 | 0.9619 | |||
| DBH | 1.031622 | 0.122840 | 0.048251 | 0.005745 | 8.39810 | 0.000008 | |||
| TH | −0.059387 | 0.122840 | −0.004235 | 0.008759 | −0.48345 | 0.639188 | |||
| 3B | Intercept | −0.605704 | 0.086370 | −7.01289 | 0.000037 | 0.9419 | |||
| DBH | 0.685286 | 0.112691 | 0.027437 | 0.004512 | 6.08113 | 0.000119 | |||
| TH | 0.347916 | 0.112691 | 0.016589 | 0.005373 | 3.08735 | 0.011496 | |||
| D | Intercept | −0.898389 | 0.175483 | −5.11951 | 0.000334 | 0.9209 | |||
| DBH | 0.753278 | 0.122603 | 0.036151 | 0.005884 | 6.14406 | 0.000073 | |||
| TH | 0.261848 | 0.122603 | 0.023296 | 0.010908 | 2.13575 | 0.056018 | |||
| B | H | Intercept | −1.32460 | 0.943279 | −1.40425 | 0.193800 | 0.8582 | ||
| DBH | 0.963338 | 0.205809 | 0.08744 | 0.018681 | 4.68074 | 0.001151 | |||
| TH | −0.047226 | 0.205809 | −0.00992 | 0.043249 | −0.22947 | 0.823636 | |||
| 3A | Intercept | −4.30969 | 0.820168 | −5.25464 | 0.000122 | 0.8991 | |||
| DBH | 0.781018 | 0.094577 | 0.08007 | 0.009695 | 8.25805 | 0.000001 | |||
| TH | 0.294198 | 0.094577 | 0.08678 | 0.027896 | 3.11069 | 0.007668 | |||
| 3B | Intercept | −0.271563 | 0.652458 | −0.41622 | 0.689717 | 0.9054 | |||
| DBH | 0.995608 | 0.126851 | 0.065440 | 0.008338 | 7.84864 | 0.000103 | |||
| TH | −0.128318 | 0.126851 | −0.022644 | 0.022385 | −1.01156 | 0.345427 | |||
| D | Intercept | −2.33548 | 0.611021 | −3.82226 | 0.000993 | 0.8747 | |||
| DBH | 0.927839 | 0.078059 | 0.08685 | 0.007307 | 11.88635 | <0.000001 | |||
| TH | 0.044156 | 0.078059 | 0.01109 | 0.019612 | 0.56567 | 0.577612 |
| TCDD | H | 3A | 3B | D | ||||||||
|---|---|---|---|---|---|---|---|---|---|---|---|---|
| QC | SLII | FW | SLII | FW | SLII | SLIII | FW | SLI | SLII | SLIII | FW | |
| N | 1 | 56 | 4 | 55 | 2 | 1 | 37 | 1 | 5 | 1 | 36 | |
| Diameter, cm | Average | 26.0 | 15.6 | 25.5 | 16.8 | 26.0 | 26.0 | 18.4 | 30.0 | 26.8 | 25.0 | 18.7 |
| SD | 0.0 | 5.8 | 1.0 | 5.6 | 1.4 | 0.0 | 3.8 | 0.0 | 0.4 | 0.0 | 4.3 | |
| Min. | 26.0 | 7.0 | 25.0 | 7.0 | 25.0 | 26.0 | 12.0 | 30.0 | 26.0 | 25.0 | 13.0 | |
| Max. | 26.0 | 26.0 | 27.0 | 28.0 | 27.0 | 26.0 | 26.0 | 30.0 | 27.0 | 25.0 | 26.0 | |
| Length, m | Average | 5.1 | 4.5 | 3.1 | 4.7 | 3.6 | 4.7 | 4.9 | 2.0 | 5.0 | 3.4 | 5.0 |
| SD | 0.0 | 1.3 | 0.4 | 1.1 | 0.6 | 0.0 | 1.3 | 0.0 | 1.2 | 0.0 | 1.0 | |
| Min. | 5.1 | 2.0 | 2.5 | 2.1 | 3.1 | 4.7 | 2.3 | 2.0 | 3.3 | 3.4 | 3.0 | |
| Max. | 5.1 | 7.6 | 3.3 | 7.1 | 4.0 | 4.7 | 7.2 | 2.0 | 6.7 | 3.4 | 6.6 | |
| Gross volume, m3 | Average | 0.352 | 0.109 | 0.212 | 0.123 | 0.268 | 0.307 | 0.142 | 0.195 | 0.352 | 0.206 | 0.159 |
| SD | 0.000 | 0.074 | 0.038 | 0.073 | 0.080 | 0.000 | 0.054 | 0.000 | 0.086 | 0.000 | 0.086 | |
| Min. | 0.352 | 0.010 | 0.175 | 0.014 | 0.212 | 0.307 | 0.035 | 0.195 | 0.233 | 0.206 | 0.043 | |
| Max. | 0.352 | 0.257 | 0.264 | 0.275 | 0.325 | 0.307 | 0.248 | 0.195 | 0.470 | 0.206 | 0.345 | |
| Net HRN volume, | Average | 0.271 | 0.100 | 0.158 | 0.114 | 0.191 | 0.249 | 0.130 | 0.141 | 0.283 | 0.167 | 0.148 |
| SD | 0.000 | 0.069 | 0.027 | 0.070 | 0.054 | 0.000 | 0.050 | 0.000 | 0.076 | 0.000 | 0.083 | |
| Min. | 0.271 | 0.009 | 0.123 | 0.012 | 0.152 | 0.249 | 0.033 | 0.141 | 0.175 | 0.167 | 0.040 | |
| Max. | 0.271 | 0.232 | 0.189 | 0.265 | 0.229 | 0.249 | 0.233 | 0.141 | 0.383 | 0.167 | 0.324 | |
| Value, EUR | Average | 29.92 | 3.42 | 17.43 | 3.89 | 21.07 | 19.03 | 4.42 | 23.29 | 31.33 | 12.73 | 5.05 |
| SD | 0.00 | 2.35 | 3.00 | 2.38 | 6.00 | 0.00 | 1.71 | 0.00 | 8.38 | 0.00 | 2.82 | |
| Min. | 29.92 | 0.29 | 13.57 | 0.41 | 16.82 | 19.03 | 1.13 | 23.29 | 19.36 | 12.73 | 1.36 | |
| Max. | 29.92 | 7.89 | 20.87 | 9.02 | 25.31 | 19.03 | 7.92 | 23.29 | 42.39 | 12.73 | 11.03 | |
| TCDD | H | 3A | |||||||||
| QC | SLI | SLII | SLIII | FW | VLI | SLI | SLII | SLIII | FW | ||
| N | 9 | 10 | 19 | 167 | 4 | 5 | 15 | 28 | 203 | ||
| Diameter, cm | Average | 37.4 | 31.1 | 32.2 | 13.3 | 46.5 | 35.6 | 31.3 | 32.6 | 13.7 | |
| SD | 2.9 | 3.4 | 4.9 | 7.5 | 4.1 | 1.5 | 2.6 | 6.2 | 7.8 | ||
| Min. | 33.0 | 27.0 | 26.0 | 7.0 | 43.0 | 33.0 | 28.0 | 25.0 | 7.0 | ||
| Max. | 41.0 | 37.0 | 46.0 | 41.0 | 51.0 | 37.0 | 37.0 | 45.0 | 42.0 | ||
| Length, m | Average | 3.2 | 3.8 | 4.4 | 2.1 | 4.5 | 4.5 | 3.7 | 4.4 | 1.9 | |
| SD | 1.0 | 1.4 | 1.7 | 1.5 | 1.6 | 1.3 | 0.8 | 1.3 | 1.5 | ||
| Min. | 2.0 | 2.0 | 2.0 | 1.0 | 3.0 | 3.0 | 2.8 | 2.0 | 1.0 | ||
| Max. | 5.2 | 5.6 | 7.0 | 6.3 | 6.6 | 5.6 | 5.8 | 6.8 | 7.3 | ||
| Gross volume, m3 | Average | 0.470 | 0.362 | 0.443 | 0.064 | 0.945 | 0.577 | 0.378 | 0.497 | 0.066 | |
| SD | 0.168 | 0.078 | 0.131 | 0.107 | 0.205 | 0.113 | 0.079 | 0.253 | 0.117 | ||
| Min. | 0.260 | 0.234 | 0.211 | 0.004 | 0.720 | 0.437 | 0.279 | 0.174 | 0.004 | ||
| Max. | 0.847 | 0.480 | 0.655 | 0.584 | 1.218 | 0.692 | 0.558 | 1.064 | 0.684 | ||
| Net HRN volume, m3 | Average | 0.358 | 0.277 | 0.342 | 0.060 | 0.737 | 0.441 | 0.284 | 0.383 | 0.062 | |
| SD | 0.130 | 0.059 | 0.105 | 0.102 | 0.163 | 0.110 | 0.061 | 0.202 | 0.112 | ||
| Min. | 0.197 | 0.182 | 0.161 | 0.004 | 0.565 | 0.305 | 0.211 | 0.133 | 0.004 | ||
| Max. | 0.653 | 0.370 | 0.508 | 0.567 | 0.958 | 0.549 | 0.438 | 0.858 | 0.679 | ||
| Value, EUR | Average | 68.82 | 30.58 | 26.38 | 2.08 | 285.31 | 72.73 | 31.43 | 30.47 | 2.16 | |
| SD | 32.35 | 6.54 | 7.92 | 3.45 | 77.08 | 18.20 | 6.72 | 17.63 | 3.79 | ||
| Min. | 32.41 | 20.07 | 12.27 | 0.16 | 196.61 | 50.31 | 23.35 | 10.11 | 0.16 | ||
| Max. | 141.46 | 40.87 | 38.79 | 19.32 | 364.20 | 90.56 | 48.37 | 72.80 | 23.10 | ||
| TCDD | 3B | D | |||||||||
| QC | VLII | SLI | SLII | SLIII | FW | VLII | SLI | SLII | SLIII | FW | |
| N | 1 | 5 | 6 | 12 | 98 | 1 | 7 | 12 | 30 | 152 | |
| Diameter, cm | Average | 43.0 | 40.2 | 38.0 | 35.1 | 14.6 | 53.0 | 39.9 | 39.5 | 36.4 | 20.3 |
| SD | 0.0 | 7.5 | 3.3 | 7.1 | 8.2 | 0.0 | 4.6 | 6.6 | 6.4 | 11.2 | |
| Min. | 43.0 | 31.0 | 33.0 | 27.0 | 7.0 | 53.0 | 33.0 | 29.0 | 26.0 | 7.0 | |
| Max. | 43.0 | 51.0 | 42.0 | 47.0 | 43.0 | 53.0 | 45.0 | 49.0 | 53.0 | 49.0 | |
| Length, m | Average | 3.4 | 4.9 | 4.2 | 4.6 | 2.1 | 3.3 | 4.0 | 4.2 | 3.8 | 2.6 |
| SD | 0.0 | 0.7 | 1.2 | 1.4 | 1.7 | 0.0 | 1.1 | 1.1 | 1.4 | 1.8 | |
| Min. | 3.4 | 4.1 | 2.8 | 2.0 | 1.0 | 3.3 | 3.0 | 3.2 | 2.0 | 1.0 | |
| Max. | 3.4 | 5.8 | 5.5 | 7.0 | 8.3 | 3.3 | 6.2 | 6.9 | 8.0 | 7.6 | |
| Gross volume, m3 | Average | 0.662 | 0.804 | 0.597 | 0.573 | 0.084 | 0.910 | 0.641 | 0.673 | 0.534 | 0.170 |
| SD | 0.000 | 0.249 | 0.125 | 0.271 | 0.136 | 0.000 | 0.139 | 0.234 | 0.291 | 0.197 | |
| Min. | 0.662 | 0.495 | 0.452 | 0.325 | 0.004 | 0.910 | 0.467 | 0.343 | 0.220 | 0.004 | |
| Max. | 0.662 | 1.065 | 0.757 | 1.246 | 0.598 | 0.910 | 0.888 | 1.064 | 1.326 | 0.852 | |
| Net HRN volume, m3 | Average | 0.494 | 0.627 | 0.464 | 0.445 | 0.079 | 0.728 | 0.486 | 0.512 | 0.417 | 0.161 |
| SD | 0.000 | 0.205 | 0.098 | 0.223 | 0.131 | 0.000 | 0.104 | 0.184 | 0.232 | 0.188 | |
| Min. | 0.494 | 0.377 | 0.334 | 0.240 | 0.004 | 0.728 | 0.368 | 0.258 | 0.169 | 0.004 | |
| Max. | 0.494 | 0.842 | 0.591 | 1.016 | 0.581 | 0.728 | 0.668 | 0.829 | 1.058 | 0.842 | |
| Value, EUR | Average | 147.18 | 138.81 | 56.15 | 35.33 | 2.74 | 286.66 | 98.37 | 66.68 | 33.76 | 5.52 |
| SD | 0.00 | 73.70 | 13.18 | 19.21 | 4.43 | 0.00 | 25.62 | 29.32 | 22.02 | 6.36 | |
| Min. | 147.18 | 62.18 | 36.96 | 18.32 | 0.16 | 286.66 | 60.60 | 28.47 | 12.88 | 0.16 | |
| Max. | 147.18 | 243.65 | 75.36 | 86.17 | 19.77 | 286.66 | 144.60 | 118.76 | 109.29 | 28.66 | |
| Homogenous Group by Number of Occurred Wood Defects | Homogenous Group by Wood Volume with Wood Defect | ||||||||
|---|---|---|---|---|---|---|---|---|---|
| Rot | |||||||||
| TCDD | H | 3A | 3B | D | TCDD | H | 3A | 3B | D |
| H | 0.9945 | 0.2106 | 0.0467 | H | 0.9729 | 0.0527 | 0.0025 | ||
| 3A | 0.9945 | 0.1040 | 0.0093 | 3A | 0.9729 | 0.0112 | 0.0001 | ||
| 3B | 0.2106 | 0.1040 | 0.9995 | 3B | 0.0527 | 0.0112 | 0.9947 | ||
| D | 0.0467 | 0.0093 | 0.9995 | D | 0.0025 | 0.0001 | 0.9947 | ||
| Insect holes > 3.00 mm | |||||||||
| TCDD | H | 3A | 3B | D | TCDD | H | 3A | 3B | D |
| H | 0.7635 | 0.0088 | 0.0000 | H | 0.9056 | 0.0200 | 0.0000 | ||
| 3A | 0.7635 | 0.0670 | 0.0000 | 3A | 0.9056 | 0.0687 | 0.0000 | ||
| 3B | 0.0088 | 0.0670 | 0.0040 | 3B | 0.0200 | 0.0687 | 0.0366 | ||
| D | 0.0000 | 0.0000 | 0.0040 | D | 0.0000 | 0.0000 | 0.0366 | ||
| Insect holes < 3.00 mm | |||||||||
| TCDD | H | 3A | 3B | D | TCDD | H | 3A | 3B | D |
| H | 0.9852 | 0.6677 | 0.0248 | H | 0.9990 | 0.6964 | 0.0332 | ||
| 3A | 0.9852 | 0.8132 | 0.0377 | 3A | 0.9990 | 0.7358 | 0.0255 | ||
| 3B | 0.6677 | 0.8132 | 0.6158 | 3B | 0.6964 | 0.7358 | 0.6396 | ||
| D | 0.0248 | 0.0377 | 0.6158 | D | 0.0332 | 0.0255 | 0.6396 | ||
| Covered knots | |||||||||
| TCDD | H | 3A | 3B | D | TCDD | H | 3A | 3B | D |
| H | 0.9023 | 0.7043 | 0.0092 | H | 0.7060 | 0.9945 | 0.0968 | ||
| 3A | 0.9023 | 0.2972 | 0.0001 | 3A | 0.7060 | 0.8981 | 0.0009 | ||
| 3B | 0.7043 | 0.2972 | 0.3985 | 3B | 0.9945 | 0.8981 | 0.0946 | ||
| D | 0.0092 | 0.0001 | 0.3985 | D | 0.0968 | 0.0009 | 0.0946 | ||
| Sound knots | |||||||||
| TCDD | H | 3A | 3B | D | TCDD | H | 3A | 3B | D |
| H | 0.1779 | 0.0138 | 0.0022 | H | 0.4787 | 0.0739 | 0.0478 | ||
| 3A | 0.1779 | 0.5229 | 0.4441 | 3A | 0.4787 | 0.5836 | 0.6636 | ||
| 3B | 0.0138 | 0.5229 | 0.9948 | 3B | 0.0739 | 0.5836 | 0.9744 | ||
| D | 0.0022 | 0.4441 | 0.9948 | D | 0.0478 | 0.6636 | 0.9744 | ||
| Sweep | |||||||||
| TCDD | H | 3A | 3B | D | TCDD | H | 3A | 3B | D |
| H | 0.1750 | 0.1826 | 0.0014 | H | - | - | - | - | |
| 3A | 0.1750 | 0.9904 | 0.3695 | 3A | - | - | - | - | |
| 3B | 0.1826 | 0.9904 | 0.7598 | 3B | - | - | - | - | |
| D | 0.0014 | 0.3695 | 0.7598 | D | - | - | - | - | |
Appendix B. Figures
References
- European Commission. Communication from the Commission to the European Parliament, the Council, the European Economic and Social Committee and the Committee of The Regions. New EU Forest Strategy for 2030, Brussels. 16 July 2021. Available online: https://eur-lex.europa.eu/legal-content/EN/TXT/HTML/?uri=CELEX:52021DC0572#footnote2 (accessed on 1 March 2024).
- Ministry of Economy and Sustainable Development of the Republic of Croatia. Climate Change Adaptation Strategy in the Republic of Croatia for the Period Until 2040 with a View to 2070; Ministry of Economy and Sustainable Development of the Republic of Croatia: Zagreb, Croatia, 2020.
- Mölder, A.; Meyer, P.; Nagel, R.-V. Integrative management to sustain biodiversity and ecological continuity in Central European temperate oak (Quercus robur, Q. petraea) Forests: An Overview. For. Ecol. Manag. 2019, 437, 324–339. [Google Scholar] [CrossRef]
- Santos, J.A.; Carvalho, J.P.F.; Santos, J. Oak Wood. In Oak Ecology, Types and Management; Chuteira, C.A., Grão, A.B., Eds.; Nova Science Publishers, Inc.: New York, NY, USA, 2012; pp. 119–150. [Google Scholar]
- Ministry of Agriculture, Forestry and Fisheries of the Republic of Croatia. Šumskogospodarska Osnova 2016–2025; Ministry of Agriculture, Forestry and Fisheries of the Republic of Croatia: Zagreb, Croatia, 2016.
- Matić, S. Managing Forests of Pedunculate Oak (Quercus robur L.) in Changed Site and Structural Conditions. In Proceedings of the Forests of Pedunculate Oak in Changed Site and Management Conditions, Zagreb, Croatia, 24–25 September 2009. [Google Scholar]
- Hrvatske šume d.o.o. Šumskogospodarska Osnova Područja RH, 2006–2015; Hrvatske šume d.o.o.: Zagreb, Croatia, 2006. [Google Scholar]
- Denman, S.; Brown, N.; Kirk, S.; Jeger, M.; Webber, J. A description of the symptoms of Acute Oak Decline in Britain and a comparative review on causes of similar disorders on oak in Europe. For. Int. J. For. Res. 2014, 87, 535–551. [Google Scholar] [CrossRef]
- Kleinschmit, J.R.G.; Bacilieri, R.; Kremer, A.; Roloff, A. Comparation of Morphological and Genetic Traits of Pedunculate Oak (Q. robur L.) and Sessile Oak (Q. petrea (Matt.) Liebl.). Silvae Genet. 1995, 44, 256–269. [Google Scholar]
- Tikvić, I.; Ugarković, D.; Gašpar, J. Spatial Analysis of Pedunculate Oak Mortality Rate for Adaptive Forest Ecosystem Management in Croatia. Croat. J. For. Eng. 2011, 32, 43–56. [Google Scholar]
- Eaton, E.; Caudullo, G.; Oliveira, S.; de Rigo, D. Quercus robur and Quercus petraea in Europe: Distribution, habitat, usage and threats. In European Atlas of Forest Tree Species; San-Miguel-Ayanz, J., de Rigo, D., Caudullo, G., Houston Durrant, T., Mauri, A., Eds.; Publication Office of the European Union: Luxembourg, 2016; pp. 160–163. [Google Scholar]
- Posavec, S.; Beljan, K.; Milković, I. The economic outcomes of high pedunculate oak (Quercus robur L.) forest management in Croatia. In Proceedings of the IUFRO 4.05.00 & 9.05.03 International Conference, Ljubljana, Slovenia, 25–27 September 2023. [Google Scholar]
- Tomczak, K.; Mederski, P.S.; Naskrent, B.; Tomczak, A. Accuracy of Photo-Optical Timber Measurement Using a Stereo Camera Technology. Croat. J. For. Eng. 2024, 45, 157–167. [Google Scholar] [CrossRef]
- Nocetti, M.; Brunetti, M. Advancements in Wood Quality Assessment: Standing Tree Visual Evaluation—A Review. Forests 2024, 15, 943. [Google Scholar] [CrossRef]
- Drew, D.M.; Downes, G.; Seifert, T.; Eckes-Shepard, A.; Achim, A. A Review of Progress and Applications in Wood Quality Modelling. Curr. For. Rep. 2022, 8, 317–332. [Google Scholar] [CrossRef]
- Papanderea, S.F.; Stoilov, S.; Cataldo, M.F.; Nichev, P.; Angelov, G.; Proto, A.R. How Different Distribution of Assortments on Worksites Influences Forwarder Performance in Coniferous Plantations. Croat. J. For. Eng. 2025, 46, 33–45. [Google Scholar] [CrossRef]
- Karaszewski, Z.; Bembenek, M.; Mederski, P.S.; Szczepańska-Alvarez, A.; Byczkowski, R.; Kozłowska, A.; Michnowicz, K.; Przytuła, W.; Giefing, D.F. Identifying Beech Round Wood Quality—Distributions and The Influence of Defects on Grading. Drewno 2013, 56, 39–54. [Google Scholar] [CrossRef]
- Jozsa, L.A.; Middleton, G.R. A Discussion of Wood Quality Attributes and Their Practical Implications; Forintek Canada Corp.: Vancouver, BC, Canada; Western Laboratory: Vancouver, BC, Canada, 1994; pp. 1–51. [Google Scholar]
- Spiecker, H. Production of valauable oak wood in Europe. Ann. For. Res. 2021, 64, 5–12. [Google Scholar] [CrossRef]
- Merganič, J.; Merganičová, K.; Marušák, R.; Tipmann, L.; Šálek, L.; Dragoun, L.; Stolariková, R. Relation between forest stand diversity and anticipated log quality in managed Central European forests. Int. J. Biodivers. Sci. Ecosyst. Serv. Manag. 2016, 12, 128–138. [Google Scholar] [CrossRef]
- Höwler, K.; Vor, T.; Seidel, D.; Annighöfer, P.; Ammer, C. Analyzing effects of intra- and interspecific competition on timber quality attributes of Fagus sylvatica L.—From quality assessments on standing trees to sawn boards. Eur. J. For. Res. 2019, 138, 327–343. [Google Scholar] [CrossRef]
- Van Leeuwen, M.; Hilker, T.; Coops, N.C.; Frazer, G.; Wulder, M.A.; Newnham, G.J.; Culvenor, D.S. Assessment of standing wood and fiber quality using ground and airborne laser scanning: A review. For. Ecol. Manag. 2011, 261, 1467–1478. [Google Scholar] [CrossRef]
- Attocchi, G. Silviculture of Oak for High-Quality Wood Production: Effects of Thinning on Crown Size, Volume Growth and Stem Quality in Even-Aged Stands of Pedunculate Oak (Quercus robur L.) in Northern Europe. Ph.D. Thesis, Swedish University of Agricultural Sciences, Alnarp, Sweden, 2015. [Google Scholar]
- Carvalho, J.P.F.; Santos, J.A.; Santos, J. Quality Control and Productivity in Oak Timber—From Forest to The Primary Processing. In Proceedings of the Cost Action E53 Conference, Lisabon, Portugal, 22–23 October 2009. [Google Scholar]
- Macdonald, E.; Hubert, J. A review of the effects of silviculture on timber quality of Sitka spruce. For. Int. J. For. Res. 2002, 75, 107–138. [Google Scholar] [CrossRef]
- Gonçalves, A.C. Thinning: An Overview. In Silviculture; Gonçalves, A.C., Ed.; IntechOpen: London, UK, 2021; pp. 41–50. [Google Scholar]
- Shifley, S.R. Oak Growth and Response to Thinning. In Proceedings of the Upland Oak Ecology Symposium: History, Current Conditions, and Sustainability, Asheville, NC, USA, 7–10 October 2002. [Google Scholar]
- Lica, D.; Coşereanu, C. Investigation on The Properties of Pedunculate Oak Wood Affected by Oak Decline. Pro Lingo 2014, 10, 69–78. [Google Scholar]
- Mania, P.; Tomczak, A. Properties of Oak Roundwood with and without Frost Cracks. Forests 2020, 11, 538. [Google Scholar] [CrossRef]
- Šušnjar, M.; Krpan, A.P.B.; Pentek, T.; Horvat, D.; Poršinsky, T. Influence of Knots on Classification of Timber Assortments of Silver Fir into Quality Classes. Wood Res. 2006, 51, 51–58. [Google Scholar]
- Qu, H.; Chen, M.; Hu, Y.; Lyu, J. Effects of Tree Knot Defects on Wood Quality: A Review. IOP Conf. Ser. Mater. Sci. Eng. 2020, 738, 012027. [Google Scholar] [CrossRef]
- Hörnfeldt, R.; Drouin, M.; Woxblom, L. False heartwood in beech Fagus sylvatica, birch Betula pendula, B. papyrifera and ash Fraxinus excelsior—An overview. Ecol. Bull. 2010, 53, 61–75. [Google Scholar]
- Michalec, K.; Wąsik, R.; Gach, M. The Occurrence and Size of False Heartwood in Beech Timber. Drewno 2022, 65, 209. [Google Scholar] [CrossRef]
- Račko, V.; Čunderlík, I. Qualitative and quantitative evaluation of false heartwood in beech logs of various age and qualitative structure. Wood Res. 2006, 51, 1–10. [Google Scholar]
- Prka, M. Occurrence of False Heartwood in Beech Trees and Technical Beech Roundwood Coming from Thinning and Preparatory Felling in The Area of Bjelovar Bilogora. Šumar. List 2003, 128, 467–474. [Google Scholar]
- Giefing, D.; Karaszewski, Z.; Szakiel, M.; Bembenek, M.; Mederski, P.S.; Gierszewska, M. Influence of wood defects in oak on grading. For. Lett. 2014, 107, 10–15. [Google Scholar]
- Gejdoš, M.; Suchomel, J.; Danihelová, Z. Analysis of Qualitative Features of Beech and Oak Trunks as a Determinant of the Quality Assessment. Forests 2021, 12, 15. [Google Scholar] [CrossRef]
- Marenče, J.; Šega, B.; Gornik Bučar, D. Monitoring the Quality and Quantity of Beechwood from Tree to Sawmill Product. Croat. J. For. Eng. 2020, 41, 119–128. [Google Scholar] [CrossRef]
- Ferretti, M.; Ghosh, S.; Gottardini, E. Stem Radial Growth Is Negatively Related to Tree Defoliation and Damage in Conifers, Northern Italy. Front. For. Glob. Change 2021, 4, 775600. [Google Scholar] [CrossRef]
- Popa, I.; Badea, O.; Silaghi, D. Influence of climate on tree health evaluated by defoliation in the ICP level I network (Romania). iFor. Biogeosci. For. 2017, 10, 554–560. [Google Scholar] [CrossRef]
- Paixo, C.; Krause, C.; Morin, H.; Achim, A. Wood quality of black spruce and balsam fir trees defoliated by spruce budworm: A case study in the boreal forest of Quebec, Canada. For. Ecol. Manag. 2019, 437, 201–210. [Google Scholar] [CrossRef]
- Dobbertin, M.; Brank, P. Crown defoliation improves tree mortality models. For. Ecol. Manag. 2001, 141, 271–284. [Google Scholar] [CrossRef]
- Ursić, B.; Zečić, Ž.; Vusić, D. Quantity and Quality of Narrow-Leaved Ash (Fraxinus angustifolia Vahl) Wood Forest Products in Relation to Tree Crown Defoliation. Forests 2025, 16, 147. [Google Scholar] [CrossRef]
- Eichhorn, J.; Roskams, P.; Potočić, N.; Timmermann, V.; Ferretti, M.; Mues, V.; Szepesi, A.; Durrant, D.; Seletković, I.; Schröck, H.W.; et al. Manual on methods and criteria for harmonized sampling, assessment, monitoring and analysis of the effects of air pollution on forests. In Part IV Visual Assessment of Crown Condition and Damaging Agents; Version 2020-3; ICP Forests: Eberswalde, Germany, 2021; pp. 1–54. Available online: https://www.icp-forests.org/pdf/manual/2020/ICP_Manual_part04_2020_Crown_version_2020-3.pdf (accessed on 25 January 2022).
- HRN D.B4.031 1979; Hrvatske Norme Proizvoda Iskorištavanja Šuma. Trupci za Furnir, Hrast. Državni zavod za Normizaciju i Mjeriteljstvo: Zagreb, Croatia, 1995.
- HRN D.B4.028 1979; Hrvatske Norme Proizvoda Iskorištavanja Šuma. Trupci za Rezanje, Listopadno Drvo. Državni Zavod za Normizaciju i Mjeriteljstvo: Zagreb, Croatia, 1995.
- HRN D.B5.023 1979; Hrvatske Norme Proizvoda Iskorištavanja Šuma. Drvo za Ogrjev. Državni Zavod za Normizaciju i Mjeriteljstvo: Zagreb, Croatia, 1995.
- HRN EN 1316-1:2012; Hardwood Round Timber—Qualitative Classification—Part 1: Oak and Beech. Croatian Standards Institute: Zagreb, Croatia, 2012.
- JUS D.B0.022 1984; Proizvodi Eksploatacije Šuma: Razvrstavanje i Merenje Neobrađenog i Obrađenog Drveta. Jugoslovenski Standard: Beograd, Serbia, 1984.
- HRN EN 1309-2:2010; Round and Sawn Timber—Method of Measurement of Dimensions—Part 2: Round Timber—Requirements for Measurement and Volume Calculation Rules. Croatian Standards Institute: Zagreb, Croatia, 2010.
- Croatian Forests Ltd. Pricelist. Available online: https://www.hrsume.hr/wp-content/uploads/2024/04/10_Cjenik-glavnih-sumskih-proizvoda_21.2.2024.pdf (accessed on 12 October 2024).
- Regulation on Tree Marking, Forest Product Characteristics, Consignment Note and Forest Order. NN 71/2019. Available online: https://narodne-novine.nn.hr/clanci/sluzbeni/2019_07_71_1506.html (accessed on 5 August 2024).
- Daniš, M.; Neruda, J. Comparison of the Accuracy of Methods for Calculating the Volume of Standing European Beech Trees. Acta Univ. Agric. Silvic. Mendel. Brun. 2020, 68, 821–830. [Google Scholar] [CrossRef]
- Brack, G.L.; Wood, G.B. Forest Mensuration: Volume of Single Tree; Australian National University: Canberra, Australia, 1998. [Google Scholar]
- Tikvić, I.; Zečić, Ž.; Ugarković, D.; Posarić, D. Damage of Forest Trees and Quality of Timber Assortmets of Pedunculate Oak on Spačva Area. Šumar. List 2009, 133, 237–248. [Google Scholar]
- Muñoz, G.R.; Gete, A.R.; Regueiro, M.G. Variation in log quality and prediction of sawing yield in oak wood (Quercus robur). Ann. For. Sci. 2013, 70, 695–706. [Google Scholar] [CrossRef]
- Fan, Z.; Kabrick, J.M.; Spetich, M.A.; Shifley, S.R.; Jensen, R.G. Oak mortality associated with crown dieback and oak borer attack in the Ozark Highlands. For. Ecol. Manag. 2008, 255, 2297–2305. [Google Scholar] [CrossRef]
| Site | Management Unit; Subcompartment | Coordinates | Phytocenosis | Age |
|---|---|---|---|---|
| A | Kusare; 6a | φ 45°07′10″ N; λ 18°36′17″ E | Genisto elatae-Quercetum roboris Horvat 1938 | 62 |
| B | Česma; 101c, 96c, 97c | φ 45°49′52″ N; λ 16°37′22″ E | Carpino betuli-Quercetum roboris typicum Rauš 1975 | 116 |
| HRN D.B0.022 [49] | HRN EN 1309-2 [50] | |
|---|---|---|
| Length | - The shortest length is measured with an accuracy of at least one centimeter; - Timber with a notch cut or butt trimming should be measured from the end of the notch cut or butt trimming surface; - Length is rounded to the nearest 0.1 m; - The length allowance for the saw logs is 10 cm. | - The shortest length is measured with an accuracy of at least one centimeter; - Timber with a notch cut or butt trimming should be measured from the middle of the notch cut or butt trimming surface; - The length is expressed in meters to one place of decimal rounded down; - The length allowance is not given. |
| Diameter | - Measured two mid-length under bark diameters to an accuracy of at least one centimeter; - In case of an over-bark measure, conversion to an under-bark diameter is necessary; - The arithmetic mean of two measurements is rounded down to the nearest centimeter. | - Measured two mid-length under bark diameters to an accuracy of at least one centimeter; - In case of an over-bark measure, conversion to an under-bark diameter is necessary; - The arithmetic mean of two measurements is rounded down to the nearest centimeter. |
| Volume calculation |
| Site | A | B | ||||||
|---|---|---|---|---|---|---|---|---|
| TCDD | H | 3A | 3B | D | H | 3A | 3B | D |
| DBH, cm | ||||||||
| 17.5 | 4 | 4 | 4 | 4 | ||||
| 22.5 | 4 | 4 | 4 | 4 | ||||
| 27.5 | 4 | 4 | 4 | 4 | ||||
| 32.5 | 1 | 1 | 2 | 1 | 2 | 2 | 2 | |
| 37.5 | 3 | 5 | 1 | 3 | ||||
| 42.5 | 4 | 5 | 1 | 5 | ||||
| 47.5 | 4 | 3 | 8 | |||||
| 52.5 | 3 | 1 | ||||||
| 57.5 | 2 | 2 | 6 | |||||
| Total | 12 | 13 | 13 | 14 | 12 | 17 | 10 | 24 |
| Site | Mean D | Mean E | t-Value | df | p | N D | N T | SD D | SD T | F-Ratio Variances | p Variances |
|---|---|---|---|---|---|---|---|---|---|---|---|
| A | 0.5915 | 0.5610 | 0.5562 | 102 | 0.5793 | 52 | 52 | 0.2889 | 0.2703 | 1.1425 | 0.6362 |
| B | 2.6189 | 2.4669 | 0.8828 | 124 | 0.3791 | 63 | 63 | 0.9510 | 0.9823 | 1.0668 | 0.7998 |
| Site | Mean D | Mean E | t-Value | df | p | N D | N T | SD D | SD T | F-Ratio Variances | p Variances |
|---|---|---|---|---|---|---|---|---|---|---|---|
| A | 0.4863 | 0.4285 | 1.3681 | 102 | 0.1743 | 52 | 52 | 0.2307 | 0.1991 | 1.3427 | 0.2959 |
| B | 1.9378 | 2.0312 | −0.7153 | 124 | 0.4757 | 63 | 63 | 0.6628 | 0.7962 | 1.4429 | 0.1516 |
| QC | N | Rot | Sapwood Rot | Insect Holes > 3.00 mm | Insect Holes < 3.00 mm | Covered Knots | Unsound Knots | Sound Knots | Sweep | Ring Shake | Eccentric Pith | Cracks | Double Pith |
|---|---|---|---|---|---|---|---|---|---|---|---|---|---|
| Declassified VL logs | |||||||||||||
| SLI | 12 | 7.1 | 100.0 | 15.4 | 33.3 | 35.7 | - | 50.0 | 20.0 | - | 100.0 | - | - |
| SLII | 8 | 14.3 | - | 19.2 | 33.3 | 7.1 | 14.3 | - | 40.0 | - | - | - | - |
| SLIII | 17 | 42.9 | - | 34.6 | 33.3 | 50.0 | 42.9 | 50.0 | 20.0 | 100.0 | - | 100.0 | - |
| FW | 12 | 35.7 | - | 30.8 | - | 7.1 | 42.9 | - | 20.0 | - | - | - | - |
| Total * | 49 | 16.7 | 1.2 | 31.0 | 10.7 | 16.7 | 8.3 | 2.4 | 6.0 | 4.8 | 1.2 | 1.2 | - |
| Declassified SLI logs | |||||||||||||
| SLII | 27 | 4.5 | 50.0 | 6.7 | 66.7 | 32.7 | 5.3 | 71.4 | 50.0 | 40.0 | 100 | - | - |
| SLIII | 44 | 27.3 | 50.0 | 43.3 | 33.3 | 50.0 | 26.3 | 28.6 | 20.0 | 40.0 | - | - | - |
| FW | 53 | 68.2 | - | 50.0 | - | 17.3 | 68.4 | - | 30.0 | 20.0 | - | - | - |
| Total * | 124 | 25.1 | 1.1 | 17.1 | 1.7 | 29.7 | 10.9 | 4.0 | 5.7 | 2.9 | 1.7 | - | - |
| Declassified SLII and SLIII logs | |||||||||||||
| SLIII | 30 | 13.3 | - | 15.4 | - | 66.7 | 45.5 | - | 40.0 | - | - | - | 100.0 |
| FW | 74 | 86.7 | - | 84.6 | 100.0 | 33.3 | 54.5 | 100.0 | 60.0 | - | - | - | - |
| Total * | 104 | 45.1 | - | 9.8 | 0.8 | 22.6 | 8.3 | 1.5 | 11.3 | - | - | - | 0.8 |
| TCDD | Rot | Sapwood Rot | Insect Holes > 3.00 mm | Insect Holes < 3.00 mm | Covered Knots | Unsound Knots | Sound Knots | Sweep | Ring Shake | Eccentric Pith | Cracks | Double Pith |
|---|---|---|---|---|---|---|---|---|---|---|---|---|
| H | 24.0 | - | - | - | 30.7 | 13.3 | 8.0 | 16.0 | 5.3 | 2.7 | - | - |
| 3A | 22.8 | 1.1 | 5.4 | - | 40.2 | 8.7 | 4.3 | 9.8 | 4.3 | 2.2 | - | 1.1 |
| 3B | 33.3 | 1.7 | 16.7 | 3.3 | 23.3 | 11.7 | - | 6.7 | 1.7 | - | 1.7 | - |
| D | 35.8 | 0.6 | 32.7 | 6.7 | 13.3 | 7.3 | 0.6 | 3.0 | - | - | - | - |
| Wood Defect | p Value for the Number of Wood Defect Occurrence | p Value for the Volume with Wood Defect |
|---|---|---|
| Rot | 0.0035 | <0.0001 |
| Sapwood rot | 0.6870 | 0.7509 |
| Insect holes > 3.00 mm | <0.0001 | <0.0001 |
| Insect holes < 3.00 mm | 0.0125 | 0.0118 |
| Covered knots | 0.0002 | 0.0012 |
| Unsound knots | 0.4697 | 0.3576 |
| Sound knots | 0.0024 | 0.0381 |
| Sweep | 0.0040 | 0.0961 |
| Ring shake | 0.0554 | 0.0796 |
| Eccentric pith | 0.1873 | 0.2263 |
| Cracks | 0.1043 | 0.1043 |
| Double pith | 0.4335 | 0.4335 |
| Site | Mean D | Mean E | t-Value | df | p | N D | N E | SD D | SD E | F-Ratio Variances | p Variances |
|---|---|---|---|---|---|---|---|---|---|---|---|
| A | 39.7742 | 38.0715 | 0.9021 | 102 | 0.3692 | 52 | 52 | 12.4153 | 5.5799 | 4.9506 | <0.0001 |
| B | 81.4273 | 84.7133 | −0.7630 | 124 | 0.4469 | 63 | 63 | 28.1577 | 19.3813 | 2.1107 | 0.0038 |
Disclaimer/Publisher’s Note: The statements, opinions and data contained in all publications are solely those of the individual author(s) and contributor(s) and not of MDPI and/or the editor(s). MDPI and/or the editor(s) disclaim responsibility for any injury to people or property resulting from any ideas, methods, instructions or products referred to in the content. |
© 2025 by the authors. Licensee MDPI, Basel, Switzerland. This article is an open access article distributed under the terms and conditions of the Creative Commons Attribution (CC BY) license (https://creativecommons.org/licenses/by/4.0/).
Share and Cite
Ursić, B.; Vusić, D. Pedunculate Oak (Quercus robur L.) Crown Defoliation as an Indicator of Timber Value. Forests 2025, 16, 1111. https://doi.org/10.3390/f16071111
Ursić B, Vusić D. Pedunculate Oak (Quercus robur L.) Crown Defoliation as an Indicator of Timber Value. Forests. 2025; 16(7):1111. https://doi.org/10.3390/f16071111
Chicago/Turabian StyleUrsić, Branko, and Dinko Vusić. 2025. "Pedunculate Oak (Quercus robur L.) Crown Defoliation as an Indicator of Timber Value" Forests 16, no. 7: 1111. https://doi.org/10.3390/f16071111
APA StyleUrsić, B., & Vusić, D. (2025). Pedunculate Oak (Quercus robur L.) Crown Defoliation as an Indicator of Timber Value. Forests, 16(7), 1111. https://doi.org/10.3390/f16071111