A Two-Stage Site Selection Model for Wood-Processing Plants in Heilongjiang Province Based on GIS and NSGA-II Integration
Abstract
1. Introduction
2. Research Area Profile and Data Sources
2.1. Study Area
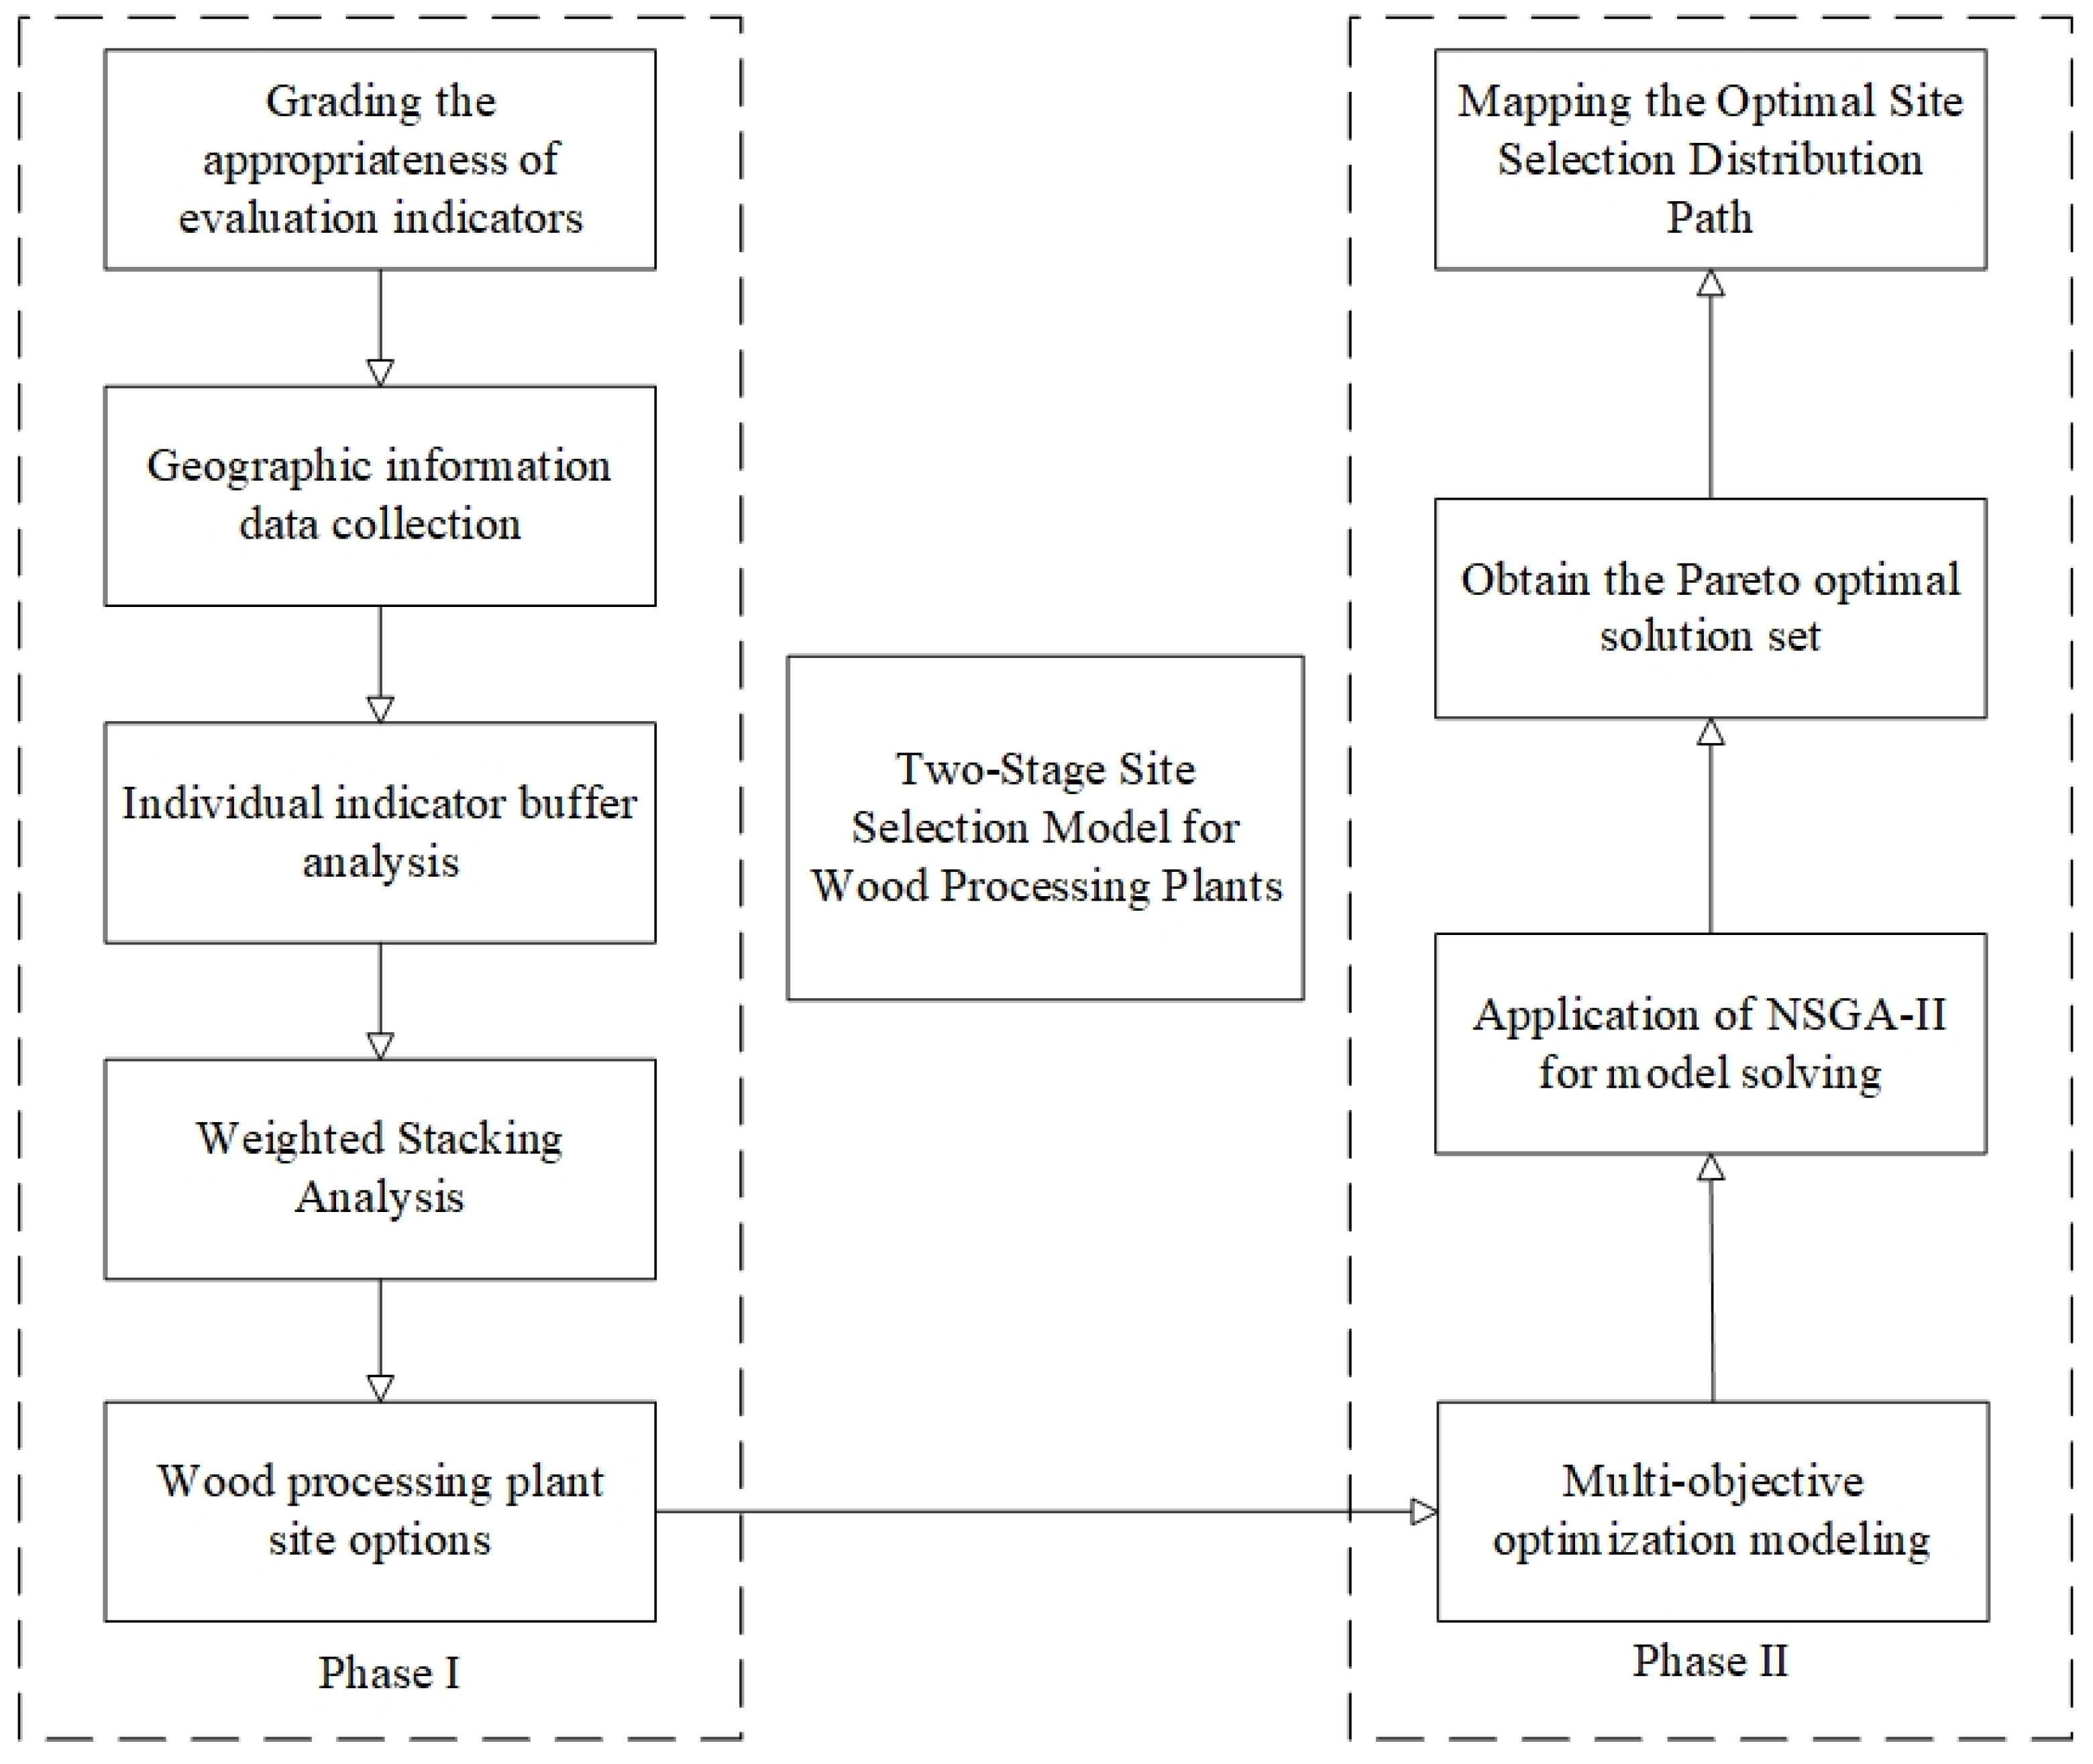
2.2. Research Framework
3. Materials and Methods
3.1. Construction of Evaluation Indicator System
- Restrictive factors: including land use classification, slope thresholds, and ecological redlines to delineate exclusion zones.
- Resource-based factors: such as forest stock density, elevation, and slope aspect, which directly influence raw material availability and construction feasibility.
- Economic factors: including land costs, road network connectivity, and proximity to demand centers—similar to transport and population-based criteria in electric vehicle (EV) charging station studies [25].
- Investment and serviceability factors: encompassing feedstock accessibility, capital expenditure, and payback period, modeled in reference to return-on-investment frameworks from floating photovoltaic plant research [26].
- Natural factors: Natural factors constitute the basic constraints for site selection, involving terrain conditions and ecological sensitivity. Slope and Elevation affect the difficulty of construction and the risk of natural disasters; Distance to Nature Reserve can effectively avoid the ecological red line area; Land Use Type reflects the ecological attributes of the site and the development restrictions, and needs to avoid basic farmland, forest land and other non-constructible areas, and prioritize the planned construction land; Distance to water system ensures that the water source can be reached and at the same time control the risk of potential pollution. Accordingly, five indicators, Slope, Elevation, Land Use Type, Distance to Nature Reserve and Distance to Water System, are set to quantify the ecological suitability of the region.
- Economic factors: Economic factors are the key drivers for site selection and are related to cost control and resource allocation efficiency. Distance to Transportation Network measures the accessibility of logistics; Environmental cost is used to assess the environmental protection expenditure; Raw Material Cost reflects the convenience of obtaining wood and the price advantage; Industrialization level reflects the supporting capacity of the region; the four indicators together portray the economic feasibility of building a factory.
- Social factors: Social factors are mainly used to assess the social acceptance of the project and the policy fit. Distance to market demand affects the service response speed; Labor Availability reflect the manpower supply situation; Policy and Regulation are used to measure the site compliance and financing attractiveness. These three indicators form the basis for quantitative analysis of the social environment support.
3.2. Improved AHP Weighting Method
3.3. Spatial Suitability Analysis via GIS (Stage I)
3.3.1. Suitability Classification of Indicators
3.3.2. Spatial Superposition Analysis
- Construct Evaluation LayersExtract spatial data for each indicator, and standardize the format.
- Reclassify and Score IndicatorsReclassify each layer based on suitability levels (1–5) to achieve standardized quantitative scoring.
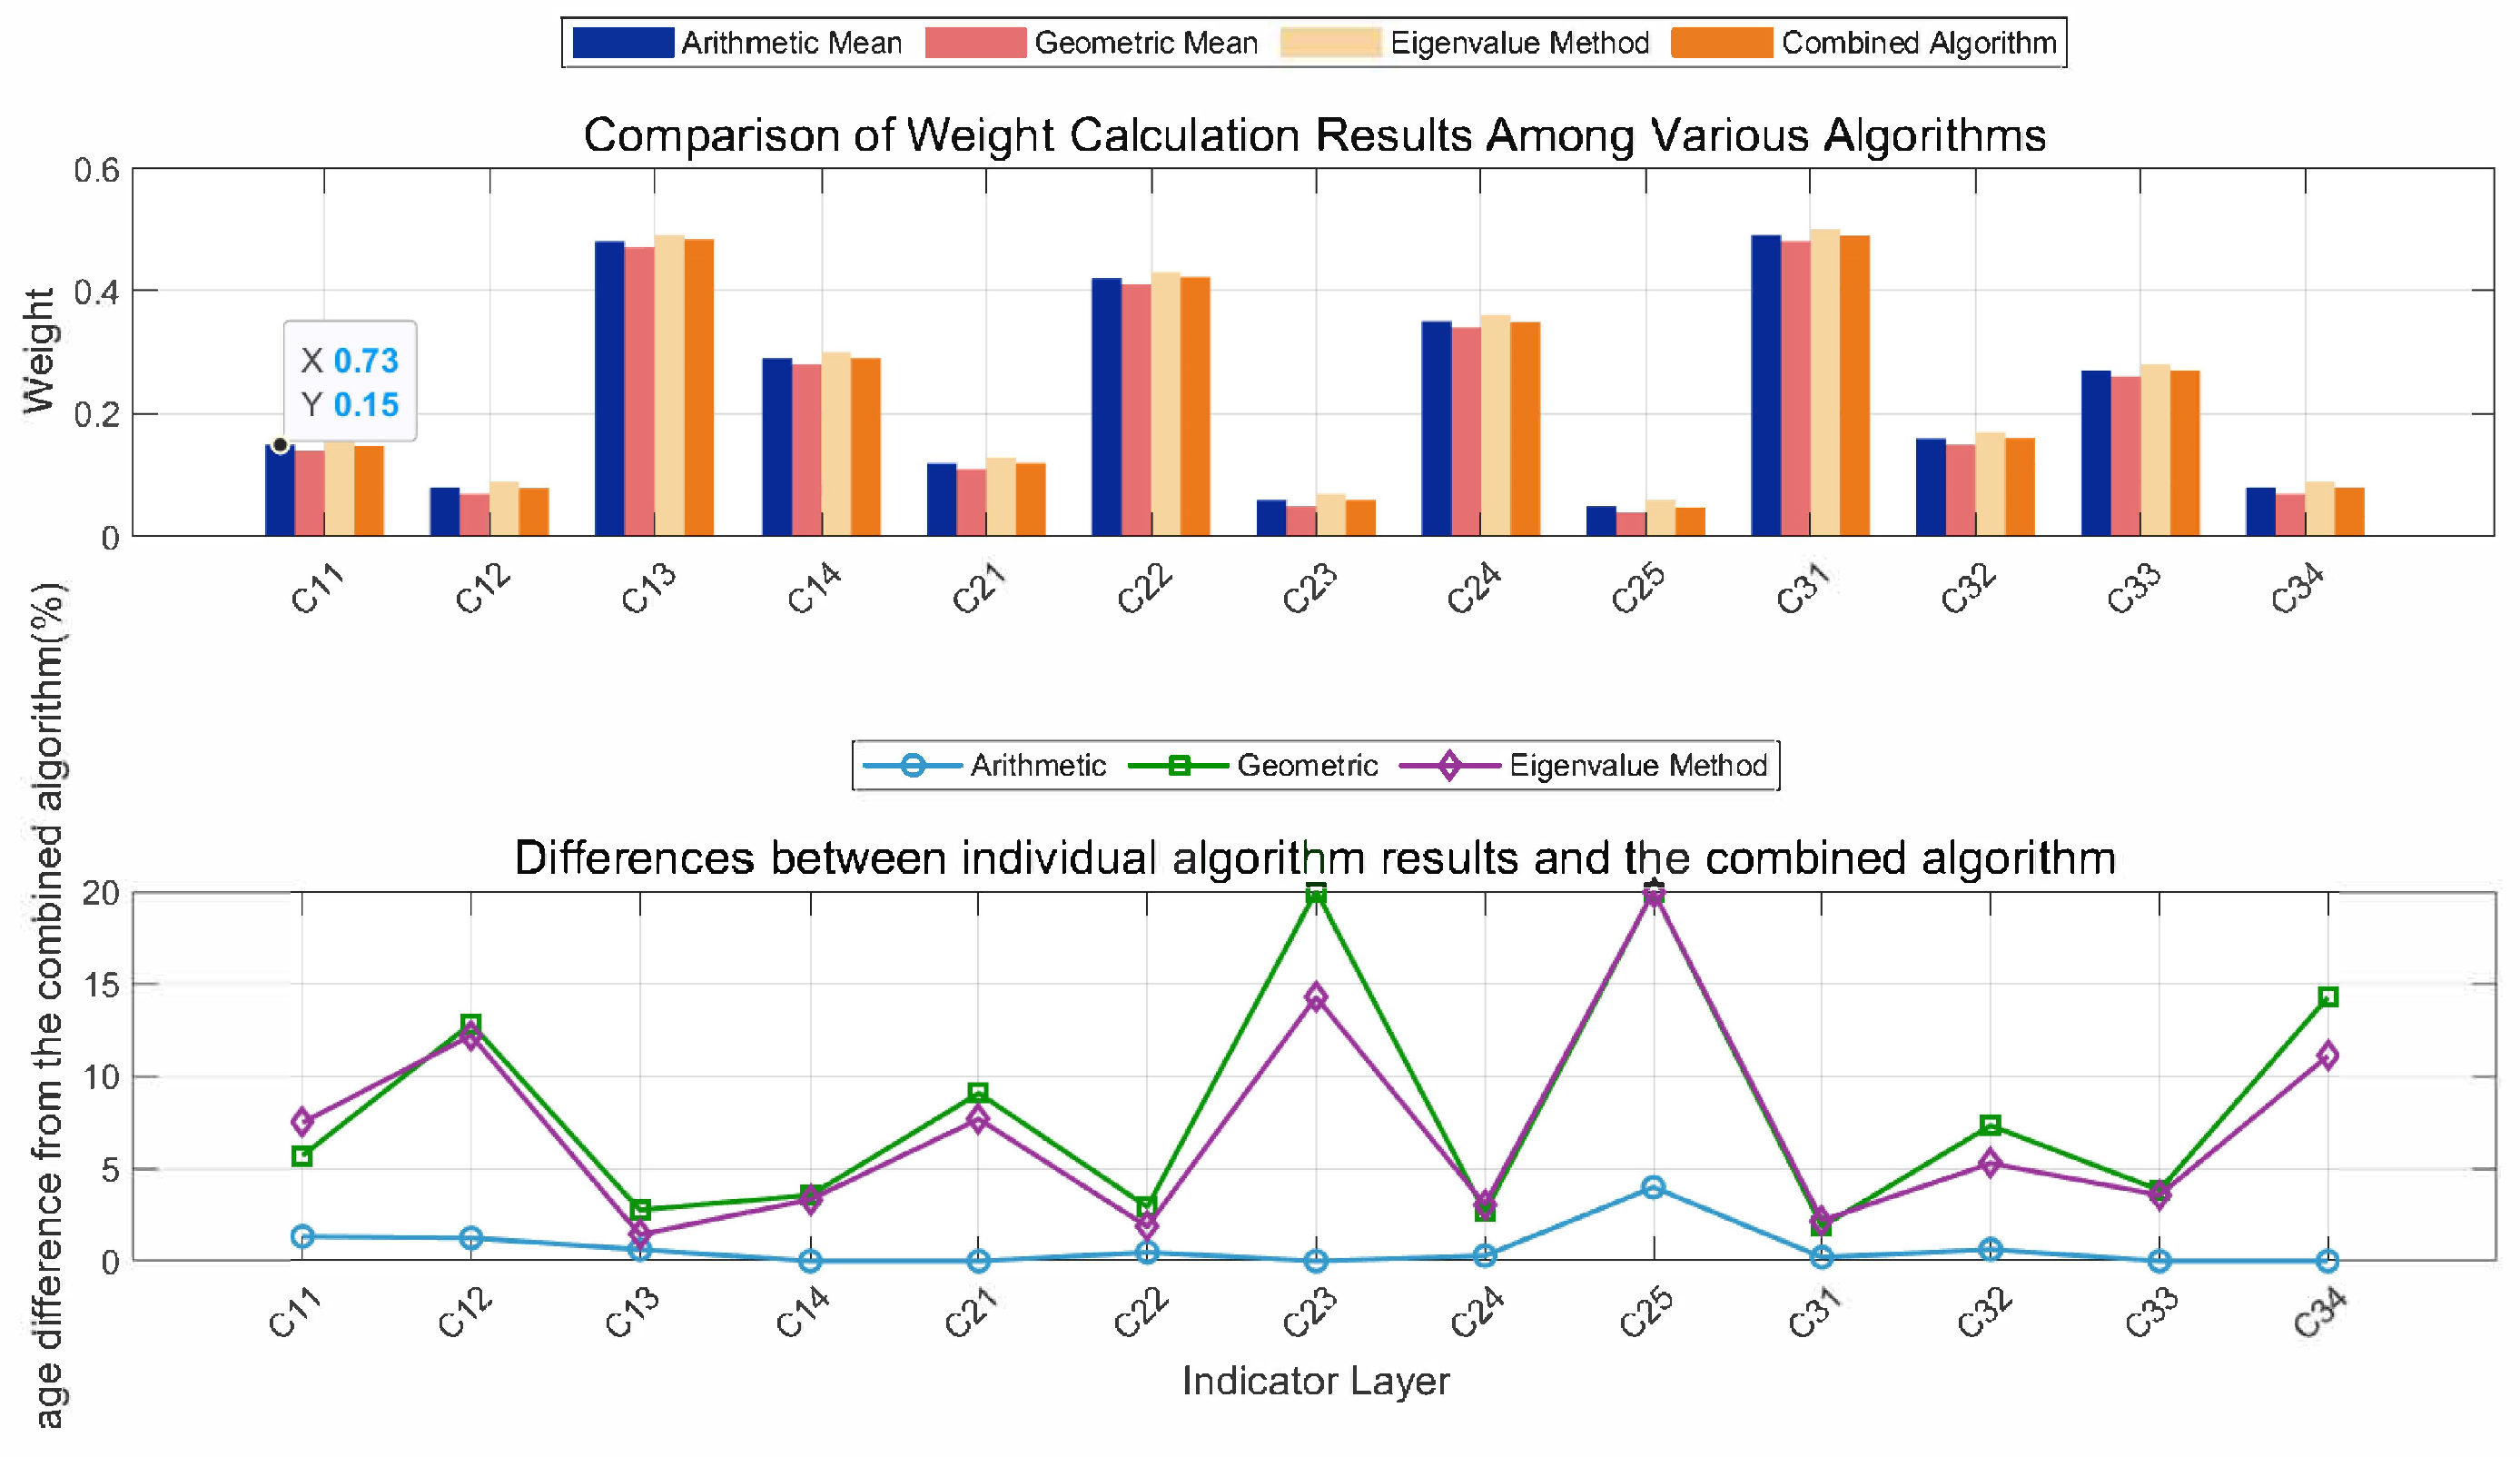
- Determine Indicator WeightsThe weights of each indicator are determined through the improved hierarchical analysis method (AHP).
- Perform Weighted Overlay AnalysisA raster calculation method was used to weight and sum the indicator layers to calculate the total regional score. The specific calculation formula is as follows:where S denotes the comprehensive suitability score, is the weight of the i-th indicator, and is the normalized score of the corresponding indicator.
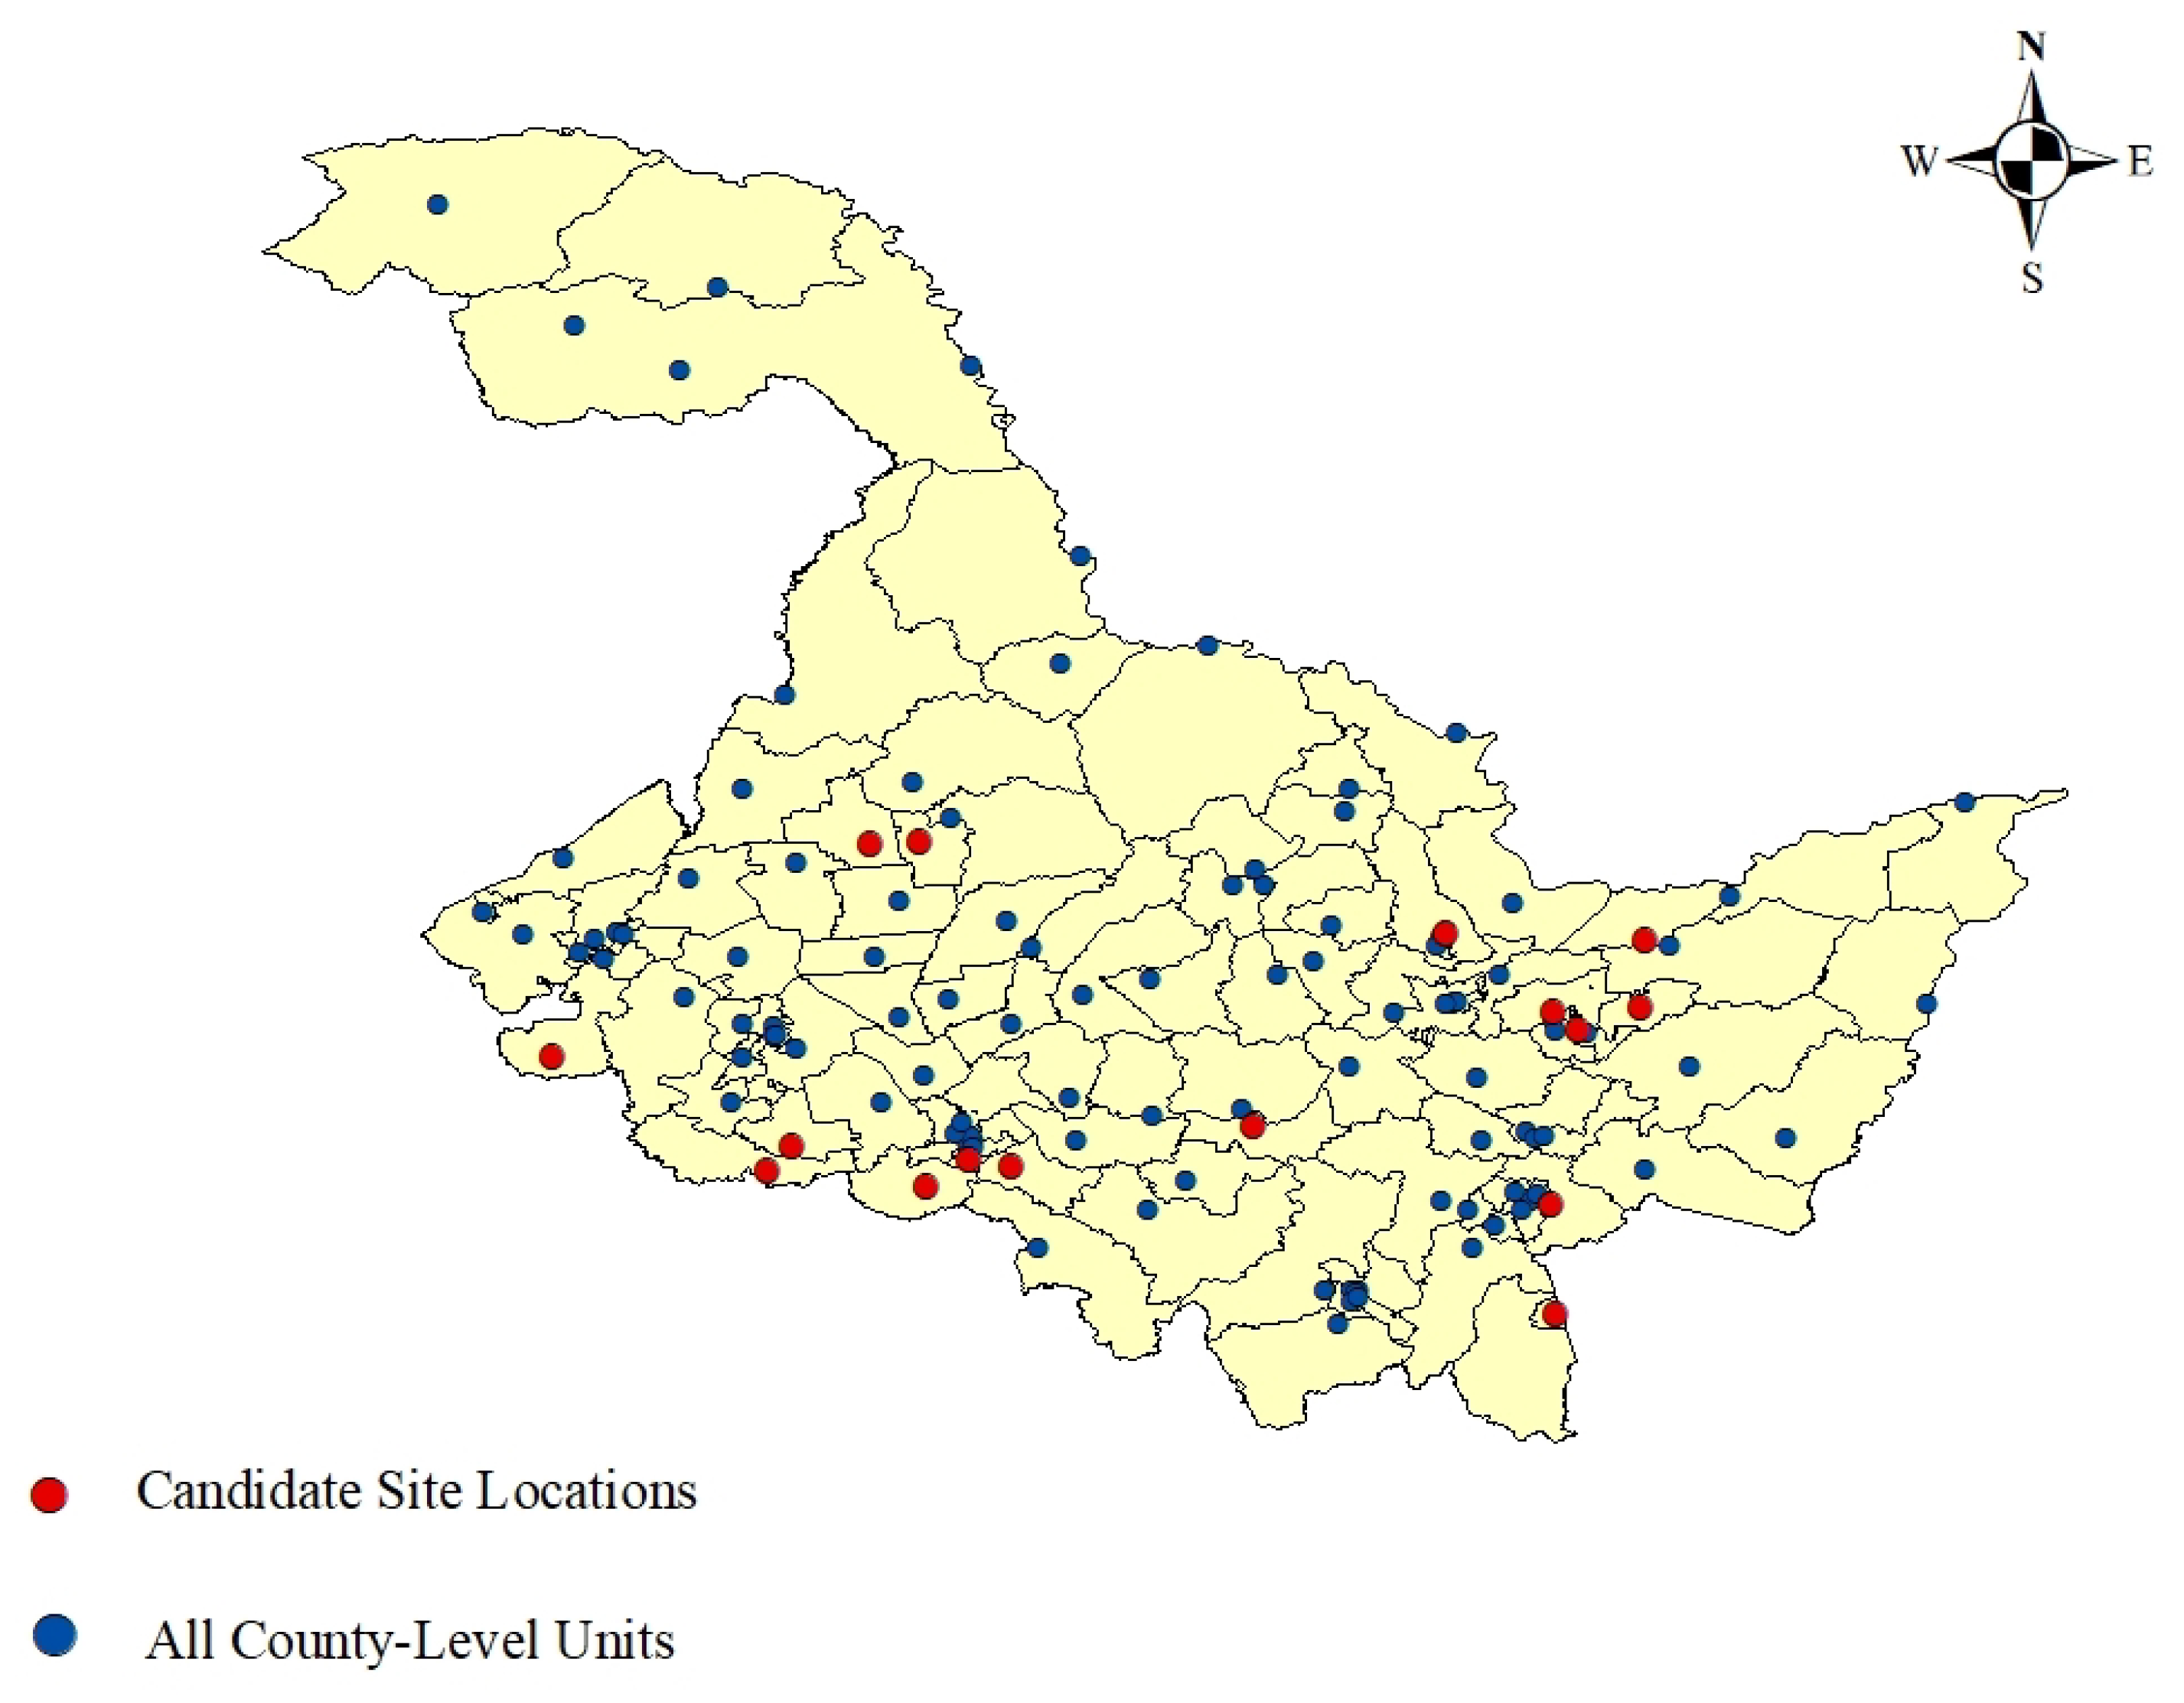
- Generate Suitability MapAfter obtaining the total regional score, the wood-processing plant site selection alternatives were screened by the natural break method.
3.4. Multi-Objective Optimization Model (Stage II)
3.4.1. Model Construction
- I denotes the set of known demand nodes; .
- J denotes the set of candidate sites for wood-processing plants; .
- is the maximum storage capacity of plant j.
- is the general reserve volume at processing plant j.
- is the construction cost of plant j.
- is the land cost at location j.
- is the unit price for transporting timber from reserve node j to demand node i.
- is the time required to deliver timber from reserve node j to demand node i.
- represents government subsidy to reserve node j.
- denotes the transportation distance from node j to demand point i.
- is the penalty coefficient for not completing delivery within required time at demand node i.
- is the maximum acceptable response time at demand node i.
- is the unit penalty cost per unit time of delay at demand node i.
- is a binary decision variable: if a wood-processing plant is constructed at candidate site j; otherwise .
- is a binary decision variable: if timber is delivered from reserve node j to demand node i; otherwise .
3.4.2. NSGA-II Algorithm
- Initialization of the populationConsidering the domestic and international market demand for wood products, 31 candidate locations are selected in Heilongjiang Province, including cities and counties. A total of 16 candidate locations are selected for wood product distribution. The population size , crossover probability , mutation probability , and the maximum number of iterations . A population of N individuals is randomly generated, where each individual represents a solution in the decision space.
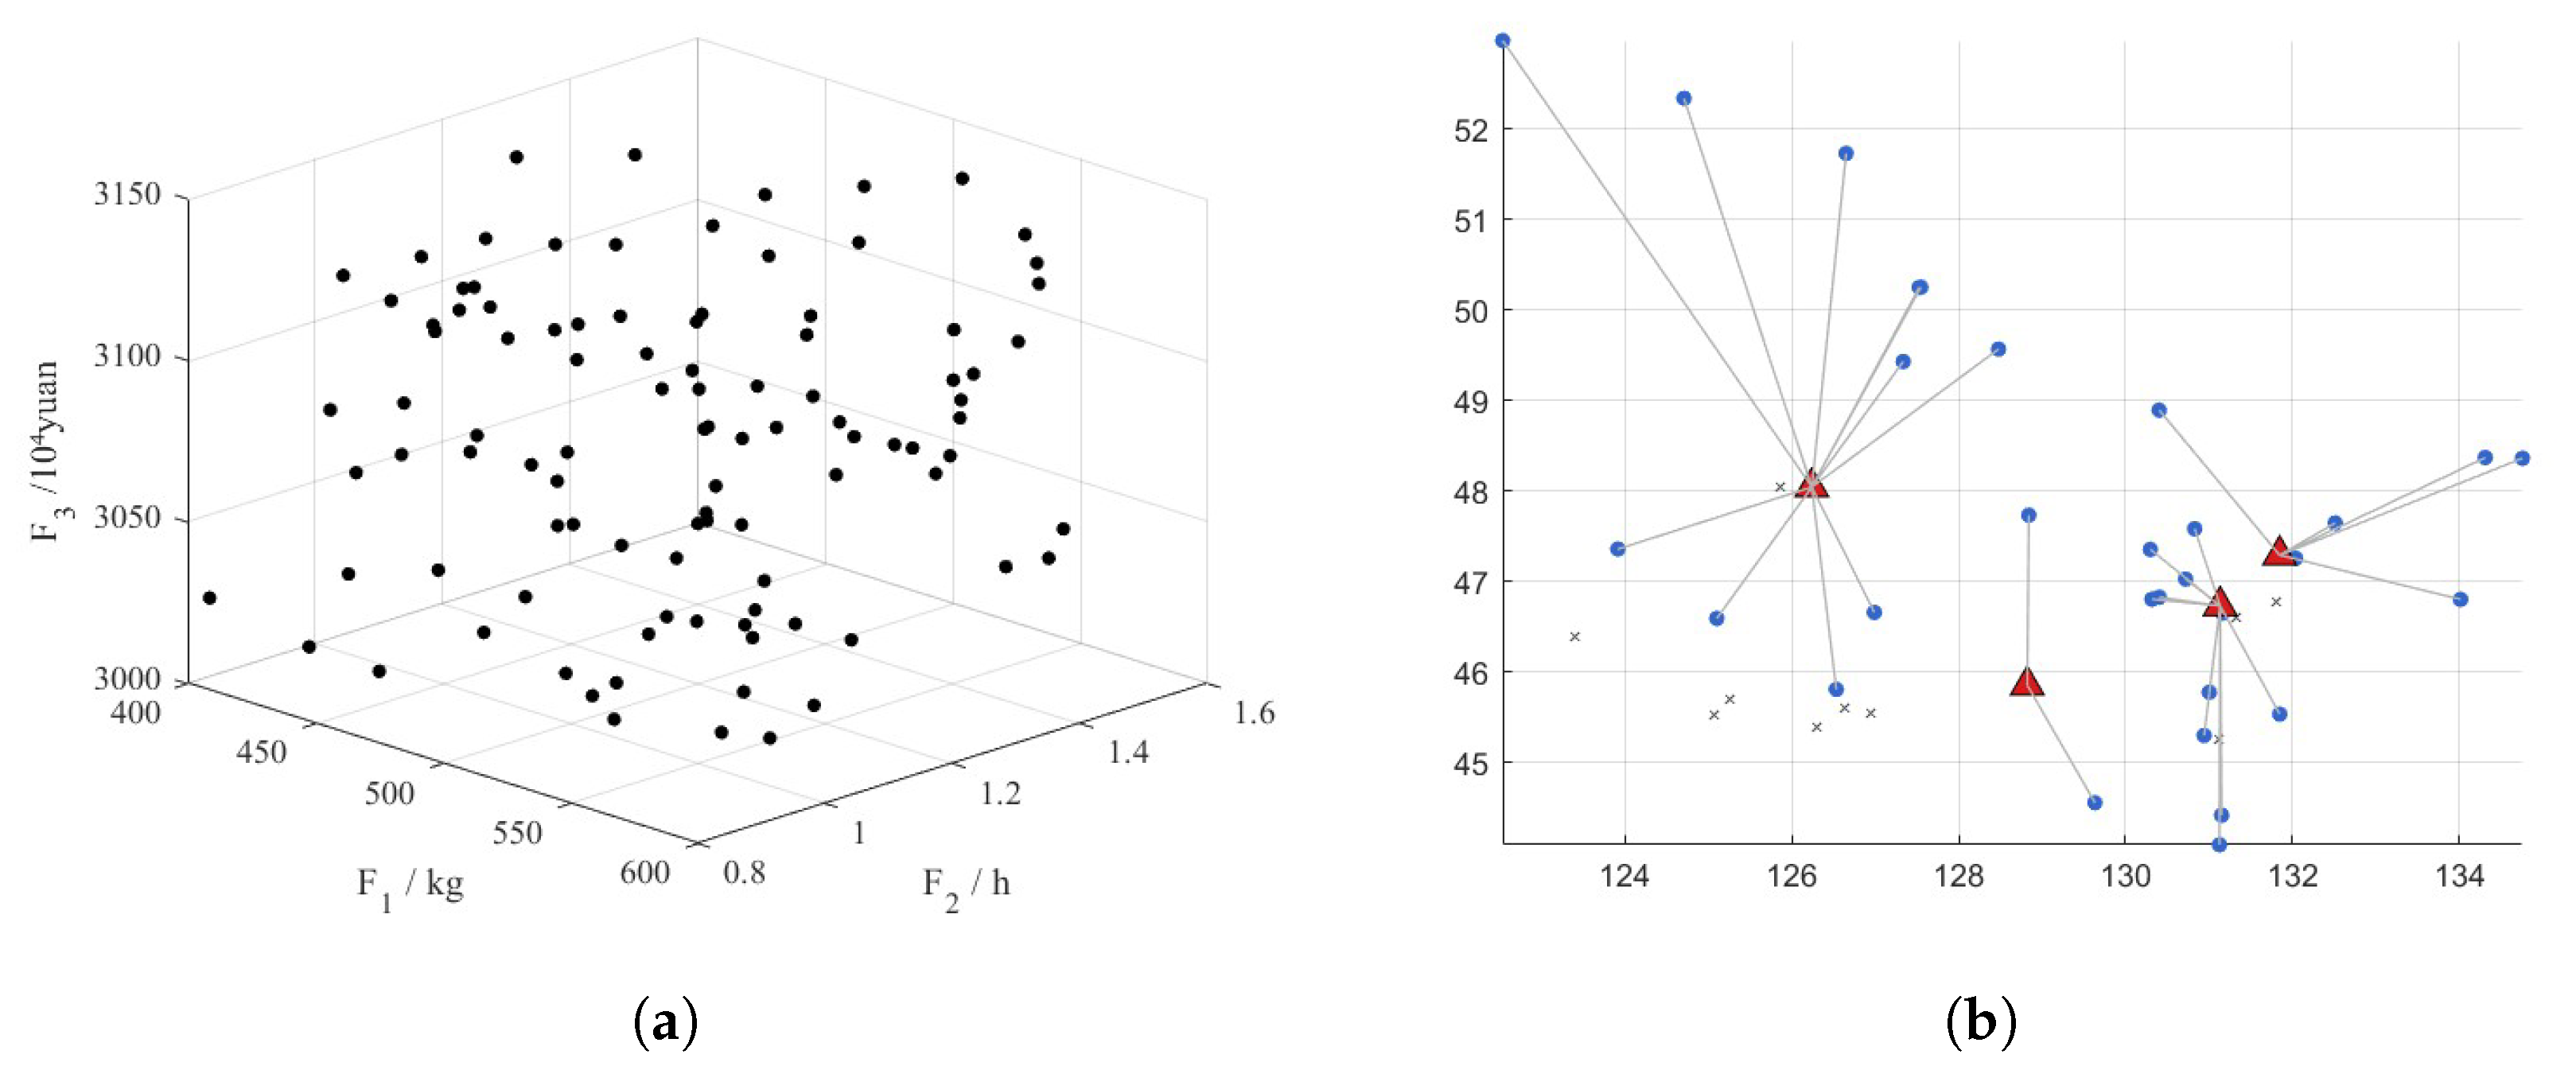
- Non-dominated sortingFor each individual in the current population P, compare its performance on all objective functions (such as carbon emissions, cost, and service coverage). If individual A is not dominated by individual B in all objectives, and at least one objective is strictly better, then A is said to dominate B (denoted as ).All individuals are sorted into layers, with individuals in the first layer being non-dominated, and individuals in the second layer being dominated by those in the first layer, and so on.
- Crowding distance calculationTo diversify the distribution of individuals within the same non-dominated layer, the crowding distance of each individual is calculated based on the objective function values.
- Selection, crossover, and mutationSimilar to traditional genetic algorithms, selection includes three parts: tournament selection, crossover, and mutation. First, k individuals are randomly selected from P (usually ), and based on the non-dominated layer (preferentially selecting the front layer) and crowding distance (preferentially selecting the individual with the larger crowding distance), the better individual is selected as the parent. The selected parents are then used to generate offspring through crossover and mutation. The offspring are added to the population, increasing the diversity of the population.
- Elitism strategyCombine the current population P with the offspring Q to form a new population R (total of individuals). Perform non-dominated sorting on R, and select the first layer of individuals until the total number of individuals exceeds N. If the last layer has more individuals than needed, select individuals based on crowding distance from high to low until the required number is reached, forming a new generation of the population.
4. Results
4.1. Indicator Weight Results and Analysis
4.2. GIS Spatial Suitability Mapping and Preliminary Sites
4.3. Optimization Results: Pareto Front and Recommended Sites
5. Discussion
6. Conclusions
Author Contributions
Funding
Data Availability Statement
Conflicts of Interest
References
- Gordeev, R.V.; Pyzhev, A.I. Impact of Trade Restrictions on the Russian Forest Industry: Evidence from Siberian Timber Producers. Forests 2023, 14, 2452. [Google Scholar] [CrossRef]
- Usoltceva, N.; Tian, G.; Chang, S. The Competitiveness of the Wood Forest Product Trade and Its Sustainable Development: The Case of the Far Eastern Federal District of Russia. Forests 2025, 16, 207. [Google Scholar] [CrossRef]
- Tang, G.; Gao, Y.; Shan, L. Analysis of factors influencing the trade scale of China’s imports of Russian wood products. For. Econ. 2022, 8, 122–126. [Google Scholar]
- Tang, X.; Zhang, Z.; Shi, C. Growing uncertainties in Sino-Russian scientific and technological cooperation in 2025. Int. Political Sci. 2024, 9, 181–188. [Google Scholar]
- Ashraf, M.; Ghani, U.; Abrar, M. Belt and Road Initiative and its implications for trade and development in participating countries. J. Asian Econ. 2021, 75, 101308. [Google Scholar]
- Lin, Y.H.; Zhong, X.Y.; Zhong, C.E. Research on the site selection of timber logistics center based on genetic algorithm. Oper. Res. Manag. Sci. 2007, 6, 51–56. [Google Scholar]
- Qiu, R.Z.; Lin, Y.H.; Zhong, C.E. Timber logistics center site selection based on ArcGIS. Sci. Silvae Sin. 2010, 46, 113–117. [Google Scholar]
- Zhang, L.Y.; Lin, Y.Y.; Qiu, R.Z. Site selection method and empirical analysis of timber logistics center based on BPNN. J. Fujian For. Univ. 2014, 34, 82–86. [Google Scholar]
- Dou, J.; Meng, L.; Qian, L.; Pan, X. Application of Baumol–Wolff model and algorithm in site selection of timber storage center. Logist. Technol. 2014, 37, 15–18. [Google Scholar]
- Zhang, J.; Ba, W.T. Site selection of regional timber logistics distribution center under the background of big data. Logist. Technol. 2020, 39, 84–87. [Google Scholar]
- Khanal, N.; Pokharel, R.; Poudel, J.; Gc, S.; Shannon, E.; Huff, E.; Finley, A. Analysis of location, feedstock availability, and economic impacts of potential mass timber processing facilities in Michigan. For. Policy Econ. 2024, 163, 103203. [Google Scholar] [CrossRef]
- Wang, L.; Wang, S.; Luo, M.; Zhao, J. Suitability evaluation of mountain photovoltaic site selection based on AHP-GIS: A case study of Huize County, Yunnan Province. Acta Energiae Solaris Sin. 2024, 1–10. [Google Scholar]
- Zhong, Y.; Li, F.; Lei, C.; Zhou, M.; Xing, J.; Deng, Q.; Dong, H. Site selection of regional cigarette logistics distribution center based on GIS. Tob. Sci. Technol. 2024, 57, 91–99. [Google Scholar]
- Gao, J.W.; Meng, Q.C.; Liu, J.T. Two-stage planning site selection of large-scale environmental NIMBY facilities based on probabilistic multivalued neutrosophic sets and GIS. Environ. Eng. 2023, 41, 256–263+295. [Google Scholar]
- Zhou, G.; Cheng, T.; Liu, Y.; He, Z.; Cai, M. Optimization method of prefabricated PC component plant site selection based on demand forecasting and GIS. J. Railw. Sci. Eng. 2023, 20, 4389–4399. [Google Scholar]
- Shao, M.; Liu, M.; Chen, Y.; Sun, J.; Shao, Z.; Yi, C.; Wang, C. Site selection decision of wave energy power stations in Zhoushan based on GIS-MCDM-GRU. J. Ocean Univ. China (Natural Sci. Ed.) 2023, 53, 95–106. [Google Scholar]
- Karipoğlu, F.; Ozturk, S.; Efe, B. A GIS-based FAHP and FEDAS analysis framework for suitable site selection of a hybrid offshore wind and solar power plant. Energy Sustain. Dev. 2023, 77, 101349. [Google Scholar] [CrossRef]
- Li, Y.X.; Zhang, X.W.; Zhao, J.F.; Wang, S.; Yang, X. Local site selection method for conventional missile launch position using GIS and improved TOPSIS. J. Natl. Univ. Def. Technol. 2024, 46, 77–87. [Google Scholar]
- Zewdie, H.; Shiferaw, Z.; Gebresenbet, G. GIS-based multi-criteria decision-making approach for dry port location analysis: The case of Ethiopia. Res. Transp. Bus. Manag. 2025, 60, 101370. [Google Scholar]
- Jiang, C.; Ma, C.; Duan, S.; Min, X.; Zhang, Y.; Li, D.; Zhang, X. Monitoring of agricultural drought based on multi-source remote sensing data in Heilongjiang Province, China. J. Integr. Agric. 2025. [Google Scholar]
- Yushchenko, A.; de Bono, A.; Chatenoux, B.; Patel, M.K.; Ray, N. GIS-based assesment of photovoltaic (PV) and concentrated7solar power (CSP) generation potential in west Africa. Renew. Sustain. Energy Rev. 2018, 81, 2088–2103. [Google Scholar] [CrossRef]
- Nuhu, S.K.; Manan, Z.A.; Alwi, S.R.W.; Reba, M.N.M. Roles of geospatial technology in eco-industrial park site selection: State of the-art review. J. Clean. Prod. 2021, 309, 127361. [Google Scholar] [CrossRef]
- Zhang, Q.; Xin, X.; Zhang, H.; Li, Y.; Li, X.; Yi, C. Suitability analysis of photovoltaic power station construction in China based on remote sensing data and multi-factor evaluation. J. -Geo-Inf. Sci. 2018, 20, 119–127. [Google Scholar]
- Lei, M.; Wei, G.; Zhao, Q. Macro siting scheme research of large-scale photovoltaic power stations based on GIS technology. Sol. Energy 2023, 1, 43–48. [Google Scholar]
- Wei, G.; Wang, G.; Ruan, G.; Geng, N. A review on intelligent decision-making and optimization of EV charging station site selection. Comput. Eng. Appl. 2023, 59, 52–65. [Google Scholar]
- Zhao, R.; Shao, J.; Zhu, R.; Yang, S.; Tao, G. Economic analysis of floating photovoltaic power stations. Olar Energy 2021, 1, 22–29. [Google Scholar]
- Ma, Y.; Zhang, D.; Jiao, Z.; Deng, X.; Yu, Z. Research on base station location technology based on genetic algorithm. Electron. Technol. Softw. Eng. 2022, 23, 25–30. [Google Scholar]
- Bolouri, S.; Vafaeinejad, A.; Alesheikh, A.; Aghamohammadi, H. Minimizing response time to accidents in big cities: A two ranked level model for allocating fire stations. Arab. J. Geosci. 2020, 13, 16. [Google Scholar] [CrossRef]
- Srinivas, N.; Deb, K. Multiobjective function optimization using nondominated sorting genetic algorithms. Evol. Comput. 1994, 2, 1301–1308. [Google Scholar] [CrossRef]
- Deb, K.; Pratap, A.; Agarwal, S.; Meyarivan, T. A fast and elitist multiobjective genetic algorithm:NSGA-II. Trans. Evol. Comput. 2002, 6, 182–197. [Google Scholar] [CrossRef]
- Wang, L.; Yang, J.; Qu, B.; Pang, C. Multi-Objective Optimization of an Organic Rankine Cycle (ORC) for a HybridSolar–Waste Energy Plant. Energies 2024, 17, 1810. [Google Scholar] [CrossRef]
- Sadni, F.E.; Salhi, I.; Belhora, F.; Hajjaji, A. Multi-objective optimization of energy and exergy efficiencies in ORC configurations using NSGA-II and TOPSIS. Therm. Sci. Eng. Prog. 2025, 63, 103606. [Google Scholar] [CrossRef]
- Petrovic, S.; Islam, K.J.; Trautrims, A. NSGA-II and TOPSIS for a multi-objective vehicle routing problem with ecological considerations. In Optimization Essentials: Theory, Tools, and Applications; Courier Corporation: North Chelmsford, MA, USA, 2024; pp. 721–750. [Google Scholar]
- Shah, S.C.; Kusiak, A. Data mining and genetic algorithm based gene/SNP selection. Artif. Intell Med. 2004, 31, 183–196. [Google Scholar] [CrossRef] [PubMed]



| Goal Level | Guideline Level | Indicator Level |
|---|---|---|
| Comprehensive Indicator System for Siting Wood- Processing Plants | Natural factor | Slope |
| Elevation | ||
| Distance to Nature Reserve | ||
| Distance to Water System | ||
| Land Use Type | ||
| Economic factor | Distance to Transportation Network | |
| Environmental Cost | ||
| Raw Material Cost | ||
| Industrialization Level | ||
| Social factor | Distance to Market Demand | |
| Labor Availability | ||
| Policy and Regulation |
| Evaluation Indicators | Most Suitable | More Suitable | Suitable | Generally Suitable | Unsuitable |
|---|---|---|---|---|---|
| Elevation (m) | <200 | 200∼400 | 400∼600 | 600∼800 | >800 |
| Slope (%) | <3 | 3∼7 | 8∼15 | 16∼25 | >25 |
| Industrialization Level (million) | >5 | 3∼4 | 2∼3 | 1∼2 | <1 |
| Labor Availability (persons/km2) | >200 | 150∼200 | 100∼150 | 50∼100 | <50 |
| Distance to Nature Reserves (km) | >20 | 15∼20 | 10∼15 | 5∼10 | <5 |
| Distance to Transportation (km) | <2 | 2∼4 | 4∼6 | 6∼8 | >8 |
| Land Use Type | Bare land, saline | construction land, roadland | agricultural land, Sparse grassland | Forest, grassland | Water pollution area, permanent snow |
| Distance to Water (km) | <3 | 3∼5 | 5∼7 | 7∼9 | >9 |
| Distance to Market Demand (km) | <30 | 30∼70 | 70∼120 | 120∼160 | >200 |
| Goal Layer | Criterion Layer | Weight | Indicator Layer | Indicator Layer Weights |
|---|---|---|---|---|
| Comprehensive Indicator System for Siting Wood- Processing Plants | Natural Factors | 0.264 | Slope | 0.039 |
| Elevation | 0.021 | |||
| Distance to Nature Reserves | 0.077 | |||
| Distance to Water Systems | 0.128 | |||
| Land Use Type | 0.076 | |||
| Economic Factors | 0.631 | Distance to Transportation Network | 0.266 | |
| Environmental Cost | 0.038 | |||
| Raw Material Cost | 0.220 | |||
| Industrialization Level | 0.030 | |||
| Social Factors | 0.105 | Distance to Market Demand | 0.052 | |
| Labor Availability | 0.028 | |||
| Policy and Regulations | 0.020 |
| Number | Name | Area of Coverage | Requirement Number |
|---|---|---|---|
| 1 | Jixian County | Luobei, Jiamusi Port, Huichun River, Mishan, Dongning, Jiamusi City, Jixi City, Shuangyashan City, Qitaihe City, Hegang City | 11 |
| 5 | Suibin County | Jiamusi, Tongjiang, Huayuan, Huohe, Suibin, Fuyu, Heilongjiang Island | 7 |
| 10 | Keshan County | Black River Port, Huma, Sunwukou, Mohe, Heihe, Harbin City, Qiqihar City, Daqing City, Heihe City, Suifenhe City, Daxing’anling Area | 11 |
| 15 | Fangzheng County | Mudanjiang City, Yichun City | 2 |
| Strategy Types | Solution Characteristics | Requirement Number |
|---|---|---|
| Cost-sensitive | is the lowest, and are relatively high | Early-stage projects, budget constraints |
| Satisfaction-oriented | is the lowest, is medium, is relatively high | Brand services, government demonstration |
| Green efficiency | is the lowest, is low, is relatively high | Dual carbon goals, certification requirements |
Disclaimer/Publisher’s Note: The statements, opinions and data contained in all publications are solely those of the individual author(s) and contributor(s) and not of MDPI and/or the editor(s). MDPI and/or the editor(s) disclaim responsibility for any injury to people or property resulting from any ideas, methods, instructions or products referred to in the content. |
© 2025 by the authors. Licensee MDPI, Basel, Switzerland. This article is an open access article distributed under the terms and conditions of the Creative Commons Attribution (CC BY) license (https://creativecommons.org/licenses/by/4.0/).
Share and Cite
Ma, C.; Wang, X.; Wang, Y.; Liu, Y.; Kang, W. A Two-Stage Site Selection Model for Wood-Processing Plants in Heilongjiang Province Based on GIS and NSGA-II Integration. Forests 2025, 16, 1086. https://doi.org/10.3390/f16071086
Ma C, Wang X, Wang Y, Liu Y, Kang W. A Two-Stage Site Selection Model for Wood-Processing Plants in Heilongjiang Province Based on GIS and NSGA-II Integration. Forests. 2025; 16(7):1086. https://doi.org/10.3390/f16071086
Chicago/Turabian StyleMa, Chenglin, Xinran Wang, Yilong Wang, Yuxin Liu, and Wenchao Kang. 2025. "A Two-Stage Site Selection Model for Wood-Processing Plants in Heilongjiang Province Based on GIS and NSGA-II Integration" Forests 16, no. 7: 1086. https://doi.org/10.3390/f16071086
APA StyleMa, C., Wang, X., Wang, Y., Liu, Y., & Kang, W. (2025). A Two-Stage Site Selection Model for Wood-Processing Plants in Heilongjiang Province Based on GIS and NSGA-II Integration. Forests, 16(7), 1086. https://doi.org/10.3390/f16071086


