Article

Resprouting Ability and Carbon Allocation of Robinia pseudoacacia L. Trees After Cutting at Different Stem Heights

1
Warm-Temperate and Subtropical Forest Research Center, National Institute of Forest Science (NIFoS), Donnaeko-ro 22, Seogwipo-si 63582, Republic of Korea
2
Forestry Study Program, Faculty of Agriculture and Animal Science, University of Muhammadiyah Malang, Tlogomas Street No. 246, Malang 65151, Indonesia
3
Faculty of Agriculture, Yamagata University, 1-23 Wakaba-Machi, Tsuruoka 997-8555, Japan
4
The United Graduate School of Agricultural Science, Iwate University, 18-8, Ueda 3-chome, Morioka 020-8550, Japan
5
Agrotechnology Study Program, Faculty of Agriculture and Animal Science, University of Muhammadiyah Malang, Tlogomas Street No. 246, Malang 65151, Indonesia
*
Authors to whom correspondence should be addressed.
Forests 2025, 16(7), 1084; https://doi.org/10.3390/f16071084
Submission received: 19 May 2025 / Revised: 18 June 2025 / Accepted: 27 June 2025 / Published: 29 June 2025
(This article belongs to the Section Forest Ecophysiology and Biology)

Abstract

Resprouting is a vital mechanism that enables plants to recover from severe damage caused by environmental or physical disturbances by using non-structural carbohydrates (NSCs), as reflected in their respiration activity. In this study, we focused on resprouting activity and carbon allocation at the organ level in the resprouter species R. pseudoacacia L. We compared the changes in biomass production, NSCs concentration, and respiration rates in each organ (leaf, stem, and root) of five- or six-year-old R. pseudoacacia L. between partial and complete stem loss (tall-stump, TS, and short-stump, SS, respectively) at 2, 4, 9, and 14 months after cutting. TS had greater resprout biomass than SS within two months after cutting, whereas SS experienced a loss of root NSCs before recovery. Compared to TS, SS had higher leaf respiration rates, likely for storage replenishment, whereas root respiration rates remained similar across treatments. The TS maintained NSCs levels during resprouting. However, the SS experienced temporary depletion and recovered within 14 months. Our findings provide new insights into the physiological characteristics of resprouters and invasive alien species with respect to organ loss and offer a novel understanding of efficient storage use during stress and low-cost carbon use for storage replenishment through rapid organ regrowth.

1. Introduction

Resprouting is a well-known trait that helps plants survive and recover from severe organ loss, defoliation or fire-prone ecosystems [1,2,3,4]. Regardless of the plant species, resprouting strongly depends on the reserves of resources produced through photosynthesis, which are primarily used during periods of growth, defense, and defoliation [5,6]. Resource availability, mobilization, and allocation in relation to resprouting dynamics have been widely studied across inter- and intra-species variations. Non-structural carbohydrates (NSCs) are among the most important fractions of the resources reserved for plant survival. NSCs consist of two key components: soluble sugars and starch, which are the main sources of energy for plants to resprout following organ loss [7,8,9]. These compounds support metabolic processes in plant organs, including respiration, which is a primary constraint on carbon sinks [7]. Therefore, examining the NSCs content in plant organs helps reveal plant responses and adaptive strategies under stress and disturbance.
Respiration plays a vital role in resprouting by providing energy for essential metabolic processes in plants [10,11,12]. Investigating respiration at the organ level reveals the activities related to carbon allocation strategies during recovery. Respiration rates in stems and roots are crucial for mobilizing NSCs, which support the development of new tissues [2,8]. Previous studies have highlighted the importance of understanding organ-level respiration to facilitate carbon transport and allocation, which are essential for successful resprouting [12,13]. In this study, we examined respiration rates in individual plant organs in association with NSCs use and carbon allocation under extreme disturbance, contributing to a broader understanding of plant resilience mechanisms in response to environmental stress.
Resprouting allows plants to regenerate after severe organ loss, making it a critical trait in disturbance-prone ecosystems [1,2]. This study focuses on Robinia pseudoacacia—a highly adaptive resprouter species known for its vigorous basal resprouting. This complicates efforts to control its invasive population, particularly in flood-prone riversides of Japan [14,15,16]. Controlling this species is important owing to its large outbreaks and rapid spread. It is known to invade unintended areas, including protected zones, reducing native plant diversity and impacting soil microbe communities [17,18]. Although clear-cutting has been applied to manage the population, it has largely failed because of basal resprouting, root suckering, and a large soil seed bank [15]. Investigating the mechanisms underlying its resprouting ability provides insights into resource allocation strategies and their broader ecological implications.
The ability to resprout is especially beneficial for plants facing challenges linked to climate change [17]. Both anthropogenic and natural events, often intensified by unstable climate conditions, cause damage to plant organs, requiring plants to balance carbon inputs and outputs. If resprouting fails to replenish resources, plants risk carbon starvation [18,19], which can lead to mortality and failed regeneration. Rapid biomass recovery depends heavily on the severity of aboveground damage, stump size, NSCs pool size, and the availability of dormant buds in roots and stems [2,20]. Partial damage allows stems to act as additional NSCs sources, whereas complete damage makes root reserves critical, placing greater importance on the metabolic activity of these organs for successful resprouting [1]. Previous studies lack clarity on the contribution of stump and root metabolism to NSCs use, particularly under varied resource conditions. Exploring the relationship between NSCs availability and resprouting dynamics can help explain how plants adapt to extreme conditions and has potential applications in forest management and ecological restoration.
In this study, we aimed to address the above-mentioned knowledge gaps by examining the roles of NSCs reserves in stumps and roots, organ respiration rates, and their effects on the resprouting ability of R. pseudoacacia. Studying these mechanisms with respect to different stem-cutting heights offers a unique perspective on carbon allocation strategies during stress recovery. These findings are particularly relevant to understanding how pioneer resprouter species respond to climate-induced disturbances and may help guide strategies for controlling invasive populations while maintaining ecosystem balance. We tested the following hypotheses: (i) resprouting biomass reaches the original biomass level once new leaves develop; (ii) resprouting biomass is driven by NSCs storage in the stem and root; (iii) during resprouting, NSCs contents in the stump and root are initially low but replenish after new organs are established; and (iv) respiration rates in the stump and root significantly influence resprouting biomass owing to their role in carbon transport and usage. Through this study, we aim to improve understanding of how cutting height affects resource allocation dynamics after resprouting.

2. Materials and Methods

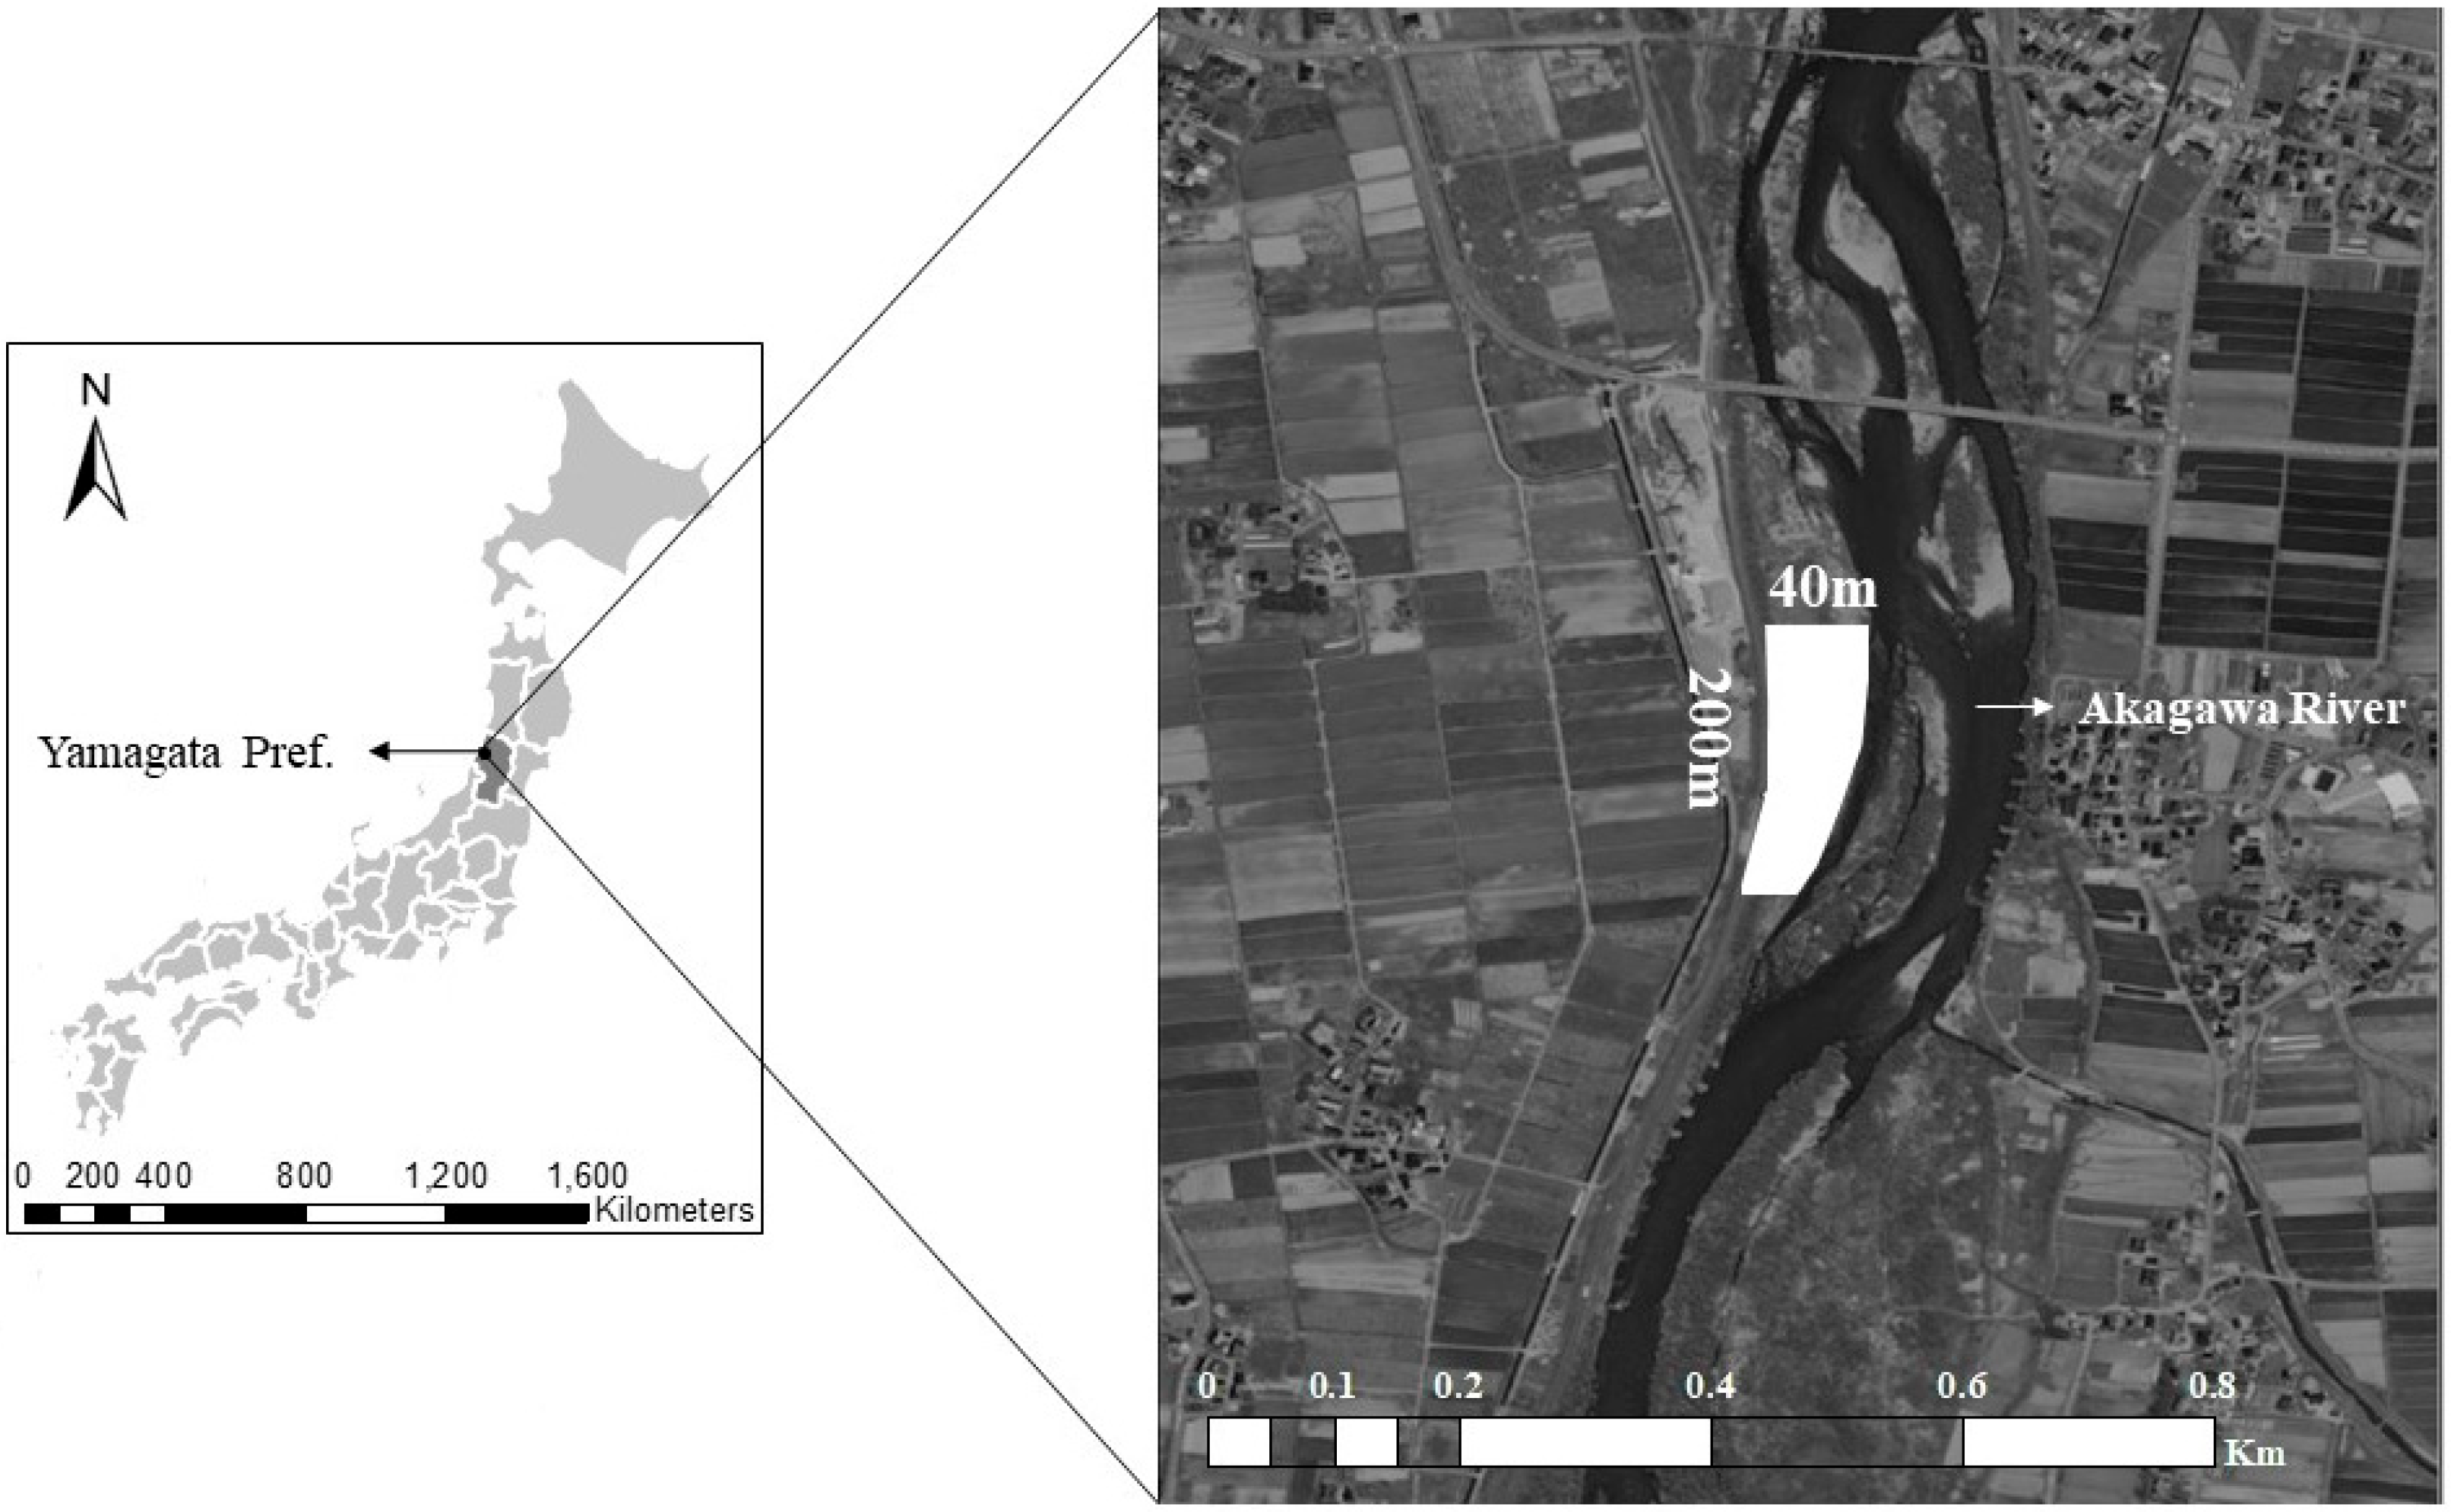
2.1. Study Site and Species

The study was conducted along the riverside of the Akagawa River of Tsuruoka City, Yamagata Prefecture, northern Japan (38°40′ N, 139°51′ E). The plot was 200 m long and 40 m wide, and its closest point was approximately 50 m from the riverbank (Figure 1). Mean annual temperature and precipitation in 2019 were 13.8 °C and 1657.5 mm, and in 2020 were 13.8 °C and 2391.0 mm, respectively (AMeDAS, Japan Meteorological Agency). The dominant tree species in the stream are black locust (Robinia pseudoacacia L.), Japanese walnuts (Juglans ailantifolia), and white willow (Salix alba L.).
We used R. pseudoacacia, a deciduous, leguminous, and pioneer species that is widely distributed across Japan and native to North America. The species was first introduced in Japan in 1873 for land rehabilitation, but nowadays, it is considered invasive and difficult to control. The results of this study are expected to contribute to our understanding of the physiological characteristics of R. pseudoacacia when deciding how to control its population.

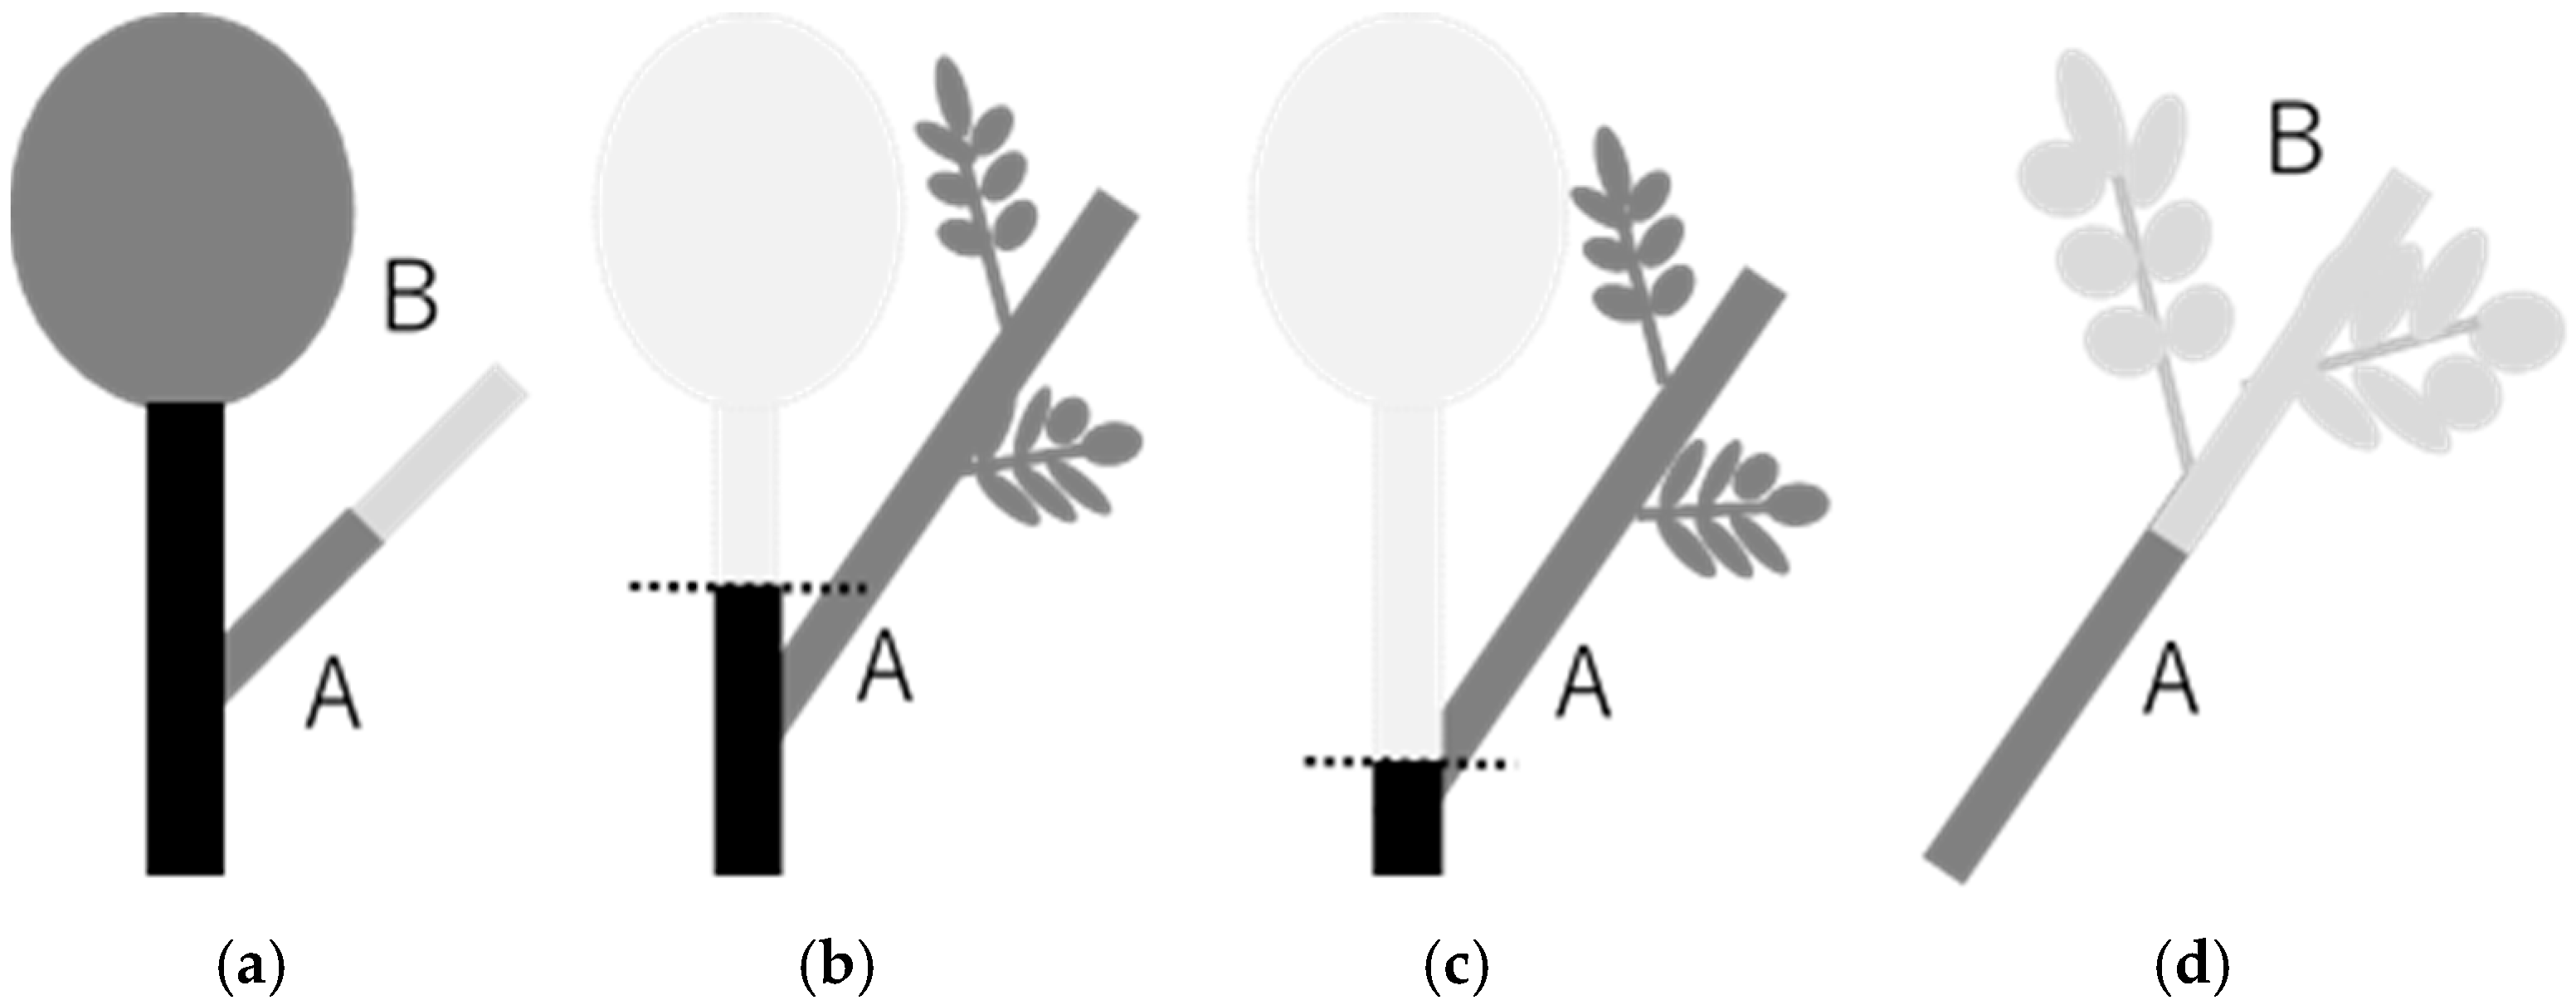
2.2. Treatment Application and Sampling Times

Before the treatment was applied, tree height, diameter breast height (DBH), and basal diameter were recorded for group classification consisting of control (CO, trees without aboveground cutting), tall-stump (TS, cut 1.3 m above the ground surface), and short-stump (SS, cut in the basal area and left the stump approximately 10 cm above the ground surface). Each treatment group consisted of 50 trees. The population is dominated by five- to six-year-old trees (observation from tree rings) with mean height and DBH of 1.8–4.7 m and 0.6–3.5 cm, respectively. We carefully selected 150 random trees that grew at a certain distance from the root sucker to avoid ramet growth.
The cutting treatments were applied in early summer (June 2019) using a hand saw, and were associated with the phenological cycle, as resources are heavily used for growth during this period, including leaf opening in spring and flowering in early summer [21]. Additionally, a bright stick was attached to the SS trees for easy recognition from a distance. Resprouting growth was investigated visually every week after cutting until the first sampling date.
The field sampling was divided into four periods within two periods after cutting: current and one-year. Each period consisted of two sampling times in each year, which were in August (two months after cutting; Summer 1) and October (four months after cutting; autumn) of the current year (2019), and March (eight months after cutting; spring) and August (fourteen months after cutting; Summer 2) one year (2020) after the cutting.
During cutting, all branches attached to the stems of the TS and SS trees were removed, leaving a single branchless stump. To measure dry mass, all samples were transported to the laboratory, including roots, which were manually removed from stony soils using hand saws, hand claws, and hand shovels to avoid root breaking. All materials were oven-dried at 65 °C for 48 h for leaves, 72 h for branches, and 168 h for woody tissues (stem and root).
At each sampling date, five or six trees from each treatment were harvested to measure the respiration rates in the field, and the organs were divided into five types: the leaf (including rachis), the current-year shoot and last-year branch, the stem/stump, and the root (not separated between fine and coarse roots). The samples were brought to the laboratory to measure their dry mass and NSCs content. The classification of current-year shoots in TS and SS trees during resprouting and that of original shoots in CO trees is shown schematically in Figure 2.
The growth of new shoots was observed regularly from the first week until the 14th month after cutting. The number of sprouts, shoot length, and shoot diameter were recorded during sampling in Summer 1 and Summer 2 to understand the characteristics of the new shoots. All harvested materials, including leaf, current-year shoot, last-year branch, stem/stump, and root, from all treatments, were oven-dried at 65 °C with a variety of drying times depending on the tissues and the number of materials. Fine and coarse root dry weights were scaled separately. Visual observations are presented in Figure 3.

2.3. Organ Respiration Rates

The respiratory rate of each organ was measured. Leaves were removed from the branches of all individuals. The branches were classified into current-year shoots and last-year branches (Figure 2). The stem and stump were removed from the basal area and divided into smaller parts to fit into the chamber for several measurements. Respiration rate and biomass were then summed for each organ. All the roots were manually removed from the stony soil. Coarse and fine roots were combined during measurement.
All the materials were placed in a closed-air circulation acrylic chamber with a volume of 13,230 cm3 and fitted with an infrared gas analyzer (IRGA) (GMP 343, Vaisala, Helsinki, Finland). Three Brushless DC fans (5 V 120 mm; GDSTIME, Shenzhen Gdstime Technology Co., Ltd., Shenzhen, China) were installed inside the chamber to maintain air circulation during the measurements. Leaves were measured in the dark by covering the chamber with aluminum foil to prevent light saturation. We carefully checked the air circulation, air temperature, and the absence of air leakage inside the chamber during the measurement by checking the CO2 concentration consumed per second. We allocated a minimum duration for each measurement and circulated the chamber for another 5–10 min.
Organ respiration rates (OR) were calculated using the following equation (Ideal Gas Law):
1 R × C O 2 t × P a t m × V c h a m T c h a m × 10 6 ,
where OR is the organ respiration rate per dry mass (nmol·s−1·g−1), R is the gas constant (8.31 Pa·m3·K−1·mol−1), ΔCO2/Δt is the change of CO2 concentration inside the chamber in 1 s (ppm·s−1), Patm is atmospheric air pressure (101.3 kPa), Vcham is the chamber volume (m3), Tcham is the temperature inside the chamber (K), and dm is organ dry mass (g). To remove the effect of temperature, we used coefficient Q10 = 2.09 to calibrate the respiration rate independent from air temperature calculated from the calibration line of the whole-plant seedling respiration rates at specific 5 °C intervals from 5 to 25 °C.

2.4. NSCs

All the dry materials were ground manually to a fine powder using a Wonder Blender (Osaka Chemical Co., Ltd., Osaka, Japan). The leaflets were ground separately from the rachis. The current-year shoot and last-year branch were chopped into small sizes using sterile branch scissors, and 2 g each of leaflet, rachis, last-year branch, current-year shoot, and stem, and 3 g each of fine and coarse roots were collected. The ground materials for current-year shoots, last-year branches, stems, fine roots, and coarse roots were collected from several parts (upper, middle, and bottom) to determine heterogeneous NSCs concentrations. The stems and roots were carefully chopped using a sterile knife to include all representative bark, sapwood, hardwood, and pith tissues. The powder was extracted with 80% ethanol, and the extract was desiccated once with heat. We analyzed the soluble sugar content by adding water to the desiccated materials, followed by a phenol-sulfuric acid assay, which induces a color-producing reaction that can be measured spectrophotometrically at 490 nm. After adding potassium hydroxide and acetic acid to the sediment of 80% ethanol extraction, starch was decomposed to glucose by the mixture of α-amylase and amyloglucosidase. We then estimated the starch content by analyzing the glucose content using a glucose test kit (Fujifilm/Wako Chemical, Japan) and measuring the colorimetric absorbance at 550 nm. Total NSCs concentrations were calculated as the sum of soluble sugar and starch concentrations divided by the total dry mass (g·g−1).

2.5. Data Analysis

We used a two-way fixed effects ANOVA to test the effect of treatments and sampling time (seasons) on total biomass, as well as leaf and current-year shoot biomass production. We could not perform repeated measures because the same individual trees were not sampled in every season of the year. Bivariate Pearson’s correlation was used to test the relationship between total and leaf-current-year shoot biomass before cutting for each sampling season.
One-way analysis of variance (ANOVA) fixed effects was used to examine the statistically significant differences between organs in each sampling season. An independent t-test was used to examine the statistical differences between the values before cutting at each sampling time (i.e., the total biomass recovery before cutting compared to Summer 1, autumn, spring, and Summer 2 for each treatment). The Tukey Honest Significant Difference (HSD) test was used as a post hoc test, with a statistical difference level set at 5%. All statistical analyses were performed using SPSS version 25 (IBM Corp., Armonk, NY, USA).
We applied Detrended Component Analysis (DCA) to summarize the changes in respiration rates and NSCs contents as an effect of cutting in each treatment. We only conducted DCA for Summer 1 and Summer 2, considering the available data for all organs in all parameters. We used the vegan and ggplot packages in R version 4.1.1 for data analysis and drawing the graphs.

3. Results

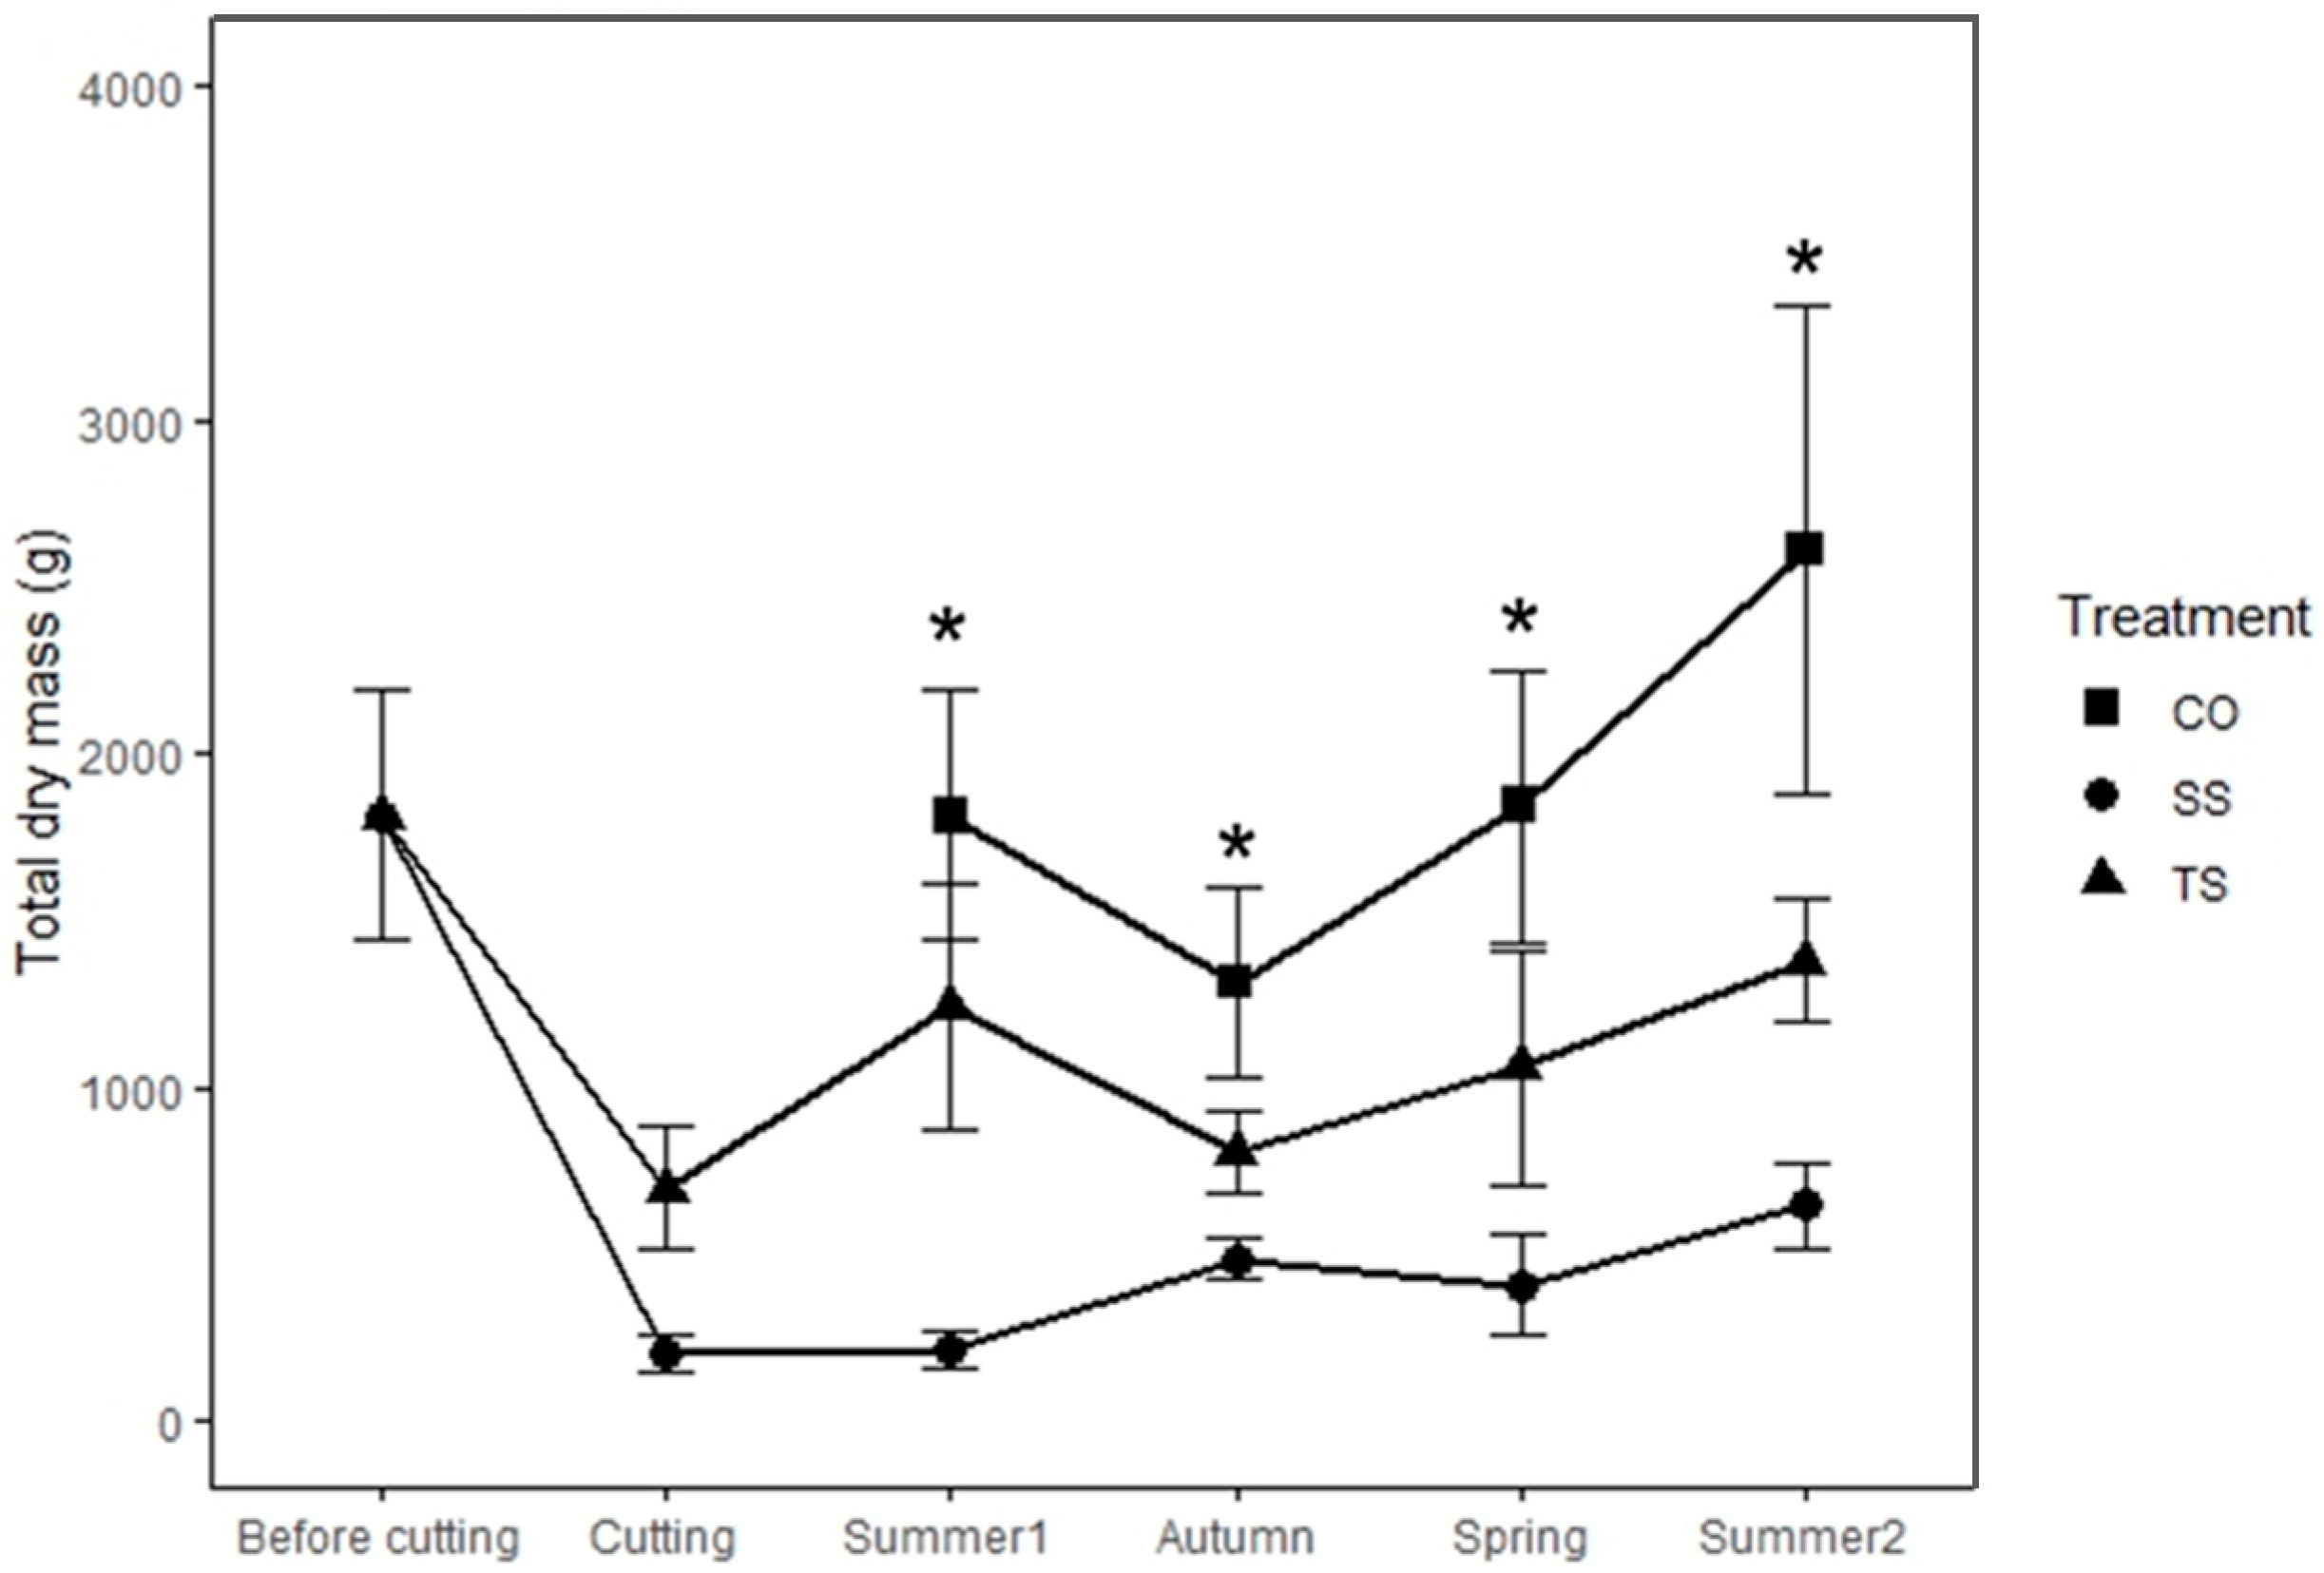
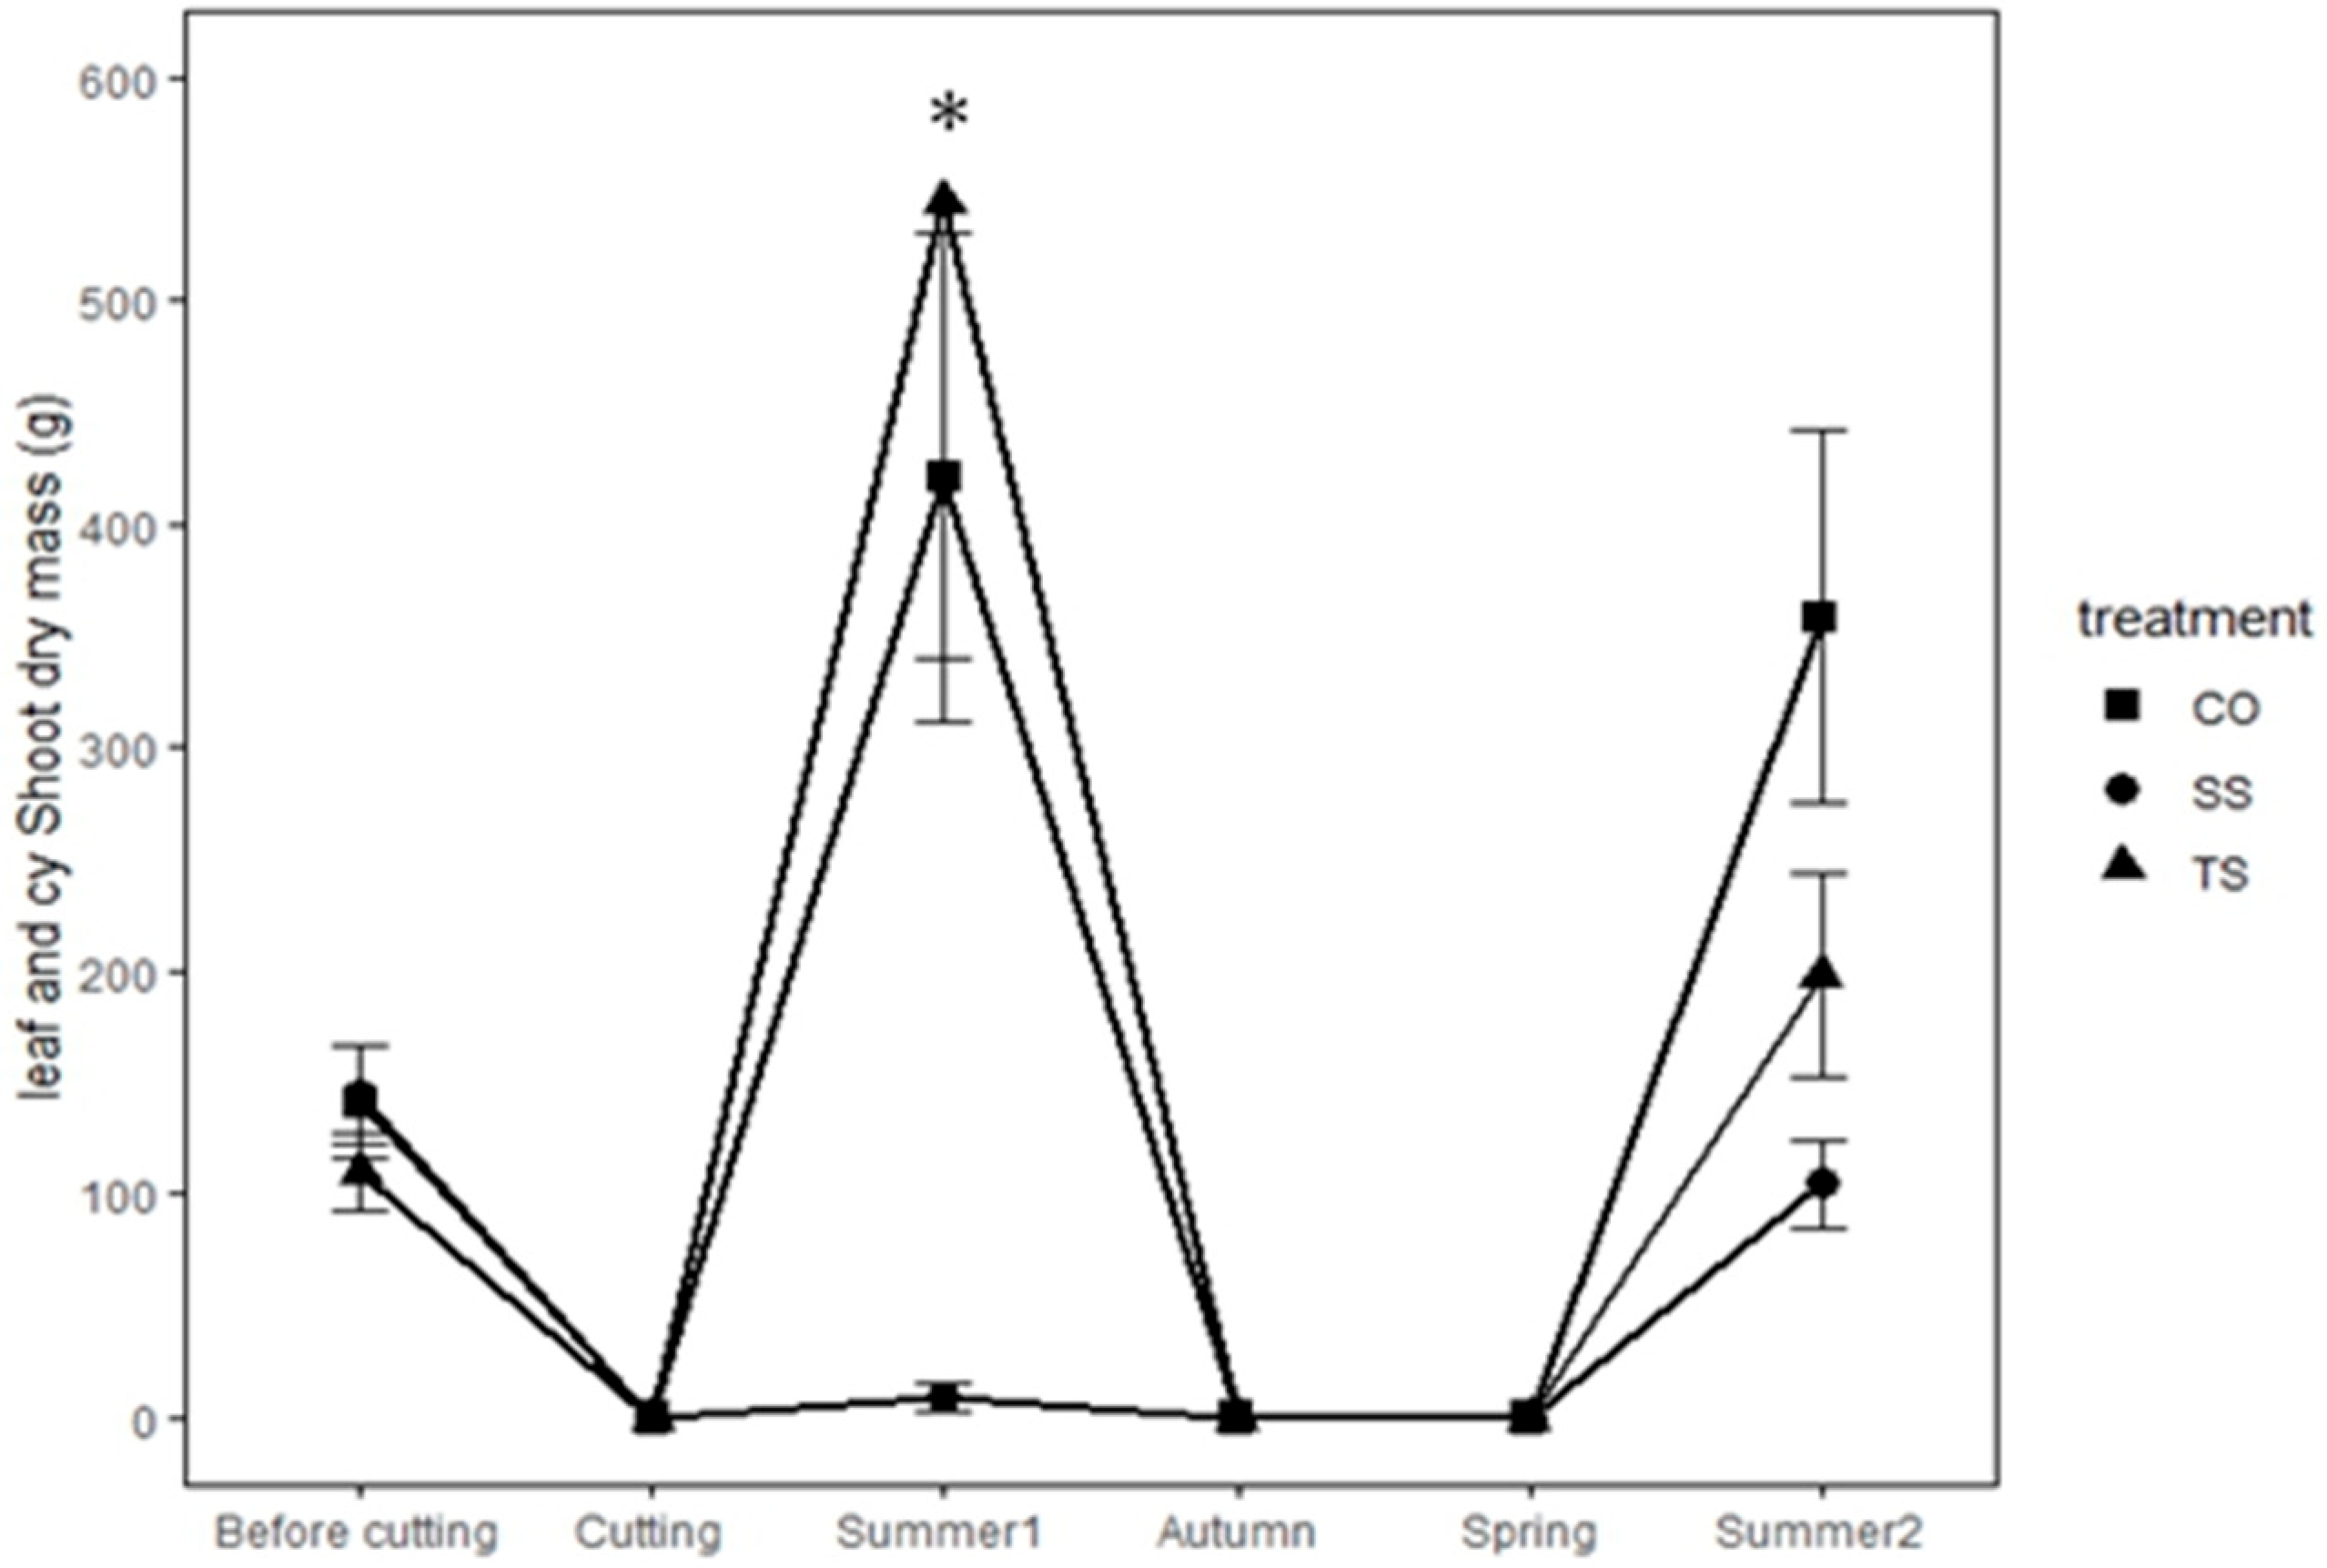
3.1. Biomass Production

Resprout production was similar for both TS and SS trees, with budburst visually observed between two and three weeks after treatment application (mid-summer). In TS trees, resprouts generally emerged from the upper one-third of the cut-stem height, with no basal resprouts produced (Figure 4).
The total and resprout (new leaf and stem) dry mass increments after cutting in both TS and SS trees were not always linear throughout the season but showed progressive increases, eventually reaching the original values recorded before cutting (Figure 4). SS trees showed lower total and resprout (new leaf and current-year shoot) dry mass than TS trees throughout the seasons (Figure 4). Before cutting, TS tree growth reached 68.3% and 76.0% of the total dry mass in Summer 1 and Summer 2, respectively, while SS trees reached only 11.6% and 35.6%, respectively (Figure 4). For leaf and current-year shoots alone, TS trees exceeded the original dry mass before cutting (129.3%), whereas SS trees showed only a 2.20% increase in Summer 1. In Summer 2, TS trees exhibited a smaller dry mass increment compared to Summer 1 (47.10%), whereas SS trees showed a higher increment than in Summer 1 (24.90%) (Figure 4).
A significant difference in total dry mass between the pre-cutting stage and both the current year (Summer 1) and one year later (Summer 2) was observed only in SS trees (Figure 4). Meanwhile, the resprout dry mass showed a significant difference only between the pre-cutting stage and Summer 2 in SS trees (Table 1). The resprout dry mass of TS trees was greater in Summer 1 than in Summer 2, while SS trees exhibited the opposite trend (Figure 5; Table 1). TS trees surpassed the total and resprout dry mass of the control trees during the year of observation, showing no significant differences (Figure 4 and Figure 5; Table 1).
We identified the visual appearance of new shoots to interpret their characteristics as a response to physical disturbance and associated resource-regaining activity. The number of new shoots was greater in TS trees than in SS trees in both summers, with CO trees having the highest number of new shoots overall (Table 2). In Summer 1, the total shoot length and volume of TS trees were greater than those of SS and CO trees. In Summer 2, only the shoot volume of TS trees remained greater than that of SS and CO trees (Table 2).

3.2. Organ Dry Mass Proportion

Leaves (Summer 1 = 16.05%; Summer 2 = 12.49%) contributed a larger proportion of the total plant dry mass than the current-year shoots (Summer 1 = 6.67%; Summer 2 = 2.08%) in CO trees across both summers, whereas stems (Summer 1 = 46.99%; Summer 2 = 37.41%) and roots (Summer 1 = 30.29%; Summer 2 = 41.92%) maintained relatively similar proportions (Figure 6A). In contrast to CO trees, TS trees showed a higher proportion of current-year shoots (20.79%) than leaves (17.87%) in Summer 1. However, this pattern shifted significantly in Summer 2, with the proportion of current-year shoots decreasing to 3.87% and leaves to 9.96% (Figure 6B). SS trees exhibited a low proportion of leaves and current-year shoots during Summer 1, which increased in Summer 2 (Figure 6C). In autumn, the proportions of leaves and current-year shoots were higher in both TS and SS trees compared to CO trees. In spring, SS trees showed the highest biomass proportion in current-year shoots (Figure 6C).

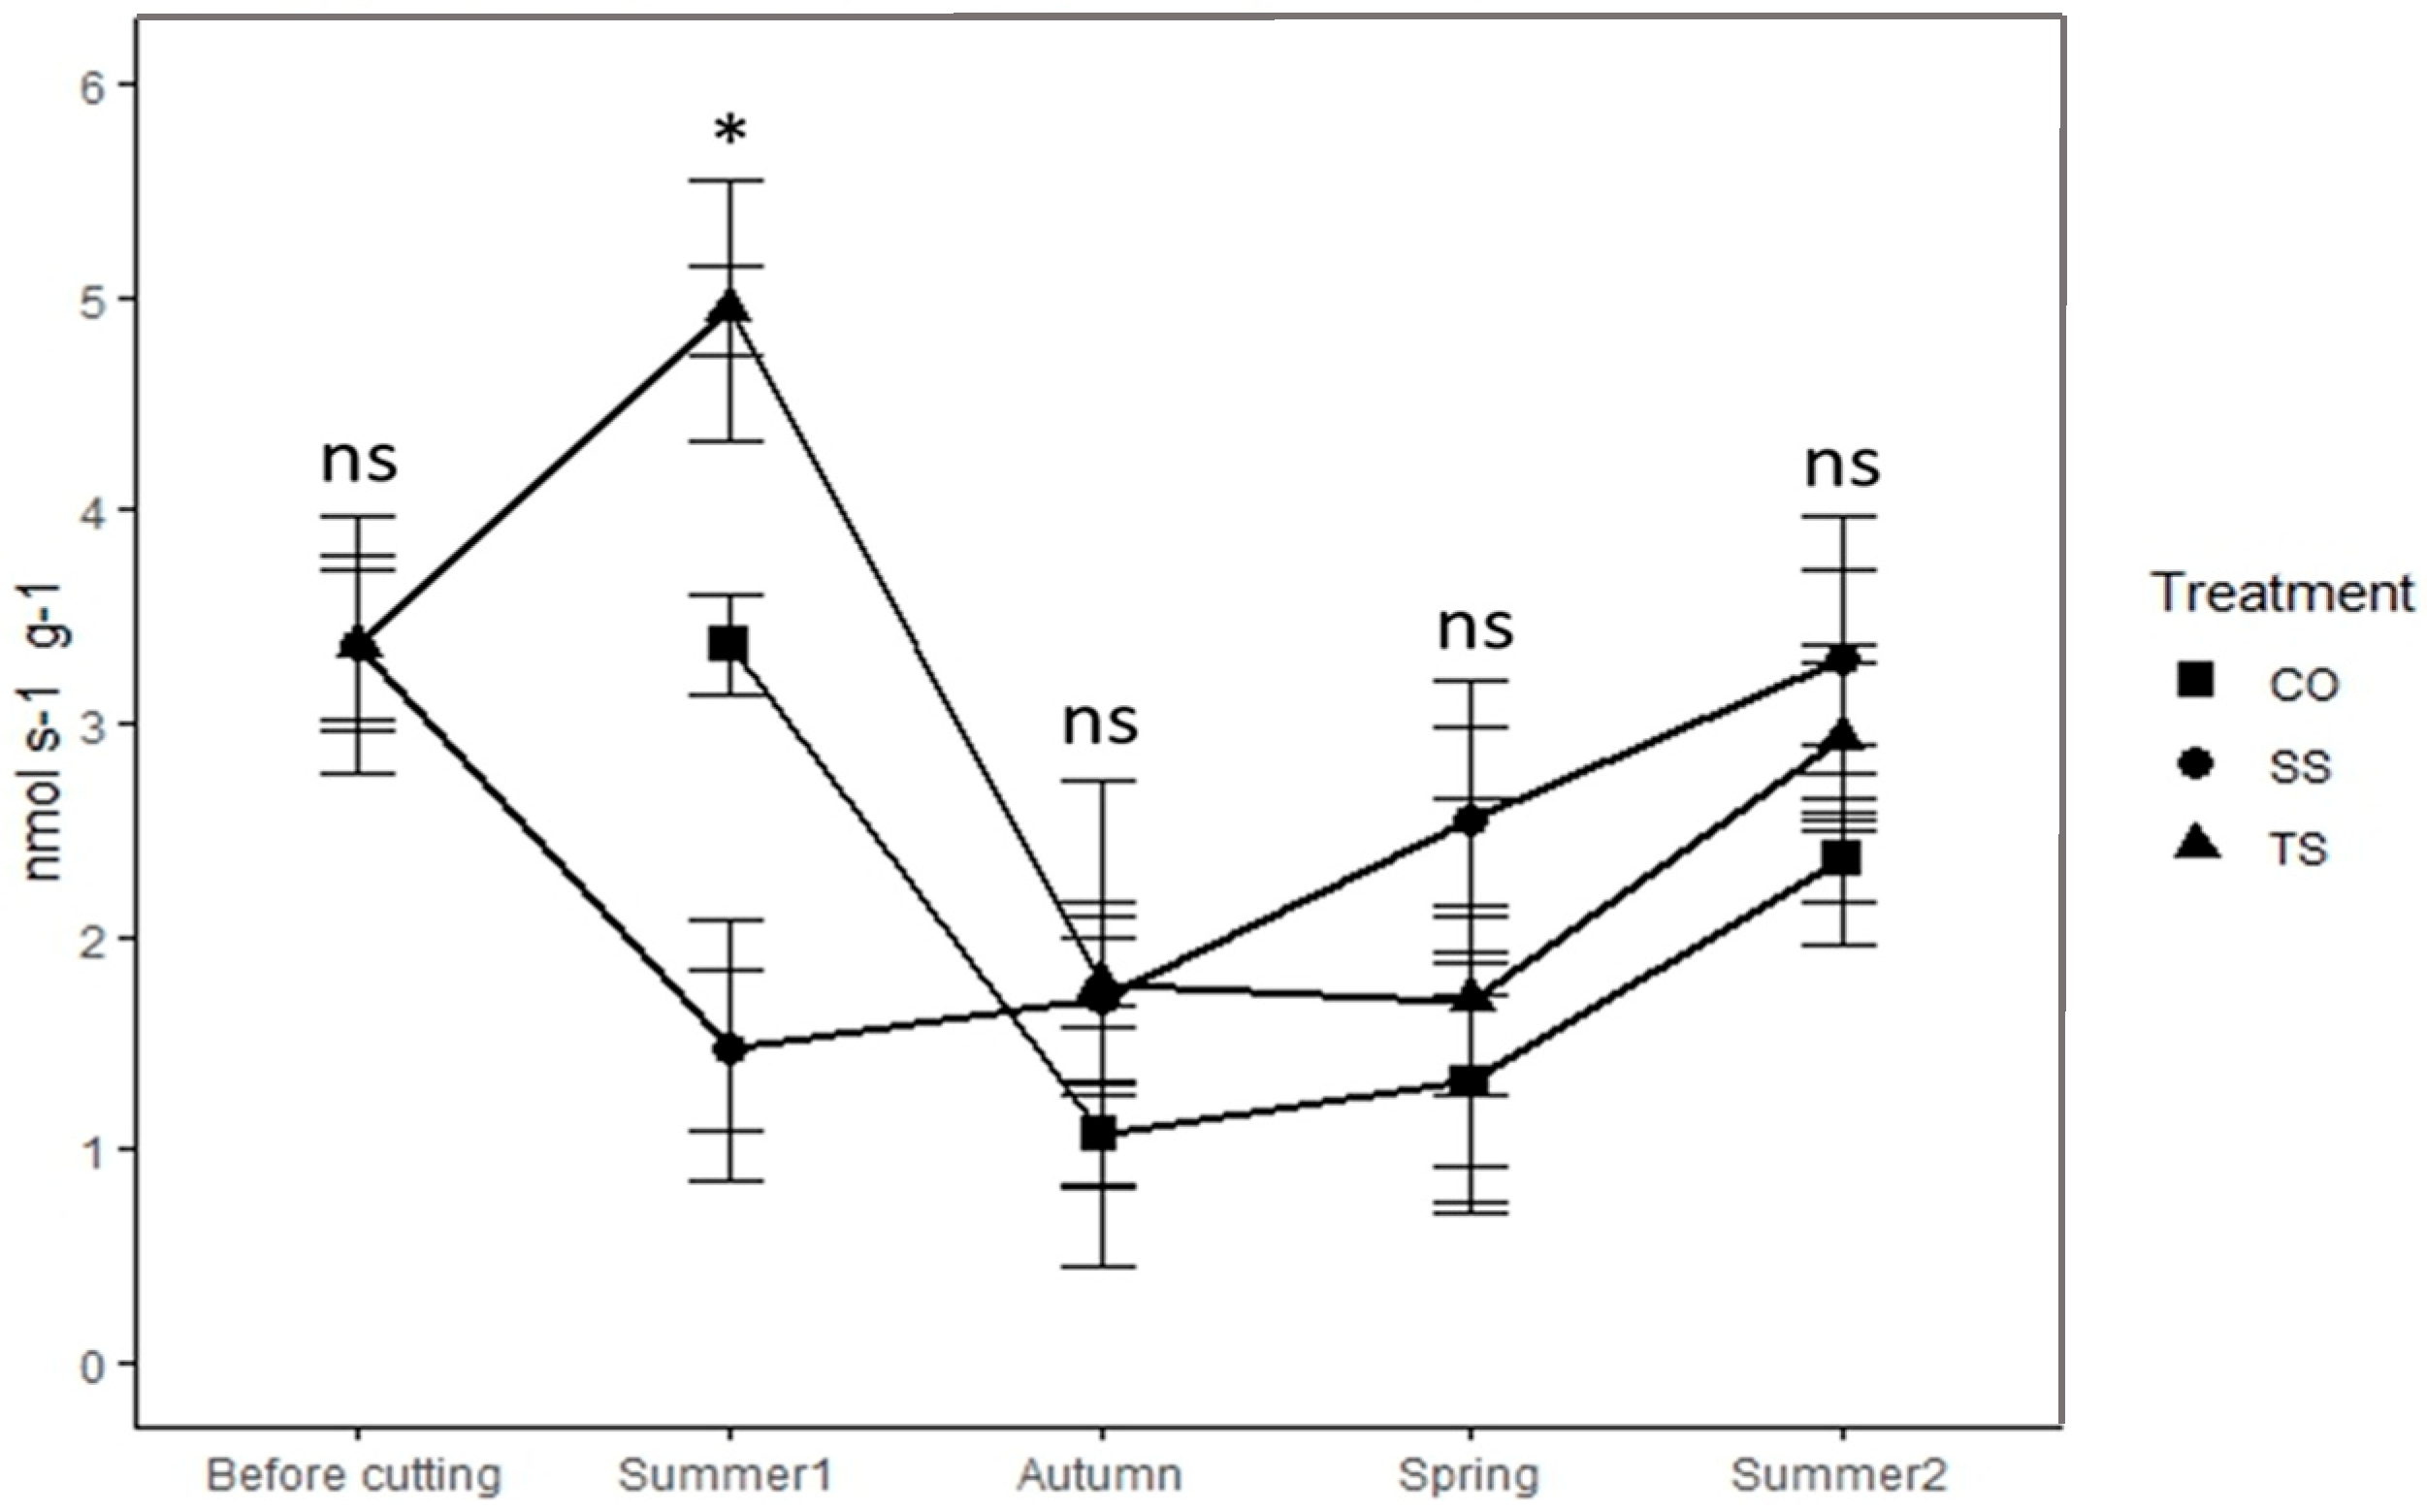
3.3. Whole-Plant and Organ Respiration Rates

TS trees showed significantly higher whole-plant respiration rates than SS and CO trees in Summer 1. However, their respiration rates decreased in the following season, resulting in lower values in Summer 2 compared to Summer 1 (Figure 7). In contrast, SS trees exhibited progressively increasing whole-plant respiration rates from Summer 1 to Summer 2, reaching the highest rates in Summer 2—opposite to the trend observed in TS and CO trees. Compared to the stage before cutting, whole-plant respiration rates in TS trees differed significantly only in autumn (p = 0.019) and spring (p = 0.032), while SS trees showed significant differences in Summer 1 (p = 0.037) and autumn (p = 0.050) (Figure 7; Table 3).
Leaf respiration rates were the highest among all organs across all treatments and sampling periods. SS trees had the highest leaf respiration rates in Summer 1 compared to TS and CO trees (Table 3). Compared to the pre-cutting stage, leaf respiration rates in TS and SS trees increased by 1.3 and 2.9 times, respectively, in Summer 1 but declined in Summer 2, showing no significant difference with respect to the pre-cutting stage (Table 3).
Stem and root respiration rates remained relatively lower than those of leaves and branches (current year shoots) across all treatments and sampling times (Table 3). TS trees showed higher stem respiration rates than SS trees in Summer 1 but lower rates in spring and Summer 2. CO trees exhibited relatively stable stem respiration rates throughout the sampling period.

3.4. NSCs at Whole-Plant and Organ Levels

Compared to before cutting, all organs (except leaves) of TS trees showed higher soluble sugar concentrations, with a significant increase observed only in the current-year shoot (p = 0.003), whereas concentrations decreased in SS trees (Table 3). All organs of SS trees showed increased soluble sugar concentrations in autumn (significant in leaf p = 0.05; stem p = 0.005) and spring (significant only in current-year shoot p = 0.015), followed by a decrease in Summer 2 (Table 3). In Summer 2, all treatments showed similar increases in soluble sugar concentrations compared to before cutting, with significant changes observed only in fine roots (p TS = 0.010; p SS = 0.024).
After cutting, starch concentrations decreased in the stump, fine roots, and coarse roots of both TS and SS trees (Table 3). This reduction was temporary, as both tree types showed increased starch concentrations in autumn. In spring, starch levels decreased in TS and CO trees but increased in SS trees. All treatments showed decreased starch concentrations in Summer 2. Compared to before cutting, significant reductions in starch concentration were observed in the stump (p = 0.005), fine roots (p < 0.001), and coarse roots (p < 0.001) of SS trees, and in the fine roots of TS trees (p = 0.001) (Table 3). By the end of the sampling period, only the current-year shoots and coarse roots showed higher starch concentrations in Summer 2 than before cutting in both TS and SS trees, while other organs (leaves, stump, and fine roots) showed lower concentrations.
NSCs concentrations in all organs of SS trees decreased significantly in Summer 1 compared to the pre-cutting stage, while no significant changes were observed in TS trees (Table 3). In autumn, the NSCs concentrations in all organs increased in both TS and SS trees but remained lower than those of CO trees. In spring and Summer 2, leaf NSCs concentrations in TS and SS trees were significantly lower than in CO trees, with no significant differences observed in other organs (branches, stems, and roots) (Table 3; see the Supplementary Materials dataset Table S1 for detailed each individual values).

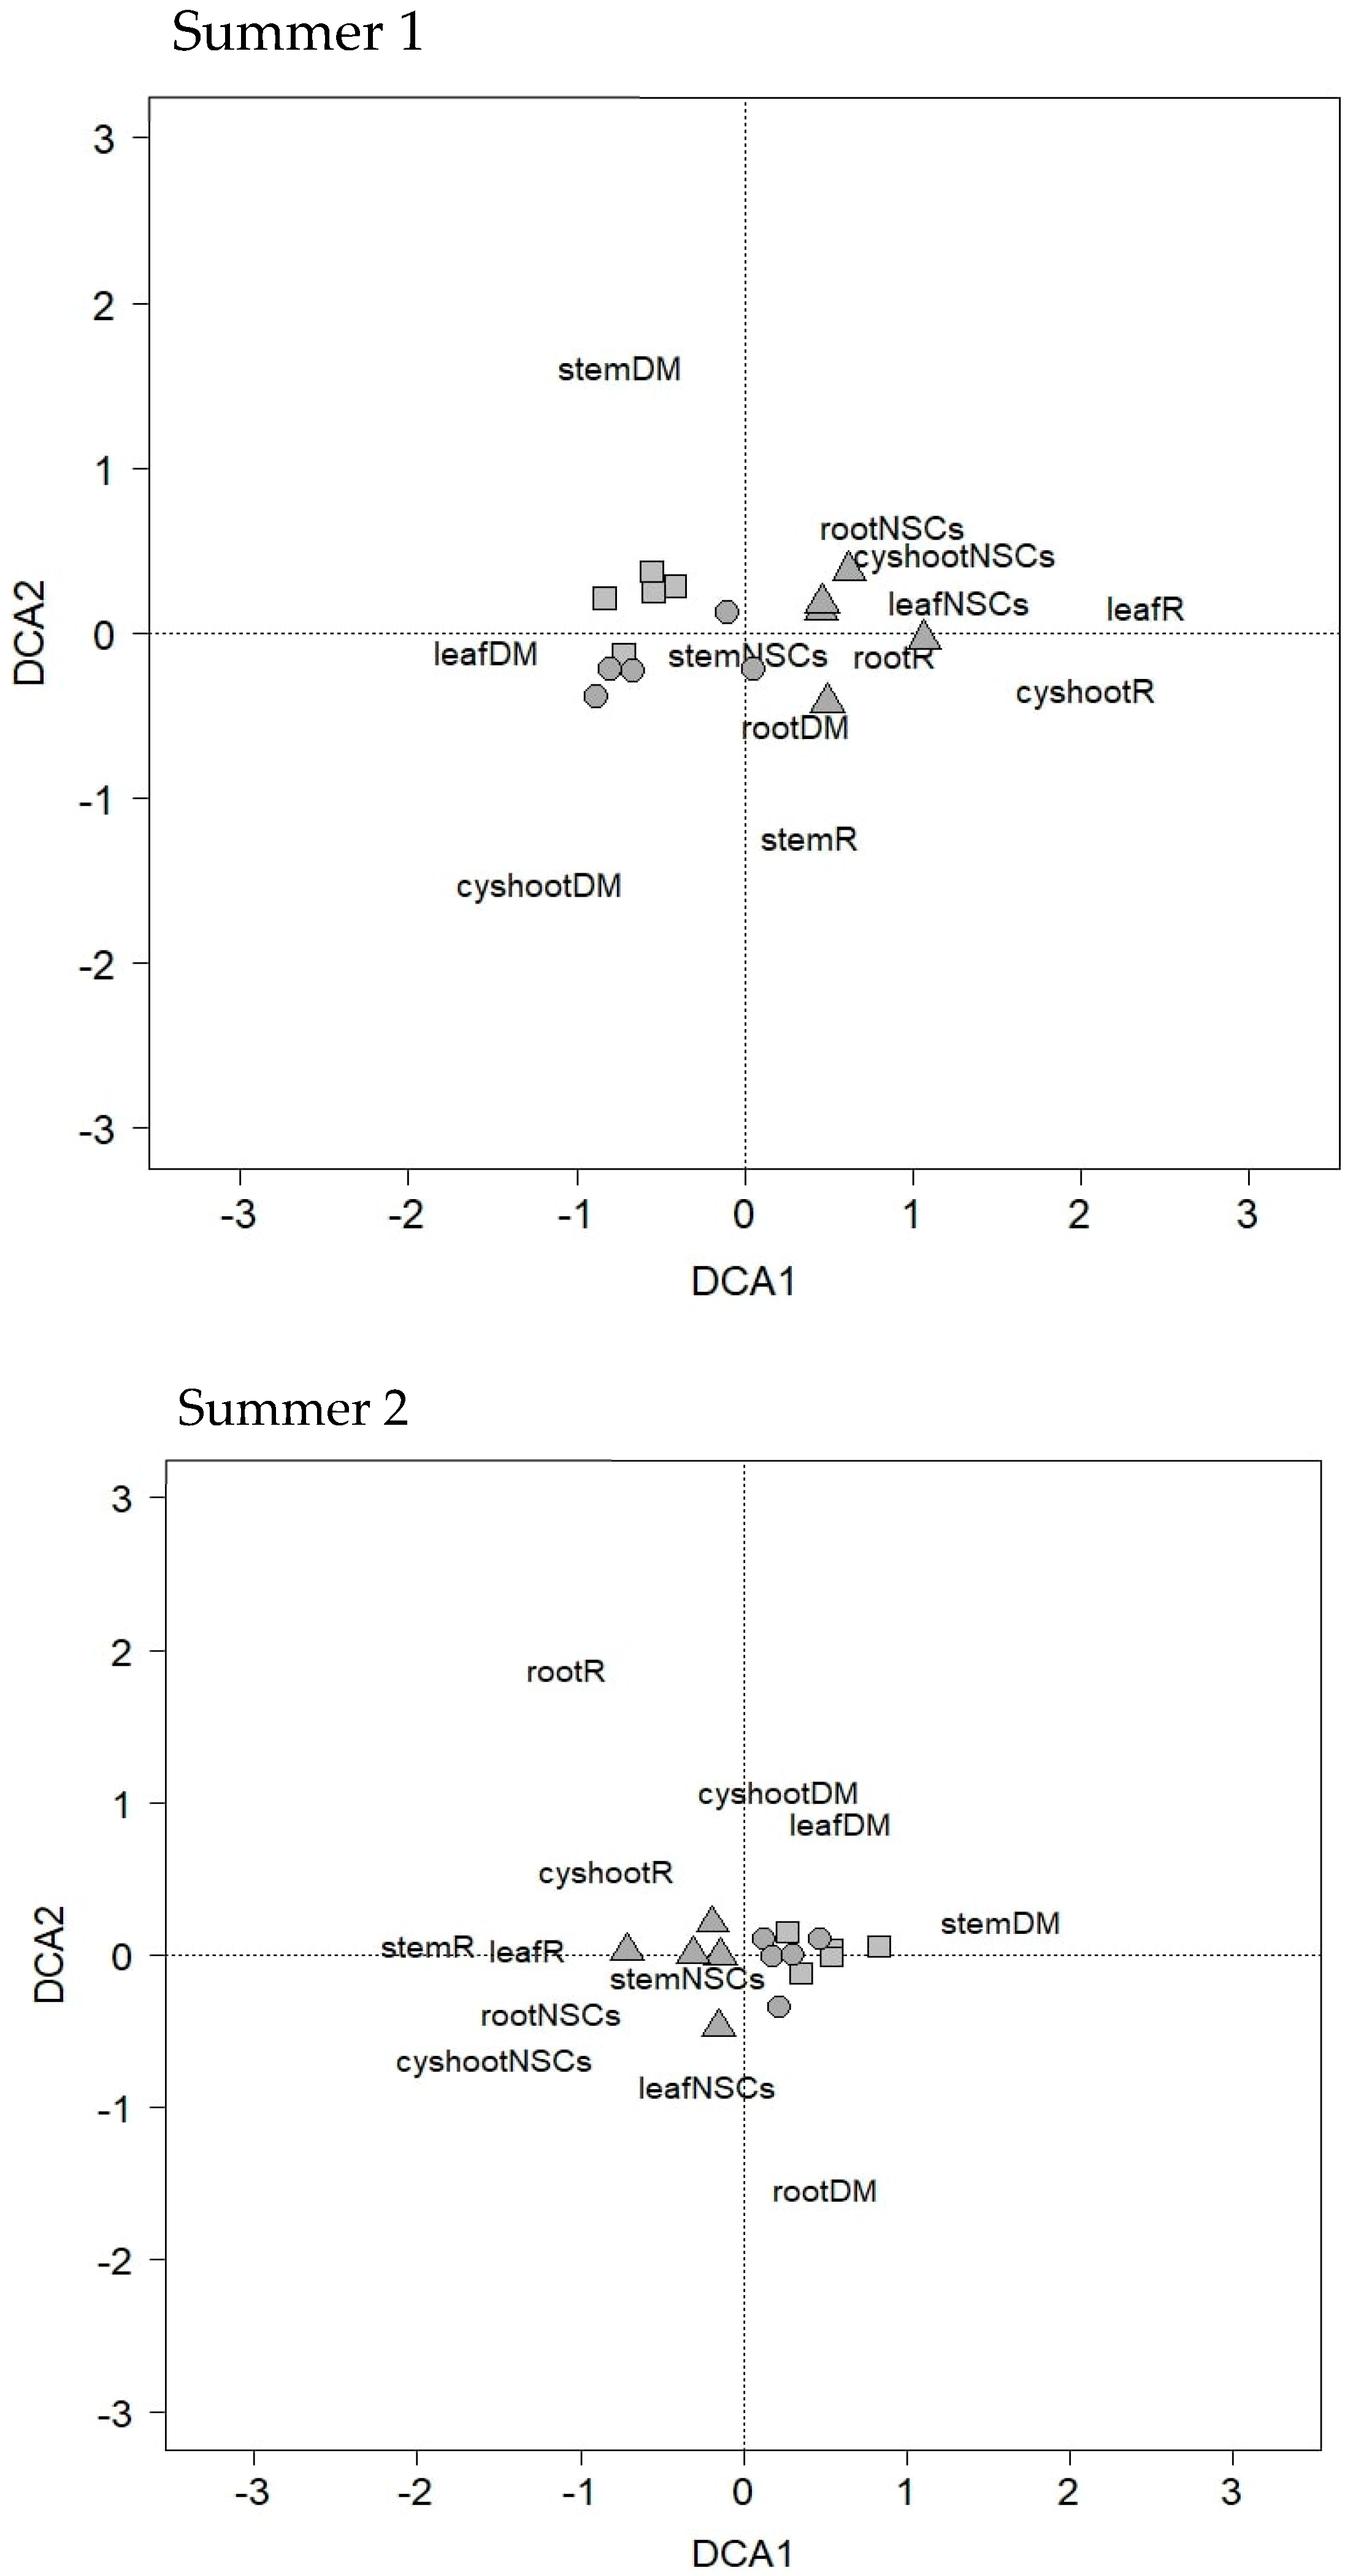
3.5. Detrended Correspondence Analysis (DCA)

We examined the relationships among parameters—including dry mass (DM), respiration rate (R), and NSCs—across all treatments: control (CO), tall-stump (TS), and short-stump (SS), using DCA (Figure 8). In both seasons, all treatments showed closely positioned points, indicating similar responses to stress and environmental conditions. The CO and TS trees formed a cluster, though they were slightly separated from the SS trees in both Summer 1 and Summer 2. Overall, the results showed consistent distances between the parameters and treatments.

4. Discussion

4.1. Resprouting Response and Biomass Recovery

Despite the larger total and resprout dry mass observed in TS (partly damaged) trees compared to SS (severely damaged) trees, all individuals resprouted vigorously and showed progressive recovery after cutting (Figure 4 and Figure 5). The lower total and resprout dry mass in SS trees resulted from greater organ loss and smaller stump size, which likely reduced resource availability (relying solely on roots) compared to TS trees. Despite a higher risk of carbon starvation—especially in the first year—all SS trees resprouted, although their dry mass remained lower than that of TS and CO (control) trees. These results align with previous studies that emphasize the importance of resource availability for plant recovery and survival in disturbed ecosystems [13,20,21]. In the case of R. pseudoacacia, root-derived resources alone are sufficient for recovery following severe organ loss.
TS trees showed no significant differences in the number of new shoots, total shoot length, or shoot volume compared to CO trees (Table 2). These findings demonstrate that partial organ loss significantly affects the resource status of R. pseudoacacia. The prioritization of main stem production in TS trees suggests that organ loss compromises carbon storage capacity. The fact that SS trees exceeded TS and CO trees in new shoot volume indicates that complete organ loss may not critically affect the persistence of this species. Thus, R. pseudoacacia tends to produce a large number of branches and stems, complicating control efforts. This finding supports previous observations that single clear-cutting does not significantly reduce resprouting [22].
TS trees, which produced greater resprout dry mass than SS trees, exhibited similar growth patterns in current-year shoots and leaf production. The current-year shoot dry mass exceeded that of the leaves in Summer 1 but was lower in Summer 2 (Figure 6). These trends highlight the role of re-establishing the main stem after cutting to support leaf development, maintain carbon storage for future growth, and facilitate resource transport from roots to aboveground organs [23,24]—particularly in Summer 1, which represents the short-term response period. The current-year shoot dry masses of TS trees in both Summer 1 and Summer 2 were also greater than that of CO trees, reflecting a stronger need to re-establish organs for resource replenishment and to support existing biomass (2). In some cases, partial cutting is used to enhance softwood production. For example, in conifers, basal area growth was higher in partial cuttings (65% removal; 2.6–4.9 m2·ha−1) than in uncut controls (1.7 m2·ha−1) [25,26]. Similarly, in large oaks (Quercus spp.), cutting increased basal area growth after four seasons [27]. Regardless of organ loss severity, these results demonstrate rapid resprouting in the fast-growing, resprouting species R. pseudoacacia, with visible growth appearing within two months post-cutting. This contrasts with other fast-growing species such as Eucalyptus oblique, where resprouting becomes visible only after 5–6 months [20,28]. This strong resprouting ability makes R. pseudoacacia highly suitable for land revegetation and rehabilitation as a pioneer species; however, it also presents serious challenges for population control.

4.2. Role of NSCs

The success of resprouting is supported by the availability of NSCs in the remaining organs [3,4]. Both TS and SS trees exhibited reduced NSCs concentrations—particularly starch—during the resprouting phase (Summer 1), as these reserves were utilized for the development of new shoots and leaves. SS trees had lower root starch content in Summer 1 than TS trees, indicating greater resource mobilization for resprouting (Table 3). The larger total and resprout dry mass observed in TS trees, compared to SS trees, was supported by greater resource availability in their stems and roots. Previous studies on Eucalyptus and Quercus species have similarly reported NSCs depletion following physical damage [1,20,28]. In particular, E. obliqua exhibited high root NSCs depletion during resprouting, a pattern consistent with that observed in SS trees [2]. TS trees required the production of more new organs than SS trees, due to the larger biomass that needed maintenance (e.g., the remaining stem) [29]. Both root and stem NSCs play vital roles in recovery, supporting the hypothesis that resprouting ability is closely linked to stored carbon reserves [30,31].

4.3. Resource Regain

Storage depletion in the stems and roots of TS and SS trees during resprouting in Summer 1 was only temporary, as NSCs and starch concentrations increased in autumn and eventually showed no significant differences compared to the stage before cutting by Summer 2 (Table 3). New leaves play a key role in carbon sequestration through photosynthesis, refurbishing the resources used by stems and roots, thereby supporting our second hypothesis. A study by Smith et al. (2018) [2] supports these findings, highlighting that temporary NSCs depletion—especially of starch—occurs during early resprouting but is reversed once new photosynthetic tissues are established [29]. New leaves conduct net carbon assimilation, while current-year shoots support nutrient and water transport from the root system [32,33,34]. TS trees produced more leaves than SS trees due to the greater demand for biomass maintenance, which in turn required more resources.

4.4. Resource Mobility and Organ Respiration During Resprouting

To support successful resprouting, carbon stored in the stem and root must be mobilized and transported to aboveground organs. This process requires high metabolic activity in the involved tissues, as indicated by elevated respiration rates in stems and roots—clearly observed in TS trees (Table 3). SS trees exhibited lower stem and root respiration rates than TS trees, likely due to reduced NSCs availability, which reduced the demand for energy-intensive transport processes. TS trees showed more rapid organ development than SS trees, as evidenced by their non-significant differences in whole-plant respiration rates compared to CO trees. In contrast, SS trees exhibited the lowest whole-plant respiration rates in Summer 1, which increased by Summer 2 (Figure 7). Whole-plant respiration reflects the cumulative activity of all organs in supporting recovery from damage, with peak activity occurring at different times depending on the plant’s developmental stage [19]. These findings support our hypothesis, emphasizing the importance of respiratory activity in stems and roots during carbon transport and that of resource utilization for resprouting and recovery.
Furthermore, leaves play a critical role in overall plant activity, with higher respiration rates observed in juvenile leaves compared to mature ones. In Summer 1, CO trees showed lower leaf respiration rates than both TS and SS trees, with SS trees exhibiting the highest rates among all treatments (Table 3). These elevated rates in TS and SS trees were due to the presence of young leaves formed during resprouting. Leaf development in Summer 1 corresponded with increased net photosynthesis and dark respiration, both of which decline as leaves mature, as observed in Summer 2 [35]. By Summer 2, leaf respiration rates did not differ significantly among treatments, suggesting synchrony in leaf age across all trees. These results highlight the critical role of leaf development in restoring photosynthetic capacity following damage to photosynthetic organs.

4.5. Resprouting and Resource Dynamics

To initiate resprouting, budburst in the stems promoted the establishment of new leaves, which required a high carbon investment. This is reflected in the high stem respiration rates observed in TS trees during Summer 1 (Table 3). Once new leaves were produced, resources were translocated to support leaf maintenance and carbon assimilation [36,37], as indicated by leaf respiration being the highest among all organs. In spring, budburst development is highly dependent on the plant’s ability to supply energy from available resources, and soluble sugar and starch concentrations often show an inverse relationship [9,36]. At the onset of spring, soluble sugar concentrations typically decrease while starch concentrations increase. This increase in starch is associated with the initiation of bud break, which then declines during the flush of vegetative growth as these resources are mobilized. Starch mobilization to aboveground organs in spring presumably reduces starch levels until the emergence of the first leaves. Root starch is generally more critical than stem starch in supporting bud break, as fine roots facilitate mineral uptake and coarse roots store the majority of reserves. In this study, SS trees may have undergone delayed leaf flushing in spring compared to TS and CO trees, as indicated by an initial increase in starch concentration that later declined by summer—likely due to its utilization in ongoing growth.
Importantly, no evidence of carbon starvation was observed in either TS or SS trees following cutting. While SS trees showed low NSCs concentrations in the roots during resprouting, they successfully recovered in the subsequent season through resource input from new photosynthetic activity. Both TS and SS trees experienced successful bud breaks, although it occurred later in SS trees. Partially damaged trees (TS) exhibited greater production of lost organs (leaves and stems) than undamaged trees, but only within a limited time frame during the current year. TS trees, having retained a larger stump than SS trees, needed to maintain a greater living biomass, thus placing higher demands on resource availability. These higher carbon demands necessitated greater photosynthetic activity and starch mobilization, particularly during the first year post-cutting. Thus, greater leaf production was observed in TS trees than in SS trees during this period. This finding suggests that partial disturbance of R. pseudoacacia is not recommended, as it may lead to even greater biomass production compared to undisturbed trees [3,14,37,38,39,40]. Complete disturbance (clear-cutting) is a more effective method for attempting to eradicate this species, although even this approach may not yield complete success. Further research on frequent cutting is recommended to explore the potential for inducing carbon starvation and to test the long-term depletion of stored resources. In addition, alternative management strategies for controlling R. pseudoacacia populations should be investigated, such as spring debarking or girdling, reinforced interventions in late summer, or cutting newly emerged shoots below the debarked region.

5. Conclusions

By comparing the resprouting ability and its activities, we demonstrated that saplings of R. pseudoacacia (i) perform rapid resprouting to overcome the mortality risk, which was supported by (ii) the finding of NSCs storage in the stump and root, which was useful for (iii) the stem respiration rate to transport resources and reproduce the new leaf, and (iv) the leaf respiration rate to maintain carbon assimilation. These results provide a foundation for resprouting strategies in R. pseudoacacia, which is a strong resprouter, to define tough characters even after full defoliation. Further studies are needed to address the unresolved questions regarding other factors that support the successful resprouting of R. pseudoacacia. We have provided comprehensive basic empirical information from repeated experiments that will enable more observations of the implementation of our results, such as performing frequent cutting, spring debarking, or girdling, to create a situation of carbon starvation. Successful and significant results on decreasing its population in the future are expected after the implementation of our results in the field, followed by continuous and careful observation.

Supplementary Materials

The following supporting information can be downloaded at https://www.mdpi.com/article/10.3390/f16071084/s1. Table S1: The data set of organ respiration rates, dry mass, and NSCs content in all treatments.

Author Contributions

C.G.Q. formulated the ideas and research design methods, collected samples, conducted field measurements and laboratory analyses, performed the statistical analysis, wrote the first draft of the article, and revised the manuscript. K.Y. supervised the design of the methods, participated in sample collection and measurement, and revised the drafts of the articles. B.L. participated in writing the article, made revisions, and provided funding for manuscript publications. N.I.M. wrote and revised drafts of the articles. All field sampling, laboratory analyses, and data analyses were conducted by C.G.Q. All authors have read and agreed to the published version of the manuscript.

Funding

This study was funded by the Ministry of Education, Culture, Sports, Science and Technology of Japan through a scholarship program for doctoral degrees (U3318002) and The United Graduate School of Agricultural Science, Iwate University, Japan.

Data Availability Statement

Data are contained within the article.

Acknowledgments

We express our gratitude to Kenichi Yoshimura for supporting this study and preparing this manuscript. We thank all members of the Forest Ecology Laboratory of Yamagata University for their assistance with sample collection and field measurements. We also would like to express a sincere gratitude to Shunichi Kikuchi for his invaluable guidance and advise in choosing the site for this study. We appreciate research funding support from the Ministry of Education, Culture, Sports, Science, and Technology of Japan and UGAS Iwate University. We appreciated the Warm-Temperate and Subtropical Research Center, National Institute of Forest Science, Republic of Korea for publication funding support.

Conflicts of Interest

The authors declare no conflicts of interest.

Abbreviations

The following abbreviations are used in this manuscript:
COcontrol trees
TStall-stump trees
SSshort-stump trees
NSCsnon-structural carbohydrates
DBHdiameter breast height
Ly-branchlast-year branch
Cy-shootcurrent-year shoot
ORorgan respiration rates
Rrespiration rates
DCAdetrended component analysis

References

  1. Nzunda, E.F.; Griffiths, M.E.; Lawes, M.J. Sprouting by remobilization of above-ground resources ensures persistence after disturbance of coastal dune forest trees. Funct. Ecol. 2008, 22, 577–582. [Google Scholar] [CrossRef]
  2. Smith, M.G.; Miller, R.E.; Arndt, S.K.; Kasel, S.; Bennett, L.T. Whole-tree distribution and temporal variation of non-structural carbohydrates in broadleaf evergreen trees. Tree Physiol. 2018, 38, 570–581. [Google Scholar] [CrossRef]
  3. Bellingham, P.J.; Sparrow, A.D. Resprouting as a life history strategy in woody plant communities. Oikos 2000, 89, 409–416. [Google Scholar] [CrossRef]
  4. Teixeira, A.M.C.; Curran, T.J.; Jameson, P.E.; Meurk, C.D.; Norton, D.A. Post-fire resprouting in New Zealand Woody Vegetation: Implications for restoration. Forests 2020, 11, 269. [Google Scholar] [CrossRef]
  5. Rodgers, H.L.; Brakke, M.P.; Ewel, J.J. Shoot damage effects on starch reserves of Cedrela odorata. Biotropica 1995, 27, 71–77. [Google Scholar] [CrossRef]
  6. Latt, C.R.; Nair, P.K.R.; Kang, B.T. Interactions among cutting frequency, reserve carbohydrates, and post-cutting biomass production in Gliricidia sepium and Leucaena leucocephala. Agrof. Syst. 2000, 50, 27–46. [Google Scholar] [CrossRef]
  7. Clarke, P.J.; Lawes, M.J.; Midgley, J.J.; Lamont, B.B.; Ojeda, F.; Burrows, G.E.; Enright, N.J.; Knox, K.J.E. Resprouting as a key functional trait: How buds, protection and resources drive persistence after fire. New Phytol. 2013, 197, 19–35. [Google Scholar] [CrossRef]
  8. Chapin, F.S., III; Schulze, E.D.; Mooney, H.A. The ecology and economics of storage in plants. Ann. Rev. Ecol. Syst. 1990, 21, 423–447. [Google Scholar] [CrossRef]
  9. Piper, F.I.; Paula, S. The role of nonstructural carbohydrates storage in forest resilience under climate change. Curr. For. Rep. 2020, 6, 1–13. [Google Scholar] [CrossRef]
  10. Lotscher, M.; Klumpp, K.; Schnyder, H. Growth and maintenance respiration for individual plants in hierarchically structured canopies of Medicago sative and Helianthus annuus: The contribution of current and old assimilates. New Phytol. 2004, 164, 305–316. [Google Scholar] [CrossRef]
  11. Weis, J.S. Respiration and metabolism. In Physiological, Developmental and Behavioral Effects of Marine Pollution; Springer: Dordrecht, The Netherlands, 2014; pp. 65–95. [Google Scholar]
  12. Zhang, X.; Wang, S. Joint control of plant ecological strategy by climate, regeneration mode, and ontogeny in Northeastern Chinese forests. Ecol. Evol. 2021, 11, 6703–6715. [Google Scholar] [CrossRef] [PubMed]
  13. Sala, A.; Piper, F.; Hoch, G. Physiological mechanisms of drought-induced tree mortality are far from being resolved. New Phytol. 2010, 186, 274–281. [Google Scholar] [CrossRef]
  14. Yamada, K.; Masaka, K. Present distribution and historical background of the invasive alien species Robinia pseudoacacia on former coalmine land in Hokkaido. Jpn. J. Conser. Ecol. 2007, 12, 94–102. [Google Scholar]
  15. Morimoto, J.; Kominami, R.; Koike, T. Distribution and characteristics of the soil seed bank of the black locust (Robinia pseudoacacia) in a headwater basin in northern Japan. Lands Ecol. Eng. 2010, 6, 193–199. [Google Scholar] [CrossRef]
  16. Masaka, K.; Torita, H.; Kon, H.; Fukuchi, M. Seasonality of sprouting in the exotic tree Robinia pseudoacacia L. in Hokkaido, northern Japan. J. Res. 2015, 20, 386–395. [Google Scholar] [CrossRef]
  17. Pausas, J.G.; Keeley, J.E. Evolutionary ecology of resprouting and seeding in fire-prone ecosystems. New Phytol. 2014, 102, 55–65. [Google Scholar] [CrossRef]
  18. Clarke, P.J.; Knox, K.; Wills, K.E.; Campbell, M. Landscape patterns of woody plant response to crown fire: Disturbance and productivity influence sprouting ability. J. Ecol. 2013, 93, 544–555. [Google Scholar] [CrossRef]
  19. Kramer, P.J.; Kozlowski, T.T. Physiology of Woody Plants; Academic Press: New York, NY, USA, 1979; Volume 7, pp. 258–281. [Google Scholar]
  20. Wiley, E.; Casper, B.B.; Helliker, B.R. Recovery following defoliation involves shifts in allocation that favour storage and reproduction over radial growth in black oak. J. Ecol. 2017, 105, 412–424. [Google Scholar] [CrossRef]
  21. Landhäusser, S.M.; Lieffers, V.J. Defoliation increases risk of carbon starvation in root systems of mature aspen. Trees 2012, 26, 653–661. [Google Scholar] [CrossRef]
  22. Kato-Noguchi, H.; Kato, M. Invasive characteristics of Robinia pseudoacacia and its impacts on species diversity. Diversity 2025, 16, 773. [Google Scholar] [CrossRef]
  23. Druege, U. Overcoming physiological bottlenecks of leaf vitality and root development in cuttings: A systemic perspective. Front. Plant Sci. 2020, 11, 907. [Google Scholar] [CrossRef] [PubMed]
  24. Zhang, H.; Mu, Y.; Zhang, H.; Yu, C. Maintenance of stem cell activity in plant development and stress responses. Front. Plant Sci. 2023, 14, 1302046. [Google Scholar] [CrossRef] [PubMed]
  25. Sakai, A.; Sakai, S.; Akiyama, F. Do sprouting tree species on erosion-prone sites carry large reserves of resources? Ann. Bot. 1997, 79, 625–630. [Google Scholar] [CrossRef]
  26. Sakai, A.; Sakai, S. A test for the resource remobilization hypothesis: Tree sprouting using carbohydrates from above-ground parts. Ann. Bot. 1998, 82, 213–216. [Google Scholar] [CrossRef]
  27. Götmark, F.; Schott, K.M.; Jensen, A.M. Factors influencing presence–absence of oak (Quercus spp.) seedlings after conservation-oriented partial cutting of high forests in Sweden. Scand. J. For. Res. 2011, 26, 136–145. [Google Scholar] [CrossRef]
  28. Kabeya, D.; Sakai, A.; Matsui, K.; Sakai, S. Resprouting ability of Quercus crispula seedlings depends on the vegetation cover of their microhabitats. J. Plant Res. 2003, 116, 207–216. [Google Scholar] [CrossRef]
  29. Miranda, J.C.; Rodríguez-Calcerrada, J.; Pita, P.; Saurer, M.; Oleksyn, J.; Gil, L. Carbohydrate dynamics in a resprouting species after severe aboveground perturbations. Eur. J. For. Res. 2020, 139, 841–852. [Google Scholar] [CrossRef]
  30. Schutz, A.E.; Bond, W.J.; Cramer, M.D. Defoliation depletes the carbohydrate reserves of resprouting Acacia saplings in an African savanna. Plant Ecol. 2011, 212, 2047–2055. [Google Scholar] [CrossRef]
  31. Smith, A.M.; Stitt, M. Coordination of carbon supply and plant growth. Plant Cell Environ. 2007, 30, 1126–1149. [Google Scholar] [CrossRef]
  32. Zhang, Z.; Gong, J.; Li, X.; Ding, Y.; Wang, B.; Shi, J.; Liu, M.; Yang, B. Underlying mechanism on source-sink carbon balance of grazed perennial grass during regrowth: Insights into optimal grazing regimes of restoration of degraded grasslands in a temperate steppe. J. Environ. Manag. 2021, 277, 111439. [Google Scholar] [CrossRef]
  33. Sevanto, S.; Mcdowell, N.G.; Dickman, L.T.; Pangle, R.; Pockman, W.T. How do trees die? A test of the hydraulic failure and carbon starvation hypotheses. Plant Cell Environ. 2014, 37, 153–161. [Google Scholar] [CrossRef] [PubMed]
  34. Verdaguer, D.; Ojeda, F. Root starch storage and allocation patterns in seeder and resprouter seedlings of two Cape Erica (Ericaceae) species. Am. J. Bot. 2002, 89, 1189–1196. [Google Scholar] [CrossRef] [PubMed]
  35. Shirke, P.A. Leaf photosynthesis, dark respiration and fluorescence as influenced by leaf age in an evergreen tree, Prosopis juliflora. Photosynth 2001, 39, 305–311. [Google Scholar] [CrossRef]
  36. Gersony, J.T.; Hochberg, U.; Rockwell, F.E.; Park, M.; Gauthier, P.P.G.; Holbrook, N.M. Leaf carbon export and nonstructural carbohydrates in relation to diurnal water dynamics in mature oak trees. Plant Physiol. 2020, 183, 1612–1621. [Google Scholar] [CrossRef]
  37. Li, Z.; Lai, Q.; Bao, Y.; Sude, B.; Bao, Z.; Liu, X. Carbon allocation to leaves and its controlling factors and impacts on gross primary productivity in forest ecosystems of Northeast China. Forests 2024, 15, 129. [Google Scholar] [CrossRef]
  38. Yamada, K.; Masaka, K. Dynamics in growth and survivals of Robinia pseudoacacia sprouts occurred after cutting conducted in different seasons. J. Jpn. Soc. 2009, 91, 42–45. [Google Scholar] [CrossRef]
  39. Nicolescu, V.N.; Redei, K.; Mason, W.L.; Vor, T.; Poetzelsberger, E.; Bastien, J.-C.; Brus, R.; Bancat, T.; Dodan, M.; Cvjetkovic, B.; et al. Ecology, growth and management of black locust (Robinia pseudoacacia L.), a non-native species integrated into European forests. J. Res. 2020, 31, 1081–1101. [Google Scholar] [CrossRef]
  40. Prevost, M.; Dumais, D.; Pothier, D. Growth and mortality following partial cutting in a trembling aspen–conifer stand: Results after 10 years. Can. J. For. Res. 2010, 40, 894–903. [Google Scholar] [CrossRef]
Figure 1. The study site with an 8000 m2 plot size of R. pseudoacacia located in Tsuruoka City, Yamagata Prefecture, northern Japan.
Forests 16 01084 g001
Figure 2. Schematic illustration of treatment groups: control (CO) (a), tall-stump (TS) (b), short-stump (SS) (c), and branch growth year (d). Current year growth (A) appears from the tip of the previous year’s branch (B) with new leaves grown in a crisscross manner.
Forests 16 01084 g002
Figure 3. Visual observation of the growth of new shoots in tall-stump (TS, upper pictures) and short-stump (SS, lower pictures) during the study.
Forests 16 01084 g003
Figure 4. Two-way ANOVA of mean recovery of total biomass (including root) in CO (square symbols), TS (circle symbols), and SS (triangle symbols) trees at all sampling times. Destructive methods were used to measure the dry mass of each organ in each treatment (n = 5). The significant p-value of biomass between seasons is 0.091, and between treatments it is <0.001. Error bars represent standard errors of means. Asterisks represent significant differences.
Forests 16 01084 g004
Figure 5. Leaf and current-year shoot dry mass in all treatments and the improvement at every season. Error bars represent standard error of means. Asterisks represent significant differences.
Forests 16 01084 g005
Figure 6. Proportion of organ to total dry mass in control, CO (A), tall-stump, TS (B), and short-stump, SS (C) in each sampling season. Cy refers to current-year shoot and ly branch refers to last-year branch. Numbers are mean proportions in percent.
Forests 16 01084 g006aForests 16 01084 g006b
Figure 7. Whole-plant respiration rate per unit dry mass (nmol·g−1·s−1) calculated from total each organ respiration rate (nmol·s−1) divided by total organ biomass (g) measured in each sampling time. Rwhole-plant was normalized to 25 °C. Samples ‘before cutting’ were control trees in summer (uncut). Asterisks denote the significant differences between treatments at each sampling time (p < 0.05). Error bars represent standard errors of means.
Forests 16 01084 g007
Figure 8. Detrended Correspondence Analysis (DCA) ordination of the entire dataset parameters, including dry mass (DM), respiration rate (R), and non-structural carbohydrates (NSCs) of leaf, cy shoot, stem, and root to the control (CO) (square symbols), tall-stump (TS) (circle symbols), and short-stump (SS) (triangle symbols).
Forests 16 01084 g008
Table 1. Independent t-test of total- and resprout (leaf and current-year shoot) dry mass (g) between before cutting (BC) and sampling times after the cutting in tall-stump (TS) and short-stump (SS) trees. Asterisks represent significant differences; ns = non-significant differences between the compared seasons.
SamplingCOTSSS
ppp
Total dry mass (g)
BC × Summer 10.515 ns0.143 ns0.030 *
BC × Autumn0.138 ns0.182 ns0.011 *
BC × Spring0.236 ns0.121 ns0.044 *
BC × Summer 20.164 ns0.381 ns0.012 *
Resprout (leaf and current-year shoot) (g)
BC × Summer 1NA0.101 ns0.002 *
BC × Summer 20.660 ns0.190 ns0.813 ns
Table 2. Mean values and standard errors of number of new shoots, total shoot length (cm), and volume of shoot (cm3) in control (CO), tall-stump (TS), and short-stump (SS) trees after 4 months post-cutting (Summer 1) and 14 months post-cutting (Summer 2) (n = 10 trees per treatment per year). Superscript letters denote significant differences between treatments in each year (one-way ANOVA, p ≤ 0.05).
Treatment Number of New ShootsTotal Shoot Length (cm)Volume of Shoot (cm3)
Summer 1Summer 2Summer 1Summer 2Summer 1Summer 2
CO23 ± 7 b140 ± 23 b560 ± 79 b1103 ± 172 a118 ± 26 a46 ± 10 a
TS15 ± 2 b112 ± 18 b658 ± 86 b1102 ± 167 a193 ± 41 a56 ± 11 a
SS4 ± 1 a29 ± 6 a263 ± 62 a859 ± 146 a113 ± 35 a63 ± 10 a
Table 3. Independent t-test for organ NSCs between treatments within the same sampling time. Values are mean organ NSCs and standard errors in control (CO), tall-stump (TS), and SS (short-stump). Values in bold are the highest value of the organ within the treatment. Letters indicate the significant different between mean values and bold characters represent the highest values among organs (p < 0.05).
TreatmentsLeafCurrent-Year ShootStemRootWhole-Plant
Mean ± SEpMean ± SEpMean ± SEpMean ± SEpMean ± SEp
Soluble sugar concentration (g/g)
Summer 1CO0.073 ± 0.004b0.030 ± 0.006a0.050 ± 0.006b0.046 ± 0.002b0.141 ± 0.010b
TS0.067 ± 0.009b0.030 ± 0.009a0.054 ± 0.007b0.049 ± 0.002b0.142 ± 0.008b
SS0.024 ± 0.004a0.028 ± 0.004a0.012 ± 0.003b0.028 ± 0.001a0.066 ± 0.004a
AutumnCO 0.058 ± 0.013a0.030 ± 0.013a0.029 ± 0.002a0.034 ± 0.003a0.128 ± 0.013a
TS0.070 ± 0.009a0.042 ± 0.009a0.029 ± 0.003a0.027 ± 0.002a0.142 ± 0.012a
SS0.059 ± 0.013a0.041 ± 0.0a0.024 ± 0.003a0.041 ± 0.004a0.148 ± 0.095a
SpringCO No leaf 0.043 ± 0.003a0.056 ± 0.006b0.049 ± 0.024a0.145 ± 0.085a
TSNo leaf 0.048 ± 0.006a0.026 ± 0.002a0.049 ± 0.026a0.123 ± 0.086a
SSNo leaf 0.049 ± 0.004a0.036 ± 0.002a0.046 ± 0.024a0.132 ± 0.044a
Summer 2CO 0.127 ± 0.014b0.049 ± 0.003a0.074 ± 0.008a0.044 ± 0.005a0.265 ± 0.019b
TS0.073 ± 0.087a0.036 ± 0.003a0.051 ± 0.010a0.034 ± 0.005a0.182 ± 0.012a
SS0.084 ± 0.016a0.039 ± 0.004a0.041 ± 0.006a0.034 ± 0.006a0.184 ± 0.017a
Starch concentration (g/g)
Summer 1CO0.017 ± 0.007b0.015 ± 0.007b0.032 ± 0.00b0.089 ± 0.003c0.073 ± 0.009b
TS0.018 ± 0.005b0.019 ± 0.005b0.028 ± 0.008b0.057 ± 0.009b0.066 ± 0.019b
SS0.008 ± 0.001a0.009 ± 0.001a0.003 ± 0.001a0.013 ± 0.003a0.019 ± 0.003a
AutumnCO0.014 ± 0.002a0.043 ± 0.002a0.053 ± 0.006b0.163 ± 0.009b0.091 ± 0.008a
TS0.016 ± 0.002a0.060 ± 0.002a0.038 ± 0.003a0.152 ± 0.011b0.109 ± 0.010b
SS0.015 ± 0.002a0.035 ± 0.002a0.034 ± 0.003a0.054 ± 0.011a0.082 ± 0.008a
SpringCONo leaf 0.027 ± 0.004a0.034 ± 0.004b0.103 ± 0.007a0.171 ± 0.009a
TSNo leaf 0.026 ± 0.007a0.032 ± 0.007b0.083 ± 0.014a0.148 ± 0.019a
SSNo leaf 0.026 ± 0.004a0.016 ± 0.005a0.103 ± 0.039a0.145 ± 0.005a
Summer 2CO 0.008 ± 0.001a0.036 ± 0.005a0.029 ± 0.009a0.075 ± 0.006a0.070 ± 0.011a
TS0.008 ± 0.001a0.016 ± 0.005a0.021 ± 0.006a0.072 ± 0.009a0.048 ± 0.007a
SS0.007 ± 0.001a0.023 ± 0.009a0.023 ± 0.011a0.084 ± 0.009a0.066 ± 0.018a
NSCs (%dw)
Summer 1CO7.87 ± 0.71b4.49 ± 0.76a8.20 ± 0.55b13.49 ± 0.37b8.98 ± 0.53a
TS7.56 ± 0.70b6.95 ± 0.70b8.22 ± 1.03b10.58 ± 1.13b8.42 ± 0.35a
SS3.44 ± 0.24a3.72 ± 0.45a1.18 ± 0.16a4.14 ± 0.63a7.48 ± 1.16a
Autumn CO5.66 ± 0.98a7.01 ± 0.39a8.24 ± 0.61b19.66 ± 0.92b14.11 ± 1.39a
TS5.89 ± 0.41a8.03 ± 0.64a6.73 ± 0.49ab17.84 ± 1.01b12.38 ± 0.97a
SS5.52 ± 0.62a6.87 ± 0.82a5.73 ± 0.35a9.53 ± 1.29a15.30 ± 1.26a
Spring CONo leaf 6.73 ± 0.31a8.91 ± 0.84b15.14 ± 0.91a13.95 ± 0.87a
TSNo leaf 7.33 ± 0.67a5.86 ± 0.37a13.17 ± 1.45a11.76 ± 1.17a
SSNo leaf 7.53 ± 0.45a5.26 ± 0.56a14.86 ± 0.55a14.50 ± 2.51a
Summer 2CO11.56 ± 0.84b8.54 ± 0.54a9.52 ± 1.39a11.89 ± 0.87a12.29 ± 1.32b
TS7.24 ± 0.71a5.26 ± 0.71a7.01 ± 1.42a10.64 ± 1.25a10.42 ± 1.13ab
SS7.31 ± 0.70a7.57 ± 1.73a5.15 ± 0.61a11.82 ± 1.46a7.43 ± 1.12a
Respiration rates (nmol·g−1·s−1)
Summer 1CO11.10 ± 2.07a4.89 ± 0.77a1.56 ± 0.27a1.94 ± 0.68a3.37 ± 0.61ab
TS15.02 ± 0.86a3.72 ± 0.50a2.75 ± 0.99a2.75 ± 1.16a4.94 ± 0.95b
SS32.22 ± 3.52b5.53 ± 0.88a0.60 ± 0.20a0.82 ± 0.13a1.47 ± 0.45a
Autumn CO11.68 ± 3.05a0.80 ± 0.09a0.64 ± 0.09a1.18 ± 0.23a1.07 ± 0.19a
TS15.32 ± 2.08a0.87 ± 0.14a0.70 ± 0.11ab1.41 ± 0.19a1.78 ± 0.35a
SS12.65 ± 1.39a0.88 ± 0.15a1.07 ± 0.11b1.10 ± 0.15a1.71 ± 0.41a
SpringCONo leaf 0.89 ± 0.37a0.56 0.14a2.14 ± 0.38a1.32 ± 0.23a
TSNo leaf 0.92 ± 0.20a0.82 ± 0.13a2.51 ± 0.26a1.70 ± 0.21ab
SSNo leaf 1.66 ± 0.84a3.45 ± 1.07b2.65 ± 0.46a2.54 ± 0.38b
Summer 2CO9.37 ± 1.69a5.34 ± 1.93a1.22 ± 0.20a1.19 ± 0.20a2.36 ± 0.40a
TS13.69 ± 1.74a7.53 ± 1.03a1.42 ± 0.27a1.32 ± 0.28a2.93 ± 0.44a
SS16.54 ± 2.77a6.31 ± 1.20a2.67 ± 0.40b1.14 ± 0.31a3.31 ± 0.66a
Disclaimer/Publisher’s Note: The statements, opinions and data contained in all publications are solely those of the individual author(s) and contributor(s) and not of MDPI and/or the editor(s). MDPI and/or the editor(s) disclaim responsibility for any injury to people or property resulting from any ideas, methods, instructions or products referred to in the content.

