Abstract
In the context of China’s ecosystem facing a high intensity of nitrogen loads, carbon–nitrogen interactions are receiving increasing attention. Physical protection by soil aggregates is critical for soil carbon and nitrogen sequestration in terrestrial ecosystems; however, there is currently limited information on how nitrogen addition influences carbon and nitrogen dynamics across different stages of forest ageing. Herein, a field nitrogen manipulation experiment over 6 years was established in subtropical forests (46, 78, and about 200 years old) in China. Aggregate fractions and stable isotope analyses were used to assess the effects of nitrogen addition. The results show that forest soil was dominated by macroaggregates, and these increased with forest ageing (p > 0.05). The macroaggregates’ carbon content decreased with forest ageing (p > 0.05), while the macroaggregates’ nitrogen content was highest in the 200-year-old forest. Nitrogen addition increased the aggregates’ carbon and nitrogen concentrations in the 46- and 200-year-old forests. The macroaggregates, under nitrogen addition in the 78- and 200-year-old forests, were relatively weak, while forest age and nitrogen addition mainly affected macroaggregate carbon and nitrogen concentrations to promote their carbon and nitrogen storage, and the macroaggregates were the main storage unit for fixing and protecting new carbon in soils. Nitrogen addition increased the macroaggregates’ δ13C abundance in the 78- and 200-year-old forests and decreased it in the 46-year-old forest (p > 0.05); significantly increased the macroaggregates’ δ15N in the 46-year-old forest (p < 0.05), and decreased the macroaggregates’ δ15N in the 200-year-old forest (p > 0.05). Considering the distribution of δ13C and δ15N in the aggregates, the effect of nitrogen addition on the dynamic mechanism of soil aggregate carbon and nitrogen fractions varied based on forest age and aggregate size. Correlation analysis further revealed that soil total phosphorus, NH4+-N, NO3−-N, dissolved organic nitrogen, pH, texture, etc., were the primary predictors explaining most of the variation in aggregate fractions and their δ13C distribution. In summary, the effect of nitrogen deposition on the carbon and nitrogen stability of soil aggregates in broad-leaved forests depends on forest age.
1. Introduction
Nitrogen (N) is one of the key elements involved in the global ecosystem cycle, and over the past century, human activities have greatly increased the amount of reactive N released into the atmosphere, which subsequently enters the biosphere through deposition [1,2,3]. At present, China, as the largest developing country, has become the world’s largest producer and emitter of reactive N [4]. Over the past three decades, nitrogen deposition across China has risen from 11.1 to 15.3 kg ha−1∙year−1, with higher deposition levels observed in subtropical regions compared to temperate ones [2]. Recent studies indicate that atmospheric N deposition in China is beginning to level off or decline. However, the ecological responses of systems previously subjected to high nitrogen loads under decreasing atmospheric N deposition scenarios remain insufficiently explored [5,6].
The estimated global stock of soil organic carbon (SOC) to a depth of 1 m is about 1500 Pg, exceeding the total carbon stored in both vegetation and the atmosphere [1]. Organic C (carbon) in forest ecosystems accounts for approximately 60% of the total organic C in terrestrial ecosystems, with about 70% of that C stored in soils [1]. Studies have shown that anthropogenic N inputs into subtropical terrestrial ecosystems can intensify phosphorus (P) limitation in nutrient availability [3,7,8]. Furthermore, decreasing P availability combined with increasing N enrichment may lead to variable patterns of SOC accumulation under nitrogen deposition scenarios in subtropical forests [9]. Given the extensive coverage of evergreen broad-leaved forests in the subtropical region, both positive and negative changes in soil C storage in response to N deposition could significantly influence atmospheric CO2 concentrations, with potential implications for future global climate change [10,11].
Soil aggregates play a critical role in regulating nutrient availability and the dynamics of C and N in soils [12,13]. They store over 90% of soil C and N, and promote the accumulation and persistence of SOC by forming complex structures that limit decomposer accessibility [14]. As such, soil aggregation is often used as an indicator of SOC stability [15] and represents a key focus in current research on soil C and N sequestration [16]. According to the hierarchical concept, soil aggregates can be divided into three categories: macroaggregates (>250 μm), microaggregates (53–250 μm), and silt-clay fractions (<53 μm) [12]. The content and availability of SOC vary among these size classes, with a consensus that SOC occluded within smaller aggregates tends to be more stable than larger ones [15,17]. Macroaggregates, which are relatively dynamic, contain plant residues and form the particulate organic carbon (POC) pool. Despite their transient nature, macroaggregates can influence long-term carbon sequestration on centennial timescales or longer, through interactions with smaller aggregate fractions [11,13].
N deposition significantly impacts the formation and stability of soil aggregates by influencing both biotic factors—such as litter input, root turnover, and fungal mycelium—and abiotic factors, including the availability of P and N as well as soil pH [15,18,19]. Recent studies suggest that the impact of N addition on SOC decomposition is more strongly influenced by the degree of physicochemical protection, such as aggregate occlusion and mineral binding than by the organic substrates’ biochemical composition [20]. It has been shown that under N-enriched conditions, changes in the SOC concentration of aggregates can explain more than 80% of the variation in SOC concentration and therefore affect C storage [21]. The distinct responses of soil aggregate fractions to N deposition under various climatic or vegetation conditions may have contrasting effects on the future potential for terrestrial carbon sequestration [21,22]. Under N deposition, the breakdown of soil aggregates can release previously protected organic matter, exposing it to oxidizing conditions and thereby increasing CO2 emissions [22,23]. Conversely, the enhanced formation of soil aggregates can limit organic matter decomposition by soil microbes, promoting greater SOC sequestration [23]. Various studies suggest that soil aggregates respond differently to N enrichment, depending on both their initial conditions and ambient environmental properties [2,24,25,26]. These factors can change significantly with increasing stand age [27,28,29].
At the beginning of succession, increased SOC content promotes aggregate formation, while newly input organic C in old-growth forests decreases and SOC is in a stable state [28,29,30]. Thus, the dominant factor, controlling the C content of aggregates, may change during the process of forest ageing [31]. According to Qiu et al. [32], afforestation led to average increases in SOC concentrations of 116%, 128%, and 108% within macroaggregates, microaggregates, and silt–clay fractions, respectively. Conversely, Chen et al. [33] found that C concentrations in both microaggregates and macroaggregates did not increase significantly with forest development; rather, the significant increase in relative C stocks within aggregates was attributed to an increase in aggregate abundance. Given that soil C cycling responses to N additions are highly context-dependent, it is essential to investigate the mechanisms of SOC conservation at different stages of forest succession under N deposition [34,35].
Changes in stable C and N isotope abundance, accompanying SOC transformation, are useful for tracking the process of soil C and N migration related to N deposition [25,36,37]. Considering enriched soil δ13C and δ15N due to the microbial decomposition of fresh organic matter, testing the δ13C and δ15N abundance of soil and aggregate could provide an in-depth study of the biological mechanism of SOC accumulation and loss under N-enriched conditions [25,36]. Under different experimental background conditions, N deposition could increase δ13C-depleted plant detritus to macroaggregates to reduce its decomposition, but also could promote microbial activity, resulting in SOC content decreasing and δ13C enrichment [23,36]. Currently, systematic studies on the stable isotopes of soil aggregates in broad-leaved evergreen forests are limited. To better understand the processes governing soil C and N cycling and storage within aggregates, it is crucial to investigate the relationships between the soil C and N isotope abundances of aggregates in the context of nitrogen deposition in these ecosystems [37,38].
Accordingly, further investigation into C sequestration, the coupling of C and N in soil aggregates, and their regulatory mechanisms during forest succession under nitrogen deposition is essential for a precise understanding of forest carbon sinks in response to global change. The goal of this study was to comprehensively evaluate the effects of N addition on the quantity and composition of aggregate-associated fractions in the evergreen broad-leaved forests of China. For this purpose, three forest sites of different ages (46, 78, and 200 years old) with N addition treatments were selected in the evergreen broad-leaved forests of Anhui Province, China. Our research objectives were to measure (1) soil organic carbon, (2) soil total nitrogen, and (3) stable isotope characteristics across different soil aggregate size classes in the study area. We hypothesized that older forest stands would have greater stability and higher carbon and nitrogen content in soil aggregates, with younger forest stands being more variable. We also believed that adding nitrogen to these forest systems would alter the soil physiochemical properties, thereby influencing soil aggregates and their carbon and nitrogen stability.
2. Materials and Methods
2.1. Study Site
In this study, three evergreen broad-leaved forests of varying ages were chosen as long-term experimental sites to simulate nitrogen deposition in subtropical regions. The experimental sites were set up in Jitan Township (JT, 46 years old, 30°16′28″ N, 117°26′23″ E), Qimen County (QM, 78 years old, 29°37′05″ N, 117°32′30″ E), and Dashan Village (DS, 200 years old, 30°01′47″ N, 117°21′23″ E), all located in southern Anhui Province, which belongs to the northern reaches of a subtropical monsoon climate (Figure 1). A mean annual temperature of 16.0–16.6 °C has been observed, with temperature extremes ranging from –8.9 °C in winter to 38.8 °C in summer. Annual precipitation varies between 1521.0 and 1790.3 mm, predominantly occurring from April to September, which accounts for 71% of the total precipitation.
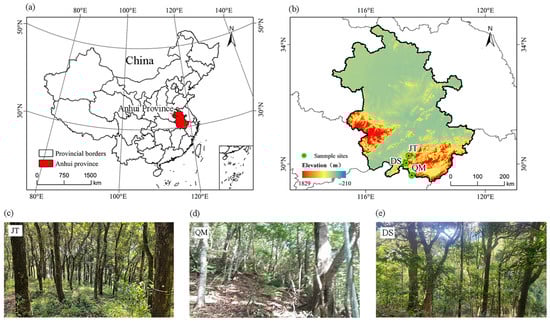
Figure 1.
Study area in Anhui Province, China: (a,b) Location of sample sites in China; (c) overview of the 46-year-old forest; (d) overview of the 78-year-old forest; (e) overview of the 200-year-old forest. Jitan Township: JT; Qimen County: QM; Dashan Village: DS.
The primary tree species at the experimental sites were Cyclobalanopsis glauca, Castanopsis sclerophylla, and C. eyrei, while the understory vegetation was primarily composed of Woodwardia japonica, Lindera aggregata, Camellia fraterna, and Symplocos sumuntia. The soils across the different plots are reddish yellow soils formed from the weathering of granite parent material. All soil layers within the study sites are classified as sandy loam or silty loam, with elevations ranging from 100 to 500 m.
2.2. Experimental Treatments
For this study, simulated nitrogen deposition experiments were initiated in 2011 at the three aforementioned sites using a completely randomized block design. Treatment levels were established based on the study area median N deposition rate (13 kg N·ha−1·year−1), and included CK (no addition of N or P), N (100 kg N·ha−1·year−1), and N + P (100 kg N·ha−1·year−1 + 50 kg P·ha−1·year−1), with each treatment replicated three times. Each experimental plot measured 20 × 20 m and was separated from adjacent plots by a 10 m buffer zone. N was applied in the form of NH4NO3, while phosphorus was supplied as Ca(H2PO4)2. Since wet deposition is the primary source of nitrogen input at the study sites, both nutrients were dissolved in 20 L of stream water. Beginning in June 2011, the solution was applied bi-monthly using a backpack sprayer, ensuring even distribution near the soil surface. An equal amount of stream water was applied to control plots, excluding any nutrient additions.
2.3. Soil Sampling and Soil Properties
In each plot, the litter layer was carefully removed prior to soil sampling. Fresh soil samples were collected from a depth of 0–10 cm using a 5.0 cm diameter soil corer, employing a five-point sampling strategy. All samples were promptly transported to the laboratory for processing and analysis in late July 2018. A portion of each sample was passed through a 5 mm sieve to isolate water-stable aggregates, while the remaining portion was sieved through a 2 mm mesh, thoroughly homogenized, and used for various soil analyses. Soil bulk density (BD), moisture content, ammonium nitrogen (NH4+-N), nitrate nitrogen (NO3−-N), dissolved organic carbon (DOC), dissolved organic nitrogen (DON), SOC, STN, pH, and total phosphorus (TP) were obtained from concurrent experiments, as previously published [39]. Additionally, soil texture was determined using the particle size classification method described in the literature [40].
2.4. Separation of Soil Aggregates
Water-stable aggregates were separated using the wet-sieving method with 0.25 mm and 0.053 mm mesh sizes, following the protocol established by Cambardella and Elliott [41]. Fresh soil samples were first passed through a 5 mm sieve and then air-dried for two weeks to reach a constant weight for the isolation of water-stable aggregates. Subsequently, 100 g of the air-dried bulk soil was immersed in deionized water on a 250 μm sieve for 5 min. Aggregates were separated by moving the sieve up and down 38 mm with 30 repetitions per minute for half an hour using a water-stabilized aggregate analyzer (HM-TL1, Shandong Hengmei Electronic Technology Co., Ltd, Weifang, China). Following wet sieving, macroaggregates (250–5000 μm) were collected from the top sieve, while microaggregates (53–250 μm) were retained on the 53 μm sieve. The silt and clay fraction (< 53 μm), along with the suspension water, was centrifuged, and the supernatant was discarded. If the recovery rate of soil after wet sieving was below 95% of the initial sample weight, the procedure was repeated using a new subsample. All aggregate fractions were subsequently oven-dried at 60 °C and weighed.
The macroaggregate (>0.25 mm), microaggregate (0.25–0.053 mm), and <0.053 mm size classes were dried in an oven at 45 °C for 24 h and then weighed. The two aggregate fractions (>53 μm size fractions) were ground gently to destroy aggregates and separate ground soils from sand on a 53 μm sieve. The sand fraction was weighed separately, and the sand-free portion of the soil that passed through the sieve was collected for subsequent analyses of C (or N) fractions, isotopic composition, and concentrations. SOC and STN were determined using an elemental analyzer (EA3000®, EuroVector, Pavia, Italy). As sand particles of similar size to aggregates are not considered part of the aggregate structure [16], both aggregate weights and the corresponding C and N stocks were corrected for sand content using the following formula:
To evaluate soil structural characteristics, the mean weight diameter (MWD) and mean geometric diameter (MGD) were calculated.
where wi represents the mass fraction (%) of aggregates in a given size class relative to the total sample mass, and xᵢ denotes the mean diameter (mm) of that size class.
The content of OC (or N) (g·m−2) in each aggregate size class was calculated as:
where wi is the mass fraction (%) of aggregates in its size class relative to the total mass of the sample, OCi (TNi) is the OC (N) concentration of its aggregate size class (g·kg−1 aggregate).
2.5. Stable Isotope Analyses
After being air-dried to a constant weight, soil samples were sieved through a 0.154 mm mesh. The stable C and N isotope abundances (δ13C and δ15N, ‰) were analyzed using an isotope ratio mass spectrometer (Delta V Advantage, Thermo Fisher, Germany). The calculation formulas are as follows:
where R is 13C/12C or 15N/14N, Rsp is the R value of the soil sample, Rsd is the R value of the reference material, the carbon isotope is based on PDB (Pee Dee Belemnite) as standard, and N isotopes are based on N2 in the standard atmosphere.
2.6. Statistical Analysis
We tested the effects of the CK, N, N + P, and forest age, and their interactions, on the soil aggregate fractions (i.e., the component percentage and its C (N) concentration and content), the isotope (δ13C, δ15N) abundances of the soil and aggregate by performing two-way analysis of variance (ANOVA). We assessed normality for all models using the Shapiro–Wilk test, histograms, and QQ plots of residuals. The homogeneity of variance was evaluated with Levene’s test. All models met the assumptions of normality and homogeneity. Principal coordinates analysis (PCoA) was used to illustrate the relationships between soil aggregate fractions and the isotope abundances of different sites. Further, we examined how the soil aggregate fractions and the isotope abundances were linked to soil properties using redundancy analysis (RDA). Pearson correlation analysis was performed to explore the relationships between soil physicochemical parameters, soil aggregate fractions, and stable isotope (δ13C and δ15N) abundances. RDA was performed using Canoco 5 software, while all other statistical analyses were conducted in R version 3.6.0.
3. Results
3.1. Effects of Forest Age and N Addition on Soil Aggregate Fractions and Stability
Forest age significantly affected the MGD, as well as the weight percentages of microaggregates and silt–clay fractions. Additionally, the interaction between forest age and N addition had significant effects on macroaggregates, microaggregates, MWD, and MGD (p < 0.05; Figure 2 and Figure 3; Table 1). Across all plots, macroaggregates comprised the largest proportion of bulk soil mass, averaging 82%, while microaggregates and silt–clay fractions accounted for an average of 11.7% and 6.1%, respectively.
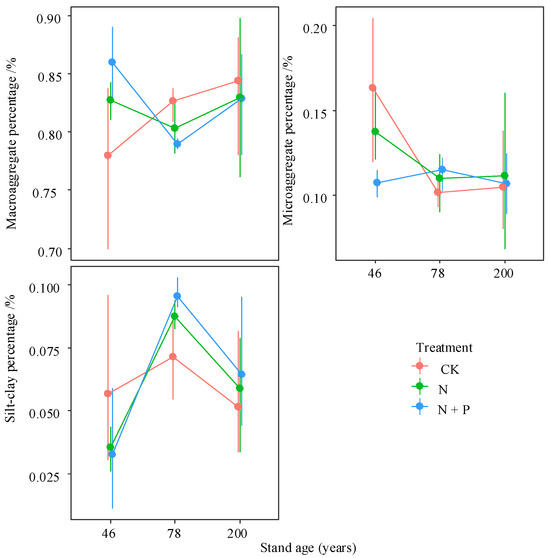
Figure 2.
Interactive effects of treatment and stand age on weight percentage of different aggregates. Treatments are the control (CK), nitrogen addition (N), and N and phosphorus addition (N + P). Values are bootstrapped means ± 95% confidence intervals (CIs) for individual samples and their sum. Differences between time since closure classes or soil layers is significant at p = 0.05 if their CIs do not overlap the other’s mean.
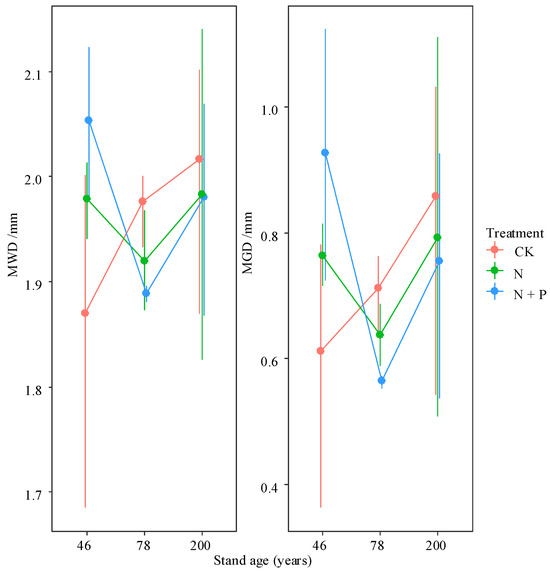
Figure 3.
Interactive effects of treatment and stand age on MWD and MGD. Treatments are the control (CK), nitrogen addition (N), and N and phosphorus addition (N + P). Values are bootstrapped means ± 95% confidence intervals (CIs) for individual samples and their sum. Differences among time since closure classes or soil depths are significant at p = 0.05 if their confidence intervals do not overlap each other’s means.

Table 1.
Interactive effects of treatment and stand age on indices related to soil aggregate fractions. Values are F statistics and statistically significant (p).
The proportion of macroaggregates increased with the increased forest age, while the proportion of microaggregates significantly decreased (p < 0.05) from the 46- to 78-year-old stands, with fewer changes between the 78- and 200-year-old stands, and the proportion of silt–clay fractions in the 78-year-old stands was more than that in the 46- and 200-year-old ones. N addition increased the proportion of macroaggregates in the 46-year-old stands but decreased it in the 78- and 200-year-old stands; however, the proportion of microaggregates and silty–clay particles changed in the opposite direction (Figure 2).
Across all treatments, MWD ranged from 1.87 to 2.05 mm, and MGD ranged from 0.56 to 0.92 mm. Both MWD and MGD increased with forest age. N addition led to increases in MWD and MGD in the 46-year-old forest but caused decreases in the 78- and 200-year-old forests (Figure 3), although these changes were not statistically significant (p > 0.05).
3.2. Effects of Forest Age and N Addition on Carbon, Nitrogen, and SOC/STN Distribution Within Soil Aggregate Fractions
Forest age had a significant effect on the C and N concentrations and contents of macroaggregates and microaggregates, as well as on the SOC/STN ratio across different aggregate sizes (p < 0.05; Table 1, Figure 4, Figure 5 and Figure 6 and Figure S1). N addition significantly influenced the C concentration in both macro- and microaggregates. Moreover, the interaction between stand age and N addition had a significant effect on the SOC/STN ratio of macroaggregates, as well as the C and N contents of various aggregate fractions (p < 0.05). These results suggest that stand age and N addition primarily affect the C content of macroaggregates by altering their C concentration.
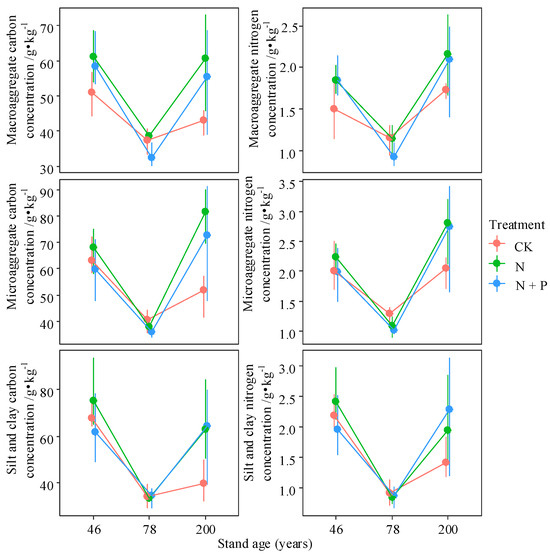
Figure 4.
Interactive effects of treatment and stand age on C and N concentration of different aggregates. Treatments include control (CK), nitrogen addition (N), and combined N and P addition (N + P). Data are presented as bootstrapped means ± 95% confidence intervals for individual aggregate fractions and their total. Differences among time since closure classes or soil depths are significant at p = 0.05 if their confidence intervals do not overlap each other’s means.
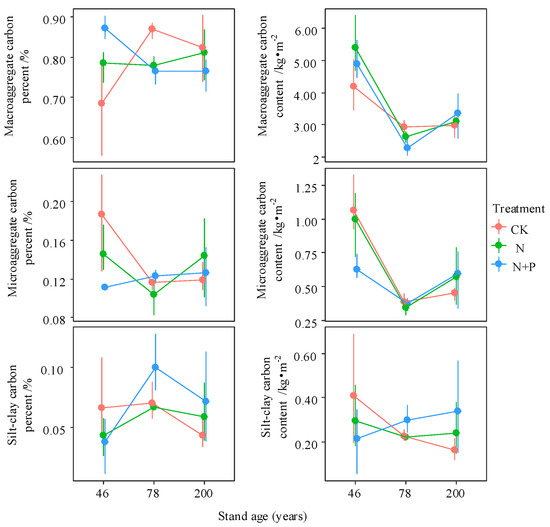
Figure 5.
Interactive effects of treatment and stand age on carbon content and mass proportion across different soil aggregate fractions. Treatments include control (CK), nitrogen addition (N), and combined nitrogen and phosphorus addition (N + P). Data are presented as bootstrapped means ± 95% confidence intervals for each aggregate fraction and their total. Differences among time since closure classes or soil depths are significant at p = 0.05 if their confidence intervals do not overlap each other’s means.
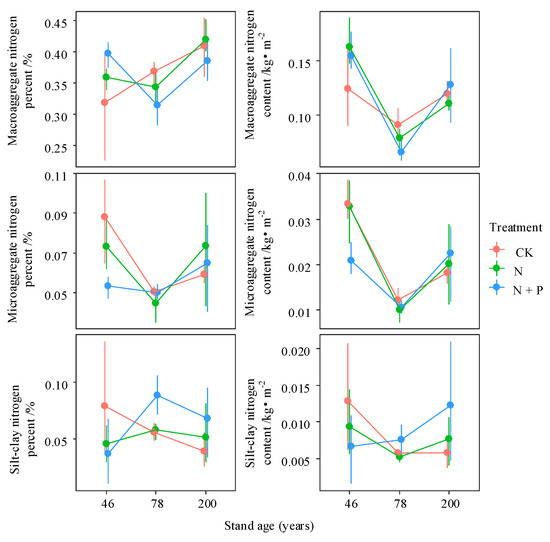
Figure 6.
Interactive effects of treatment and stand age on nitrogen content and mass proportion across aggregate size classes. Treatments include control (CK), nitrogen addition (N), and combined nitrogen and phosphorus addition (N + P). Data are presented as bootstrapped means ± 95% confidence intervals for individual aggregate fractions and their total. Differences among time since closure classes or soil depths are significant at p = 0.05 if their confidence intervals do not overlap each other’s means.
Across all aggregate fractions, macroaggregates contained the highest SOC content, followed by microaggregates. C and N concentrations in different aggregates were highest in the 46-year-old stand and lowest in the 78-year-old stand, except for the N concentration in the macroaggregates of the 200-year-old stand (Figure 4). N addition increased C and N concentrations in various fractions of the 46- and 200-year-old stands. Compared to N treatment alone, combined N + P addition had a smaller effect on the C and N concentrations of aggregates (Figure 4). The C content in different aggregates significantly decreased from the 46- to the 78-year-old stand, with only minor increases observed between the 78- and 200-year-old stands (p < 0.05). Nitrogen addition increased aggregate C content in the 46- and 200-year-old stands, whereas the opposite trend was observed in the 78-year-old stand (Figure 5).
The percentage of C in macroaggregates was highest in the 78-year-old stand but decreased significantly following N addition (p < 0.05). In contrast, N addition increased macroaggregate C content in the 46-year-old stand (Figure 5). Forest age promoted N accumulation in macroaggregates; however, the mechanisms differed by stand age—being driven by increased macroaggregate content in the 46-year-old stand and by elevated N concentration in the 200-year-old stand under N addition (Figure 6). With increasing forest age, the SOC/STN ratios of both macroaggregates and microaggregates declined significantly (p < 0.05). N addition reduced the SOC/STN ratio in all aggregate fractions in the 46-year-old stand but increased it in the 78- and 200-year-old stands, with significant increases observed in the macroaggregates and microaggregates of the 200-year-old stand (p < 0.05, Figure S1).
3.3. Effects of Forest Age and N Addition on Stable Isotopes Within Soil and Aggregates Fractions
Based on Table 1 and Figure 7 and Figure S2, stand age had significant effects on the isotopic composition of soil and aggregates, with the exception of macroaggregate δ13C. Nitrogen addition, however, only significantly affected macroaggregate δ15N through its interaction with stand age (p < 0.05). Under the control treatment, soil δ13C values were significantly higher in the 78- and 200-year-old stands compared to the 46-year-old stand, while soil δ15N was highest in the 46-year-old stand (p < 0.05). N addition significantly elevated soil δ13C in the 78-year-old stand and δ15N in the 46-year-old stand (p < 0.05).
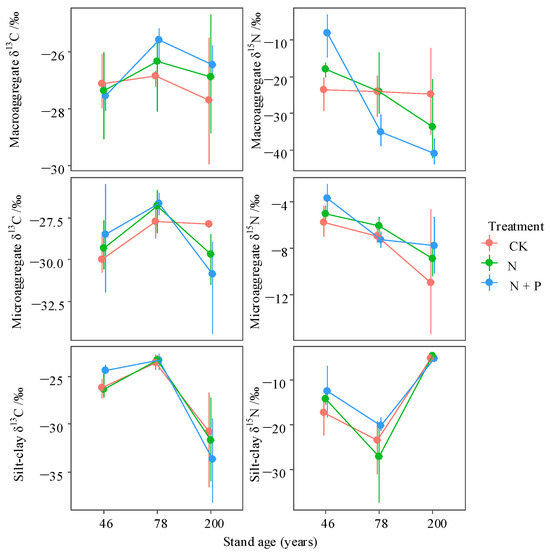
Figure 7.
Interactive effects of treatment and stand age on the δ13C and δ15N abundances in different soil aggregate fractions. Treatments include control (CK), nitrogen addition (N), and combined nitrogen and phosphorus addition (N + P). Data are presented as bootstrapped means ± 95% confidence intervals for individual aggregate fractions and their total. Differences among time since closure classes or soil depths are significant at p = 0.05 if their confidence intervals do not overlap each other’s means.
In the CK, the soil δ13C levels were higher than those in macroaggregates (p > 0.05). In contrast, the δ15N levels were lower in the CK (Figure 7 and Figure S2; p < 0.05). Among the macroaggregates, the δ13C values were highest in the 78-year-old and lowest in the 200-year-old stand. N addition led to an increase in the macroaggregate δ13C in both the 78-year-old and 200-year-old stands, while it caused a decrease in the 46-year-old stand (p > 0.05). Additionally, N addition significantly increased the microaggregate δ13C in the 46- and 78-year-old samples (p > 0.05). For δ15N, N addition notably increased the levels of macroaggregates from the 46-year-old stand (p < 0.05) but decreased these levels in the 200-year-old stand (p > 0.05). The results of the PCoA of the aggregate fractions and stable isotopes showed a clear separation between the CKs of different ages. However, there was no significant separation between CK and N addition across the different-aged stands (Figure 8).
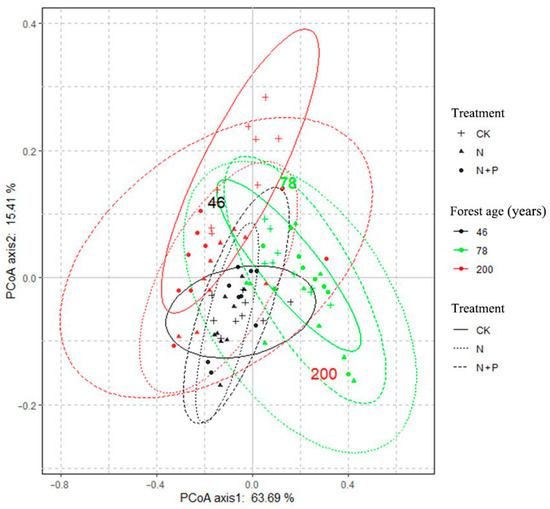
Figure 8.
PCoA based on soil aggregate fractions and its isotopic distribution of different treatments.
3.4. Relationship Between Abiotic/Biotic Factors and Soil Aggregate Fractions
Redundancy analysis (RDA) was conducted to evaluate the relative influence of soil biochemical parameters on aggregate fractions and their isotopic composition (Figure 9). The first two RDA axes together explained 74.75% of the total variation. Pearson correlation analysis further revealed that soil moisture positively influenced macroaggregate N concentration, thereby increasing macroaggregate N content and reducing the C/N ratio (Figure 10). TP significantly enhanced both macroaggregate abundance and their C and N concentrations. Additionally, soil sand content, NH4+-N, and NO3−-N were significantly and positively correlated with macroaggregate C and N concentrations, contributing to higher macroaggregate C and N contents. In contrast, soil pH had a negative effect. Furthermore, SOC and STN were positively correlated with the C and N concentrations and contents across aggregate fractions (Figure 10; p < 0.05).
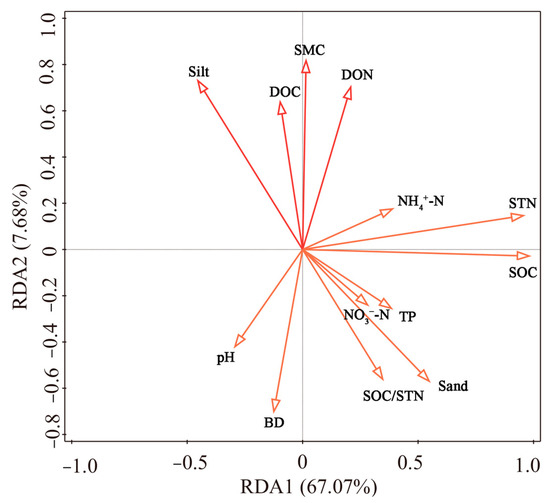
Figure 9.
RDA results for soil aggregate fractions and their isotopic distribution, constrained by soil data. Soil moisture content: SMC; soil sand content: Sand; soil silt content: Silt; soil clay content: Clay.
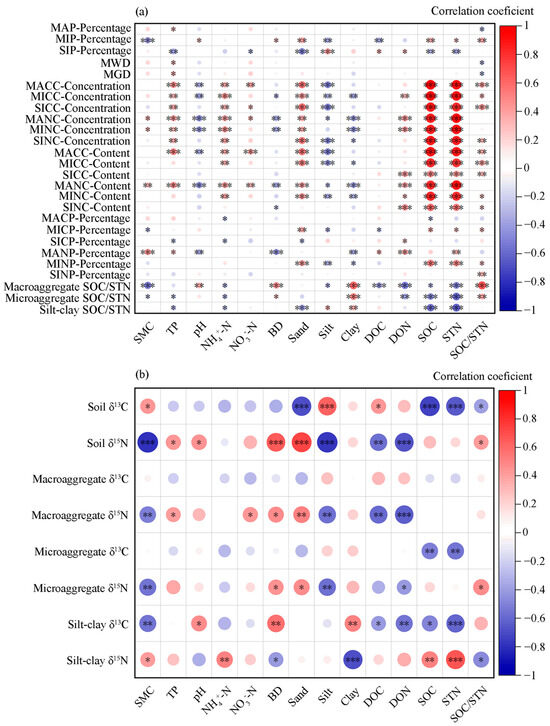
Figure 10.
Correlation analysis of aggregate fractions (a), stable isotopes (b), and environmental factors. Macroaggregate percentage: MAP-Percentage; microaggregate percentage: MIP-Percentage; silt–clay percentage: SIP-Percentage; macroaggregate carbon concentration: MACC-Concentration; microaggregate carbon concentration: MICC-Concentration; silt–clay carbon concentration: SICC-Concentration; macroaggregate nitrogen concentration: MANC-Concentration; microaggregate nitrogen concentration: MINC-Concentration; silt–clay nitrogen concentration: SINC-Concentration; macroaggregate carbon content: MACC-Content; microaggregate carbon content: MICC-Content; silt–clay carbon content: SICC-Content; macroaggregate nitrogen content: MANC-Content; microaggregate nitrogen content: MINC-Content; silt–clay nitrogen content: SINC-Content; mean weight diameter: MWD; geometric mean diameter: GMD; soil moisture content: SMC; soil sand content: Sand; soil silt content: Silt; soil clay content: Clay. *: p < 0.05; **: p < 0.01; ***: p < 0.001.
Our results also indicate that soil moisture significantly promoted the formation of macroaggregates and microaggregates, increased soil δ13C values, and reduced soil δ15N (Figure 10; p < 0.05). TP positively influenced δ15N enrichment in both soil and aggregate fractions. In contrast, soil pH was associated with increased macroaggregate C/N ratios and significantly suppressed δ15N abundance in both soil and macroaggregates (Figure 10; p < 0.05). Furthermore, NH4+-N had a suppressive effect on aggregate C/N ratios, the percentage of macroaggregate C and N, as well as δ13C values in soil, microaggregates, and silt–clay fractions (Figure 10; p < 0.05).
4. Discussion
4.1. The Effects of Nutrient Addition on the Distribution and Stability of Soil Aggregates
The soil structure of evergreen broad-leaved forests in the northern subtropics (46–200 years old) was predominantly composed of macroaggregates, accounting for approximately 78%–84% of total aggregates, with their proportion increasing with forest age (Figure 2) [42]. Microaggregate content was significantly lower in the 78- and 200-year-old stands compared to the 46-year-old stand (p < 0.05), while the content of silt–clay fractions showed minimal variation across stand ages (Figure 2). In the 46-year-old stand, nitrogen enrichment positively affected the proportion of macroaggregates while negatively impacting microaggregates and silt–clay fractions, suggesting that N enrichment promotes macroaggregate formation [15]. In contrast, the responses observed in the 78- and 200-year-old stands were consistent with findings reported by Lu et al. [17] and Chen et al. [25]; N addition promoted the fragmentation of macroaggregates and accelerated the formation of microaggregates and silt–clay fractions (Figure 2). Consequently, the physical protection of C within macroaggregates in the 78- and 200-year-old stands is relatively weak, rendering SOC more susceptible to microbial decomposition under nitrogen deposition conditions [20].
In our study, increasing forest age following revegetation was beneficial for soil stability [43]. However, during the plantation of Chinese fir (3 to 26 years old), MWD and GMD exhibited an initial increase followed by a decline [28]. The discrepancies between studies may be due to differences in vegetation type or the age stage of the forest investigated. Exogenous N input only shows a positive effect on the soil structure stability in the 46-year-old stand (Figure 3), whereas the 78- and 200-year-old stands are consistent with findings showing that the breakage of macroaggregates significantly reduces soil aggregate stability after N application [15,34]. Considering the distinct responses of aggregates among variable forest ages to the identical experimental time of N application, it is important that, when considering the impact of N deposition, forest age should be considered [15,23].
4.2. The Effects of Nutrient Addition on the Distribution of Carbon and Nitrogen in Soil Aggregates
Existing studies have shown that the C concentration of aggregates generally increases with forest succession; however, in our study, the C concentration exhibited a “concave” pattern with stand age, reaching its highest value in the 46-year-old stand (Figure 4) [33,44]. N addition had positive effects on the carbon concentrations of all aggregate fractions in the 46- and 200-year-old stands, with a significant increase observed in the macroaggregates of the 200-year-old stand (Figure 4; p < 0.05) [4,23]. In contrast, in the 78-year-old stand, N addition only increased the C concentration of macroaggregates, which may be attributed to differences in ecosystem status, particularly the balance between aboveground C inputs and belowground C decomposition across forest ages [15,33,45].
According to the aggregate hierarchy theory, C concentration generally increases with aggregate particle size, as larger aggregates are composed of smaller particles and organic binding agents [46]. However, in this study, the 46-year-old forest exhibited the opposite trend, with C concentration increasing as aggregate particle size decreased. Additionally, in the 78- and 200-year-old stands, microaggregates had higher C concentrations than macroaggregates (Figure 4). Although previous studies have shown that enhanced soil aggregate formation can protect SOC by reducing its decomposition, our results revealed that MWD and C concentration of macroaggregates exhibited the opposite changes in the 78- and 200-year-old stands under N addition [23]. Under CK, the N concentration of different aggregate fractions exhibited a “concave” pattern with forest ageing, with macroaggregates and microaggregates showing the highest N concentrations in the 200-year-old stand (Figure 4). N addition increased the N concentration of aggregates in the 46- and 200-year-old forests; however, in the 78-year-old stand, long-term high N deposition led to soil N leaching exceeding atmospheric N inputs, resulting in a decline in soil N storage [47].
With no treatment, the C content in the macroaggregates and microaggregates was highest in 46-year-old stands and showed a “concave” distribution with increasing stand age, while the C content of silt–clay fractions decreased with stand ageing (Figure 5; p > 0.05). A previous study found that C accumulation during pine afforestation in degraded grasslands is mainly the accumulation of aggregates, not the increase in aggregate-C concentration [33]. Nevertheless, after 46 year of secondary forest succession, the C and N content of macroaggregates and microaggregates were mainly dominated by aggregate C and N concentrations. This theory has been confirmed in other studies, where the increase in SOC was determined by the quantity of aggregates at the early stage of afforestation (7–48 year), and at the later stage of afforestation (48–200 year), the increasing C stock was more dependent on the aggregate C concentration [28,32].
A concept has been proposed to highlight a new potential mechanism that enhanced aggregate formation conserves new C rather than microbial inhibition under N deposition [23]. In this study, the response of C and N contents in the aggregates to N addition depended on forest age, and in the 46- and 200-year-old stands, additional C was mainly stored in the macroaggregates [21]. Additionally, the mechanism for promoting aggregate C content by N addition in this study showed distinctions among stand ages (Figure 5). In 200-year-old stands, N addition decreased the macroaggregates, but increasing macroaggregate C concentrations to enhance macroaggregate C contents, while the increase in both macroaggregates and their C concentrations promoted macroaggregate C contents in the 46-year-old forest. Considering the changes in SOC storage across aggregates, N addition contributed to the physical conservation of SOC in the 46-year-old stands, while overall reducing the stability of SOC in the 78- and 200-year-old stands [23,48].
Unlike the findings of previous studies that microaggregates contributed most of the C mineralized in the bulk soil, and that the < 0.25 mm fractions were more recalcitrant than the > 0.25 mm fractions, the order of magnitude of the C decomposition among different aggregates in our study seems to shift with increasing forest age [28,29]. SOC/STN showed a decrease with decreasing aggregate size in the 46-year-old stands, while the opposite was true of the 200-year-old stands (Figure S1). Among stand ageing, the SOC/STN of the macro- and microaggregates decreased, and that of the silt–clay fractions showed an increase, probably because larger aggregates had a stronger ability to physically protect organic matter and decreased C mineralization [28,29]. The response of SOC/STN to N addition indicated that high N deposition increased the SOC decomposition of macroaggregates in 78- and 200-year-old stands, while low C/N fresh organic matter was enriched in the macroaggregates of the 46-year-old stand (Figure S1). Differing from macroaggregates, N addition increased the decomposition of C in microaggregates and reduced their C content in all of the stands.
4.3. The Effects of Nutrient Addition on the Distribution of Stable Isotope in Soil Aggregates
We found that δ13C-rich microbial products gradually accumulated with increasing stand age, while the soil δ15N distribution pattern was the opposite (Figure S2) [23,49]. The difference in the distribution pattern of soil δ15N and δ13C may be due to the distinctive ability of soil ecosystems to retain soil C and N (Figure S2). During the process of soil organic matter (SOM) decomposition, N tends to gradually become a limiting factor for SOM decomposition [11]. Accordingly, compared with N, old C is more easily fixed by soil ecosystems, while N residual products are more easily lost and discharged by microbial transformation [23,49]. Changes to soil δ13C suggest that N addition promoted soil C decomposition in 78- and 200-year-old stands and new soil carbon fixation in 46-year-old stands [23,50].
The macroaggregates broken in the 78- and 200-year-old stands under N application exposed partial organic matter, originally enclosed inside the macroaggregates, bringing about the chance for microorganisms to contact and violently promote the mineralization of macroaggregate SOC, thus leading to an increase in the abundance of δ13C in the macroaggregates [25,28]. Meanwhile, enhanced aggregate formation, induced by N addition, increased the degree of protection of C with lower δ13C from decomposition in the 46-year-old stand (Figure 7) [34,36]. Furthermore, the notion that the effect of N addition on the δ13C values of SOM fractions is aggregate-size-dependent was further supported by observations in the 46- and 200-year-old stands. In contrast, δ13C abundance across aggregate fractions in the 78-year-old stand showed a consistent increase regardless of aggregate size [25].
Unlike the aggregates’ δ13C distribution, macroaggregate δ15N in different forest stands was obviously lower than that of the soil and microaggregates. In this study, we found that aggregates preserved more than 90% of SOC while only 44%–54% of the soil N fractions was preserved, which indicates the were aggregates better at C sequestration than N sequestration, and the N fraction in the aggregates was mainly composed of fresh low δ15N organic matter input (Figure 5 and Figure 6). Meanwhile, the preferential aggregation of fresh plant residues in macroaggregates may lead to lower δ15N abundance in macroaggregates [28,29]. The decreasing δ15N and SOC/STN of macroaggregates and microaggregates with increasing forest age in this region indicates the >0.25 mm fractions have a more powerful capability to preserve fresh organic matter under vegetation succession (Figure 7 and Figure S1). The changes in the macroaggregates’ δ15N, under N deposition, were not consistent across stand ages. N treatment led to a lower rate of new N input than the ecosystem N fractionation of δ15N within the macroaggregates in the 46-year-old stand, while the opposite was the case in the 78- and 200-year-old stands.
4.4. Environmental Factors Affecting Soil Aggregate Dynamics Under Nutrient Addition
Our published contemporaneous studies have shown that the measured soil physicochemical properties changed significantly across different stand ages (p < 0.05), while there were differences in the effects of N addition on soil physicochemical properties across stands of different ages (Figures S3 and S4) [39]. Meanwhile, correlation analysis revealed that, after 6 years of N addition, TP, NH4+-N, NO3−-N, DON, pH, soil texture, etc., were the main predictors determining most of the variance in aggregate fractions [3,51]. Among the measured soil physicochemical indicators, only TP significantly contributed to the macroaggregate content, and N addition indirectly changed the macroaggregate content across stand ages by decreasing TP in the 78- and 200-year-old stands and increasing TP in the 46-year-old stands (Figure 10 and Figure S3; p < 0.05). In addition, TP significantly increased the C and N contents in the macroaggregates by markedly increasing both macroaggregates and their C and N concentrations (p < 0.05) [3]. Soil moisture increased significantly with forest age and N addition, prompting the N concentration of the macroaggregates to increase the macroaggregate N contents, thus decreasing the SOC/STN of macroaggregates (Figure 10 and Figure S3; p < 0.05) [39]. Meanwhile, soil moisture significantly increased soil δ13C and decreased the δ15N content in the soil and the macro- and microaggregates, which indicates that soil moisture accelerates the decomposition of unprotected organic matter in the soil, while increasing the input of fresh organic matter or accelerating the loss of δ15N in the soil and aggregates [23].
Enriching soil NH4+-N and NO3−-N after N application among stands could increase the C and N concentrations of macro- and microaggregates and thus added their contents (Figure 10 and Figure S3) [35]. Simultaneously, we found that the increased NH4+-N significantly reduced the aggregates’ C/N, C, and N percentages for the macroaggregates and the δ13C abundance in the soil, microaggregates, and silt–clay fractions (p < 0.05), indicating that though NH4+-N enrichment added fresh organic matter input, relatively low quantities of organic matter were wrapped into in macroaggregates compared with the soil, which occurred mainly in the 46- and 78-year-old stands [15,39]. pH was the main predictor determining the variance in the C and N of the aggregate fractions [51]. It was found that significantly decreased pH, by increasing stand age and N addition, had a significant positive effect on the C and N concentrations of the macroaggregates and thus increased their C and N contents (Figure 10 and Figure S3; p < 0.05) [35,39,51].
Forest age and N addition can also influence aggregate formation and their organic matter content by mediating soil texture (Figure 10 and Figure S4) [43]. As forests age, soil sand content decreases, while the soil clay content increases (p < 0.05), which is beneficial for increasing the C concentration and the content of macro- and micro-aggregates in this region [33,39]. Nevertheless, N addition reduced sand content and increased soil clay content in 46- and 78-year-old stands, while the opposite was true for 200-year-old stands (p < 0.05), which indicates that the changes to soil texture induced by N application only promote aggregate organic C sequestration in the 200-year-old stand [39,45]. Moreover, unlike previous studies that show that after vegetation restoration organic matter accumulation promotes the formation of macroaggregates [26,43], after 46 years of forest vegetation succession, the increasing SOC content had a low impact on the formation of aggregates in this study (Figure 10 and Figure S3). Although the increase in SOC content did not promote aggregate formation, SOC and STN showed a significant positive correlation (p < 0.05) with C and N concentrations and their contents in the aggregates [39,45].
5. Conclusions
This study demonstrated that after 46 years of secondary forest succession, the soil in broad-leaved forests was dominated by macroaggregates, which increased with forest ageing. Exogenous N input only showed a positive effect on the soil structure stability in the 46-year-old forest, while it promotes macroaggregate fragmentation in the 78- and 200-year-old stands. During forest ageing, the C and N content of the aggregates (except silt–clay fractions) showed concave changes and were mainly controlled by aggregate C and N concentration. The responses of C and N contents in the aggregates to N addition were based on forest age. N addition increased macroaggregate C concentrations to enhance the content of macroaggregate C in the 78- and 200-year-old stands, while increasing both macroaggregates and their C concentrations to promote the macroaggregate C contents in the 46-year-old stand. In this study, δ13C-rich microbial products gradually accumulated with increasing stand age, while the abundance of soil δ15N gradually decreased. Variations in soil δ13C in response to N addition revealed that N enrichment accelerated C turnover in the 46- and 78-year-old stands, whereas it facilitated the incorporation of newly fixed C into the soil in the 200-year-old stand. Analysis of δ13C and δ15N distribution within the soil aggregates indicated that N addition influenced the dynamics of aggregate-associated C and N fractions differently across forest stands of varying ages. Further, the variation in aggregate fractions and isotope distribution was controlled by environmental factors (i.e., soil total phosphorus, NH4+-N, NO3−-N, DON, pH, and texture). In summary, the mechanism of the promotion of aggregate C and N content by N treatment in this study showed distinctions among stand ages.
The results provide new insights into the impact of nitrogen deposition on the soil C pool and its functions in China’s broad-leaved forest ecosystems, which helps to accurately predict the feedback effect of forest SOC dynamics on future atmospheric N deposition in southern China, and provides data-led support for the formulation of differentiated C sequestration and emission reduction schemes. In addition, despite our efforts to reduce the impact of other potential factors on the reliability of the results, the three selected forests of different ages all belong to low-altitude secondary broad-leaved forests in eastern China, and their natural conditions such as altitude, latitude, precipitation, soil texture, and topography are similar, but we cannot completely rule out the impact of slight differences between some conditions on the research results. Simultaneously, in the long-term, the succession process of forests; some unrecorded natural factors such as mountainous floods and landslides; or human activities may have inconsistent effects on the composition of plant communities in the three forest stands, making it difficult to accurately say that forest type of different ages are the same. Moreover, considering our short experimental period, further long-term experiments are needed to verify the effect of N addition on the C sequestration capacity of soil aggregates. In the future, the mechanism of N deposition can be further studied by combining factors such as biotic and abiotic aggregate binders.
Supplementary Materials
The following supporting information can be downloaded at: https://www.mdpi.com/article/10.3390/f16071082/s1, Figure S1: Interactive effects of treatment and stand age on SOC/STN in different aggregates. Treatments are the control (CK), nitrogen addition (N), and N and phosphorus addition (N + P). Figure S2: Interactive effects of treatment and stand age on soil δ13C, δ15N abundance. Treatments are the control (CK), nitrogen addition (N), and N and phosphorus addition (N + P). Figure S3: Interactive effects of treatment and stand age on soil factors. Treatments are the control (CK), nitrogen addition (N), and N and phosphorus addition (N + P). Soil moisture content (SMC), ammonium nitrogen (AN), nitrate nitrogen (NN). Figure S4: Interactive effects of treatment and stand age on soil texture. Treatments are the control (CK), nitrogen addition (N), and N and phosphorus addition (N + P).
Author Contributions
X.X. and Y.D. designed the research. Material preparation, data collection, and analyses were performed by Y.D. and L.C.; The first draft of the manuscript was written by Y.D.; X.X. and Y.D. modified the manuscript and improved the English language and grammatical editing. All authors have read and agreed to the published version of the manuscript.
Funding
This work was supported by the National Natural Science Foundation of China (Nos. 31770672 and 31370626), the National Basic Research Program of China (2010CB950602), and the General Project of Basic Sciences in Higher Education Institutions in Jiangsu Province (23KJB2220009).
Data Availability Statement
The data presented in this study are available on request from the corresponding author. The data are not publicly available due to privacy restrictions.
Acknowledgments
We would like to thank the Forestry Bureau of Shitai and Qimen County, Anhui, for their assistance. We would also like to thank the anonymous reviewers for their helpful comments and suggestions on this paper.
Conflicts of Interest
The authors declare no conflicts of interest.
References
- IPCC. Climate Change 2013: The Physical Science Basis. Contribution of Working Group I to the Fifth Assessment Report of the Intergovernmental Panel on Climate Change; Core Writing Team, Stocker, T.F., Qin, D., Plattner, G.-K., Tignor, M., Allen, S.K., Boschung, J., Nauels, A., Xia, Y., et al., Eds.; Cambridge University Press: Cambridge, UK, 2013; p. 1535. [Google Scholar]
- Gao, Y.; Jia, Y.L.; Yu, G.R.; He, N.P.; Zhang, L.; Zhu, B.; Wang, Y.F. Anthropogenic reactive nitrogen deposition and associated nutrient limitation effect on gross primary productivity in inland water of China. J. Clean. Prod. 2019, 208, 530–540. [Google Scholar] [CrossRef]
- Du, Z.G.; Wang, J.W.; Zhou, G.Y.; Bai, S.H.; Zhou, L.Y.; Fu, Y.L.; Wang, C.K.; Wang, H.M.; Yu, G.R.; Zhou, X. Differential effects of nitrogen vs. phosphorus limitation on terrestrial carbon storage in two subtropical forests: A Bayesian approach. Sci. Total Environ. 2021, 795, 148485. [Google Scholar] [CrossRef]
- Liu, X.J.; Lei, D.; Mo, J.M.; Du, E.Z.; Shen, J.L.; Lu, X.K.; Zhang, Y.; Zhou, X.B.; He, C.N.; Zhang, F.S. Nitrogen deposition and its ecological impact in China: An overview. Environ. Pollut. 2011, 159, 2251–2264. [Google Scholar] [CrossRef]
- Yu, G.; Jia, Y.; He, N.; Zhu, J.; Chen, Z.; Wang, Q.; Piao, S.; Liu, X.; He, H.; Guo, X.; et al. Stabilization of atmospheric nitrogen deposition in China over the past decade. Nat. Geosci. 2019, 12, 424–433. [Google Scholar] [CrossRef]
- Zhu, J.; Chen, Z.; Wang, Q.; Xu, L.; He, N.; Jia, Y.; Zhang, Q.; Yu, G. Potential transition in the effects of atmospheric nitrogen deposition in China. Environ. Pollut. 2019, 258, 113739. [Google Scholar] [CrossRef]
- Zheng, M.H.; Huang, J.; Chen, H.; Wang, H.; Mo, J.M. Responses of soil acid phosphatase and beta-glucosidase to nitrogen and phosphorus addition in two subtropical forests in southern China. Eur. J. Soil Biol. 2015, 68, 77–84. [Google Scholar] [CrossRef]
- Ma, H.L.; Tecimen, H.B.; Wu, Y.; Gao, R.; Yin, Y.F. Influence of litter and nitrogen addition on carbon and nitrogen levels in soil aggregates under a subtropical forest. J. Soil Sci. Plant Nut. 2024, 24, 5029–5042. [Google Scholar] [CrossRef]
- Fang, X.M.; Zhang, X.L.; Chen, F.S.; Zong, Y.Y.; Bu, W.S.; Wan, S.Z.; Luo, Y.; Wang, H. Phosphorus addition alters the response of soil organic carbon decomposition to nitrogen deposition in a subtropical forest. Soil Biol. Biochem. 2019, 133, 119–128. [Google Scholar] [CrossRef]
- Song, Y.C.; Chen, X.Y. Degradation Mechanism and Ecological Restoration of Evergreen Broadleaved Forest Ecosystem in East China; Science Press: Beijing, China, 2007. [Google Scholar]
- Riggs, C.E.; Hobbie, S.E.; Bach, E.M.; Hofmockel, K.S.; Kazanski, C.E.J.B. Nitrogen addition changes grassland soil organic matter decomposition. Biogeochemistry 2015, 125, 203–219. [Google Scholar] [CrossRef]
- Barman, S.; Bhattacharyya, R.; Singh, C.; Rathore, A.C.; Singhal, V.; Muruganandan, M.; Patel, A.; Das, A.; Jat, S.L.; Jha, P.; et al. Soil organic carbon stabilization inside microaggregates within macroaggregates is the major mechanism of carbon sequestration under a long-term agroforestry system in the foot hills of the Indian Himalayas. Soil Till. Res. 2025, 253, 106649. [Google Scholar] [CrossRef]
- Zhang, W.; Munkholm, L.J.; Heck, R.J.; Watts, C.W.; Jensen, J.L. Aggregate pore and shape properties were more strongly correlated to soil organic carbon in large aggregates: Evidence from a long-term management-induced soil carbon gradient. Geoderma 2025, 459, 117357. [Google Scholar] [CrossRef]
- Smith, A.P.; Marin-Spiotta, E.; de Graaff, M.A.; Balser, T.C. Microbial community structure varies across soil organic matter aggregate pools during tropical land cover change. Soil Biol. Biochem. 2014, 77, 292–303. [Google Scholar] [CrossRef]
- Lu, X.; Hou, E.; Guo, J.; Gilliam, F.S.; Li, J.; Tang, S.; Kuang, Y. Nitrogen addition stimulates soil aggregation and enhances carbon storage in terrestrial ecosystems of China: A meta-analysis. Glob. Change Biol. 2021, 27, 2780–2792. [Google Scholar] [CrossRef] [PubMed]
- Six, J.; Elliott, E.T.; Paustian, K. Soil macroaggregate turnover and microaggregate formation: A mechanism for C sequestration under no-tillage agriculture. Soil Biol. Biochem. 2000, 32, 2099–2103. [Google Scholar] [CrossRef]
- Lu, X.F.; Ren, W.D.; Hou, E.Q.; Zhang, L.L.; Wen, D.Z.; Liu, Z.F.; Lin, Y.B.; Wang, J.; Kuang, Y.W. Negative effects of canopy N addition on soil organic carbon in wet season are primarily detected in uppermost soils of a subtropical forest. Glob. Ecol. Conserv. 2019, 17, e00543. [Google Scholar] [CrossRef]
- Dixon, P. VEGAN, a package of R functions for community ecology. J. Veg. Sci. 2003, 14, 927–930. [Google Scholar] [CrossRef]
- Luo, R.; Kuzyakov, Y.; Liu, D.; Fan, J.; Luo, J.; Lindsey, S.; He, J.S.; Ding, W. Nutrient addition reduces carbon sequestration in a Tibetan grassland soil: Disentangling microbial and physical controls. Soil Biol. Biochem. 2020, 144, 107764. [Google Scholar] [CrossRef]
- Tan, W.B.; Wang, G.A.; Huang, C.H.; Gao, R.T.; Xi, B.D.; Zhu, B. Physico-chemical protection, rather than biochemical composition, governs the responses of soil organic carbon decomposition to nitrogen addition in a temperate agroecosystem. Sci. Total Environ. 2017, 598, 282–288. [Google Scholar] [CrossRef]
- Chen, H.; Li, D.; Feng, W.; Niu, S.; Plante, A.; Luo, Y.; Wang, K. Different responses of soil organic carbon fractions to nitrogen additions. Eur. J. Soil Sci. 2018, 69, 1098–1104. [Google Scholar] [CrossRef]
- Chaplot, V.; Cooper, M.J.G. Soil aggregate stability to predict organic carbon outputs from soils. Geoderma 2015, 243, 205–213. [Google Scholar] [CrossRef]
- Chang, R.Y.; Zhou, W.J.; Fang, Y.T.; Bing, H.J.; Sun, X.Y.; Wang, G.X. Anthropogenic nitrogen deposition increases soil carbon by enhancing new carbon of the soil aggregate formation. J. Geophys. Res. Biogeo. 2019, 124, 572–584. [Google Scholar] [CrossRef]
- Gao, H.L.; Qiu, L.Q.; Zhang, Y.J.; Wang, L.H.; Zhang, X.C.; Cheng, J.M. Distribution of organic carbon and nitrogen in soil aggregates of aspen (Populus simonii Carr.) woodlands in the semi-arid Loess Plateau of China. Soil Res. 2013, 51, 406–414. [Google Scholar] [CrossRef]
- Chen, Z.J.; Geng, S.C.; Zhang, J.H.; Setälä, H.; Gu, Y.; Wang, F.; Zhang, X.; Wang, X.X.; Han, S.J. Addition of nitrogen enhances stability of soil organic matter in a temperate forest. Eur. J. Soil Sci. 2017, 68, 189–199. [Google Scholar] [CrossRef]
- Zhong, X.L.; Li, J.T.; Li, X.J.; Ye, Y.C.; Liu, S.S.; Hallett, P.D.; Ogden, M.R.; Naveed, M. Physical protection by soil aggregates stabilizes soil organic carbon under simulated N deposition in a subtropical forest of China. Geoderma 2017, 285, 323–332. [Google Scholar] [CrossRef]
- Gunina, A.; Kuzyakov, Y. Pathways of litter C by formation of aggregates and SOM density fractions: Implications from 13C natural abundance. Soil Biol. Biochem. 2014, 71, 95–104. [Google Scholar] [CrossRef]
- Mao, L.; Tang, L.; Ye, S.; Wang, S. Soil organic C and total N as well as microbial biomass C and N affect aggregate stability in a chronosequence of Chinese fir plantations. Eur. J. Soil Biol. 2021, 106, 103347. [Google Scholar] [CrossRef]
- Zhang, Y.; Ge, N.; Liao, X.; Wang, Z.; Wei, X.; Jia, X. Long-term afforestation accelerated soil organic carbon accumulation but decreased its mineralization loss and temperature sensitivity in the bulk soils and aggregates. CATENA 2021, 204, 105405. [Google Scholar] [CrossRef]
- Qiu, T.; Aravena, M.C.; Andrus, R.; Ascoli, D.; Bergeron, Y.; Berretti, R.; Bogdziewicz, M.; Boivin, T.; Bonal, R.; Caignard, T.; et al. Is there tree senescence? The fecundity evidence. Proc. Natl. Acad. Sci. USA 2021, 118, e2106130118. [Google Scholar] [CrossRef] [PubMed]
- Cannon, C.H.; Piovesan, G.; Munne-Bosch, S. Old and ancient trees are life history lottery winners and vital evolutionary resources for long-term adaptive capacity. Nat. Plants 2022, 8, 136–145. [Google Scholar] [CrossRef]
- Qiu, L.P.; Wei, X.R.; Gao, J.L.; Zhang, X.C. Dynamics of soil aggregate-associated organic carbon along an afforestation chronosequence. Plant Soil 2014, 391, 237–251. [Google Scholar] [CrossRef]
- Chen, F.S.; Zeng, D.H.; Fahey, T.J.; Liao, P.F. Organic carbon in soil physical fractions under different-aged plantations of mongolian pine in semi-arid region of northeast China. Appl. Soil Ecol. 2010, 44, 42–48. [Google Scholar] [CrossRef]
- Chen, Z.J.; Zhou, X.Y.; Geng, S.C.; Miao, Y.; Cao, Y.H.; Chen, Z.J.; Zhang, J.H.; Han, S.J. Interactive effect of nitrogen addition and throughfall reduction decreases soil aggregate stability through reducing biological binding agents. Forest Ecol. Manag. 2019, 445, 13–19. [Google Scholar] [CrossRef]
- Yuan, Y.; Li, Y.; Mou, Z.; Kuang, L.; Wu, W.; Zhang, J.; Wang, F.; Hui, D.; Penuelas, J.; Sardans, J.; et al. Phosphorus addition decreases microbial residual contribution to soil organic carbon pool in a tropical coastal forest. Glob. Change Biol. 2021, 27, 454–466. [Google Scholar] [CrossRef]
- Ngaba, M.J.Y.; Bol, R.; Hu, Y.L. Stable isotopic signatures of carbon and nitrogen in soil aggregates following the conversion of natural forests to managed plantations in eastern China. Plant Soil 2021, 459, 371–385. [Google Scholar] [CrossRef]
- Skadell, L.E.; Schneider, F.; Bauke, S.L.; Amelung, W.; Don, A. Long-term management effects on depth gradients of 13C, 15N and C/N ratio in agricultural soils. Geoderma 2025, 458, 117341. [Google Scholar] [CrossRef]
- Gunnarsen, K.C.; Magid, J.; Ambus, P.; Christensen, B.T.; Bruun, S.; Malghani, S. Stable carbon isotope fractionation during microbial turnover of sucrose in different media: Soils, carbon-free quartz and liquid media. Appl. Soil Ecol. 2025, 212, 106200. [Google Scholar] [CrossRef]
- Dai, Y.Z.; Wang, H.; Chen, M.; Wang, D.; Cao, X.; Chu, B.; Xu, X.X. Response of soil bacterial communities to nitrogen and phosphorus additions in an age-sequence of subtropical forests. iForest Biogeosci. For. 2021, 14, 71–79. [Google Scholar] [CrossRef]
- Hunt, N.; Gilkes, R. Farm Monitoring Handbook–A Practical Down-to-Earth Manual for Farmers and Other Land Users; University of Western Australia: Nedlands, WA, Australia; Land Management Society: Como, WA, Australia, 1992. [Google Scholar]
- Cambardella, C.A.; Elliott, E.T. Carbon and nitrogen distribution in aggregates from cultivated and native grassland Soils. Soil Sci. Soc. Am. J. 1993, 57, 1071–1076. [Google Scholar] [CrossRef]
- Xiao, J.; Dong, S.; Zhao, Z.; Han, Y.; Li, S.; Shen, H.; Ding, C. Stabilization of soil organic carbon in the alpine meadow is dependent on the nitrogen deposition level on the Qinghai-Tibetan Plateau. Ecol. Eng. 2021, 170, 106348. [Google Scholar] [CrossRef]
- Zhong, Z.; Wu, S.; Lu, X.; Ren, Z.; Wu, Q.; Xu, M.; Ren, C.; Yang, G.; Han, X. Organic carbon, nitrogen accumulation, and soil aggregate dynamics as affected by vegetation restoration patterns in the Loess Plateau of China. CATENA 2021, 196, 104867. [Google Scholar] [CrossRef]
- Jiménez, J.J.; Klaus, L.; Rattan, L. Organic carbon and nitrogen in soil particle-size aggregates under dry tropical forests from Guanacaste, Costa Rica—Implications for within-site soil organic carbon stabilization. CATENA 2011, 86, 178–191. [Google Scholar] [CrossRef]
- Cheng, S.L.; Fang, H.J.; Yu, G.R. Threshold responses of soil organic carbon concentration and composition to multi-level nitrogen addition in a temperate needle-broadleaved forest. Biogeochemistry 2018, 137, 219–233. [Google Scholar] [CrossRef]
- Elliott, E.T. Aggregate structure and carbon, nitrogen, and phosphorus in native and cultivated soils. Soil Sci. Soc. Am. J. 1986, 50, 627–633. [Google Scholar] [CrossRef]
- Glatzel, G. The nitrogen status of Austrian forest ecosystems as influenced by atmospheric deposition, biomass harvesting and lateral organomass exchange. Plant Soil 1990, 128, 67–74. [Google Scholar] [CrossRef]
- Wang, R.; Wu, H.; Sardans, J.; Li, T.; Liu, H.; Penuelas, J.; Dijkstra, F.A.; Jiang, Y. Carbon storage and plant-soil linkages among soil aggregates as affected by nitrogen enrichment and mowing management in a meadow grassland. Plant Soil 2020, 457, 407–420. [Google Scholar] [CrossRef]
- Jiang, R.; Gunina, A.; Qu, D.; Kuzyakov, Y.; Yu, Y.J.; Hatano, R.; Frimpong, K.A.; Li, M. Afforestation of loess soils: Old and new organic carbon in aggregates and density fractions. CATENA 2019, 177, 49–56. [Google Scholar] [CrossRef]
- Jiang, C.M.; Yu, W.T.; Ma, Q.; Xu, Y.G.; Zhou, H. Nitrogen addition alters carbon and nitrogen dynamics during decay of different quality residues. Ecol. Eng. 2015, 82, 252–257. [Google Scholar] [CrossRef]
- Duan, Y.; Chen, L.; Zhang, J.; Li, D.; Han, X.; Zhu, B.; Li, Y.; Zhao, B.; Huang, P. Long-term fertilisation reveals close associations between soil organic carbon composition and microbial traits at aggregate scales. Agr. Ecosyst. Environ. 2021, 306, 107169. [Google Scholar] [CrossRef]
Disclaimer/Publisher’s Note: The statements, opinions and data contained in all publications are solely those of the individual author(s) and contributor(s) and not of MDPI and/or the editor(s). MDPI and/or the editor(s) disclaim responsibility for any injury to people or property resulting from any ideas, methods, instructions or products referred to in the content. |
© 2025 by the authors. Licensee MDPI, Basel, Switzerland. This article is an open access article distributed under the terms and conditions of the Creative Commons Attribution (CC BY) license (https://creativecommons.org/licenses/by/4.0/).