Abstract
Climate change has led to the global intensification of wildfire activity, and South Korea has also experienced a marked increase in fire danger. To understand these developments, it is essential to examine both temporal trends and spatial patterns in fire-conducive climate conditions. In this study, we investigated the temporal and spatial characteristics of wildfire danger across South Korea between 2004 and 2023 using the Fire Weather Index (FWI). The analysis of long-term climate trends revealed region-specific patterns of increasing temperatures, decreasing precipitation, and declining wind speeds, which collectively contribute to an increased risk of wildfires. The FWI exhibited strong seasonal variations, with significant increases observed in spring, particularly in May, over the most recent decade. Statistical analyses confirmed a strong correlation between high FWI percentiles and wildfire occurrence, particularly noting an increased frequency of large-scale fires (>100 ha) in the highest FWI bins. The spatial analysis further highlighted that certain provinces, including Gangwon State, Gyeongsangbuk-do, Chuncheongbuk-do, and Gyeonggi-do, experienced disproportionately high increases in FWI values. These findings suggest that the FWI can serve as a robust framework for wildfire danger assessment in South Korea, particularly when supported by region-specific calibration and long-term validation under varying climatic conditions.
1. Introduction
The frequency and impact of wildfires have been increasing globally because of climate change [1,2,3,4]. As climate change progresses, fire environments are projected to become more extreme, with regional variations in the extent, frequency, and impact of weather events driven by warming [5,6,7].
South Korea is particularly susceptible to wildfires owing to its mountainous terrain and extensive forest cover, accounting for approximately 63% of the national land area. Although most wildfires in Korea are attributed to anthropogenic activities [8], meteorological factors substantially influence their occurrence and escalation. Key weather variables affecting wildfire occurrence include the temperature, relative humidity, precipitation, and wind speed [9,10]. Increased temperatures accelerate fuel combustion and facilitate ignition [11,12]. The relative humidity governs the fuel moisture content, thereby affecting flammability [13,14]. Wind increases fuel loading, enhances the ignition probability, and alters the surface fuel moisture content [15,16]. Precipitation plays a dual role, either suppressing or promoting wildfire occurrence depending on its timing and accumulation [17,18]. Seasonal climate variations also contribute to wildfire danger, with dry spring conditions, strong winds, and seasonal variability heightening the wildfire risk, especially from late winter to early summer in South Korea [19,20].
Among existing fire danger rating systems, the Canadian Fire Weather Index (FWI) has been widely adopted due to its demonstrated sensitivity to key meteorological variables, including the temperature, wind speed, relative humidity, and precipitation [21,22,23]. Originally developed in Canada, the FWI has been applied across diverse geographic and climatic contexts. In Europe, it is integrated into the European Forest Fire Information System, demonstrating reasonable predictive skill in both Mediterranean and temperate regions [24,25]. In Alaska, the FWI has been calibrated for boreal and tundra ecosystems, providing threshold-based guidance for operational fire management [26]. In Asian countries, including China, FWI-based indices have been evaluated against local fire occurrence records, suggesting their potential applicability in transitional climates and across diverse vegetation conditions [3,27,28,29].
In parallel with its geographical expansion, methodological advancements have further refined the FWI system. In Canada, first-order Markov chain models have been employed to capture daily transitions between FWI classes, enhancing the temporal realism in fire danger assessments [30]. In Europe, statistical post-processing techniques, such as non-homogeneous Gaussian regression, have been applied to calibrate medium-range ensemble forecasts of the FWI derived from the European Centre for Medium-Range Weather Forecast outputs [24].
Given its flexibility and broad applicability, the FWI system is well suited to assessing both historical and contemporary fire–climate dynamics in Korea. Its proven adaptability in regions characterized by seasonal variability, complex topography, and diverse forest structures underscores its relevance for Korean wildfire danger analysis.
Meteorological data from weather stations are often spatially interpolated to estimate fire danger at wildfire ignition sites [31,32]. A single weather station frequently fails to adequately represent fire weather conditions across extensive or topographically diverse areas. Spatial interpolation models, such as inverse distance weighting (IDW), are commonly employed to predict fire danger in regions without direct weather observations,. These models incorporate data from nearby stations and, in certain instances, also account for elevation, thereby greatly affecting local weather variability. This approach enhances the accuracy of fire danger assessments by incorporating both geographic proximity and terrain-driven climate variation. In South Korea, where mountainous terrain dominates much of the landscape, directly estimating the fire danger at ignition sites through terrain-sensitive models can yield more precise and locally relevant insights, particularly in areas with complex topography.
In this study, we aimed to analyze the spatiotemporal wildfire danger patterns in South Korea by applying the FWI to a 20-year dataset (2004–2023). Specifically, we assessed the influence of meteorological trends on the FWI values and investigated their relationships with the wildfire frequency and severity to inform data-driven, region-specific fire management strategies. The findings of this study are anticipated to advance our understanding of regional wildfire danger patterns in South Korea and provide a theoretical basis for the development of climate-adaptive fire management strategies tailored to high-danger areas.
2. Materials and Methods
2.1. Weather and Forest Fire Data
Meteorological data were obtained from the Korea Meteorological Administration’s Automated Synoptic Observing System (ASOS), which provided hourly records of the temperature, relative humidity, wind speed, and precipitation at 73 stations from 2003 to 2023 (Figure 1).
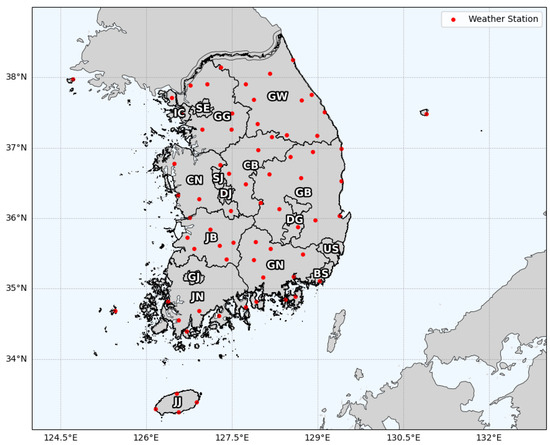
Figure 1.
Locations of the 73 weather stations and the administrative boundaries of the 17 provinces (BS: Busan, CB: Chungcheongbuk-do, CN: Chungcheongnam-do, DG: Daegu, DJ: Daejeon, GB: Gyeongsangbuk-do, GG: Gyeonggi-do, GJ: Gwangju, GN: Gyeongsangnam-do, GW: Gangwon State, IC: Incheon, JB: Jeollabuk-do, JJ: Jeju, JN: Jeollanam-do, SE: Seoul, SJ: Sejong, US: Ulsan).
South Korea consists of 17 administrative units, including one special city (Seoul), six metropolitan cities (Busan, Ulsan, Daegu, Daejeon, Jeonju, and Gwangju), six provinces (Gyeonggi-do, Gyeongsangbuk-do, Gyeongsangnam-do, Chungcheongbuk-do, Chungcheongnam-do, and Jeollanam-do), two states (Gangwon and Jeollabuk-do), one special self-governing province (Jeju), and one special self-governing city (Sejong). As Sejong City was established in 2012 during the study period (2004–2023), it was excluded from this study.
Linear interpolation was employed to address missing values in the weather dataset. Daily, monthly, and yearly values of the mean temperature, maximum temperature, minimum temperature, relative humidity, wind speed, and precipitation were computed using the arithmetic mean. Forest fire occurrence coordinates and burned area data from 2004 to 2023 were provided by the National Institute of Forest Science of South Korea. After excluding records with erroneous coordinate data, 9016 wildfire cases were incorporated into the analysis (Figure 2). Elevation data were extracted using a 30-m-resolution digital elevation model generated using Sentinel-2 satellite imagery (Figure 2).
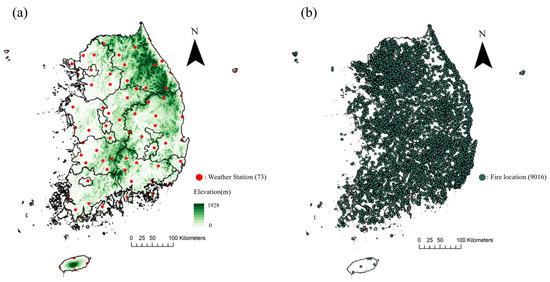
Figure 2.
Spatial context for wildfire danger analysis in South Korea. (a) Digital elevation model (DEM); (b) spatial distribution of 9016 recorded wildfire ignition points in South Korea from 2004 to 2023.
2.2. Modified Inverse Distance Weighting (IDWm)
We employed a modified inverse distance weighting (IDWm) interpolation method to estimate the meteorological conditions at wildfire ignition points, incorporating both the horizontal distance and elevation differences between weather stations and fire locations. This approach was based on that employed in previous studies that have highlighted the importance of topographic correction in interpolating climate variables, particularly in mountainous regions [33].
A modified version of the method proposed by Chang et al. [33] was employed to ensure that the sum of the weights equaled one. This method incorporated the effects of the Euclidean distance while also accounting for elevation variations. The elevation component was integrated into the standard IDW formula as an additional factor.
where is the number of neighboring stations used for the estimation; is the Euclidean distance between the target location and station ; and is the observed value of variable at station . The term is the absolute elevation difference between the target and neighboring stations, while the exponent is a power parameter. The inclusion of modifies the IDW weights by assigning higher priority to stations with similar elevations to the target location, thereby increasing their influence on the estimation. After testing combinations of and within the range of 1–3, the parameters = 1 and = 3 were selected to estimate the weather conditions at the wildfire ignition sites.
This method was utilized to estimate the daily temperature, humidity, wind speed, and precipitation at each wildfire ignition location using station data. The analyses were performed using the Python 3.10.16 software.
2.3. Fire Weather Index
The Canadian-developed FWI system was utilized to assess the wildfire danger in South Korea. The FWI system comprises six components that quantify the effects of fuel moisture and weather conditions on fire behavior [34]. These include three fuel moisture codes—the Fine Fuel Moisture Code (FFMC) for surface litter, the Duff Moisture Code (DMC) for moderate duff layers, and the Drought Code (DC) for deep organic layers—and three fire behavior indices—the Initial Spread Index (ISI) for the rate of spread, the Buildup Index (BUI) for the available fuel, and the Fire Weather Index (FWI) for the fire intensity. These components are derived from daily observations of the temperature, relative humidity, wind speed, and 24 h precipitation, collectively providing a standardized measure of the wildfire potential.
The FWI components were calculated using the “cffdrs” package in the R software, with the initial values set at 85, 6, and 15 for FFMC, DMC, and DC, respectively, following the recommendations from the package documentation [35]. The FWI system was applied to South Korean conditions using domestic weather station data, with calibration steps undertaken to account for regional characteristics. Specifically, latitude adjustments were applied to ensure that the DMC and DC components accurately reflected the solar radiation patterns relevant to Korea. The FWI was calculated using the noon temperature, relative humidity, and wind speed values, with the daily total precipitation serving as the rainfall input. A one-year spin-up simulation using 2003 weather data was performed to stabilize the initial FFMC, DMC, and DC values. The stabilized outputs were subsequently used to compute FWI values for each weather station from 2004 to 2023.
An elevation-adjusted IDWm was applied to estimate the FWI values at the wildfire ignition points. For each wildfire event, a one-year spin-up was conducted using weather data specific to the corresponding location and date to ensure reliable initialization prior to the FWI calculations.
2.4. Statistical Analyses
The FWI percentiles were calculated based on the FWI values derived from weather stations, and these percentiles facilitated the analysis of the correlation between fire danger levels and wildfire occurrence. The FWI values at the wildfire ignition points were estimated using spatial interpolation, and the frequency of wildfire occurrence was assessed across the FWI percentile bins. Linear, exponential, and polynomial regression functions were used to model the relationship. The best-fitting model was selected based on the coefficient of determination (R2), with polynomial regressions limited to third-order terms to prevent overfitting.
3. Results
3.1. Forest Fire History in South Korea
The analysis of the annual burned area from 2004 to 2023 revealed a clear temporal shift in wildfire activity in South Korea. During the first decade (2004–2013), the total burned area generally exhibited a declining trend, with most annual totals remaining below 2000 ha. However, beginning in 2014, the burned areas gradually increased, culminating in a sharp surge from 2018 onward. This trend peaked in 2022, when the annual burned area exceeded 24,000 ha, and the highest value was recorded in the two-decade period. Increased levels of burned areas were also observed in 2023 (Figure 3).
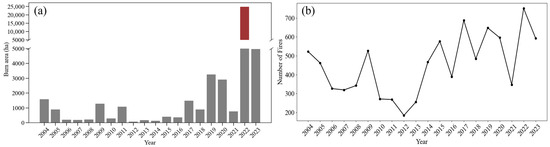
Figure 3.
Annual trends in forest fire burned area and number of fires in South Korea from 2004 to 2023. (a) Annual burn area; (b) annual number of fires.
Similarly, the analysis of the wildfire occurrence data exhibited a notable increase in fire events over the same period. Fire counts showed a declining trend from 2004 to 2013, followed by a steady increase from 2014. By 2022, the number of wildfire incidents exceeded 700, representing the highest annual frequency recorded during the study period (Figure 3).
These findings suggest a potential shift in wildfire regimes, characterized by increased frequency and severity in recent years. This change may be driven by a combination of factors, including climate variability, fuel accumulation, and evolving forest conditions.
Two heatmaps depicting the monthly forest fire frequency and burned area from 2004 to 2023 revealed consistent seasonal patterns and interannual variability in fire activity across South Korea (Figure 4 and Figure 5).
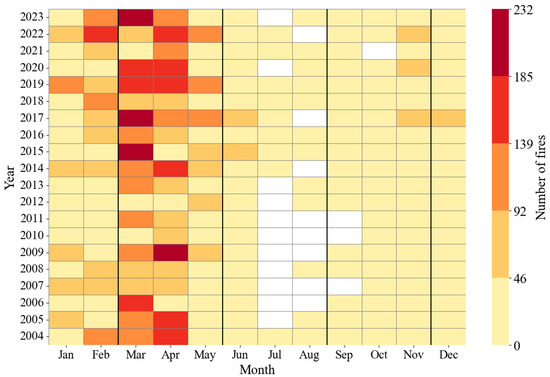
Figure 4.
Heatmap illustrating the monthly forest fire counts in South Korea from 2004 to 2023. The transition from yellow to red represents an increasing fire frequency (YlOrRd colormap). White cells indicate no data; black lines delineate seasonal divisions.
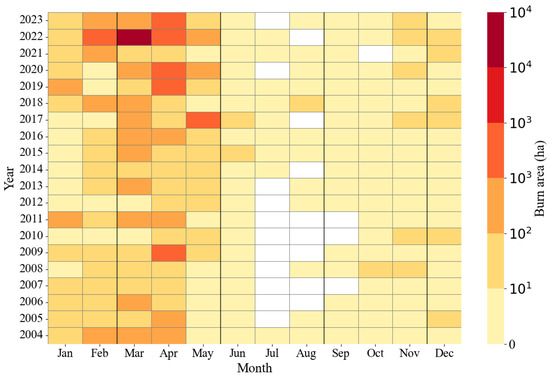
Figure 5.
Heatmap illustrating the monthly forest fire burn areas in South Korea from 2004 to 2023. The burn area transitions from yellow to red (YlOrRd colormap). White cells indicate no data; black lines delineate seasonal divisions.
The wildfire frequency was highly concentrated in the late winter and spring months, particularly from February to May. Since 2015, March has witnessed a substantial increase in wildfire occurrences. Similarly, burned areas became more pronounced in March, considerably increasing in April. Fire activity was minimal or absent during the summer months (July–August), whereas wildfire events were common in the autumn months (September–November).
3.2. Analysis of Meteorological Factors Influencing Forest Fires in South Korea
The analysis of annual climate trends from 2004 to 2023 revealed substantial variations across various meteorological parameters relevant to wildfire danger.
The average temperature demonstrated a consistent upward trend, increasing from approximately 12.25 °C in 2012 to over 13.7 °C in 2023.
Both the maximum and minimum temperatures followed a similar trajectory, with all three temperature indicators reaching their peak values in 2023.
The relative humidity exhibited a gradual increase over the study period. In contrast to the temperature and humidity, the wind speed showed a declining trend from 2004 to 2023.
The annual precipitation revealed substantial interannual variability, with the peak values observed in 2011 and 2020; however, no definitive long-term trend was identified.
Monthly trends in the average, maximum, and minimum temperatures indicated a gradual increase starting in January, with peak values typically observed during the summer months of July and August. Temperatures subsequently decreased as the region transitioned to autumn (Figure 6).
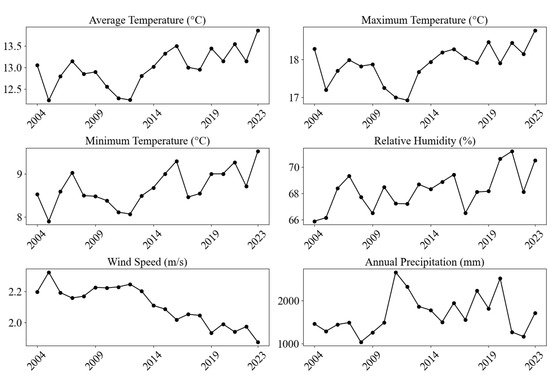
Figure 6.
Annual variability in climate factors associated with fire danger from 2004 to 2023.
A comparative analysis of the fire weather conditions was conducted for the 2004–2013 and 2014–2023 periods to identify changes in wildfire occurrence trends. The average, maximum, and minimum temperatures were consistently higher during the 2014–2023 period than those during the 2004–2013 period, particularly from March to June. This phenomenon suggests a general warming trend during the early fire season (Figure 7).
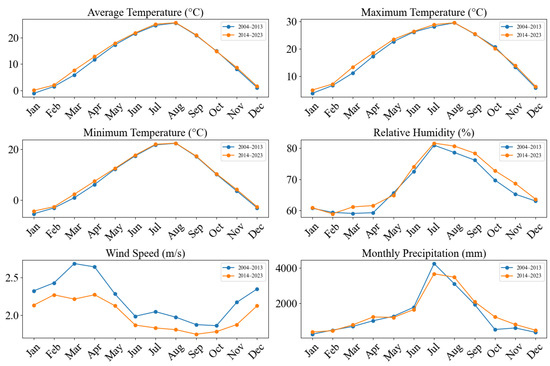
Figure 7.
Comparison of monthly climate patterns for the 2004–2013 and 2014–2023 periods.
The relative humidity was generally higher during the 2014–2023 period, except in February and May. In both periods, the relative humidity peaked in July and then gradually decreased. However, in the 2004–2013 period, the humidity increased after March, whereas, in the 2014–2023 period, the humidity began to increase earlier, from February (Figure 7).
The wind speed was generally lower during the 2014–2023 period than that observed in the 2004–2013 period. In both periods, the wind speed peaked during the spring months (March–May), decreased during summer, and increased again in late autumn (from November onward) (Figure 7).
The precipitation peaked in July during both periods and decreased steadily during the winter months, reaching the minimum levels between November and January. Notably, the precipitation levels from September to January were consistently higher in the 2014–2023 period than in the 2004–2013 period.
3.3. Analysis of Forest Fires Using the Fire Weather Index in South Korea
The annual average FWI from 2004 to 2023 demonstrated considerable interannual variability. Elevated FWI levels were observed in 2004, 2009, 2017, and particularly in 2022, whereas the 2010–2015 period showed comparatively lower values. Overall, the most recent decade demonstrated a general increase in FWI levels (Figure 8).
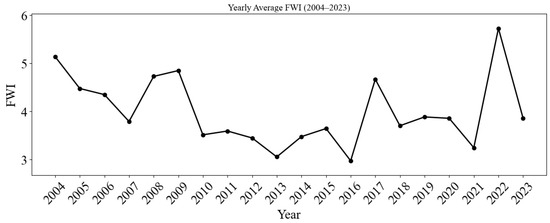
Figure 8.
Annual trends in the Fire Weather Index (2004–2023).
A comparison of the monthly FWI values between the two periods (2004–2013 and 2014–2023) revealed distinct seasonal variations in fire danger. In spring, especially in March, when the wildfire frequency typically peaked, the average FWI of the 2014–2023 period was higher than that of the preceding decade. The increased frequency of wildfires in May over the most recent decade aligned with an upward shift in the mean May FWI values during the same period (Figure 9).
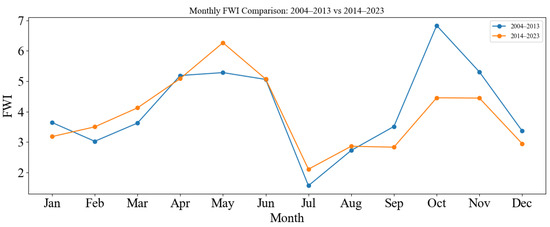
Figure 9.
Decadal comparison of monthly Fire Weather Index values (2004–2013 versus 2014–2023).
During both periods, the lowest FWI values occurred in July, with a subsequent gradual increase observed in the latter half of the month. Notably, the 2014–2023 period exhibited higher FWI values in spring and lower FWI values in autumn than those observed in the 2004–2013 period (Figure 9).
3.4. Relationship Between the FWI, Wildfire Occurrence, and Burn Area
The relationship between the FWI and wildfire activity was examined through percentile-based binning and scatterplot analyses. The evaluation of the wildfire frequency using FWI percentile bins based on weather station data revealed a distinct upward trend, with a substantial increase in the number of wildfires occurring at higher percentiles, particularly above 97% (Figure 10).
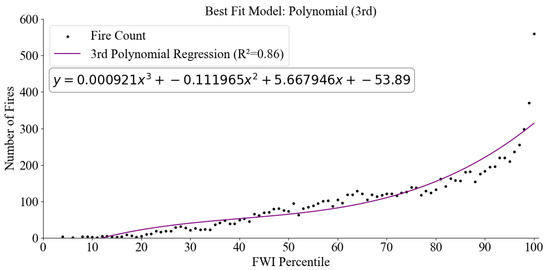
Figure 10.
Number of wildfire events categorized by Fire Weather Index (FWI) percentile bin for all recorded fires.
The regression model fitted to this trend demonstrated a strong positive correlation (R2 = 0.86), indicating a statistically significant association between elevated FWI values and wildfire occurrence. These results indicate the utility of the FWI as a predictive indicator of fire danger under varying weather conditions (Figure 10).
Further analysis focused on large wildfires, defined as those exceeding 100 ha in burned areas. The frequency of these events increased exponentially with increasing FWI percentiles, particularly above the 90th percentile. The exponential regression model yielded an R2 value of 0.66, indicating a positive correlation between extreme fire weather and the likelihood of large-scale wildfire events (Figure 11).
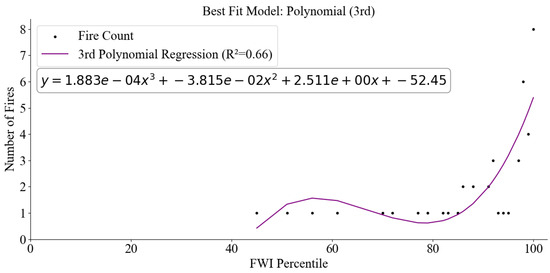
Figure 11.
Distribution of large wildfires (≥100 ha) categorized by Fire Weather Index (FWI) percentile bin.
When comparing the FWI values to the burned area sizes of large fires, the log-transformed regression revealed only a modest upward trend. Although larger fires tended to be associated with higher FWI values, their explanatory power was limited (R2 = 0.05). This suggests that the FWI alone may not serve as a reliable predictor of the total burned area (Figure 12). Nevertheless, the positive slope indicated that larger burned areas were more likely to be present under heightened fire weather conditions, albeit less directly than that of the fire frequency.
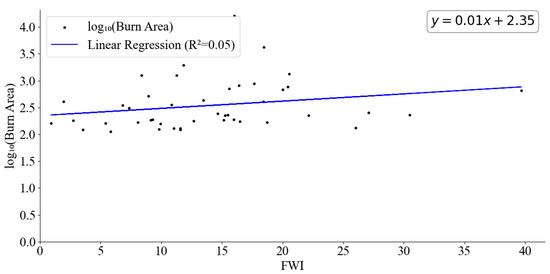
Figure 12.
Scatterplot illustrating the relationship between the Fire Weather Index (FWI) and log-transformed burn area size (log10 burn area).
3.5. Region Variability in the Fire Weather Index (FWI) and Meteorological Factors
The spatial distribution of the FWI and associated meteorological variables across South Korea revealed considerable regional variations in climate-induced fire danger. A comparison of the FWI values derived from weather station data between the two decades, namely 2004–2013 and 2014–2023, indicated an overall increase in the FWI at most stations in Gangwon State, Gyeongsangbuk-do, Chungcheongbuk-do, and Gyeonggi-do. Conversely, the FWI levels decreased at stations in Chungcheongnam-do, Jeollabuk-do, Jeollanam-do, and Gyeongsangnam-do. These findings suggest that regional differences in fire weather conditions have intensified in recent years (Figure 13).
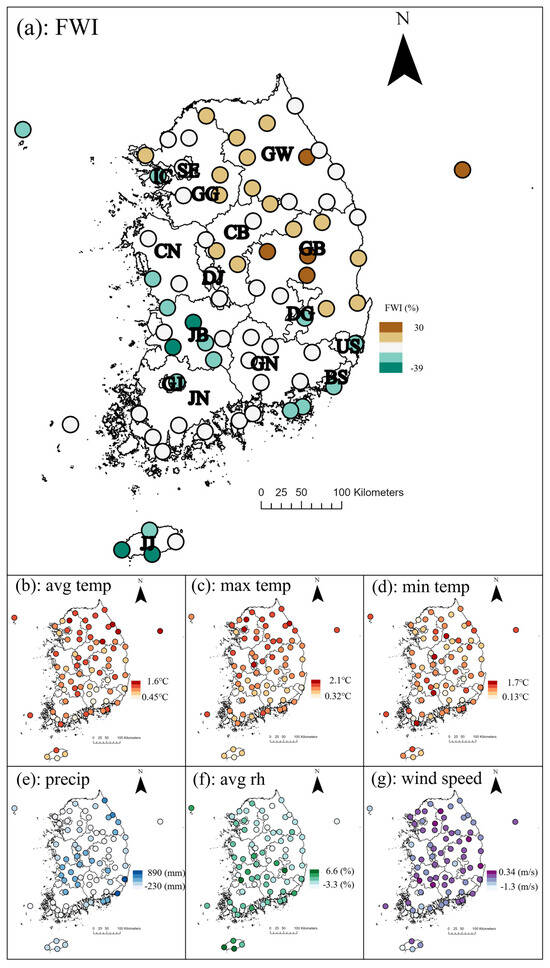
Figure 13.
Spatial distribution of decadal changes in the Fire Weather Index (FWI) and key meteorological variables across South Korea. (a) FWI percentage changes for the 2004–2013 and 2014–2023 periods. (b–d) Increases in average, maximum, and minimum temperatures (°C). Changes in (e) precipitation (mm), (f) relative humidity (%), and (g) wind speed (m/s). (BS: Busan, CB: Chungcheongbuk-do, CN: Chungcheongnam-do, DG: Daegu, DJ: Daejeon, GB: Gyeongsangbuk-do, GG: Gyeonggi-do, GJ: Gwangju, GN: Gyeongsangnam-do, GW: Gangwon State, IC: Incheon, JB: Jeollabuk-do, JJ: Jeju, JN: Jeollanam-do, SE: Seoul, US: Ulsan).
Similar spatial patterns were observed for key meteorological variable trends. In particular, Gangwon State experienced higher temperatures and lower relative humidity during the most recent decade. Comparable trends were observed in Chungcheongnam-do, Gyeonggi-do, and Gyeongsangbuk-do. Additionally, Gyeongsangbuk-do experienced a substantial decline in precipitation over the same period (Figure 13).
This pattern indicates that these provinces are experiencing increasingly fire-conducive weather conditions compared to other parts of the country. Overall, these results suggest that the most substantial increases in the FWI occurred in regions experiencing concurrent warming, decreased humidity, and, in certain instances, reduced precipitation (Figure 13).
The wildfire occurrence regional trends were analyzed using two approaches: FWI percentiles derived from all 73 weather stations and region-specific FWI percentile thresholds (Figure 14 and Figure 15). In all regions except Incheon, Jeollanam-do, and Jeju, the number of wildfires increased as the FWI percentile values rose, indicating a strong overall correlation between the fire danger levels and fire frequency.
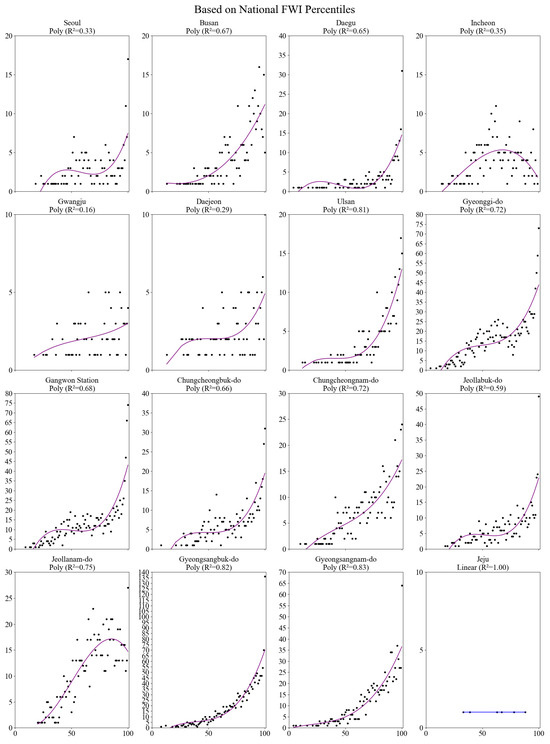
Figure 14.
Regional wildfire occurrence trends based on national Fire Weather Index (FWI) percentiles derived from all 73 weather stations.
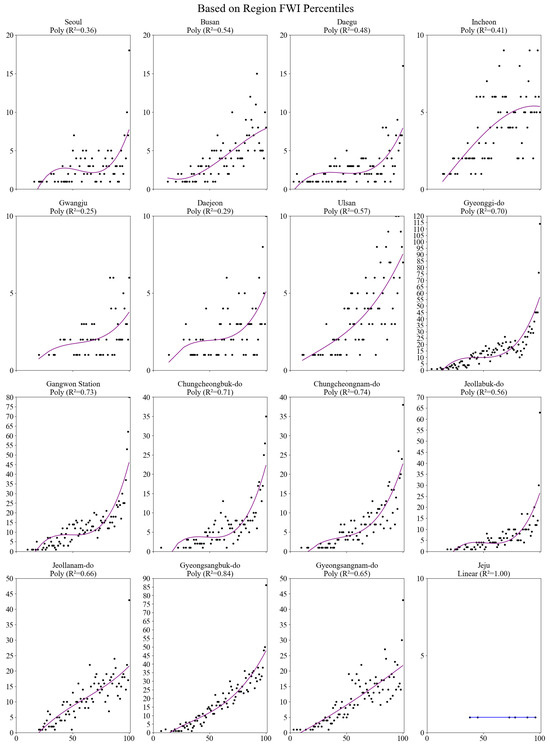
Figure 15.
Regional wildfire occurrence trends based on Fire Weather Index (FWI) percentiles calculated independently for each region.
When using the common FWI percentiles calculated from all stations, several regions, including Ulsan, Gyeongsangbuk-do, and Gyeongsangnam-do, exhibited particularly strong correlations, with an R2 value exceeding 0.8 (Figure 14). However, when the FWI percentiles were adjusted individually for each region, only Gyeongsangbuk-do maintained an R2 above 0.8. Despite this difference, most regions still demonstrated an increasing trend in wildfire frequency corresponding to the rise in FWI percentiles (Figure 15).
These results suggest that, despite employing a consistent method to calculate the fire danger, the correlation between the FWI and wildfire occurrence can differ considerably by region. Therefore, applying region-specific fire danger thresholds may improve the accuracy of wildfire danger assessment and offer a more realistic basis for fire warning systems and response planning.
4. Discussion
4.1. Weather and the Fire Weather Index (FWI) in South Korea
The interannual trend of the FWI from 2004 to 2023 demonstrates substantial variability, with a notable increase in recent years. In particular, the annual average FWI in 2022 reached its highest level over two decades. This increase corresponds to elevated temperatures and irregular precipitation patterns, suggesting that shifts in climatic variables contribute to more frequent conditions conducive to fires. The correlation between wildfire occurrence patterns and climate change is well documented, with increasing temperatures and decreasing precipitation closely associated with increases in both the wildfire frequency and severity [36].
A comparison of the monthly FWI values between the two decades (2004–2013 versus 2014–2023) reveals a considerable upward trend during the spring months, especially from March to May. May exhibits a substantial increase in the average FWI over the most recent decade. In both decades, July exhibited the lowest FWI values, with particularly low values observed in the most recent decade. Despite elevated temperatures, South Korea experiences intense summer rainfall, which limits wildfire occurrences. The spring fire season is intensified by reduced precipitation, starting as early as September of the preceding year. This seasonal wildfire activity pattern has also been documented in previous studies on wildfire activity in South Korea [20]. This seasonal precipitation pattern makes spring the most fire-prone period in the region, influencing both the frequency and extent of fire damage [37]. Seasonal characteristics are key to understanding regional wildfire dynamics [38]. Moreover, the increased fire danger observed in spring over the most recent decade suggests that the wildfire danger during this season is expected to persistently increase due to ongoing climate change.
Regional variations in the FWI values highlight the importance of accounting for both the timing and spatial distribution of the fire season. When the wildfire danger is assessed at the national level using average values across the entire country, important regional differences may be obscured.
Significant regional disparities in wildfire danger have also been observed globally. A study that analyzed wildfire activity by dividing the world into four climate zones (boreal, temperate, tropical, and arid) found that fire activity increased by 111% in boreal regions and by 25% in temperate zones, underscoring the spatial variability of fire trends [2]. In the western United States, an elevation-dependent analysis revealed widespread increases in fire danger across mountainous areas, with the most acute trends occurring at elevations above 3000 m [39]. Similarly, a study on wildfire danger in Indian forests under climate change projected that the number of days with severe fire weather conditions could increase by up to 60% in dry forests, while decreasing by up to 40% in humid forests [3].
Consequently, relying solely on national averages can result in the under- or overestimation of the fire danger in specific areas, complicating the accurate assessment of localized fire danger.
4.2. Relationship Between the Fire Weather Index (FWI) and Forest Fires in South Korea
The FWI demonstrates a strong correlation with wildfire occurrence. An analysis of the wildfire counts across the FWI percentile bins revealed a sharp increase in the fire frequency with increasing FWI values. The polynomial regression model yielded a high R2 value of 0.86, underscoring the strong predictive capability of the FWI for wildfire ignition. These findings are consistent with those of previous studies that support the use of the FWI as an effective indicator of wildfire danger [40,41]. Moreover, it highlights the importance of adapting fire danger thresholds to regional conditions because the relationship between the FWI values and actual wildfire danger can vary geographically [3].
In addition, a marked increase in the number of large-scale wildfires (≥100 ha) was observed above the 90th percentile of the FWI. The polynomial model fit produced an R2 value of 0.66, reinforcing the utility of the FWI as an indicator of the ignition potential and a predictor of fire escalation. Although the correlation between the FWI and burned area size was relatively weak (R2 = 0.05), the positive slope of the trend line indicates a marginal association, suggesting that a larger burn area may occur under elevated FWI conditions.
4.3. Regional Disparities in the Forest Fire Weather Danger Rating
The spatial analysis of the FWI and related meteorological trends provides critical insights into the heterogeneous nature of wildfire danger across South Korea. Although national averages offer a general overview, the results of this study highlight that fire weather dynamics are highly region-specific and influenced by a complex interplay among climatic variables. Regional variability in meteorological factors is shaped by diverse elements, including the geographic location, inland versus coastal settings, topography, land use, and forest cover. Therefore, the accurate estimation of localized meteorological conditions is essential in improving the precision of wildfire danger assessments [42,43].
Provinces including Gangwon State, Gyeongsangbuk-do, Chuncheongbuk-do, and Gyeonggi-do demonstrated the most substantial FWI percentile increases during the most recent decade. These areas experienced elevated FWI values and substantial warming trends, characterized by increases in the average, maximum, and minimum temperatures. Gangwon State, Gyeongsangbuk-do, and Gyeonggi-do are among the regions with the highest wildfire frequencies. The observed correlation between local fire weather trends and fire occurrence patterns further reinforces the association between meteorological factors and wildfire danger.
As of 2020, Gangwon State and Gyeongsangbuk-do possess the largest forest areas in South Korea, with forest coverage of 1,366,644 ha and 1,333,691 ha, respectively. This highlights the need to consider both fuel availability and fire weather conditions during wildfire danger assessments in these regions. Gyeonggi-do, with a population of approximately 13.86 million in 2024, is the most populous administrative region in South Korea and is characterized by high anthropogenic fire danger due to its large population. Therefore, in addition to the weather conditions, human-related ignition factors should be considered in this province. Chuncheongbuk-do exhibits an upward trend in FWI values, indicating the need to account for climate-related wildfire danger in this region.
4.4. Limitations and Future Research
This study has several limitations that warrant consideration. First, the FWI system used in this analysis is based on standard coefficients derived from Canadian climatic conditions. While adjustments were made for solar radiation through latitude calibration and spin-up simulations, further regional tuning may be necessary to optimize its applicability to South Korea.
Second, this study did not incorporate localized fire danger thresholds derived from historical wildfire records in South Korea, which may have limited the accuracy of our danger classification. Future research should focus on developing region-specific thresholds based on long-term wildfire data. Additionally, the FWI should be integrated with additional variables, including the live and dead fuel moisture content, land cover dynamics, and anthropogenic ignition factors.
Furthermore, advanced modeling approaches, including machine learning and probabilistic forecasting methods, could enhance the predictive capabilities of FWI-based systems under future climate change scenarios.
5. Conclusions
This study provides several key insights regarding the applicability of the FWI for wildfire danger assessment in South Korea:
- (1)
- The FWI effectively captures wildfire-prone periods and regions, exhibiting strong seasonal and interannual variability. The highest FWI values occurred during the spring months (March–May), corresponding with the peak wildfire season in Korea.
- (2)
- Spatial analysis revealed significant regional increases in FWI values across provinces, including Gangwon State, Gyeongsangbuk-do, Chungcheongbuk-do, and Gyeonggi-do. These trends correspond with rising temperatures, declining precipitation, and increasing humidity variability over the past two decades, thereby highlighting the need for geographically targeted fire danger mitigation strategies.
- (3)
- The strong positive correlation between the FWI percentiles and wildfire occurrence, particularly for large-scale fires, validates the utility of the FWI in identifying high-danger conditions and supporting proactive fire management strategies.
Given its demonstrated utility, the FWI shows potential for integration into national wildfire policy and danger communication frameworks. However, its effective implementation at the national scale requires further research focused on regional calibration, high-resolution climate input incorporation, and long-term validation against Korean wildfire datasets. Strengthening these aspects is essential to enhance the accuracy of the index and ensure its continued relevance under evolving climate and topographic conditions.
Author Contributions
Conceptualization, C.J.L. and H.M.C.; methodology, C.J.L. and H.M.C.; software, C.J.L.; validation, H.M.C.; formal analysis, C.J.L.; investigation, C.J.L.; resources, C.J.L.; data curation, C.J.L.; writing—original draft preparation, C.J.L.; writing—review and editing, H.M.C.; visualization, C.J.L.; supervision, H.M.C. All authors have read and agreed to the published version of the manuscript.
Funding
This work was supported by a National Research Foundation of Korea (NRF) grant funded by the Korea government (RS-2023-NR076912) and the R&D Program for Forest Science Technology (Project No. RS-2024-00402624), provided by the Korea Forest Service (Korea Forestry Promotion Institute).
Data Availability Statement
The original contributions of this study are included in this article. Further inquiries related to the data can be directed to Chanjin Lim at lim6581@kangwon.ac.kr.
Conflicts of Interest
The authors declare no conflicts of interest.
References
- Luo, B.; Luo, D.; Dai, A.; Xiao, C.; Simmonds, I.; Hanna, E.; Overland, J.; Shi, J.; Chen, X.; Yao, Y.; et al. Rapid summer Russian Arctic sea-ice loss enhances the risk of recent Eastern Siberian wildfires. Nat. Commun. 2024, 15, 5399. [Google Scholar] [CrossRef] [PubMed]
- Senande-Rivera, M.; Insua-Costa, D.; Miguez-Macho, G. Spatial and temporal expansion of global wildland fire activity in response to climate change. Nat. Commun. 2022, 13, 1208. [Google Scholar] [CrossRef] [PubMed]
- Barik, A.; Baidya Roy, S. Climate change strongly affects future fire weather danger in Indian forests. Commun. Earth Environ. 2023, 4, 452. [Google Scholar] [CrossRef]
- Canadell, J.G.; Meyer, C.P.; Cook, G.D.; Dowdy, A.; Briggs, P.R.; Knauer, J.; Pepler, A.; Haverd, V. Multi-decadal increase of forest burned area in Australia is linked to climate change. Nat. Commun. 2021, 12, 6921. [Google Scholar] [CrossRef]
- Ying, L.; Han, J.; Du, Y.; Shen, Z. Forest fire characteristics in China: Spatial patterns and determinants with thresholds. For. Ecol. Manag. 2018, 424, 345–354. [Google Scholar] [CrossRef]
- Dowdy, A.J.; Ye, H.; Pepler, A.; Thatcher, M.; Osbrough, S.L.; Evans, J.P.; Di Virgilio, G.; McCarthy, N. Future changes in extreme weather and pyroconvection risk factors for Australian wildfires. Sci. Rep. 2019, 9, 10073. [Google Scholar] [CrossRef]
- Nunes, A.N. Regional variability and driving forces behind forest fires in Portugal an overview of the last three decades (1980–2009). Appl. Geogr. 2012, 34, 576–586. [Google Scholar] [CrossRef]
- Lee, B.; Park, P.S.; Chung, J. Temporal and spatial characteristics of forest fires in South Korea between 1970 and 2003. Int. J. Wildland Fire 2006, 15, 389–396. [Google Scholar] [CrossRef]
- Schroeder, M.J.; Buck, C.C.; Buck, C.C. Fire Weather: A guide for Application of Meteorological Information to Forest Fire Control Operations; No. 360; US Department of Agriculture, Forest Service: Washington, DC, USA, 1970.
- Flannigan, M.D.; Stocks, B.J.; Wotton, B.M. Climate change and forest fires. Sci. Total Environ. 2000, 262, 221–229. [Google Scholar] [CrossRef]
- Chen, B.; Lu, S.X.; Li, C.H.; Kang, Q.S.; Lecoustre, V. Initial fuel temperature effects on burning rate of pool fire. J. Hazard. Mater. 2011, 188, 369–374. [Google Scholar] [CrossRef]
- Guo, Y.; Xiao, G.; Wang, L.; Chen, C.; Deng, H.; Mi, H.; Tu, C.; Li, Y. Pool fire burning characteristics and risks under wind-free conditions: State-of-the-art. Fire Saf. J. 2023, 136, 103755. [Google Scholar] [CrossRef]
- Curry, J.R.; Fons, W.L. Forest-fire behavior studies. Mech. Eng. 1940, 62, 219–225. [Google Scholar]
- Sharples, J.J.; McRae, R.H.; Weber, R.O.; Gill, A.M. A simple index for assessing fuel moisture content. Environ. Model. Softw. 2009, 24, 637–646. [Google Scholar] [CrossRef]
- Cannon, J.B.; O’Brien, J.J.; Loudermilk, E.L.; Dickinson, M.B.; Peterson, C.J. The influence of experimental wind disturbance on forest fuels and fire characteristics. For. Ecol. Manag. 2014, 330, 294–303. [Google Scholar] [CrossRef]
- Sun, P.; Zhang, Y.; Sun, L.; Hu, H.; Guo, F.; Wang, G.; Zhang, H. Influence of fuel moisture content, packing ratio and wind velocity on the ignition probability of fuel beds composed of Mongolian oak leaves via cigarette butts. Forests 2018, 9, 507. [Google Scholar] [CrossRef]
- Holden, Z.A.; Morgan, P.; Crimmins, M.A.; Steinhorst, R.K.; Smith, A.M. Fire season precipitation variability influences fire extent and severity in a large southwestern wilderness area, United States. Geophys. Res. Lett. 2007, 34. [Google Scholar] [CrossRef]
- Xystrakis, F.; Kallimanis, A.S.; Dimopoulos, P.; Halley, J.M.; Koutsias, N. Precipitation dominates fire occurrence in Greece (1900–2010): Its dual role in fuel build-up and dryness. Nat. Hazards Earth Syst. Sci. 2014, 14, 21–32. [Google Scholar] [CrossRef]
- Dong, C.; Williams, A.P.; Abatzoglou, J.T.; Lin, K.; Okin, G.S.; Gillespie, T.W.; Long, D.; Lin, Y.-H.; Hall, A.; MacDonald, G.M. The season for large fires in Southern California is projected to lengthen in a changing climate. Commun. Earth Environ. 2022, 3, 22. [Google Scholar] [CrossRef]
- Kim, J.; Kim, T.; Lee, Y.E.; Im, S. Spatial and temporal variability of forest fires in the Republic of Korea over 1991–2020. Nat. Hazards 2025, 121, 9801–9821. [Google Scholar] [CrossRef]
- Grillakis, M.; Voulgarakis, A.; Rovithakis, A.; Seiradakis, K.D.; Koutroulis, A.; Field, R.D.; Kasoar, M.; Papadopoulos, A.; Lazaridis, M. Climate drivers of global wildfire burned area. Environ. Res. Lett. 2022, 17, 045021. [Google Scholar] [CrossRef]
- Field, R.D. Evaluation of Global Fire Weather Database reanalysis and short-term forecast products. Nat. Hazards Earth Syst. Sci. 2020, 20, 1123–1147. [Google Scholar] [CrossRef]
- Jones, M.W.; Abatzoglou, J.T.; Veraverbeke, S.; Andela, N.; Lasslop, G.; Forkel, M.; Smith, A.J.P.; Burton, C.; Betts, R.A.; van der Werf, G.R.; et al. Global and regional trends and drivers of fire under climate change. Rev. Geophys. 2022, 60, e2020RG000726. [Google Scholar] [CrossRef]
- Bohlmann, S.; Laine, M. Statistical calibration of probabilistic medium-range Fire Weather Index forecasts in Europe. Nat. Hazards Earth Syst. Sci. Discuss. 2024, 24, 4225–4235. [Google Scholar] [CrossRef]
- Di Giuseppe, F.; Vitolo, C.; Krzeminski, B.; Barnard, C.; Maciel, P.; San-Miguel, J. Fire Weather Index: The skill provided by the European Centre for Medium-Range Weather Forecasts ensemble prediction system. Nat. Hazards Earth Syst. Sci. 2020, 20, 2365–2378. [Google Scholar] [CrossRef]
- Ziel, R.H.; Bieniek, P.A.; Bhatt, U.S.; Strader, H.; Rupp, T.S.; York, A. A comparison of fire weather indices with MODIS fire days for the natural regions of Alaska. Forests 2020, 11, 516. [Google Scholar] [CrossRef]
- Yang, G.; Di, X. Adaptation of Canadian Forest Fire Weather Index system and it’s application. In Proceedings of the 2011 IEEE International Conference on Computer Science and Automation Engineering, Shanghai, China, 10–12 June 2011; Volume 2, pp. 55–58. [Google Scholar]
- Tian, X.; McRae, D.J.; Jin, J.; Shu, L.; Zhao, F.; Wang, M. Wildfires and the Canadian Forest Fire Weather Index system for the Daxing’anling region of China. Int. J. Wildland Fire 2011, 20, 963–973. [Google Scholar] [CrossRef]
- Ertuğrul, M.; Varol, T. Evaluation of fire activity in some regions of Aegean coasts of Turkey via Canadian forest fire weather index system (CFFWIS). Appl. Ecol. Environ. Res. 2016, 14, 93–105. [Google Scholar] [CrossRef]
- Martell, D.L. A Markov chain model of day to day changes in the Canadian forest fire weather index. Int. J. Wildland Fire 1999, 9, 265–273. [Google Scholar] [CrossRef]
- Risk, C.; James, P.M.A. Optimal Cross--Validation Strategies for Selection of Spatial Interpolation Models for the Canadian Forest Fire Weather Index System. Earth Space Sci. 2022, 9, e2021EA002019. [Google Scholar] [CrossRef]
- Barrios, A.; Trincado, G.; Garreaud, R. Alternative approaches for estimating missing climate data: Application to monthly precipitation records in South-Central Chile. For. Ecosyst. 2018, 5, 28. [Google Scholar] [CrossRef]
- Chang, C.L.; Lo, S.L.; Yu, S.L. Interpolating precipitation and its relation to runoff and non–point source pollution. J. Environ. Sci. Health 2005, 40, 1963–1973. [Google Scholar] [CrossRef] [PubMed]
- Wagner, C.V. Development and Structure of the Canadian Forest Fire Weather Index System; No. 35; CABI: Wallingford, UK, 1987; pp. viii+–37. [Google Scholar]
- Wang, X.; Wotton, B.M.; Cantin, A.S.; Parisien, M.A.; Anderson, K.; Moore, B.; Flannigan, M.D. cffdrs: An R package for the Canadian forest fire danger rating system. Ecol. Process. 2017, 6, 5. [Google Scholar] [CrossRef]
- Abram, N.J.; Henley, B.J.; Sen Gupta, A.; Lippmann, T.J.; Clarke, H.; Dowdy, A.J.; Sharples, J.J.; Nolan, R.H.; Zhang, T.; Wooster, M.J.; et al. Connections of climate change and variability to large and extreme forest fires in southeast Australia. Commun. Earth Environ. 2021, 2, 1–17. [Google Scholar] [CrossRef]
- Morgan, P.; Heyerdahl, E.K.; Gibson, C.E. Multi--season climate synchronized forest fires throughout the 20th century, northern Rockies, USA. Ecology 2008, 89, 717–728. [Google Scholar] [CrossRef]
- Dowdy, A.J.; Mills, G.A.; Finkele, K.; De Groot, W. Australian Fire Weather as Represented by the McArthur Forest Fire Danger Index and the Canadian Forest Fire Weather Index; CSIRO: Canberra, Australia, 2009. [Google Scholar]
- Alizadeh, M.R.; Abatzoglou, J.T.; Adamowski, J.; Modaresi Rad, A.; AghaKouchak, A.; Pausata, F.S.; Sadegh, M. Elevation-dependent intensification of fire danger in the western United States. Nat. Commun. 2023, 14, 1773. [Google Scholar] [CrossRef]
- De Jong, M.C.; Wooster, M.J.; Kitchen, K.; Manley, C.; Gazzard, R.; McCall, F.F. Calibration and evaluation of the Canadian Forest Fire Weather Index (FWI) System for improved wildland fire danger rating in the United Kingdom. Nat. Hazards Earth Syst. Sci. 2016, 16, 1217–1237. [Google Scholar] [CrossRef]
- Carrillo, J.; Pérez, J.C.; Expósito, F.J.; Díaz, J.P.; González, A. Projections of wildfire weather danger in the Canary Islands. Sci. Rep. 2022, 12, 8093. [Google Scholar] [CrossRef]
- Santos, R.; Russo, A.; Gouveia, C.M. Co-occurrence of marine and atmospheric heatwaves with drought conditions and fire activity in the Mediterranean region. Sci. Rep. 2024, 14, 19233. [Google Scholar] [CrossRef]
- Gui, K.; Zhang, X.; Che, H.; Li, L.; Zheng, Y.; Zhao, H.; Zeng, Z.; Miao, Y.; Wang, H.; Wang, Z.; et al. Future climate-driven escalation of Southeastern Siberia wildfires revealed by deep learning. NPJ Clim. Atmos. Sci. 2024, 7, 263. [Google Scholar] [CrossRef]
Disclaimer/Publisher’s Note: The statements, opinions and data contained in all publications are solely those of the individual author(s) and contributor(s) and not of MDPI and/or the editor(s). MDPI and/or the editor(s) disclaim responsibility for any injury to people or property resulting from any ideas, methods, instructions or products referred to in the content. |
© 2025 by the authors. Licensee MDPI, Basel, Switzerland. This article is an open access article distributed under the terms and conditions of the Creative Commons Attribution (CC BY) license (https://creativecommons.org/licenses/by/4.0/).