Article

The Influence of Thermal Modification, Moisture Content, Frequency, and Vibration Direction Plane on the Damping of Spruce Wood (Picea abies) as Determined by the Wavelet Transform Method

by
Miran Merhar
1,* and
Rostand Moutou Pitti
2
1
Department of Wood Science and Technology, Biotechnical Faculty, University of Ljubljana, Jamnikarjeva 101, 1000 Ljubljana, Slovenia
2
Clermont Auvergne INP, Institut Pascal, Université Clermont Auvergne, 63000 Clermont-Ferrand, France
*
Author to whom correspondence should be addressed.
Forests 2025, 16(7), 1055; https://doi.org/10.3390/f16071055
Submission received: 17 May 2025 / Revised: 13 June 2025 / Accepted: 23 June 2025 / Published: 25 June 2025
(This article belongs to the Section Wood Science and Forest Products)

Abstract

This article analyses the main effect and interaction of thermal modification, wood moisture content, frequency, and vibration direction on the damping of spruce wood. Samples were thermally modified at three different temperatures (180 °C, 200 °C, and 230 °C) and then equilibrated at four different relative humidities (RHs) (20%, 44%, 76%, and 88%). The specimens were then freely supported and excited with a hammer to vibrate freely. Damping at the frequencies of the first three bending vibration modes for vibrations in the radial (LR plane) and tangential (LT plane) directions was determined using the wavelet transform method, which enables a decoupling of the vibration modes and thus a precise and accurate determination of the damping values. Damping increases with the wood moisture content for different modification levels, whereby the damping in the LR vibration direction plane differs from the damping in the LT vibration direction plane. For an unmodified sample and at frequency at the first vibration mode, damping in the radial plane is greater than in the tangential plane, but the relationships change with RHs, modification levels, and vibration direction planes. The dependence of damping on various factors has a strong influence on the calculation of various acoustic indicators, where damping of the wood is considered for the calculation, since damping for the same sample differs depending on the direction of vibration and the frequencies at different vibration modes.

1. Introduction

Wood is used in a variety of industries, from construction to the manufacturing of wooden musical instruments, where knowledge of the damping of wood is essential. The damping of wood has therefore been the subject of much research, investigating various effects on the extent of damping, both in construction [1] and in general research. For example, the influence of moisture and wood species on the extent of damping was investigated [2,3,4,5,6]. The authors found that damping increases with wood moisture content and decreases with the specific dynamic modulus (modulus of elasticity/density) [7,8]. Similarly, damping increases with an increasing vibration frequency, and the authors also found that damping increases with increasing shear influence during lateral vibrations [7,9]. Damping was also studied in wooden musical instruments [10,11,12,13], whereby in addition to damping, anatomical direction is also important, as mechanical properties are different in the radial direction than in the tangential direction.
Damping of the system is an important material property. When the system is excited by a variable force, the system begins to vibrate, whereby the amplitude and phase shift of the forced vibration depends not only on the excitation force [14] but also on the damping material. Thus, high damping is desirable if a low amplitude of the system response is desired in the forced vibration, and conversely, low damping is desirable if the largest possible vibration amplitude is desired.
To protect wood from pests, thermal modification of wood is a widely used and popular method, as it is environmentally friendly and, at the same time, increases dimensional stability and bio-resistance [15,16] and reduces hygroscopicity but, unfortunately, also reduces mechanical properties [17,18,19,20,21,22,23]. The latter properties are also very important in the manufacturing of wooden musical instruments, as it is desirable that the dimensional stability as well as the durability of the wood is high. The thermal modification of wood also changes damping, which has been confirmed by several researchers who have studied damping in beech, spruce, and other species [24,25,26,27]. In addition to thermal modifications, various types of modifications are also known to affect the mechanical and other properties of wood [28,29,30,31,32,33,34].
Depending on the damping mechanism, damping can be divided into hysteretic and viscous damping [14]. Hysteretic damping can be represented by the microstructure of the material, while viscous damping depends on the vibration velocity. In practice, damping is composed from various causes of damping, evaluated as structural damping [14,35] and represented by a damping factor.
Damping can be determined either in the time domain or in the frequency domain [35], whereby systems with a discrete or distributed mass can be modelled. Simple systems with a discrete mass can be modelled as a single-degree-of-freedom (SDOF) system, while more complex systems can be modelled as a multi-degree-of-freedom (MDOF) system. In the time domain, the logarithmic decrement method is very popular for SDOF systems, while the Smith least squares algorithm (SLS) [36] and the least complex exponential squares method (LSCE) [37] are popular for MDOF systems. In frequency space, on the other hand, the simple 3 dB method is widely used. However, it is only satisfactorily accurate in the case of minimal crossover, while the 3 dB method is inaccurate in cases where the frequencies are very close to each other or in highly damped systems, as the frequency response function (FRF) of individual modes is influenced by the FRF of the other modes.
The wavelet method is increasingly being used. If several more or less localized SDOF systems are superpositioned in an MDOF system, then specific functions can be used to decompose the signal into a time-scale representation instead of a time–frequency representation. When the time shift is replaced by a translation and the frequency by a dilation or scaling, the time-scale decomposition results in a wavelet transform (WT). It has been used by many authors to determine damping [36,38,39,40,41] and is also useful for determining the natural frequencies of vibrations [42,43] and the mode shape of vibrations [44]. WT is also useful for determining various modal parameters or as a filter for extracting a specific vibration mode [36,39,45,46].
As already mentioned, there are many studies in which researchers have investigated the effects of individual factors on the damping of wood. However, despite the extensive literature, to the authors’ knowledge, there is no study that has investigated both the main and interactive effects of moisture content, the degree of thermal modification, frequency, and the vibration direction of the samples. Although the effects of the individual factors on damping are known, the influence of the interactions between the individual factors has not been investigated in detail. This is particularly important, for example, in the manufacturing of wooden musical instruments, where all the factors described above are important, including the anatomical direction, the frequency dependence of damping, and the increasing use of thermally modified wood as a factor in increasing the dimensional stability and biological durability of the wood. For example, the influence of moisture content can be different for differently modified woods and can also be different at different frequencies. Similarly, most authors have used the logarithmic decrement to determine damping in their studies, although the time recordings contained vibrations of a larger number of vibration modes, or they have used the 3 dB method, although the frequency response function of each mode was subject to the influence of the neighbouring vibration mode. The aim of this study is therefore to analyse the main influence and the interaction between the wood moisture content; the degree of thermal modification; frequency; and the direction of vibration on wood damping using the WT method, which makes it possible to decouple vibration modes and thus philtre out their mutual influence.

2. Materials and Methods

2.1. Specimen Preparation

A spruce (Picea abies) board with the dimensions 4000 mm × 290 mm × 55 mm and a constant growth ring width was initially cut into four pieces of 1 m in length (Figure 1). The first piece was left untreated (group A), while the other three were thermally treated using the Silvapro method [47]. The second piece was treated at 180 °C (group B), the third at 200 °C (group C), and the last at 230 °C (group D), with mass losses of 1.8%, 4%, and 10.6%, respectively. The temperature range was chosen according to the usual temperature of thermal modification for spruce, which ranges from 180 °C to 230 °C [47]. After modification, all pieces were stored for six months at 22 °C and 65% relative humidity (RH) to allow the internal stresses to relax [47].
Each single piece of 1 m in length was then cut into four smaller pieces of 245 mm in length, from which 10 samples of 245 mm × 22 mm × 22 mm were cut (Figure 1). The individual groups of 10 samples were then equilibrated to a constant sample mass at 22 °C and an RH of 20%, 44%, 76%, and 88% to reach the corresponding equilibrium moisture content (EMC). After equilibration, the samples were cut to a final size of 200 mm × 20 mm × 20 mm. For wood EMC determination at various RHs, additional samples were used, which were dried at 103 °C after equilibration, and moisture content was determined from the mass loss.

2.2. Vibration Measurements

The samples were freely supported at a distance of 0.22 L and 0.77 L, as shown in Figure 2. They were excited with a hammer in the radial (R) direction and in the tangential (T) direction (Figure 2) so that the specimen vibrates in the LR and LT vibration plane, respectively. Using hammer excitation, it is important to keep the duration of the excitation pulse as short as possible so that the width of the frequency spectrum of the pulse is greater than the expected peak value of the vibration frequency [35]. In our case, the frequency of the third mode was around 9000 Hz, so the frequency spectrum had to be wider than 9000 Hz. It is also important that the excitation position is not at the nodal points. To fulfil both conditions, a hammer with a metal tip was used in the experiment, and the excitation position was about 1/3 of the sample length. If a hammer with a rubber or plastic tip was used, the frequency spectrum of the excitation pulse was too narrow, and the third vibration mode could not be excited. In the experiment, neither the frequency spectrum of the excitation pulse was measured nor was the position of the sample excitation approximately controlled. The measurement was confirmed as appropriate if there was a distinct peak in the frequency spectrum of the free vibration of the sample at about 9000 Hz. If there was no distinct peak, the measurement was repeated several times until the peak was distinctly present. Thus, for each vibration direction (LR and TL vibration plane) 10 corresponding measurements were carried out. The time responses were measured using the Bruel & Kjaer (Nærum, Denmark) type 4939 microphone, an NI-USB-6361 (Austin, TX, USA) DAQ card, and the LabVIEW (Austin, TX, USA) v2022 software with a sampling rate of 50 kHz and an acquisition time of 1 s. For all combinations of thermal modification, moisture content depending on RH, measurement direction, and number of repetitions, 3200 time recordings of the sample vibrations were made (4 modifications × 4 RHs × 2 directions × 10 samples × 10 repetitions). Using the LabVIEW software, a frequency spectrum with a resolution of 1 Hz was generated for each vibration direction from 10 repeated time measurements using a fast Fourier transform (FFT), and the frequencies for the first three vibration modes were determined.
From the 10 measured time recordings, the time recording that most clearly contained the frequencies for the first three bending vibration modes was selected for each combination of thermal modification, RH, and vibration direction, from which damping was then determined. In the event that the spectrum contained a large number of natural frequencies from which the natural frequencies of the bending and torsional vibrations could not be separated, the sample was additionally excited, taking particular care to ensure that the excitation point was in the centre of the sample.

2.3. Damping Determination

Damping was determined using the wavelet transform (WT), which provides a time–frequency representation of the time signal, x(t), using a linear transformation that can be written as follows [36,41,48]:
W g x a , b = 1 a + x t g * t b a d t ,
where a is the scale/dilation parameter that determines the width of the wavelet, and b is the translation parameter defining the position of the wavelet function in the time domain. g*(t) is the conjugate complex function of the basic wavelet function, g(t), where each wavelet transform is normalised by the factor 1/√a, which ensures that the integral energy is independent of the dilation parameter, a.
In the calculation, the admissibility condition [48] must be satisfied with
C g = + G ( ω ) 2 ω d ω < ,
where G(ω) is the Fourier transform of g(t). To satisfy the time–frequency localisation of g(t), the wavelet must also satisfy the following condition:
+ g ( t ) d t < .
Similarly, the function, x(t), analysed must decay to zero over time to satisfy the following condition:
+ x ( t ) 2 d t < .
Considering all conditions, the signal, x(t), can be regenerated by an inverse wavelet transform as follows:
x t = 1 C g + + ( W g x ) ( a , b ) 1 a g * t b a d a d b a 2 .
If function x(t) can be written as a superposition of functions, the wavelet transform can also be written as a linear superposition:
W g i = 1 N α i x i a , b = i = 1 N α i ( W g x i ) a , b .
In the relation
a = ω 0 ω ,
ω describes the frequency of system vibration, and ω0 is the wavelet frequency.
Wavelet transform can be written also by transforming the signal, x(t), and the wavelet function, g(t), in frequency space:
W g x a , b = a + X ω G * a ω e j ω b d ω ,
where X(ω) and G*() are the Fourier transforms of x(t) and g*(t), respectively.
In the analysis, Morlet wavelet was used [45,49,50],
g t = e j ω 0 t e t 2 / 2 .
where ω0 is the wavelet frequency, while the spectrum of a dilated Morlet wavelet in frequency space is defined as follows:
G a ω = e ( a ω ω 0 ) 2 .
Since the Morlet wavelet does not fulfil the admissibility conditions (Equation (2)) over the entire frequency range, as G(0) > 0 results in Cg = ∞, values ω0 > 5 were used.
In the conducted experiment, the distributed mass system can be treated as a decoupled multi-degree-of-freedom system, where the time response of the free vibration can be written as the sum of the individual single-degree-of-freedom-system responses:
x t = i = 1 N A i e ζ i ω i t c o s 1 ζ i 2 ω i t ϕ i ,
where Aj is the residue amplitude, ζj is the damping ratio, ωj is the undamped angular frequency, and ϕj is the phase shift for each decoupled mode, i. Considering that the response can also be written as the sum of analytical signals where only the real part is taken, Equation (11) can also be written as follows:
x t = i = 1 N A i e ζ i ω i t e 1 ζ i 2 ω i t ϕ i j .
Taking only the modulus of the wavelet transform of the function x(t) (Equation (12)), the solution can be approximated as follows:
W g i = 1 N x i a , b i = 1 N A i e ζ i ω i b G * ± j a i ω i 1 ζ i 2 .
When only a specific vibration mode, i, with a natural frequency, ωi, is considered, the wavelet transform can be written as
W g x i a i , b A i e ζ i ω i b G * ± j a i ω i 1 ζ i 2 .
Applying the logarithm to Equation (14), the final solution is as follows:
W g x i a i , b A i e ζ i ω i b G * ± j a i ω i 1 ζ i 2 .
Equation (15) can be used to determine the damping factor, ζi, for each decoupled mode from the slope of the straight line of the wavelet modulus cross-section W g x i a i , b for a given value of the dilation parameter, ai, related to the natural frequency, ωi, of the system and plotted on a semi-logarithmic scale.
The curve of the maximum value of the WT modulus in the time–frequency plane is called the wavelet ridge, ar(b), and the modulus values corresponding to the points in the curve are called the wavelet skeleton. There are several algorithms for ridge extraction proposed by Tchamitchian and Torresani [51]. In the experiment, the local maxima of the WT modulus were determined based on the natural frequency of the damped vibration, ω, from the frequency spectrum using the LabView software.

2.4. Statistical Analysis

The average damping factors and the coefficient of variation (COV) were determined for each group of samples. An ANOVA test (F-test) was performed using the SPSS software v22 to determine the significance of the main factors and their interactions, assuming 5% as the significance level (p-value). In addition, a post hoc analysis was performed using the Duncan test to determine significant differences between the damping values for each factor combination tested.

3. Results and Discussion
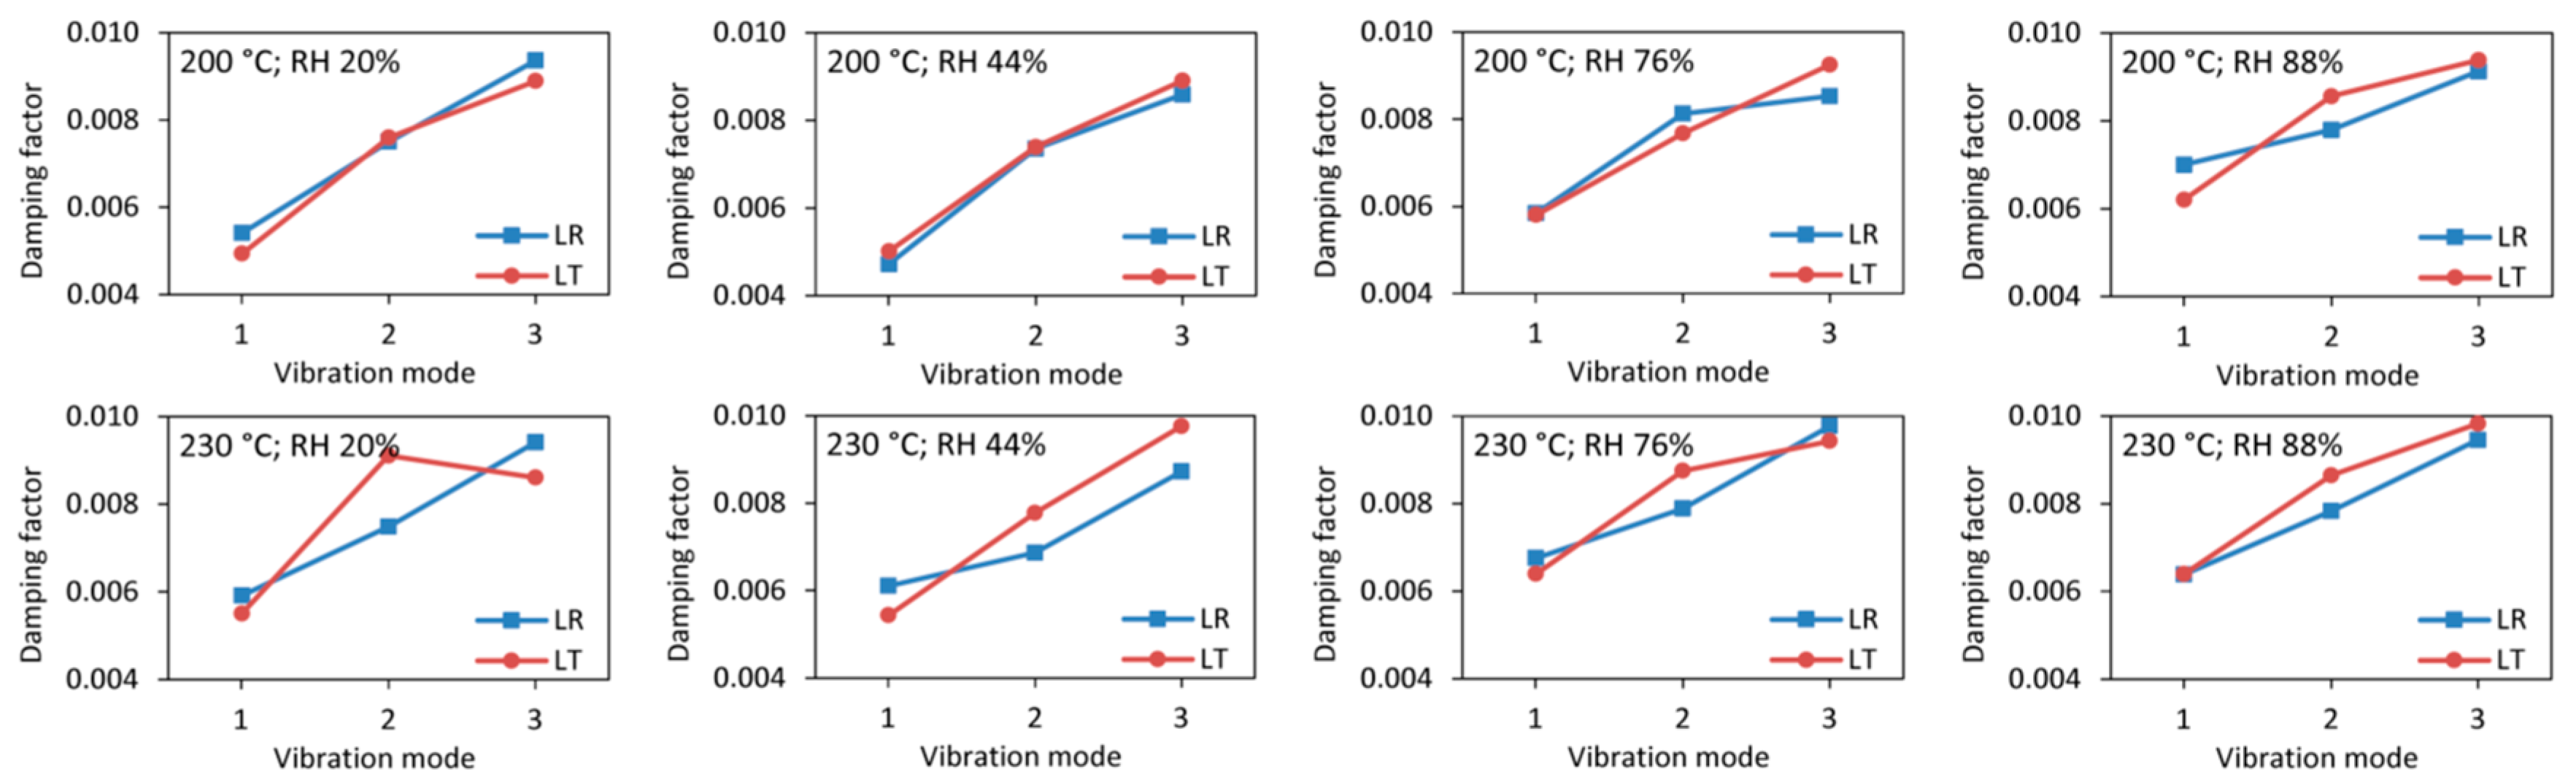
3.1. Damping Values

Table 1 shows the equilibrium moisture content (EMC) of the samples exposed to different RHs and degrees of thermal modifications (TMs). The EMC of the wood increases with an increasing RH at all modification levels. The EMC is highest for unmodified samples, while the EMC of wood decreases with an increasing degree of TM at the same RH, which is consistent with the literature [27,52]. The lower hygroscopicity of modified wood is due to the reduction in free hydroxyl groups caused by the decomposition of hemicellulose, which begins to decompose at 120 °C, with decomposition accelerating at temperatures above 180 °C [22,53,54].
The mean values of the damping factors and the coefficient of variation (COV), together with frequencies for each group, are shown in Table 2; the ANOVA analysis of the significance of each factor is shown in Table 3; while Table 4 contains the Duncan post hoc analysis showing the significant differences between the groups tested, where the values for different combinations of factors with the same letter do not differ significantly from each other.
Both the damping factor and the vibration frequencies vary under different conditions. The damping factor generally increases with RH and the degree of thermal modification, while the vibration frequencies decrease with an increasing RH for a given vibration mode.
The results of the statistical analysis (Table 3) show that all factors except vibration direction have a significant main effect on damping, while the interaction between the vibration direction plane and vibration mode also has a significant effect. Although a p-value of the direction plane alone of 0.189 shows that direction does not have significant main effect, it can be said that there is a significant difference between the vibration direction planes by the interaction term with vibration mode where the p-value is less than 0.05.
The influence of the individual factors is shown in Figure 3, Figure 4 and Figure 5. Since the vibration frequencies for a particular vibration mode are not constant for different RHs but vary, the following diagrams show the result for a particular vibration mode instead of the vibration frequency. The values are also given as a function of the RH and not of the EMC. For example, unmodified spruce wood at 44% RH has the same EMC of 9.9% as thermally modified spruce wood at 230 °C (level D), where the EMC is 10.5%. It would therefore be unrealistic to plot damping against EMC, as the EMCs determined would be at completely different RH values.
Figure 3 shows the damping factor at different RHs for all vibration modes and the degree of thermal modification. Damping generally increases with an increasing RH, initially decreasing slightly as the RH increases from 20% to 44% and then increasing at other RHs. The initial decrease is most pronounced for unmodified samples in all vibration modes and in the second vibration mode for both unmodified and modified samples. For the first vibration mode, damping is higher in the LR vibration direction plane for all samples, while for higher vibration modes, in general, damping in the LT vibration direction plane is higher than in the LR plane.
A similar trend has been found by other researchers [2,4,5,55], where damping initially decreased with an increasing RH and then increased with an increasing RH. Buchelt, Krüger, and Wagenführ [27] state in their study that the damping of modified spruce wood at a relative humidity below 50% is higher than that of unmodified spruce wood, while at a relative humidity above 50%, it is the other way round, i.e., the damping of modified spruce wood is lower than that of unmodified spruce wood, but the authors do not specify the direction of vibration nor the frequency of vibration.
In this study, a similar trend was observed for the third vibration mode (Figure 3c), with natural frequencies around 8800 Hz, where the damping of unmodified wood was lower than that of modified wood at the lowest RH. With an increasing RH, the damping of the unmodified samples increases faster than that of the modified samples. At the highest RH, the damping values are almost the same and do not differ significantly, as can also be seen in Table 4. The situation is somewhat different for the first and second vibration modes (Figure 3a,b). Here, the damping of the unmodified samples is generally lower than that of the modified samples for all RHs, although there are no significant differences for the most part, as the Duncan analysis in Table 4 shows. Although Figure 3 shows trends and differences between the damping values at different levels of thermal modification for each vibration mode, Table 4 shows that in most cases, there are no significant differences between them. This can be attributed to the large coefficient of variation, which is between 10% and 25% in most cases. Significant differences are therefore mainly found between damping at the lowest and highest RHs and between the individual vibration modes.
The differences between the modification rates are better illustrated in Figure 4. Here, it can be seen that the modification rate has the least effect on lowest frequencies from the first vibration mode for all RHs, with no significant difference between the values, although there is a slight upward trend. At RHs of 20% and 44%, the modification has a greater effect on the damping of the second and third vibration modes, while at higher RHs of 76% and 88%, the effect of the modification is again negligible, and there are no significant differences between the damping factors (Table 4).
The previous graphs show a difference between damping in radial and tangential directions, but the ANOVA shows (Table 4) that the vibration direction, as a main effect, has no significant influence on the amount of damping, with a p-value of 0.189. On the other hand, the vibration direction has a significant effect in correlation with the vibration mode, with a p-value of 0.000. The latter can be seen in Figure 5, which shows damping as a function of the vibration mode for individual vibration directions at different RHs and modification rates. Damping is the lowest for frequencies from the first vibration mode and then increases as the vibration mode and frequency increases. Similar results were obtained by Nop and Tippner [56], as well as by others researchers [7,9] who report that damping is lowest at low vibration frequencies and then increases with the vibration frequency, where the increase in damping is due to shear deformations at higher vibration modes, which is even more pronounced at lower length-to-height ratios.
In all cases, the damping for the lowest frequency from the first vibration mode in the LR vibration direction plane is higher than or equal to the damping in the LT plane. For the second vibration mode, the damping in the LR plane is lower than the damping in the LT plane for unmodified samples (A group) for all RHs, with the difference being greatest at lower RHs and decreasing at higher RHs. However, as the degree of modification increases, the differences between the damping in the LR and LT vibration direction planes decrease, with the differences being smallest at modification level C. Here, the damping in the LR and LT vibration plane is practically the same for all RHs, and the statistical analysis revealed no significant differences. The reason for the different degrees of damping in the LR and LT vibration planes is most likely due to the different relative proportions of earlywood and latewood, as earlywood could have different damping than latewood, which changes differently for earlywood and latewood during thermal modification. It can therefore be concluded that it is best to use thermal modification C of the wood if the same damping is required in both vibration direction planes.

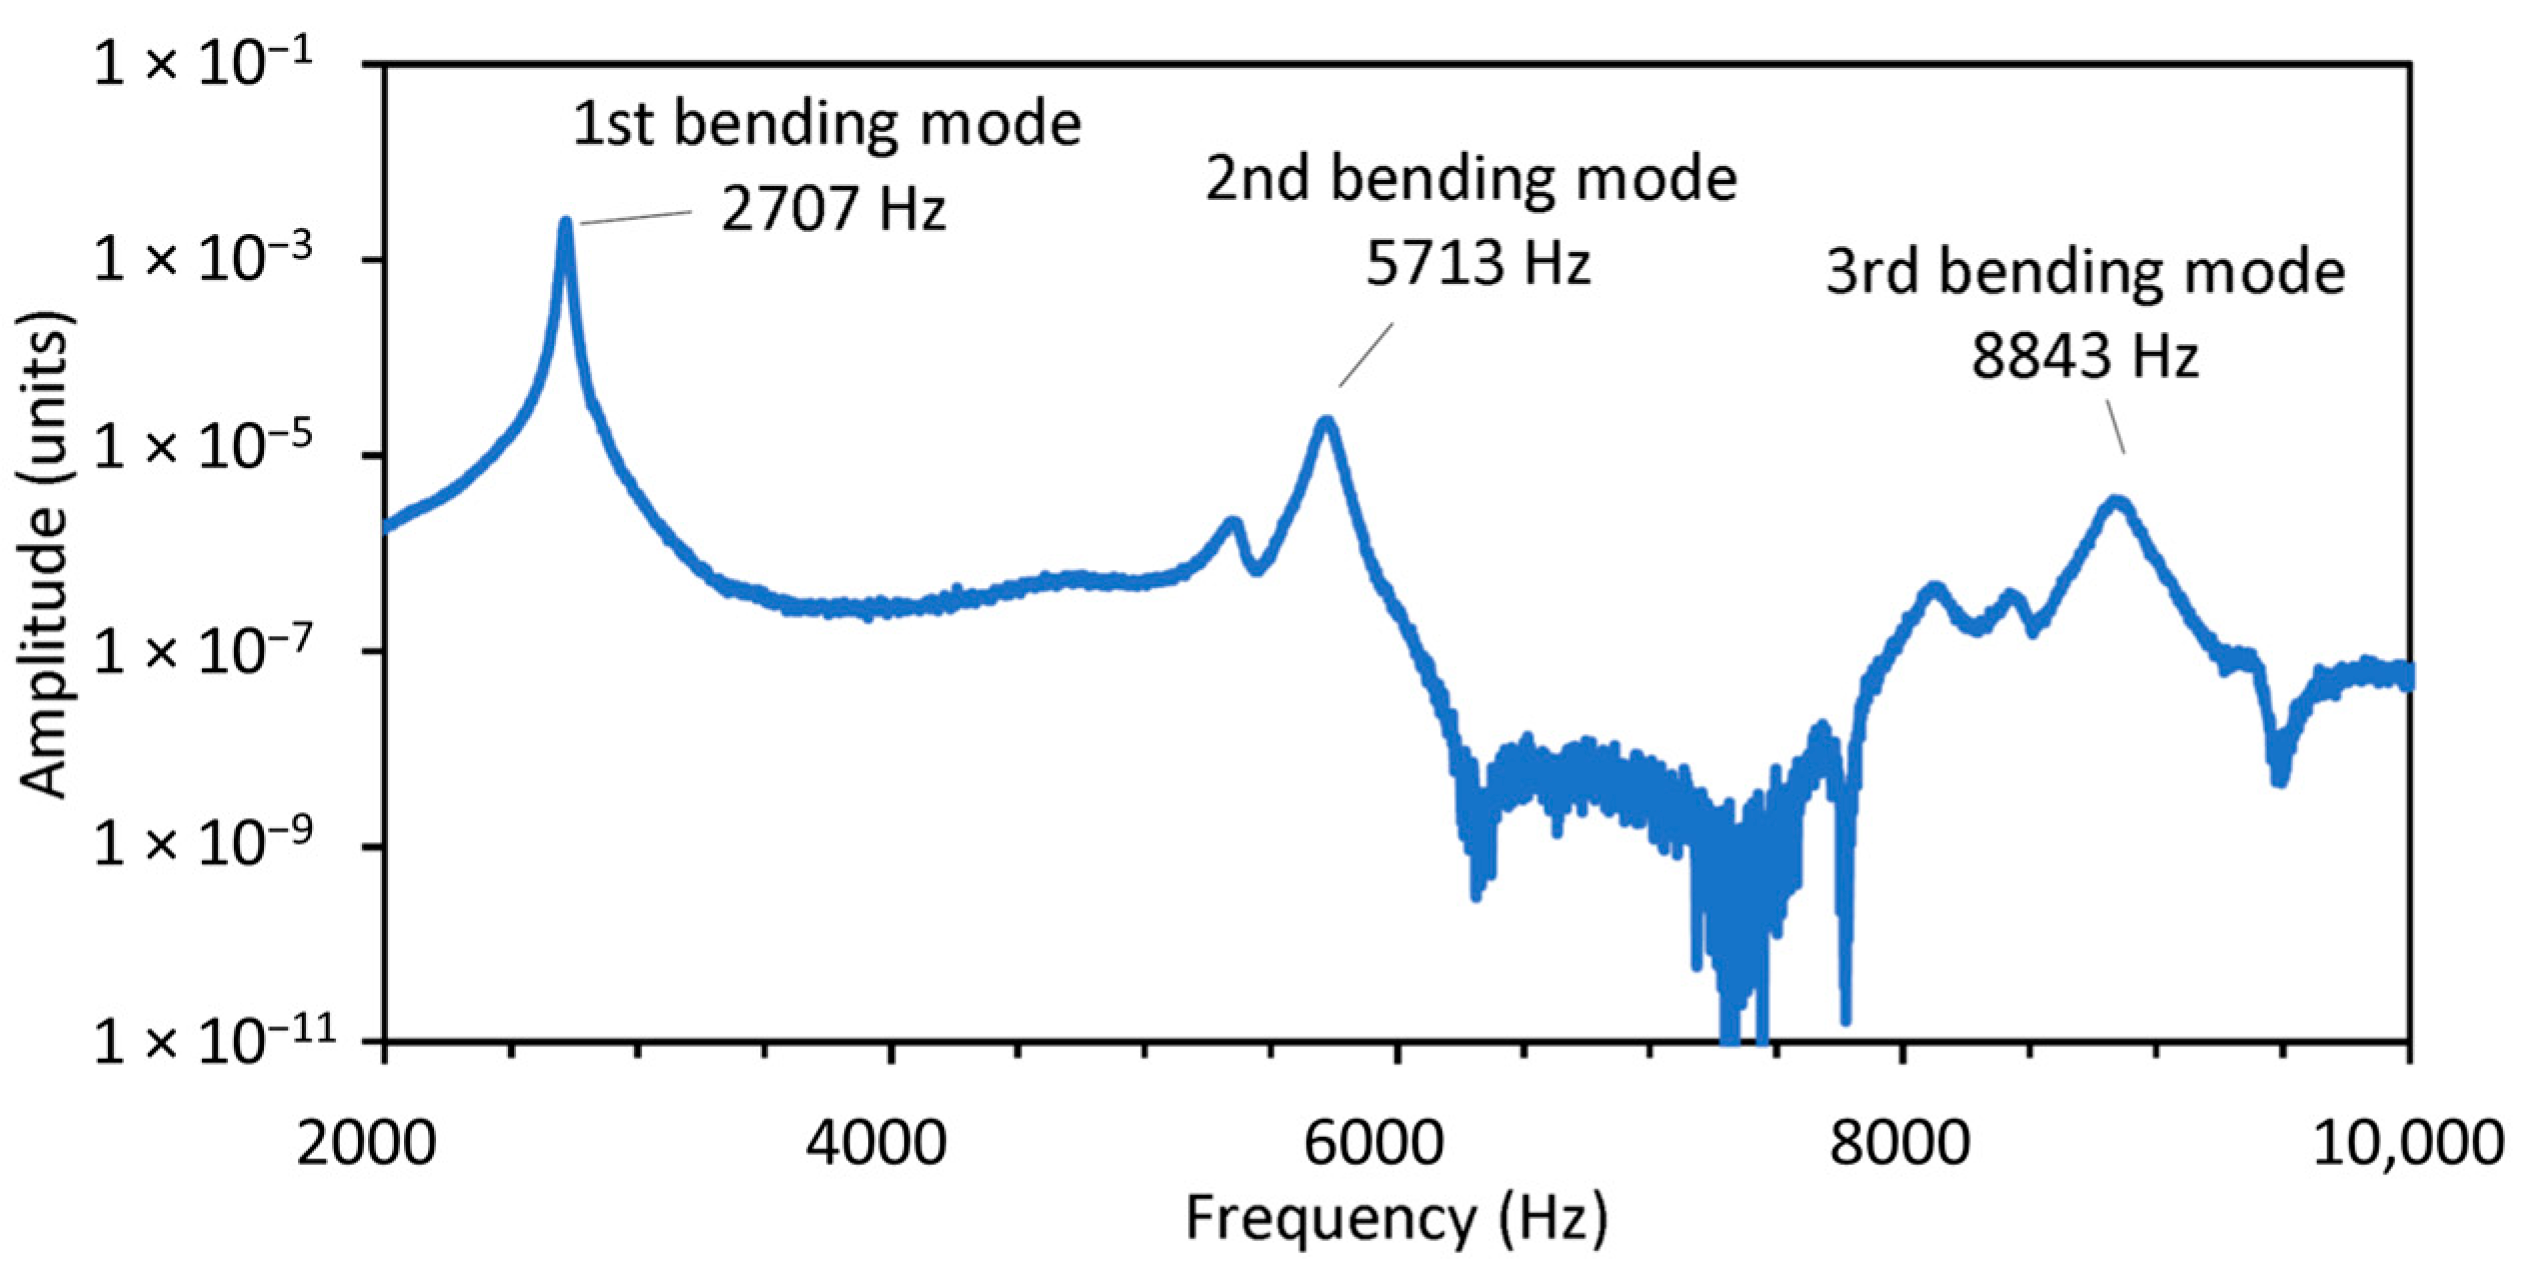
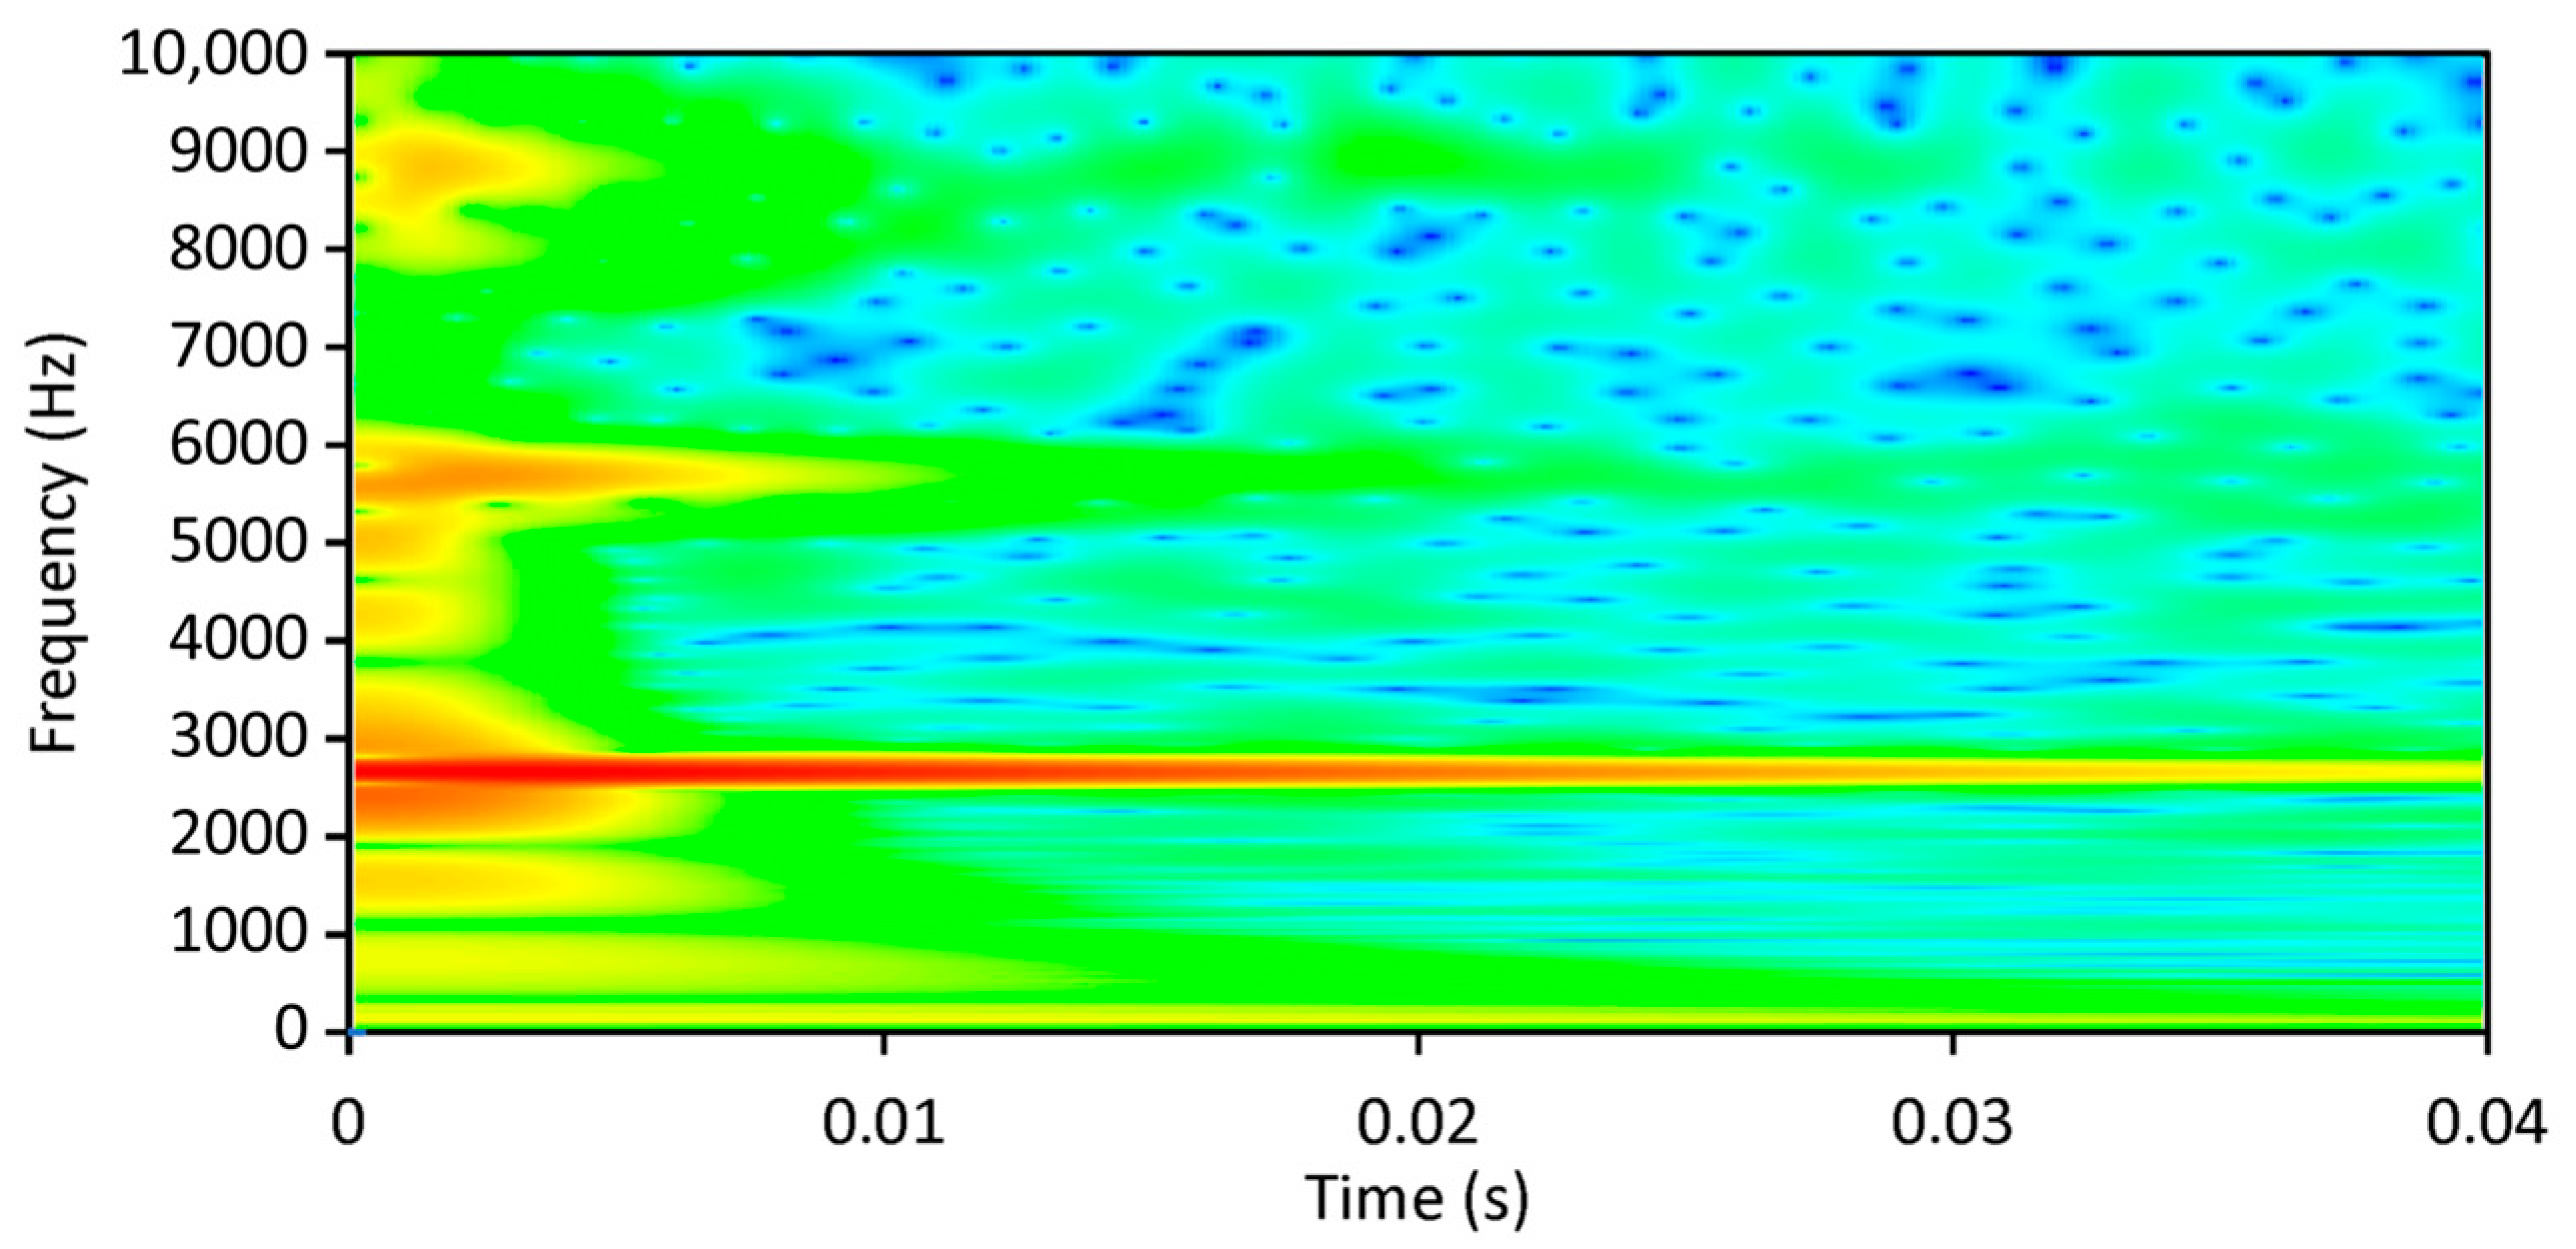
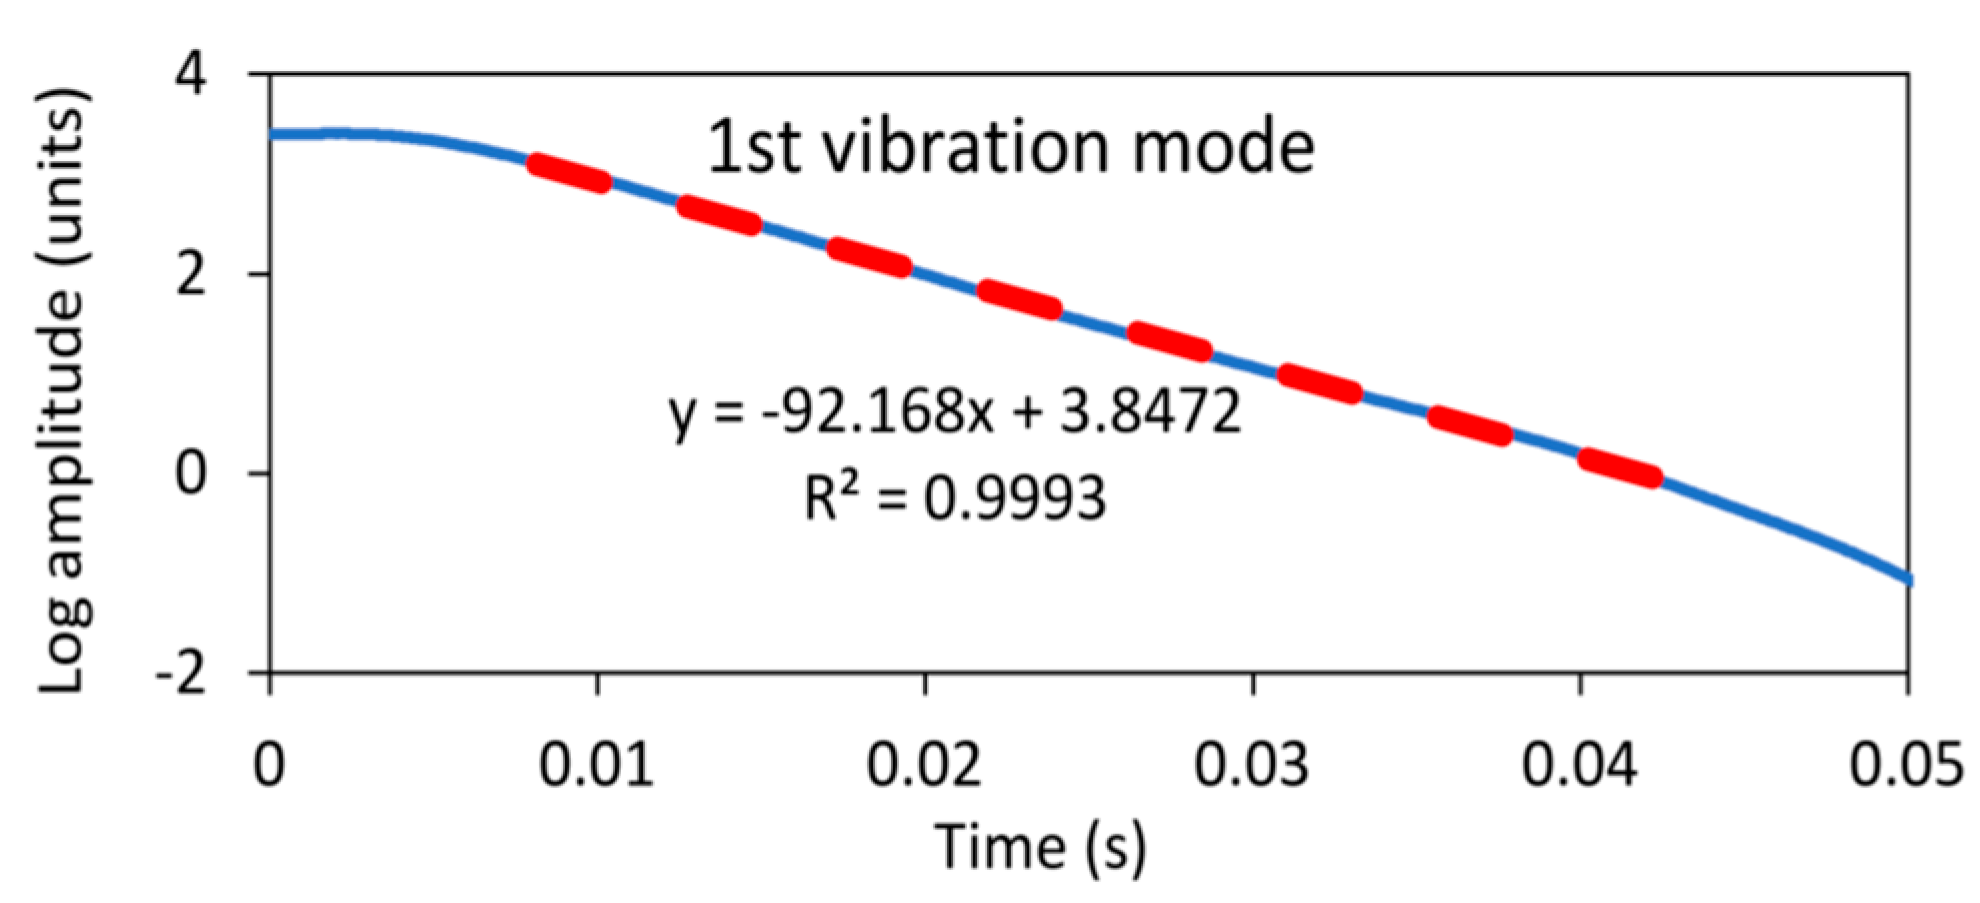
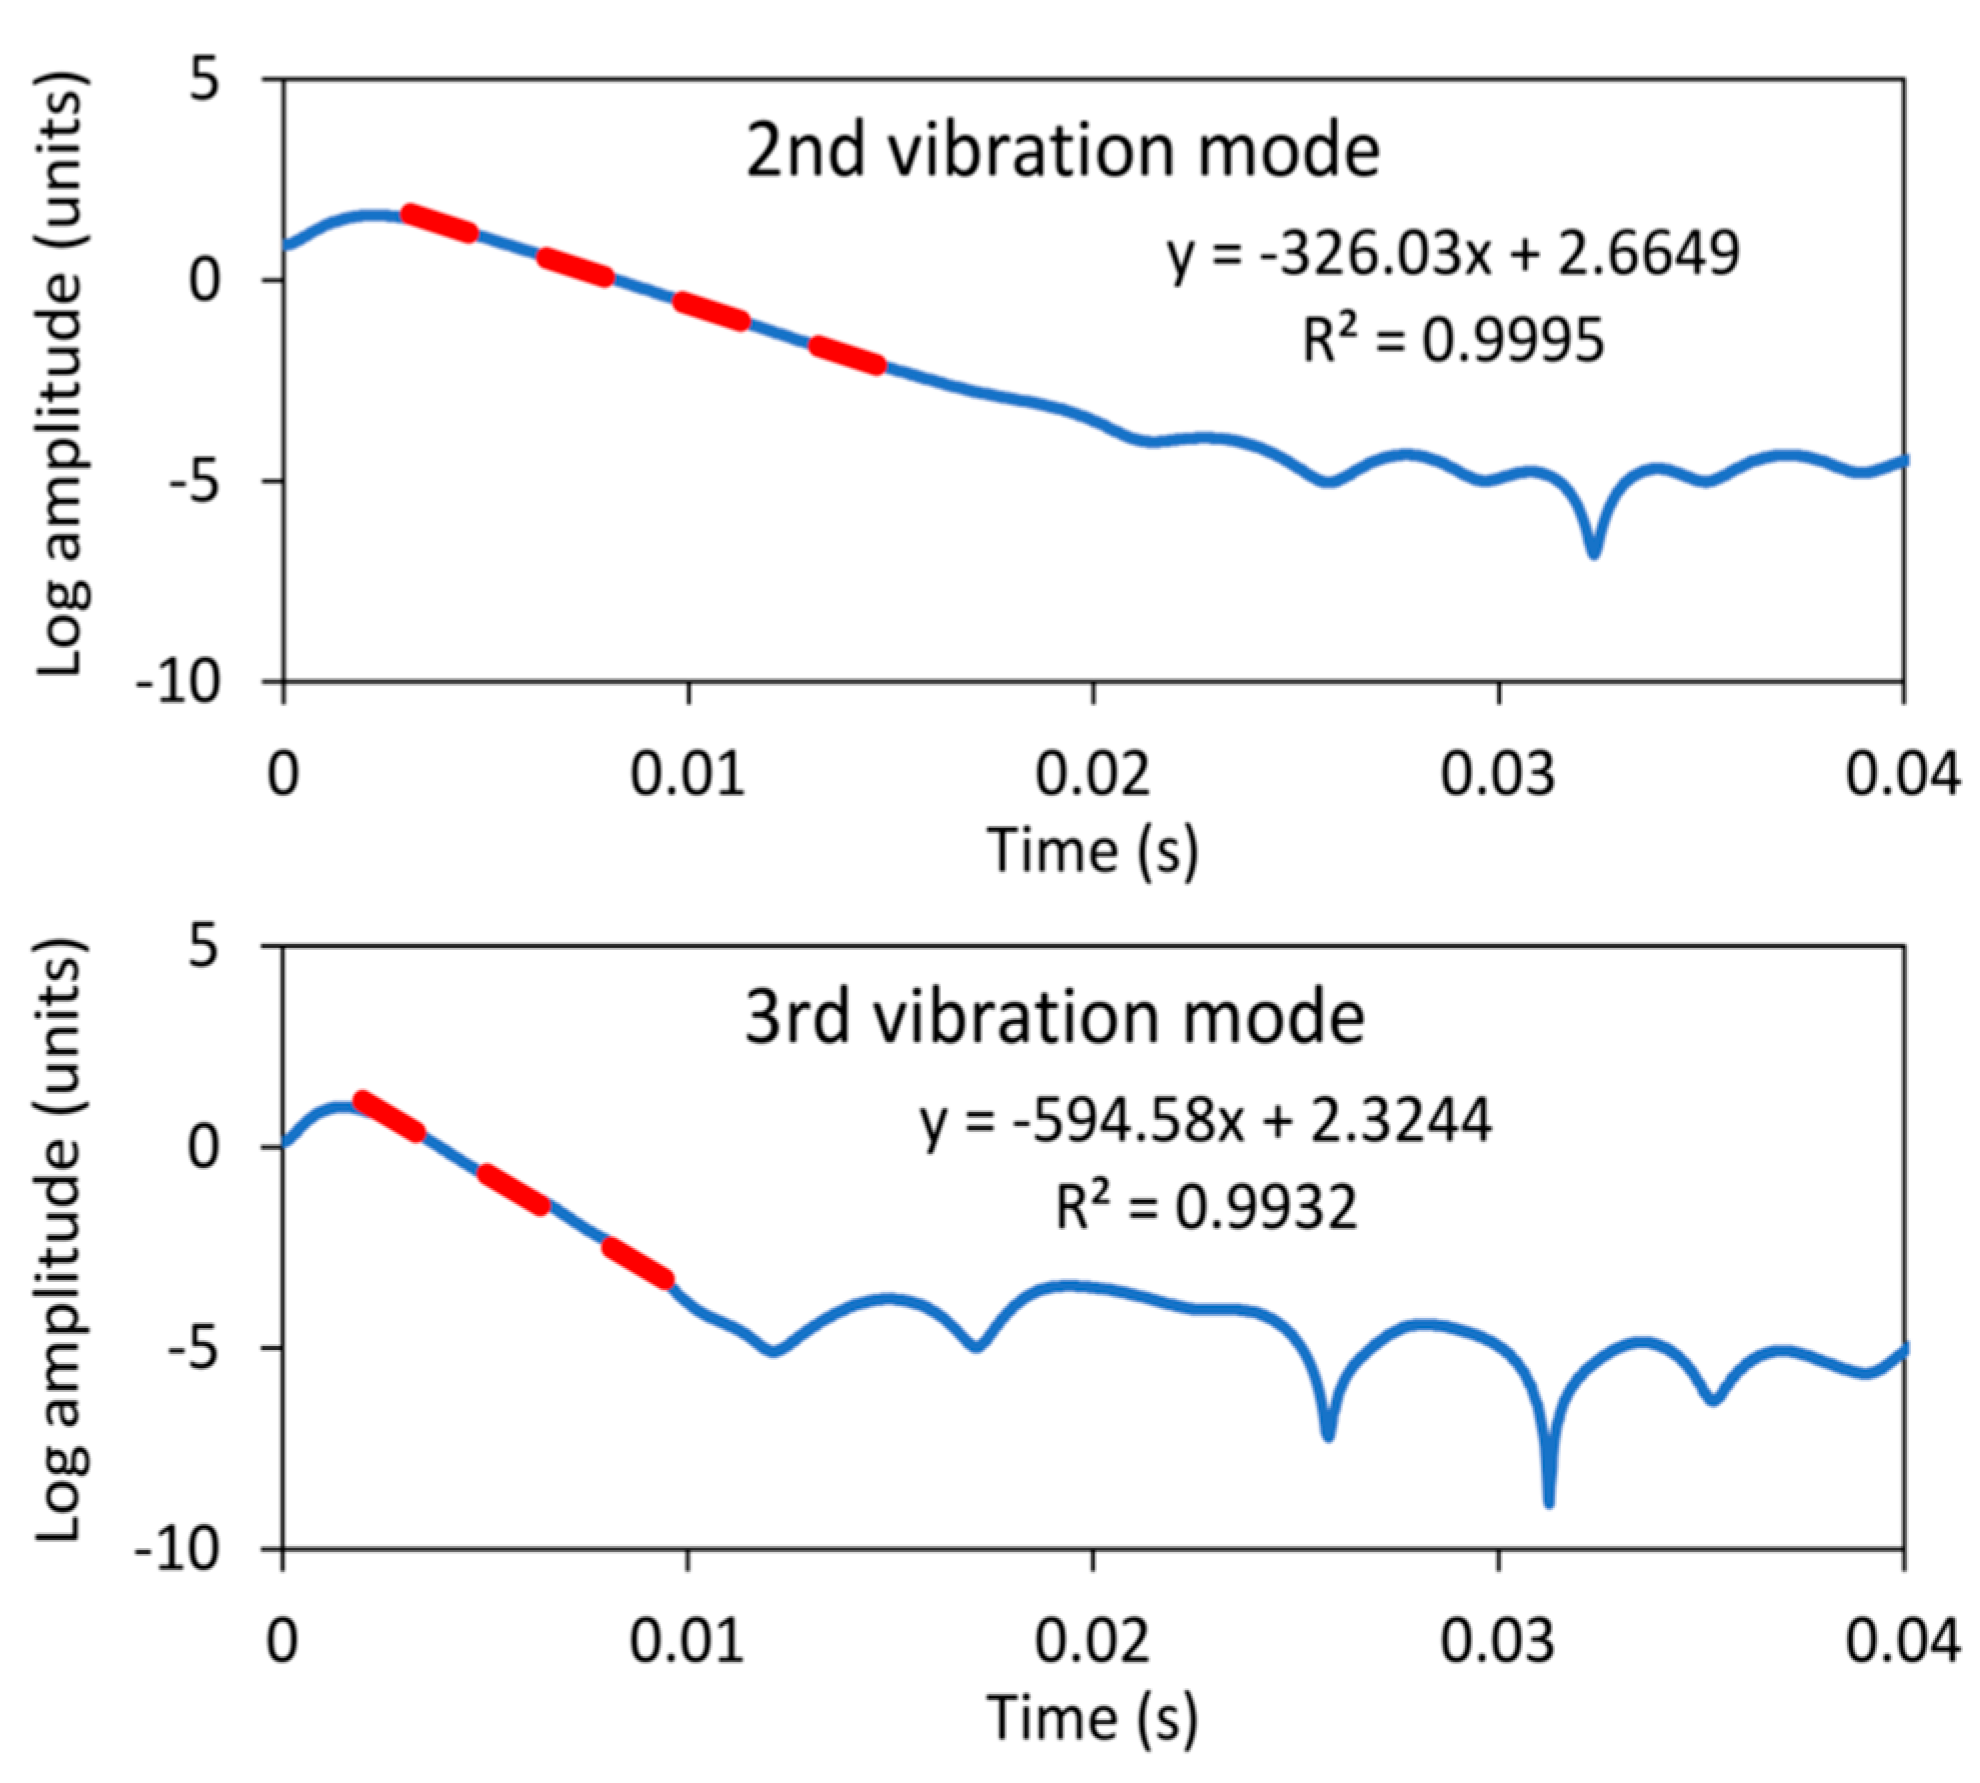
3.2. WT Damping Identification Process

The measurement of a sample with thermal modification B, conditioned at 44% RH and vibrating in the LT plane, is shown in Figure 6, Figure 7, Figure 8 and Figure 9. Figure 6 shows the time record of the sample, while Figure 7 shows the frequency spectrum from which the natural frequencies of the first three bending vibration modes, which are 2707, 5713, and 8843 Hz, can be seen. Other frequencies with smaller amplitudes are also present in the frequency spectrum, but these most likely belong to torsional vibrations, such as the peak, with a frequency of 5330 Hz.
The WT scalogram, which also shows the vibration amplitudes, is shown in Figure 8. This scalogram shows the amplitudes of the vibrations for the first three bending modes particularly well, whereby the first bending mode at 2707 Hz has the largest vibration amplitude, which also vibrates the longest. The vibration for the second mode at the frequency of 5713 Hz has a significantly smaller vibration amplitude, and the vibration time is also significantly shorter, as the vibration of the second mode stops at around 0.015 s. The third bending vibration mode at the frequency of 8843 Hz has an even smaller vibration amplitude and time, which decays after only 0.01 s. In addition to these three main frequencies, which represent the bending vibration, the scalogram also shows other frequencies, like 5330 Hz, which have even smaller amplitudes and vibration times and most likely belong to torsional vibrations of the sample.
When determining damping by logarithmic decrement, it would be very difficult to determine the damping of the second or the third vibration mode, which vibrates at a frequency of 5713 Hz and 8843 Hz, respectively, as the vibration amplitude at this frequency is added to the fundamental vibration amplitude with a natural frequency of 2707 Hz. The damping values would also not be accurate if they were determined using the 3 dB method, as there is coupling in the vibration mode with a frequency of 5330 Hz. In addition, to use this method, the frequency response function would first have to be calculated, which also means that the excitation, and not just the response of the vibration, must be measured. When using the WT method, however, the damping determined is exact, as the WT method eliminates all the shortcomings described above that occur when using the logarithmic decrement or the 3 dB method.
The amplitudes of the vibrations for the first three bending vibrations in a logarithmic scale are shown in Figure 9, together with the fit of the linear part from which damping was determined by the WT method, according to Equation (15).

4. Conclusions

This study examined the main influence as well as interactions of various factors on the damping of spruce wood, whereby the influence of RH, the degree of thermal modification, the vibration mode, and the vibration direction planes were investigated in detail.
The results confirm that damping generally increases with RH, although there are some deviations from this trend in the mean values of RH. Similarly, damping generally increases with the degree of thermal modification, but the trend of increase varies with different values of RH, vibration modes, or frequency and vibration direction plane.
In addition to confirming the known relationships, it was also found that the damping tendency is different for different vibration frequencies and also for different directions of vibrating planes. For example, damping increases with an increasing vibration frequency, and the rate of increase is different for vibrations in the LR and LT vibration direction planes. When determining damping, it is therefore always necessary to specify the vibration frequency and vibration direction plane, as the results of this analysis have shown that damping is a complex phenomenon with different interactions between the tested factors.
The latter is particularly important, for example, in the manufacturing of musical instruments made of wood, where the direction of the wood is very important. Likewise, musical instruments made of wood come in different sizes, and the frequency range of the instruments is strongly related to this. For example, the same piece of wood can behave very differently in a smaller wooden musical instrument than in a larger instrument, as its damping factor depends on the frequency range.
In this study, the wavelet transform method was used to determine damping. This method has proven to be reliable and accurate, as its application enables precise determination of damping, since this method allows for a decoupling of vibration modes, especially for highly damped vibrations where neighbouring vibration modes are strongly coupled. The results obtained in this way represent reliable values for the damping factor. This method is also suitable for determining the damping of torsional vibrations of both the fundamental and higher vibration modes.
The new finding that the damping factor varies with the plane of vibration direction shows that it is always necessary to specify the vibration direction in a study, especially when determining various acoustic factors, such as the acoustic conversion efficiency [3,5,26,56,57,58], as these factors can vary considerably for different vibration directions as well as for different frequency ranges.

Author Contributions

Conceptualization, M.M. and R.M.P.; methodology, M.M.; validation, R.M.P.; formal analysis, M.M.; investigation, M.M.; resources, M.M.; writing—original draft preparation, M.M.; writing—review and editing, R.M.P.; visualization, M.M.; supervision, R.M.P. All authors have read and agreed to the published version of the manuscript.

Funding

This research was supported by the P2-0182 Programs, co-financed by the Slovenian Research Agency.

Data Availability Statement

No new data were created.

Conflicts of Interest

The authors declare no conflicts of interest.

References

  1. Zhang, L.; Tiemann, A.; Zhang, T.; Gauthier, T.; Hsu, K.; Mahamid, M.; Moniruzzaman, P.K.; Ozevin, D. Nondestructive assessment of cross-laminated timber using non-contact transverse vibration and ultrasonic testing. Eur. J. Wood Wood Prod. 2021, 79, 335–347. [Google Scholar] [CrossRef]
  2. Brémaud, I. Acoustical properties of wood in string instruments soundboards and tuned idiophones: Biological and cultural diversity. J. Acoust. Soc. Am. 2012, 131, 807–818. [Google Scholar] [CrossRef] [PubMed]
  3. Brémaud, I.; El Kaïm, Y.; Guibal, D.; Minato, K.; Thibaut, B.; Gril, J. Characterisation and categorisation of the diversity in viscoelastic vibrational properties between 98 wood types. Ann. For. Sci. 2012, 69, 373–386. [Google Scholar] [CrossRef]
  4. Brémaud, I.; Gril, J. Moisture content dependence of anisotropic vibrational properties of wood at quasi equilibrium: Analytical review and multi-trajectories experiments. Holzforschung 2021, 75, 313–327. [Google Scholar] [CrossRef]
  5. Ahmed, S.A.; Adamopoulos, S. Acoustic properties of modified wood under different humid conditions and their relevance for musical instruments. Appl. Acoust. 2018, 140, 92–99. [Google Scholar] [CrossRef]
  6. Obataya, E.; Norimoto, M.; Gril, J. The effects of adsorbed water on dynamic mechanical properties of wood. Polymer 1998, 39, 3059–3064. [Google Scholar] [CrossRef]
  7. Yano, H.; Minato, K. Improvement of the acoustic and hygroscopic properties of wood by a chemical treatment and application to the violin parts. J. Acoust. Soc. Am. 1992, 92, 1222–1227. [Google Scholar] [CrossRef]
  8. Ono, T.; Norimoto, M. Study on young’s modulus and internal friction of wood in relation to the evaluation of wood for musical instruments. Jpn. J. Appl. Phys. 1983, 22, 611–614. [Google Scholar] [CrossRef]
  9. Kollmann, F.; Krech, H. Dynamic measurement of damping capacity and elastic properties of wood. Eur. J. Wood Wood Prod. 1960, 18, 41–54. [Google Scholar] [CrossRef]
  10. Wegst, U.G.K. Wood for sound. Am. J. Bot. 2006, 93, 1439–1448. [Google Scholar] [CrossRef]
  11. Merhar, M.; Humar, M. The influence of wood modification on transfer function of a violin bridge. Drv. Ind. 2020, 71, 163–169. [Google Scholar] [CrossRef]
  12. Sproßmann, R.; Zauer, M.; Wagenführ, A. Characterization of acoustic and mechanical properties of common tropical woods used in classical guitars. Results Phys. 2017, 7, 1737–1742. [Google Scholar] [CrossRef]
  13. Gurău, L.; Timar, M.C.; Coșereanu, C.; Cosnita, M.; Stanciu, M.D. Aging of Wood for Musical Instruments: Analysis of Changes in Color, Surface Morphology, Chemical, and Physical-Acoustical Properties during UV and Thermal Exposure. Polymers 2023, 15, 1794. [Google Scholar] [CrossRef] [PubMed]
  14. Thomson, W.T.; Dahleh, M.D. Theory of Vibration with Applications, 5th ed.; Prentice Hall: New York, NY, USA, 1998; p. 524. [Google Scholar]
  15. Bekhta, P.; Niemz, P. Effect of high temperature on the change in color, dimensional stability and mechanical properties of spruce wood. Holzforschung 2003, 57, 539–546. [Google Scholar] [CrossRef]
  16. Tjeerdsma, B.F.; Boonstra, M.; Pizzi, A.; Tekely, P.; Militz, H. Characterisation of thermally modified wood: Molecular reasons for wood performance improvement. Eur. J. Wood Wood Prod. 1998, 56, 149–153. [Google Scholar] [CrossRef]
  17. Andor, T.; Lagaňa, R. Selected properties of thermally treated ash wood. Acta Fac. Xylologiae 2018, 60, 51–60. [Google Scholar] [CrossRef]
  18. Kurul, F.; Görgün, H.V. Effect of Thermal Modification on Some Physical and Mechanical Properties of Yellow Poplar (Liriodendron tulipifera). Drewno 2022, 65, 1–11. [Google Scholar] [CrossRef]
  19. Molinski, W.; Roszyk, E.; Jablonski, A.; Puszynski, J.; Cegiela, J. Mechanical parameters of thermally modified ash wood determined on compression in tangential direction. Maderas Cienc. Tecnol. 2018, 20, 267–276. [Google Scholar] [CrossRef]
  20. Nhacila, F.; Sitoe, E.; Uetimane, E.; Manhica, A.; Egas, A.; Möttönen, V. Effects of thermal modification on physical and mechanical properties of Mozambican Brachystegia spiciformis and Julbernardia globiflora wood. Eur. J. Wood Wood Prod. 2020, 78, 871–878. [Google Scholar] [CrossRef]
  21. Roszyk, E.; Stachowska, E.; Majka, J.; Mania, P.; Broda, M. Moisture-dependent strength properties of thermally-modified Fraxinus excelsior wood in compression. Materials 2020, 13, 1647. [Google Scholar] [CrossRef]
  22. Wang, X.; Chen, X.; Xie, X.; Wu, Y.; Zhao, L.; Li, Y.; Wang, S. Effects of thermal modification on the physical, chemical and micromechanical properties of Masson pine wood (Pinus massoniana Lamb.). Holzforschung 2018, 72, 1063–1070. [Google Scholar] [CrossRef]
  23. Merhar, M.; Pitti, R.M.; Argensse, T. Mode I fracture properties of thermally-modified spruce wood (Picea abies) at different moisture contents. Wood Mat. Sci. Eng. 2023, 18, 2093–2103. [Google Scholar] [CrossRef]
  24. Zauer, M.; Kowalewski, A.; Sproßmann, R.; Stonjek, H.; Wagenführ, A. Thermal modification of European beech at relatively mild temperatures for the use in electric bass guitars. Eur. J. Wood Wood Prod. 2016, 74, 43–48. [Google Scholar] [CrossRef]
  25. Mania, P.; Skrodzka, E. Modal parameters of resonant spruce wood (Picea abies L.) after thermal treatment. J. King Saud. Univ. Sci. 2020, 32, 1152–1156. [Google Scholar] [CrossRef]
  26. Danihelová, A.; Vidholdová, Z.; Gergeľ, T.; Spišiaková Kružlicová, L.; Pástor, M. Thermal Modification of Spruce and Maple Wood for Special Wood Products. Polymers 2022, 14, 2813. [Google Scholar] [CrossRef]
  27. Buchelt, B.; Krüger, R.; Wagenführ, A. The vibrational properties of native and thermally modified wood in dependence on its moisture content. Eur. J. Wood Wood Prod. 2023, 81, 947–956. [Google Scholar] [CrossRef]
  28. Thybring, E.E.; Fredriksson, M. Wood modification as a tool to understand moisture in wood. Forests 2021, 12, 372. [Google Scholar] [CrossRef]
  29. Stanciu, M.D.; Sova, D.; Savin, A.; Ilias, N.; Gorbacheva, G.A. Physical and mechanical properties of ammonia-treated black locust wood. Polymers 2020, 12, 377. [Google Scholar] [CrossRef] [PubMed]
  30. Tian, F.; Xu, X. Dynamical mechanical behaviors of rubber-filled wood fiber composites with urea formaldehyde resin. J. Bioresour. Bioprod. 2022, 7, 320–327. [Google Scholar] [CrossRef]
  31. Mihalcica, M.; Stanciu, M.D.; Teodorescu, H.D.; Iftimie, N. Evaluation of viscous-elastic properties of resonance maple wood. Int. J. Mod. Manuf. Technol. 2022, 14, 145–150. [Google Scholar] [CrossRef]
  32. Jiang, X.; Wang, J.; Wang, Z.; Hua, F.; He, S.; Lu, B.; Wang, X.; Zhang, X.; Leng, W. Microstructural and Thermo-Mechanical Characterization of Furfurylated Douglas Fir. Polymers 2022, 14, 4641. [Google Scholar] [CrossRef]
  33. Lunguleasa, A.; Spirchez, C. Influence of Thermal Treatment on Properties of Ash Wood. Forests 2025, 16, 155. [Google Scholar] [CrossRef]
  34. Dong, H.; Hasanagić, R.; Fathi, L.; Bahmani, M.; Kržišnik, D.; Keržič, E.; Humar, M. Selected Mechanical and Physical Properties of Thermally Modified Wood after Field Exposure Tests. Forests 2023, 14, 1006. [Google Scholar] [CrossRef]
  35. Piersol, A.; Paez, T. Harris’ Shock and Vibration Handbook, 6th ed.; McGraw Hill: New York, NY, USA, 2009. [Google Scholar]
  36. Staszewski, W.J. Identification of damping in MDOF systems using time-scale decomposition. J. Sound Vib. 1997, 203, 283–305. [Google Scholar] [CrossRef]
  37. Hamdi, S.E.; Sbartaï, Z.M.; Elachachi, S.M. Performance assessment of modal parameters identification methods for timber structures evaluation: Numerical modeling and case study. Wood Sci. Technol. 2021, 55, 1593–1618. [Google Scholar] [CrossRef]
  38. Ruzzene, M.; Fasana, A.; Garibaldi, L.; Piombo, B. Natural frequencies and dampings identification using wavelet transform: Application to real data. Mech. Syst. Signal Process. 1997, 11, 207–218. [Google Scholar] [CrossRef]
  39. Tomac, I.; Slavič, J. Morlet-wave-based modal identification in the time domain. Mech. Syst. Signal Process. 2023, 192, 110243. [Google Scholar] [CrossRef]
  40. Chandra, N.H.; Sekhar, A.S. Nonlinear damping identification in rotors using wavelet transform. Mech. Mach. Theory 2016, 100, 170–183. [Google Scholar] [CrossRef]
  41. Merhar, M. Identification of Damping of Spruce Wood (Picea abies) under Various Levels of Moisture Content Using Time-Scale Decomposition. Polymers 2024, 16, 1313. [Google Scholar] [CrossRef]
  42. Chen, S.L.; Liu, J.J.; Lai, H.C. Wavelet analysis for identification of damping ratios and natural frequencies. J. Sound Vib. 2009, 323, 130–147. [Google Scholar] [CrossRef]
  43. Wang, S.; Zhao, W.; Zhang, G.; Xu, H.; Du, Y. Identification of structural parameters from free vibration data using Gabor wavelet transform. Mech. Syst. Signal Process. 2021, 147, 107122. [Google Scholar] [CrossRef]
  44. Ashory, M.R.; Khatibi, M.M.; Jafari, M.; Malekjafarian, A. Determination of mode shapes using wavelet transform of free vibration data. Arch. Appl. Mech. 2013, 83, 907–921. [Google Scholar] [CrossRef]
  45. Slavič, J.; Simonovski, I.; Boltežar, M. Damping identification using a continuous wavelet transform: Application to real data. J. Sound Vib. 2003, 262, 291–307. [Google Scholar] [CrossRef]
  46. Li, M.; Wang, M.; Ding, R.; Deng, T.; Fang, S.; Lai, F.; Luoi, R. Study of acoustic emission propagation characteristics and energy attenuation of surface transverse wave and internal longitudinal wave of wood. Wood Sci. Technol. 2021, 55, 1619–1637. [Google Scholar] [CrossRef]
  47. Rep, G.; Pohleven, F.; Kosmerl, S. Development of the industrial kiln for thermal wood modification by a procedure with an initial vacuum and commercialisation of modified Silvapro wood. In Proceedings of the 6th European Conference on Wood Modification, Ljubljana, Slovenia, 16–18 September 2012; pp. 11–17. [Google Scholar]
  48. Chui, C.K. An Introduction to Wavelets, 1st ed.; Academic Press: Cambridge, MA, USA, 1992. [Google Scholar]
  49. Torrence, C.; Compo, G.P. A Practical Guide to Wavelet Analysis. Bull. Am. Meteorol. Soc. 1998, 79, 61–78. [Google Scholar] [CrossRef]
  50. Daubechies, I. The Wavelet Transform, Time-Frequency Localization and Signal Analysis. IEEE Trans. Inf. Theory 1990, 36, 961–1005. [Google Scholar] [CrossRef]
  51. Tchamitchian, P.; Torresani, B. Ridge and skeleton extraction from the wavelet transform. In Proceedings of the CBMS-NSF Conference ‘Wavelets and Their Applications’, Lowell, MA, USA, 5–9 November 1990. [Google Scholar]
  52. Arnold, M. Effect of moisture on the bending properties of thermally modified beech and spruce. J. Mater. Sci. 2010, 45, 669–680. [Google Scholar] [CrossRef]
  53. Özgenç, Ö.; Durmaz, S.; Boyaci, I.H.; Eksi-Kocak, H. Determination of chemical changes in heat-treated wood using ATR-FTIR and FT Raman spectrometry. Spectrochim. Acta Part A Mol. Biomol. Spectrosc. 2017, 171, 395–400. [Google Scholar] [CrossRef] [PubMed]
  54. Hosseinaei, O.; Wang, S.; Enayati, A.A.; Rials, T.G. Effects of hemicellulose extraction on properties of wood flour and wood-plastic composites. Compos. Part A 2012, 43, 686–694. [Google Scholar] [CrossRef]
  55. Obataya, E. Effects of natural and artificial ageing on the physical and acoustic properties of wood in musical instruments. J. Cult. Heritage 2017, 27, S63–S69. [Google Scholar] [CrossRef]
  56. Nop, P.; Tippner, J. Influence of dimensions of wooden samples for determination of acoustic parameters and sound timbre. Appl. Acoust. 2022, 196, 108895. [Google Scholar] [CrossRef]
  57. Longo, R.; Laux, D.; Pagano, S.; Delaunay, T.; Le Clézio, E.; Arnould, O. Elastic characterization of wood by Resonant Ultrasound Spectroscopy (RUS): A comprehensive study. Wood Sci. Technol. 2018, 52, 383–402. [Google Scholar] [CrossRef]
  58. Liu, M.; Lyu, S.; Cai, L.; Lei, Y.; Peng, L.; Yan, L.; Lyu, J. Acoustic and viscoelastic properties of string instrument fretboards made of radiata pine by densification and impregnation with furfuryl alcohol resin. Eur. J. Wood Wood Prod. 2024, 82, 285–297. [Google Scholar] [CrossRef]
Figure 1. Specimen preparation. (a) Cutting from board; (b) specimen distribution across the board; (c) prepared specimens.
Forests 16 01055 g001aForests 16 01055 g001b
Figure 2. Experimental setup. (a) Excitation; (b) lateral specimen vibration in LR and LT vibration plane.
Forests 16 01055 g002
Figure 3. Damping factors of specimens exposed to different RHs, degrees of thermal modifications, vibration direction planes (LT and LR), and vibration modes. (a) First vibration mode; (b) second vibration mode; (c) third vibration mode.
Forests 16 01055 g003
Figure 4. The influence of thermal modification levels on the damping values for different vibration modes, directions, and RHs. First letter in legend represents vibration mode; the second letter represents vibration direction plane.
Forests 16 01055 g004
Figure 5. The influence of the vibration mode on the damping values for different vibration direction planes, RHs, and degrees of thermal modifications.
Forests 16 01055 g005aForests 16 01055 g005b
Figure 6. Time record of sample vibration (B modification, 40% RH, and tangential direction vibration).
Forests 16 01055 g006
Figure 7. Frequency spectrum of time record from Figure 6.
Forests 16 01055 g007
Figure 8. Wavelet transform for time record from Figure 6. The colour represents the relative amplitude of vibration.
Forests 16 01055 g008
Figure 9. A semi-logarithmic plot of the cross-section of the wavelet transform amplitude from Figure 8, together with the fit of the linear part (red dashed line) for a first, second, and third vibration mode vibrating at a frequency of 2707 Hz, 5713 Hz, and 8843 Hz, respectively.
Forests 16 01055 g009aForests 16 01055 g009b
Table 1. Equilibrium moisture contents (EMCs) at specific relative humidities (RHs) and degrees of thermal modifications (TMs).
TMRH
20%44%76%88%
A (untreated)7.29.913.319.1
B (modified 180 °C)5.06.610.716.2
C (modified 200 °C)4.05.78.811.8
D (modified 230 °C)3.85.78.510.5
Table 2. Average values and coefficient of variation (in brackets) of damping factors and frequencies at different relative humidities (RHs), vibration direction planes (LT—longitudinal tangential and LR—longitudinal radial), degree of thermal modifications (TMs, A—unmodified, B—modified 180 °C, C—modified 200 °C, and D—modified 230 °C), and vibration mode (VM).
TMVMLR Vibration PlaneLT Vibration Plane
RHRH
20%44%76%88%20%44%76%88%
A10.00570.00500.00630.00650.00480.00500.00560.0060
(20.6)(15.8)(19.1)(15.5)(18.4)(33.1)(13.2)(9.6)
27462673268626782746269826582530
(3)(4.2)(3.8)(2.4)(3.1)(3)(2.1)(2.9)
20.00640.00560.00780.00800.00760.00700.00800.0082
(8.2)(37.4)(6.8)(6.4)(19.5)(24.9)(12.9)(15.5)
58385770583355665908579356185361
(3.4)(3.6)(1.7)(1.7)(1.4)(1.6)(1)(1.2)
30.00700.00740.00880.00940.00810.00800.00960.0097
(12.2)(13.9)(15.8)(12)(7.8)(15.2)(5.6)(12.5)
90399041903884959275906086178291
(4)(3.1)(4.6)(1.3)(1.4)(1.2)(1.8)(0.7)
B10.00570.00580.00670.00670.00470.00520.00550.0059
(26)(29.3)(25.8)(32)(17.7)(19)(13.4)(13.6)
26932793264325262665279026802531
(6.4)(1)(2.2)(4.6)(5.4)(1.8)(2.6)(4.2)
20.00720.00680.00720.00800.00720.00600.00770.0090
(10.6)(9.5)(12.3)(9.2)(17.7)(19.6)(10.7)(13.8)
58536052587555675959598557605459
(3.9)(1.8)(1.1)(2)(2.8)(1.9)(1)(2.7)
30.00750.00850.00940.00880.00880.00860.00830.0096
(14)(9.5)(13.1)(17.7)(12.9)(12)(19.2)(8.9)
92589466924988489479932289798730
(6.3)(2.7)(4.2)(3.6)(6)(3.3)(2.2)(6.1)
C10.00540.00470.00580.00700.00490.00500.00580.0062
(19.8)(16.4)(16.2)(24.7)(9.3)(15.2)(22.8)(18.3)
27692782271625932813278327002600
(2.3)(1.7)(2.2)(3.3)(1.7)(2.3)(1.8)(2.1)
20.00750.00740.00810.00780.00760.00740.00770.0086
(9.7)(18.5)(11.1)(9.3)(12.8)(24.5)(9.8)(11.9)
61216076584356396077600058005563
(2.3)(1.4)(2.3)(2.2)(1)(2.3)(1)(1.7)
30.00940.00860.00850.00910.00890.00890.00920.0094
(15.3)(14.2)(13.9)(12.4)(13.7)(14.7)(9)(14)
95739536915488829499932090518757
(4)(3)(3.8)(4.3)(3)(2.9)(2.9)(3.4)
D10.00590.00610.00680.00640.00550.00540.00640.0064
(25.8)(24.4)(14.4)(20.1)(29.8)(16.2)(16.2)(23.5)
27642765268226352757275726882644
(3.5)(1.6)(2.5)(3.9)(3)(2.3)(3)(2)
20.00750.00690.00790.00780.00910.00780.00870.0086
(21.5)(20.6)(11.2)(10.9)(19)(10.8)(6)(18.3)
59965983590557335900593758805651
(4.2)(2.2)(2.7)(2)(4.5)(0.9)(1.2)(1.2)
30.00940.00870.00980.00950.00860.00980.00940.0098
(14.7)(10.3)(19.1)(15.3)(18.5)(18.1)(13.5)(13.2)
93029352943690448989925394128773
(6.3)(1.5)(3.9)(3.5)(7.3)(1.1)(4.2)(2.2)
Table 3. Results of ANOVA analysis of significant factors (TM—thermal modification; VD—vibration direction plane; VM—vibration mode; RH—relative humidity).
SourceType III Sum of SquaresdfMean SquareFSig.
Corrected Model0.002952.04 × 10−514.150.000
Intercept0.04810.04833672.450.000
TM5.91 × 10−531.97 × 10−513.690.000
VD2.49 × 10−612.49 × 10−61.730.189
RH0.00036.15 × 10−542.760.000
VM0.00120.001497.910.000
TM × VD6.93 × 10−632.31 × 10−61.600.187
TM × RH2.99 × 10−593.32 × 10−62.300.015
TM × VM9.24 × 10−661.54 × 10−61.070.379
VD × RH3.64 × 10−631.21 × 10−60.840.470
VD × VM4.41 × 10−522.20 × 10−515.310.000
RH × VM1.35 × 10−562.25 × 10−61.560.155
TM × VD × RH1.09 × 10−591.22 × 10−60.840.575
TM × VD × VM1.25 × 10−562.08 × 10−61.440.195
TM × RH × VM3.33 × 10−5181.85 × 10−61.290.189
VD × RH × VM4.09 × 10−666.82 × 10−70.470.828
TM × VD × RH × VM3.43 × 10−5181.91 × 10−61.320.164
Error0.0018011.44 × 10−6
Total0.053897
Corrected Total0.003896
Table 4. Results of ANOVA post hoc Duncan test for significant differences between groups (p = 0.05) (values of cells with the same letter do not differ significantly from each other) (TM—thermal modification; VM—vibration mode; RH—relative humidity).
TMVMLR Vibration PlaneLT Vibration Plane
RHRH
20%44%76%88%20%44%76%88%
A1abcdefghiabcdcdefghijklmnofghijklmnopqrababcdabcdefghabcdefghijkl
2defghijklmnopabcdefghipqrstvwxyzABCDstvwxyzABCDEFGnopqrstvwxyzABijklmnopqrstvwstvwxyzABCDEFvwxyzABCDEFGHI
3ijklmnopqrstvwlmnopqrstvwxyzABCDEFGHIJGHIJstvwxyzABCDEFGHstvwxyzABCDEIJJ
B1abcdefghiabcdefghijkghijklmnopqrsghijklmnopqrsaabcdefabcdefghabcdefghijk
2klmnopqrstvwxyghijklmnopqrstjklmnopqrstvwxstvwxyzABCDEFjklmnopqrstvwxabcdefghijklopqrstvwxyzABCCDEFGHIJ
3nopqrstvwxyzABxyzABCDEFGHIJGHIJzABCDEFGHIJzABCDEFGHIJzABCDEFGHIJwxyzABCDEFGHIIJ
C1abcdefgababcdefghijkijklmnopqrstvwabcabcdeabcdefghijcdefghijklmn
2nopqrstvwxyzABlmnopqrstvwxyztvwxyzABCDEFGHrstvwxyzABCDnopqrstvwxyzABlmnopqrstvwxyzopqrstvwxyzABCyzABCDEFGHIJ
3FGHIJyzABCDEFGHIJxyzABCDEFGHIJDEFGHIJABCDEFGHIJBCDEFGHIJEFGHIJGHIJ
D1abcdefghijkbcdefghijklmghijklmnopqrstefghijklmnopqabcdefghabcdefgefghijklmnopqefghijklmnopq
2mnopqrstvwxyzAhijklmnopqrstvrstvwxyzABCDErstvwxyzABCDDEFGHIJqrstvwxyzABCDzABCDEFGHIJzABCDEFGHIJ
3GHIJzABCDEFGHIJJHIJyzABCDEFGHIJJHIJJ
Disclaimer/Publisher’s Note: The statements, opinions and data contained in all publications are solely those of the individual author(s) and contributor(s) and not of MDPI and/or the editor(s). MDPI and/or the editor(s) disclaim responsibility for any injury to people or property resulting from any ideas, methods, instructions or products referred to in the content.

