Abstract
(1) Background: Understanding how forest management practices regulate hydrological cycles is critical for sustainable water resource management and addressing global water crises. However, the effects of light-felling (selective thinning) on hydrological processes in temperate mixed forests remain poorly understood. This study comprehensively evaluated the impacts of light-felling intensity levels on three hydrological layers (canopy, litter, and soil) in mid-rotation Korean pine (Pinus koraiensis) forests managed under the “planting conifer and preserving broadleaved trees” (PCPBT) system on Changbai Mountain, China. (2) Methods: Hydrological processes—including canopy interception, throughfall, stemflow, litter interception, soil water absorption, runoff, and evapotranspiration—were measured across five light-felling intensity levels (control, low, medium, heavy, and clear-cutting) during the growing season. The stand structure and precipitation characteristics were analyzed to elucidate the driving mechanisms. (3) Results: (1) Low and heavy light-felling significantly increased the canopy interception by 18.9%~57.0% (p < 0.05), while medium-intensity light-felling reduced it by 20.6%. The throughfall was significantly decreased 10.7% at low intensity but increased 5.3% at medium intensity. The stemflow rates declined by 15.8%~42.7% across all treatments. (2) The litter interception was reduced by 22.1% under heavy-intensity light-felling (p < 0.05). (3) The soil runoff rates decreased by 56.3%, 16.1%, and 6.5% under the low, heavy, and clear-cutting intensity levels, respectively, although increased by 27.1% under medium-intensity activity (p < 0.05). (4) The monthly hydrological dynamics shifted from bimodal (control) to unimodal patterns under most treatments. (5) The canopy processes were primarily driven by precipitation, while litter interception was influenced by throughfall and tree diversity. The soil processes correlated strongly with throughfall. (4) Conclusions: Low and heavy light-felling led to enhanced canopy interception and reduced soil runoff and mitigated flood risks, whereas medium-intensity light-felling supports water supply during droughts by increasing the throughfall and runoff. These findings provide critical insights for balancing carbon sequestration and hydrological regulation in forest management.
1. Introduction
Forests play a pivotal role in terrestrial ecosystems by regulating hydrological cycles, which profoundly influence regional and global water resources [1]. However, climate change and anthropogenic disturbances (e.g., deforestation) threaten forest hydrological services [2]. Sustainable forest management requires understanding how practices such as thinning modulate water cycles to support "nature-based solutions" for water crises [3].
Forests redistribute precipitation through canopy interception (CI), throughfall (TF), stemflow (SF), litter interception, and soil processes. Canopy interception, the initial hydrological process [4], retains 8.2%–65% of rainfall via adsorption on leaves and branches [5,6,7], with most water returning to the atmosphere via evaporation [8], reducing the total precipitation input and regulating storm runoff [6,9]. TF accounts for 60% to 90% of the total precipitation [10,11], directly influencing the sub-canopy water input [12], while SF (<12% of rainfall [13]) concentrates moisture and nutrients near tree bases [14,15]. These processes are shaped by the climate, precipitation characteristics, and vegetation structure [16,17,18,19], although their relative importance remains debated [20]. The litter layer acts as a secondary redistributor [21,22], intercepting 1%–70% of rainfall [23,24], prolonging infiltration, and reducing evaporation [25,26,27]. Litter interception is influenced by the precipitation characteristics, vegetation structure, and litter properties [17,28]. Ultimately, precipitation that is not intercepted by the canopy and litter enters the soil [29]. The soil layers store and filter water, replenishing groundwater or returning it via evapotranspiration (ET) [30]. The soil hydrology dynamics are also affected by many factors such as the antecedent soil moisture, rainfall characteristics, meteorological conditions, topography, and slope length [31,32]. In summary, the various components of the forest hydrological cycle are intricately linked, yet the existing research mainly focuses on one or two processes [33,34]. Therefore, we considered the overall interaction of the three hydrological processes of the canopy, litter layer and soil layer simultaneously, helping to enhance our understanding of how forests regulate precipitation.
Thinning is a common forest management strategy that helps forest stands adapt to climate change [35]. Thinning decreases the forest stand density and canopy cover [36], and subsequently lowers the CI [9,37,38,39], SF [39,40], and ET [41,42]. Additionally, thinning increases the TF [38,39,43], enhancing the opportunities for water absorption by the ground cover and soil layers, thereby increasing the soil water content [44,45] and catchment runoff [46,47,48], impacting the habitat water balance. Furthermore, changes in tree species composition due to thinning also affect the quantity and composition of the litter [49,50,51], which in turn alters its hydrological function [25]. However, most of these studies focused on the impact of thinning on the hydrological processes of pure, artificially planted forests of the same age, with the observation periods generally lasting less than five years and no more than nine years at most [52]. Only a few studies have investigated the effects of thinning on hydrological processes in mixed forests, revealing that the CI decreased by 32% after thinning removed 40% of the stems [53], while the effects of thinning on other hydrological processes in such forests remain unclear. Therefore, medium- and long-term studies on the effects of thinning on hydrological processes in mixed forests are still necessary.
Broadleaved Korean pine (Pinus koraiensis) mixed forests represent the zonal climax vegetation in Northeast China, which have been replaced by secondary and artificial forests due to excessive development and utilization [54]. To restore these forests, in the 1980s, the “dynamic management system of planting conifers and preserving broadleaved trees (PCPBT)” (planting Korean pine under secondary forests while retaining natural broadleaved trees) was proposed [55], and from the beginning of the 20th century, there was a total ban on cutting Korean pine. However, the shading from the upper broadleaved trees inhibited the growth of Korean pine. Subsequently, light-felling was adopted to release the Korean pine growth beneath the canopy, which could lead to improved forest productivity [56] and carbon storage [57] and help slow warming processes. In this study, light-felling specifically refers to a thinning strategy for mixed forests [58]. The core objective is to regulate the light conditions within the forest by selectively removing the upper broadleaved trees, thereby promoting the growth of the lower Korean pine. However, the impact of light-felling on its hydrological processes remains unclear. The purpose of this study was to determine the effects of light-felling intensity levels on the hydrological processes in the mid-term Korean pine forests u PCPBT (44 years of planting Korean pine in secondary forests and 27 years of light-felling) in the temperate Changbai Mountain of China. Based on rainfall events during the growing season, the canopy precipitation allocation, litter interception, soil absorption, and runoff were measured in forests with five different light-felling intensity levels (control, low, medium, and heavy light-felling and clear-cutting, referring to 0%, 25%, 50%, 75%, and 100% removal of upper broadleaf trees, respectively) to reveal the influence of light-felling on the hydrological process of the system and its monthly dynamic process, and to probe the influence mechanism by combing the influence factors (forest structure characteristics, rainfall characteristics, etc.). This paper also provides a reference on how to coordinate the roles of carbon and water regulation from a forest management perspective.
2. Materials and Methods
2.1. Study Area
The study site is located in Chunlei Forestry Farm, under the Baihe Forestry Bureau in Jilin Province (127°53′ E–128°34′ E, 42°01′ N–42°48′ N), within Antu County, Yanbian Korean Autonomous Prefecture, Jilin Province, Northeast China (Figure 1A). The average elevation is 800 m. The local topography consists of southeastern or middle slopes with a gradient range of 5°–10°. The area has a predominantly temperate continental monsoon climate, with an average annual precipitation rate of 713 mm (mainly concentrated in June–August) and an average annual temperature of 3.6 °C. The zonal soil is a dark brown soil, and the zonal vegetation is a temperate mixed coniferous–broadleaf forest. Currently, the forest in the study area has degraded to a secondary forest composed of Quercus mongolica, Ulmus pumila, Tilia amurensis, and other species. The main shrubs include Philadelphus schrenkii, Corylus mandshurica, Eleutherococcus senticosus, Euonymus alatus, and Vitis amurensis, and the primary herbaceous plants consist of Carex chinensis, Filipendula Palmata, Lilium distichum, and Convallaria keiskei, among others [56]. By the time of the survey in 2023, Korean pine had been planted in the forest for 44 years, and the light-felling experiment had been ongoing for 27 years. As a result, a mixed forest has begun to take shape, making this experimental site ideal for studying the effects of light-felling on the hydrological effect of Korean pine forests under the PCPBT system.
2.2. Study Methods
2.2.1. Sample Plot Setting and Rainfall Collection
In 1979, Korean pine was planted beneath the secondary forest canopy at a density of 2000 to 2500 stems per hectare. In the first five years after planting, it was managed by hole-cutting and weeding (1 to 2 times per year). After 17 years of growing Korean pine under the forest canopy, the upper layer of the light-felling experiment was initiated. In 1996, a light-felling experiment was set up in Chunlei Forest Farm, Jilin Province. The experiment included five different intensity levels light-felling treatment (control C, low light-felling L, medium light-felling M, heavy light-felling H, and clear-cutting Cc), with these intensity levels referring to 0%, 25%, 50%, 75%, and 100% removal of the upper broadleaf trees, respectively (Figure 1B). The stand type is a mixed forest formed by planting Korean pine within the secondary forest. Harvest residues were left in situ during harvesting, and the current sampling site has been well preserved (no secondary harvesting has occurred). In this survey, three 20 m × 30 m plots (i.e., three replications) were set up in each of the five light-felling treatments, resulting in a total of 15 plots with identical site conditions (all at the same elevation on the middle slope of the southeastern slope).
The measurement period was one growing season (June–September) in 2023, and each hydrological index was measured on the basis of rainfall events. In this study, the frequency rates for data collection were consistent with the frequency rates of atmospheric rainfall.
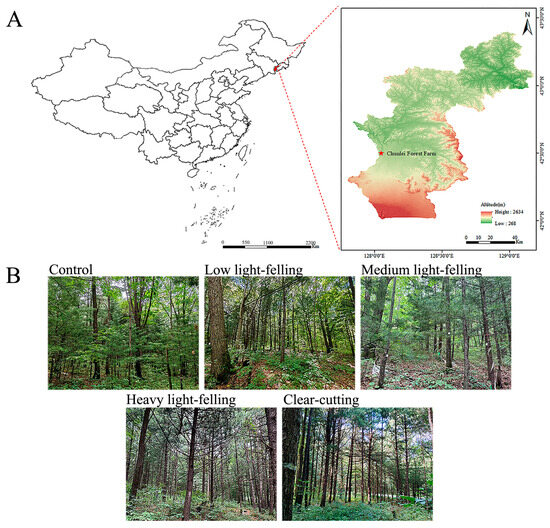
Figure 1.
The location of Chunlei Forest Farm (A) and the experimental plots for five different light-felling intensity levels (B).
2.2.2. Sample Survey
A per timber check scale along with shrub and herb surveys was conducted in July 2023 across various sites. In 15 plots, both shrubs and herbs were investigated using the five-point sampling method. With this method, the plot positions are distributed at the intersection point of the two diagonals and the center point of the plot to ensure spatial representativeness. The number of plants (individuals), coverage (shrubs are inspected by visual inspection, with an accuracy of ±5%; herbs are estimated using the grid method, dividing the area within 1 m2 into 10 cm × 10 cm grids), and average height (cm, measured with a height gauge) of each shrub and herbaceous plant are recorded. The size of the shrub plot was two meters by two meters, and that of the herb plot was one meter by one meter. The diversity indices of trees, shrubs, and herbs in the sample plots are calculated using the following two equations [59]:
Shannon–Wiener species diversity index: The comprehensive index reflecting species richness and evenness is calculated using the following formula:
Simpson species diversity index: The concentration degree of the dominant species in the community is calculated using the formula:
where is the total number of species in the community and is the proportion of the i-th species to all species.
Photographs of the forest canopy were taken vertically from bottom to top using a fisheye lens, and the images were processed with Gap Light Analyzer 2.0 (GLA 2.0) software to obtain canopy density and leaf area index values. A common method for the studying stand structure is to classify trees based on their degree of differentiation and the position of the canopy within the forest layers [60]. In this paper, according to the relative diameter (d) of individual trees in the sample site, the Korean pine trees were classified into three categories: dominant trees (d > 1.02); average trees (0.70 ≤ d < 1.02); suppressed trees (0.35 ≤ d < 0.70). The relative diameters of the individual trees were calculated as follows [61]:
The base area is the total cross-sectional area of the chest height of all trees within a unit area (hectare) (at a chest diameter of 1.3 m). The calculation formula for the cross-sectional area of the chest height of a single tree is (m2):
where is the diameter at the breast height of a single tree in the sample site; is the average diameter at the breast height of the stand in the sample site. We calculated the base area of the dominant trees, average trees, and suppressed trees based on the classification of trees, and then converted it into hectares (m2/ha).
2.2.3. Stemflow
This analysis was conducted in fifteen experimental plots measuring 20 m 30 m, where trees were selected as standard logs (in order to reduce the measurement error; therefore, we included all species as much as possible, and standard trees were selected for each tree species with a diameter of 4 cm, with the selected trees detailed in Appendix A) according to their diameter class (cm), and then the stemflow of the entire sample plot was calculated proportionally. A polyethylene plastic hose with an approximately 2.0 cm diameter was split along the center seam and wrapped around the trunk at approximately 1.5 m high for one and a half weeks, running from top to bottom and then diverted into a plastic bucket for the collection of the stemflow. The gap between the hose and the trunk was filled with glass adhesive. The results were calculated using the following equation [62]:
where is the stemflow (mm); is the number of diameter classes; is the stemflow amount of the standard tree of the -th diameter class in a specific precipitation event (mL); is the total number of trees in diameter class ; is the area of the sample plot (m2).
2.2.4. Atmospheric Precipitation and Throughfall
Three catch basins measuring 0.5 m 0.2 m were randomly placed in the open area outside the forest and in each of the 15 sample plots in the study area, 30 cm above the ground, with an opening at the bottom of the lower end of the catch basin, connected to a fixed-capacity plastic bag for rainfall collection. The canopy interception is calculated based on the principle of water balance between the collected atmospheric precipitation and throughfall, where is the average value of atmospheric precipitation and is the average value within each plot:
where is the canopy interception (mm); is the atmospheric precipitation (mm); is the throughfall (mm); is the stemflow (mm).
2.2.5. Litter Interception
Litter rarely dries out completely during dry periods between rainfall events; therefore, the amount of water stored in the litter will not be zero. This indicates that the actual amount of water stored will never reach the total potential water storage capacity. Consequently, if the litter moisture content is high, the amount of moisture that can be absorbed is currently low. In this study, within each standard plot, five small sample squares of 0.5 m 0.5 m were established at the intersections of the two diagonals of the sample plot and its center. The undecomposed litter (composed of fresh material, kept in its original state, with no signs of decomposition) and the semi-decomposed litter (the branches and leaves were not completely decomposed, and their sizes and shapes could still be discerned) were collected. The antecedent and maximum water contents were measured in the laboratory. The litter interception was calculated using the following model [63]:
where is the litter interception (mm); is the maximum litter storage (mm); is the antecedent water content (mm); is the throughfall (mm).
2.2.6. Soil Evapotranspiration
We used the change in soil moisture before (one day earlier) and after (within two hours) a rainfall event as the amount of evapotranspiration occurring in the sample plots. The soil was sampled using the soil profile survey method in 15 sample plots before and after each rainfall event. The samples were mechanically stratified at depths of 0–10 cm, 10–20 cm, and 20–30 cm using the ring knife method (volume of 100 cm3), and obtained using the five-point sampling method. We then brought the samples back to the laboratory and place them in an oven at 105 °C for drying for at least 24 h until the soil weight remained constant.
The soil evapotranspiration was calculated using the formula derived by ourselves:
where is the evapotranspiration (mm); is the amount of soil stratification; is the moisture loss of the soil in the th layer after rainfall (mm); is the moisture loss of the soil in the th layer before rainfall (mm); is the area of the sample plots (m2); is the volume of the ring knife (m3).
2.2.7. Soil Runoff
Three soil squares measuring 1 m 1 m 30 cm were excavated at randomly selected locations within each of the 15 sample plots. A double layer of polythene plastic was placed over the soil profile, with an opening in one corner connecting and securing a length of polythene plastic hose to divert the flow into a collector, which was then backfilled. The original soil structure was preserved as undamaged as possible during the operation.
where is the runoff (mm); is the runoff volume (mL·m−2); represents the sample area (m2).
2.2.8. Soil Water Absorption
The soil water absorption was calculated according to the principle of water balance:
where is the soil water absorption (mm); is throughfall (mm); is the stemflow (mm); is the litter interception (mm); is the soil evapotranspiration (mm).
2.3. Statistical Analyses
SPSS 27.0 was used to conduct a one-way ANOVA on the data, employing the least significant difference (LSD) method to test for significant differences between data groups, with the level of significance set at p = 0.05. A stepwise regression analysis was performed between the results and the plot parameters (Table 1 and Figure A1), with an entry probability of F set at 0.05 and an exclusion probability of 0.1. Image rendering was conducted using Origin 2021.

Table 1.
Plot conditions.
3. Results
3.1. Canopy Precipitation Partitioning Under Different Light-Felling Intensity Levels
The light-felling had a substantial effect on the precipitation partitioning in the canopy of Korean pine forests under the PCPBT system on Changbai Mountain (Figure 2A). The canopy interception values in the stands under different light-felling intensity levels ranged from 62.46 to 123.49 mm during the growing season. The low (L) and heavy light-felling (H) significantly increased the canopy interception by 57.0% and 18.9% (p < 0.05) compared with the control (the same below), while the medium light-felling (M) significantly decreased it by 20.6%. The throughfall values ranged from 322.53 to 380.57 mm, whereby L significantly decreased the throughfall by 10.7%, while M significantly increased it by 5.3%. The stemflow values ranged from 8.17 to 14.27 mm, and the five light-felling intensity levels caused decreases in stemflow ranging from 15.8% to 42.7%. Therefore, the influence of the four light-felling intensity levels on the canopy precipitation partitioning were much different (i.e., L significantly increased the canopy interception and decreased the throughfall and stemflow compared to C; M decreased the canopy interception and stemflow and increased the throughfall compared to C; H increased the canopy interception and decreased the stemflow, while clear-cutting (Cc) only decreased the stemflow compared to C).

Figure 2.
(A) The values of throughfall, stemflow, and canopy interception in the Korean pine forests under the PCPBT system during the growing season under different light-felling intensity levels. (B) Their respective proportions to the total atmospheric precipitation under different light-felling intensity levels (different capital letters indicate significant differences among the light-felling intensity levels for the same item; p < 0.05, the same as below).
The light-felling also affected the monthly dynamics of the canopy precipitation partitioning during the growing season (Table 2, Table 3 and Table 4). The monthly dynamics were compared across treatments within the same calendar month (e.g., June vs. June) to isolate treatment effects under identical precipitation conditions (the same below). In the control stand, the canopy interception, throughfall, and stemflow all took on an increased and then decreased trends during the growing season, i.e., the canopy interception, throughfall, and stemflow were relatively higher in July and August and lower in June and September; however, M and H resulted in significantly lower canopy interception values in August (18.6%~20.4%) and significantly higher throughfall values in August (6.5%~7.7%) than in July, so M and H altered the growing season dynamics of the canopy interception and throughfall (the canopy interception in July was greater than that in August, while the throughfall in August was greater than that in July). M also changed the growing season dynamics of the stemflow (the peak of the stemflow shifted from August in the control to July).
Table 2.
Monthly dynamic processes of canopy interception in the Korean pine forest under the PCPBT system during the growing season under different light-felling intensity levels.
Table 3.
Monthly dynamic processes of throughfall in the Korean pine forest under the PCPBT system during the growing season under different light-felling intensity levels.
Table 4.
Monthly dynamic processes of stemflow in the Korean pine forest under the PCPBT system during the growing season under different light-felling intensity levels.
3.2. Litter Interception Under Different Light-Felling Intensity Levels
The light-felling had a significant effect on the litter interception in the Korean pine forests under the PCPBT system during the growing season (Figure 3A). The litter interception values ranged from 2.494 to 3.396 mm in the stands with the five light-felling intensity levels. Only H significantly decreased the litter interception by 22.1% (p < 0.05) compared with the control, while L and M decreased it slightly (3.0%~16.1%, p > 0.05) and Cc increased it slightly (6.0%, p > 0.05). Thus, after 27 years of light-felling, only H significantly decreased the precipitation interception capacity of the litter layer, whereas L, M, and Cc restored it.
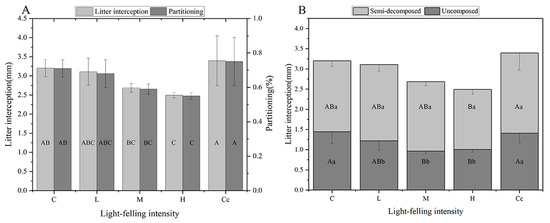
Figure 3.
Litter interception values and their proportions to the total atmospheric precipitation under different light-felling intensity levels (A), and undecomposed and semi-decomposed litter interception values (B) in the Korean pine forest under the PCPBT system during the growing season under different light-felling intensity levels (different capital letters indicate significant differences among light-felling intensity levels for the same item, while different lowercase letters indicate significant differences among items for the same light-felling intensity; p < 0.05).
The effects of light-felling on the litter interception from undecomposed and semi-decomposed layers were different during the growing season (Figure 3B). The values for the undecomposed litter interception ranged from 0.965 to 1.446 mm, and it was significantly decreased by 30.2%~33.3% (p < 0.05) by M and H compared with the control, while there was no significant effect of light-felling on the semi-decomposed litter interception (which ranged from 1.484 to 1.987 mm).
In addition, the light-felling altered the monthly dynamics of the litter interception during the growing season (Table 5). The monthly dynamics of the growing season in the control stand showed a bimodal pattern, with peaks in June and September and a decreasing trend from June to August; L, M, and H resulted in a unimodal pattern, with a peak in September and a constant trend from June to August; Cc resulted in a unimodal pattern, with a peak in June and a constant trend from July to September.
Table 5.
Monthly dynamic processes of litter interception in the Korean pine forest under the PCPBT system during the growing season under different light-felling intensity levels.
3.3. Soil Precipitation Partitioning Under Different Light-Felling Intensity Levels
The effects of light-felling on the precipitation partitioning in the soil layer were not the same during the growing season (Figure 4A). The soil water absorption values ranged from 79.62 to 87.30 mm during the growing season, with no significant effect on the soil water absorption for each light-felling intensity (−8.4% to 0.4%, p > 0.05, compared with the control, the same as below), The soil runoff values ranged from 43.57 to 99.60 mm, with a significant increase of 27.1% due to M and significant decreases of 56.3%, 16.1%, and 16.4% due to L, H, and Cc (p < 0.05), respectively. The values for the soil evapotranspiration ranged from 198.82 to 205.97 mm, which was significantly increased by 3.5% only by H (p < 0.05). Therefore, L and Cc decreased the soil runoff compared to C, M significantly increased the soil runoff compared to C, and H significantly decreased the runoff and increased the soil evapotranspiration compared to C.

Figure 4.
Soil runoff, soil evapotranspiration, and soil absorption values (A) and their respective proportions to the total atmospheric precipitation (B) in the Korean pine forest under the PCPBT system during the growing season under different light-felling intensity levels (different capital letters indicate significant differences among light-felling intensity levels for the same item, while different lowercase letters indicate significant differences among items for the same light-felling intensity; p < 0.05).
In addition, the light-felling did not have an apparent effect on the monthly dynamics of the soil layer precipitation partitioning during the growing season (Table 6, Table 7 and Table 8). The soil water absorption, soil runoff, and soil evapotranspiration in the control stand showed a regular pattern of having the highest values in July and August and middle values in June and lowest in September, while L, H, and Cc caused high soil runoff values in July and August and low values in June and September, although none of the light-felling intensity classes changed the monthly dynamics of the soil water absorption or soil evapotranspiration.
Table 6.
Monthly dynamic processes of soil absorption in the Korean pine forest under the PCPBT system during the growing season under different light-felling intensity levels.
Table 7.
Monthly dynamic processes of soil runoff in the Korean pine forest under the PCPBT system during the growing season under different light-felling intensity levels.
Table 8.
Monthly dynamic processes of soil evapotranspiration in the Korean pine forest under the PCPBT system during the growing season under different light-felling intensity levels.
3.4. Water Balance Under Different Light-Felling Intensity Levels
The light-felling had a large effect on the growing season water balance in the Korean pine forests under the PCPBT system (Figure 5). In the control stand, the canopy layer had the largest proportion of throughfall (79.54%), the second largest proportion of canopy interception (17.32%), and the smallest proportion of stemflow (3.14%) in the precipitation partitioning. The litter interception had the smallest proportion (0.71%) of the total precipitation. The proportion of soil evapotranspiration (43.80%) was greater in the soil layer, while the proportions of soil runoff and soil water absorption (19.14% and 19.04%) were smaller and similar. L increased the canopy interception (9.87%), decreased the throughfall and stemflow (8.53% and 1.34%), and consequently decreased the soil runoff (9.45%), while M significantly decreased the canopy interception (3.57%), increased the throughfall (4.25%), decreased the stemflow (0.68%), and consequently increased the soil runoff (2.89%). H significantly increased the canopy interception (3.27%) and decreased the stemflow (1.29%), which in turn decreased the litter interception and soil runoff (0.16% and 3.06%, respectively) and increased the soil evapotranspiration (1.55%); Cc only decreased the stemflow (0.49%), which in turn decreased the soil runoff (1.24%). Therefore, the effects of various light-felling intensity levels on the water balance of Korean pine forests under the PCPBT system during the growing season were different. For example, L and H significantly decreased the soil runoff mainly by increasing the canopy interception and decreased the precipitation input; Cc reduced the soil runoff only by reducing the stemflow, while M increased the soil runoff mainly by decreasing the canopy interception and increasing the precipitation input.
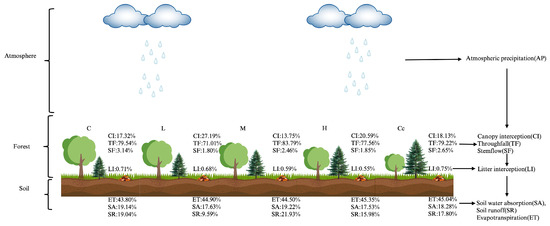
Figure 5.
Proportion of each component to the total precipitation in a Korean pine forest under the PCPBT system during the growing season under different light-felling intensity levels.
3.5. Main Controlling Factors of Hydrological Processes in a Korean Pine Forest Under the PCPBT System
The main controlling factors for the hydrological processes of canopy precipitation partitioning, litter interception, and soil layer precipitation partitioning were not the same in the Korean pine forest under the PCPBT system (Figure 6A,B). In the process of canopy precipitation partitioning, the canopy interception and throughfall were only promoted by atmospheric precipitation, which explained 76.6% and 98.5% of the respective variance levels; the stemflow was mainly promoted by atmospheric precipitation and the average density of the dominant Korean pine, which explained 73.7% and 15.3% of the respective variance levels, with the promotion of the former as the main factor and the latter as the secondary factor.
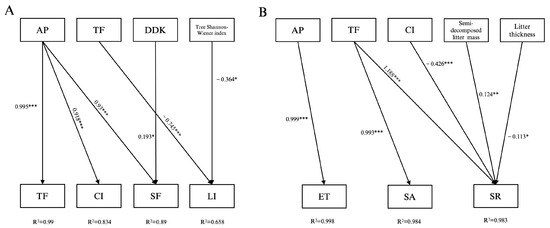
Figure 6.
Stepwise regression analyses: growing season throughfall, canopy interception, stemflow, and litter interception (A); soil evapotranspiration, absorption, and runoff (B) (***: p < 0.001; **: p < 0.01; *: p < 0.05; AP: atmospheric precipitation; TF: throughfall; DDK: average density of dominant Korean pine; CI: canopy interception; SF: stemflow; LI: litter interception; ET: soil evapotranspiration; SA: soil water absorption; SR: soil runoff).
The litter interception was inhibited by the throughfall and Shannon–Wiener index of tree species diversity, with explanatory rates of 44.2% and 21.6%, respectively; the inhibition effect of the throughfall was stronger. The soil evapotranspiration was promoted only by atmospheric precipitation, with an explanatory rate of 99.7%. The soil water absorption was promoted only by throughfall, with an explanatory rate of 97.7%. The soil runoff was promoted by throughfall and the semi-decomposed litter mass and inhibited by canopy interception and the litter thickness, with explanatory rates of 63.1%, 6.7%, 22.6%, and 6.0%, respectively, which were dominated by the promotion of throughfall and the inhibition of canopy interception.
4. Discussion
4.1. Effects of Light-Felling on Canopy Precipitation Partitioning and Monthly Dynamics
The study revealed distinct effects of the five light-felling intensity treatments (control, L, M, H, Cc) on canopy precipitation partitioning. The low (L) and heavy (H) intensity levels significantly increased the canopy interception while decreasing the throughfall and stemflow compared to C. The medium intensity (M) reduced the canopy interception but increased the throughfall compared to C. Clear-cutting (Cc) showed no significant effect compared to C. Among these results, only the effect of M was consistent with the existing conclusion that thinning decreases canopy interception and increases throughfall [38,39,43], while the effects of other light-felling intensity levels were significantly different to this conclusion. All treatments consistently decreased the stemflow, consistent with thinning-induced stemflow reductions [39,40], highlighting unique hydrological responses to light-felling in mixed forests.
On the premise of there being little difference between the canopy density and leaf area index (Table 1), the tree species composition was the main factor affecting the canopy rainfall distribution [64]. This difference is mainly driven by the inherent differences between coniferous trees (Pinus koraiensis) and broadleaved trees in leaf morphology, leaf area index (LAI), and water use strategies. Due to the compensatory effect of the LAI, although the differences in LAI values among different treatments are relatively small (Table 1), coniferous canopies exhibit higher rainfall interception efficiency values due to their complex multi-layer branching structures and prolonged water residence times on waxy needle surfaces [65,66], while broadleaved trees promote the concentrated release of TF through larger single-leaf areas [19]. Furthermore, under M, although the removal of 50% of the broadleaved trees temporarily reduced the canopy coverage, the Korean pines did not fully restore their vertical leaf layer distribution due to the competitive pressure for light, resulting in a decrease in interception capacity. On the contrary, L and H formed a more effective “multi-layer interception sieve” by preserving or promoting the dense lateral branch growth of the Korean pine trees, and the branch angles of the Korean pine are 15°–20° smaller than that of broadleaved trees. Moreover, the high stomatal density of broadleaved trees enables them to reduce their canopy water storage through rapid transpiration during the rainy season, while the thick cuticles of coniferous trees prolong the evaporation time of the retained water [8]. Therefore, the light-felling intensity directly regulates the inter-species trade-off of the canopy’s hydrological function by changing the ratio of coniferous to broadleaved leaves, while M disrupts this balance due to the insufficient growth compensation of Korean pine trees.
Although clear-cutting (Cc) established Korean pine as the dominant species, artificially induced canopy restructuring—including an altered leaf layer distribution and branch density—persisted significantly after 27 years (LAI: 1.39 vs. 1.67 in control, p < 0.05; Table 1). This sustained architectural divergence stems from simplified vertical stratification in monoculture stands (e.g., sparse lateral branching), reducing the interception capacity (Section 4.1). In contrast, M triggered incomplete compensatory growth of the Korean pine (basal area: 8.01 m2/ha vs. 20.24 m2/ha in H; Table 1), creating canopy gaps that enhanced the throughfall. Conversely, H promoted dense lateral branching, forming a multi-layered “interception sieve” that amplified the rainfall retention. These structural trade-offs—driven by species-specific responses to light release—explain the opposing hydrological trends between M and H treatments.
The monthly dynamics further diverged. The control stands showed bimodal canopy interception and throughfall peaks in July and August due to their stable broadleaf-dominated canopies [67]. The M and H treatments created heterogeneous canopies mixing broadleaves and Korean pine, resulting in unimodal patterns, whereby the interception peaked in July (active pine growth), while the throughfall peaked in August (broadleaf senescence) [68]. In contrast, L and Cc maintained homogeneous canopies (broadleaf-rich and pine-dominated, respectively), preserving bimodal trends.
4.2. Effects of Light-Felling on Litter Interception and Monthly Dynamics
In this study, the litter interception (2.494–3.396 mm) when compared with that of temperate mixed forests (1.5–4.2 mm) [22] was consistent, although it was lower than that of tropical forests (5.8–7.1 mm) [69]. This difference was related to the composition and decomposition stage of the litter. Plots with a high proportion of coniferous litter (such as the Cc group) have a stronger hydrophobicity and a water-holding capacity lower than that of broadleaved litter [70]. Due to the destruction of the fiber structure, the water holding capacity of the semi-decomposed litter in H decreased by 22% compared with that of the undecomposed litter (Figure 3B), which was consistent with the trend of the temperate zone study [71].
Only heavy light-felling (H) significantly reduced the litter interception, whereas the low (L), medium (M), and clear-cutting (Cc) intensity levels showed no significant effects. This phenomenon can be attributed to litter characteristics (mass, type, and thickness) as primary drivers of interception capacity [72]. With increasing light-felling intensity, the greater removal of upper broadleaved trees enhanced the Korean pine understory growth, establishing a trade-off between broadleaved tree abundance and pine dominance. Consequently, L, M, and H maintained comparable litter mass values to the control, while Cc significantly increased the total litter mass, mainly due to the accumulation of a large number of pine needles (Figure A1) and due to the inherently lower interception capacity of coniferous litter compared to broadleaf litter [22,73]. As a result, the litter interception increased slightly in Cc. However, in H stands, the broadleaf litter decreased more compared to C and the needle leaf litter increased less than with Cc; as a result, LI decreased in H.
The monthly dynamics further diverged, whereby the control stands exhibited bimodal litter interception peaks in June (pre-decomposition accumulation [74,75] and September (leaf shedding peak [74]). In contrast, the L, M, and H treatments shifted to a unimodal September peak. This shift arose from canopy-thinning-induced soil temperature fluctuations, which accelerated the microbial decomposition [76], depleting the June litter stocks. Conversely, Cc eliminated broadleaf litterfall, reducing the September inputs and concentrating the interception in June.
4.3. Effects of Light-Felling on Soil Precipitation Distribution and Growing Season Dynamics
After 27 years of light-felling, the low (L), heavy (H), and clear-cutting (Cc) treatments significantly reduced the soil runoff in the mixed forest, whereas the medium treatment (M) increased it. Notably, these results (except M) contradict conventional findings showing that thinning enhances catchment runoff [46,47,48], underscoring the unique hydrological behavior of mixed forests under light-felling.
Mechanistically, soil runoff is governed by stand characteristics (e.g., canopy cover, species composition) [16,77,78]. Light-felling altered the broadleaf–conifer balance (Section 4.1), modifying the canopy interception capacity and subsequent precipitation inputs. Specifically, in L, H, and Cc, the enhanced interception by evergreen Korean pine reduced the rainfall reaching the forest floor; however, in M, the reduced interception allowed greater throughfall. In addition, when there was no difference in soil absorption values in the growing season (Figure 4), the amount of water directly input to the soil surface reflected the difference in soil runoff [79]. Although there was no significant difference in SA values among each treatment group during the growing season (Figure 4A), the TF directly input to the surface was significantly positively correlated with SR (Figure 6B). For example, the higher TF in group M (Figure 2) directly drove an increase in its runoff volume, while in groups L, H, and Cc, the runoff volumes significantly decreased due to the reduction in penetrating rain (Figure 4B). This mechanism conforms to the “input–output balance” theory in forest hydrology [29]; that is, when the retention of the canopy and litter is insufficient to buffer the precipitation input, the response of the runoff to water flux is more sensitive. Therefore, L, H, and Cc inhibit runoff production, while M promotes runoff production.
Notably, H also significantly increased the soil evapotranspiration (ET). This arose from productivity-driven ET [56], which correlates with higher ET [44]. Another reason was that microclimate effects reduced the canopy density and litter thickness (Table 1) and increased the solar penetration, enhancing the forest floor evaporation [80].
The runoff of the corresponding plots reached its peak in July and August, followed by June, and was the lowest in September (Table 7), which was directly related to the precipitation concentration period of the growing season (precipitation in July and August accounts for 83% of the total season; Appendix A, Table A1). The high-intensity precipitation events in July and August led to saturation of the canopy and litter interception [6], thereby triggering the peak runoff. Furthermore, in L, H, and Cc, the enhanced interception capacity of the Korean pines (Figure 2A) reduced the in-forest precipitation in June, resulting in the suppression of early runoff (in June) to comparable levels to the natural low value in September (Table 7). In M, the decline in interception capacity led to an increase in precipitation within the forest from July to August. Coupled with the synergistic effect of the precipitation concentration period, this resulted in a significant increase in runoff. Furthermore, the slight increase in runoff in September was related to the lagging response of soil moisture saturation in the extreme precipitation event in August [79], and this effect was weakened in the light-felling group (L, H, and Cc) due to the enhanced permeability of the herbaceous layer (Table 7).
4.4. Dominant Controllers of Hydrological Processes in Canopy, Litter, and Soil Layers
After 27 years of light-felling, the canopy interception and throughfall were predominantly driven by atmospheric precipitation, whereas the stemflow was jointly influenced by precipitation (primary) and the average density of the dominant Korean pine. This aligns with prior studies showing that precipitation characteristics explain >75% of canopy hydrological variability, while forest structural traits (e.g., the leaf area index) play a limited role [38]. Mechanistically, the long-term stand recovery diminished structural differences between treatments and control plots (Table 1), reducing the vegetation-mediated effects [52,81]. Additionally, heavy rain and torrential rain rainfall events (57% of observations, Appendix A Table A1) dominated the hydrological responses, further prioritizing precipitation over stand structure. The stemflow (SF) dynamics were reconfigured by broadleaf-to-pine functional shifts induced by light-felling, where the hydrological outcomes pivoted on interspecific trait transitions. Specifically, the broadleaf-dominated stands (Control) maximized their SF (14.27 mm) through Quercus mongolica and other smooth-barked species (mean DBH: 17.2 cm), despite their low pine dominance (dominant pine density, DDK: 489 trees/ha; dominant pine DBH: 12.2 cm, Table 1). Progressively, thinning-triggered pine enrichment (L to H treatments) amplified the pine-driven stemflow via elevated dominant pine density levels (DDK: 356 to 222 trees/ha, Table 1), yet the net SF declined linearly (12.05 to 8.17 mm) as the broadleaf coverage yielded to P. koraiensis—a paradox stemming from countervailing forces; while the high-density dominant pines (e.g., H: DDK = 222 trees/ha, Table 1) enhanced the internal channeling to potentially boost the SF, this promotion was ultimately overridden by a concurrent bark transition (thin broadleaf to thick pine bark) and structural transformation (open to dense canopy), which collectively suppressed the density-driven gains. Ultimately, the pine-monopolized stands (Cc) minimized their SF (7.32 mm), while near-complete broadleaf removal (mean DBH: 13.4 cm) enabled massive pines (dominant DBH: 32.7 cm; DDK = 489 trees/ha, Table 1) to impose extreme rainwater retention. Critically, the dominant pine density (DDK) acted as a stemflow promoter, although its effects were masked by stronger bark and canopy constraints—revealing that compositional shifts, not density per se, govern the hydrological spectrum.
The litter interception was suppressed by the throughfall and tree diversity (Shannon–Wiener index). This was mainly because the elevated throughfall increased the litter antecedent water content, reducing the interception capacity, while the high diversity accelerated the litter drying and decomposition rates [74,75], diminishing the litter mass and spatial coverage [82]. Furthermore, the types of litter produced by different forest stands are highly heterogeneous, and the decomposition rate is relatively fast, further reducing the interception [74].
The soil evapotranspiration was primarily controlled by atmospheric precipitation. However, treatment-specific modulation occurred; in H, the ET was significantly increased by 3.5%, attributable to enhanced understory transpiration from elevated shrub diversity levels (Shannon index: 0.90 ± 0.60 vs. 0.56 ± 0.56 in control; Table 1). Moreover, increased forest floor evaporation was observed due to reduced litter thickness levels (2.07 ± 0.46 cm vs. 2.22 ± 0.50 cm; Table 1), which amplified the solar penetration [80]. The non-significant ET changes in the other treatments aligned with their canopy density, where the structural homogeneity minimized the microclimatic variation. This threshold-based response reconciles the apparent contradiction between generalized precipitation dominance and treatment-level divergence. The divergent runoff responses between M and H arose from contrasting canopy structural reorganization. In H, the Korean pine dominance (basal area: 20.24 m2/ha vs. 8.01 in M; Table 1) and reduced broadleaf cover (basal area: 13.13 m2/ha vs. 21.27 in M; Table 1) created a conifer-biased canopy. This configuration enhanced the interception efficiency through the multi-layered needle foliage prolonging the water residence time (Section 4.1) and the lower canopy porosity minimizing the throughfall penetration (Figure 2A), ultimately reducing the runoff by 16.1%. However, in M, the incomplete canopy closure (despite a comparable LAI) allowed greater rainfall penetration. This was evidenced by the significantly higher throughfall (Figure 2A) and strong positive correlation between the throughfall and runoff (Figure 6B). Stepwise regression confirmed that the runoff suppression was primarily driven by the canopy interception capacity (Figure 6B), which was maximized in H stands through conifer-dominated structural reconfiguration.
5. Conclusions
The study on the linkage of three hydrological processes in the canopy, litter, and soil layers of Korean pine forests under the PCPBT system in the temperate Changbai Mountain of China showed that the effect of light-felling on the hydrological processes of the mixed forest had its special regularity because of the trade-off relationship between the upper broadleaved tree and the sub-canopy Korean pine. This was significantly different compared to the traditional thinning method, with which the soil runoff can be increased by reducing the canopy interception in pure plantations. The adoption of low and heavy light-felling treatments and clear-cutting can increase the canopy interception of Korean pine forests and decrease the in-forest precipitation and soil runoff, thereby helping to decrease the risk of flood caused by extreme precipitation events. Meanwhile, the adoption of M can decrease the canopy interception and increase the throughfall and soil runoff, thereby helping to maintain the forest water supply capacity during droughts.
Author Contributions
Conceptualization, Q.L.; methodology, Q.L. and C.M.; software, Q.L. and J.L.; data curation, Q.L.; investigation and samples collection, Q.L., Z.Z., X.L., X.H., Y.C., Z.S. and H.M.; writing—original draft preparation, Q.L.; writing—review and editing, C.M.; funding acquisition, C.M. All authors have read and agreed to the published version of the manuscript.
Funding
We thank supported by the “14th Five-Year Plan” National Key and Program Projects (2022YFF1300502) and the Carbon Neutral Science Foundation Project of Northeast Forestry University (HZX220100003).
Data Availability Statement
The original contributions presented in the study are included in the article, while further inquiries can be directed to the corresponding author.
Conflicts of Interest
Author Jiawei Lin was employed by the company Heilongjiang Agricultural Reclamation Survey Design and Research Institute Co., Ltd. The remaining authors declare that the research was conducted in the absence of any commercial or financial relationships that could be construed as a potential conflict of interest.
Appendix A
Table A1.
Rainfall data.
Table A1.
Rainfall data.
| Date | Precipitation (mm) | Duration | Rainfall Level |
|---|---|---|---|
| 6.10 | 12 | <24 h | Moderate rain |
| 6.19 | 26.5 | <24 h | Heavy rain |
| 6.23 | 14.9125 | <24 h | Moderate rain |
| 6.27 | 12 | <12 h | Moderate rain |
| 7.2 | 21.125 | <24 h | Moderate rain |
| 7.13 | 67.5 | <24 h | Torrential rain |
| 7.21 | 64.75 | <24 h | Torrential rain |
| 7.27 | 28.025 | <24 h | Heavy rain |
| 8.1 | 13.125 | <12 h | Moderate rain |
| 8.8 | 83.75 | <24 h | Torrential rain |
| 8.15 | 21.5 | <12 h | Heavy rain |
| 8.26 | 18.225 | <12 h | Heavy rain |
| 8.29 | 60.25 | <24 h | Torrential rain |
| 9.25 | 10.525 | >48 h | Light rain |
Note: Light rain, the 12 h rainfall is less than 5 mm or the 24 h rainfall is less than 10 mm; moderate rain, the 12 h rainfall is in the range of 5~15 mm or the 24 h rainfall is in the range of 10.1~25 mm; heavy rain, the 12 h rainfall is in the range of 15.1~29.9 mm or the 24 h rainfall is in the range of 25.0~49.9 mm; torrential rain, the 12 h rainfall is in the range of 30~69.9 mm or the 24 h rainfall is in the range of 50.0~99.9 mm; data taken from the website of the China Meteorological Administration, https://www.cma.gov.cn/2011xzt/2013zhuant/20.130417/2013041716/201304/t20130423_211758.html, accessed on 1 June 2023).
The selected trees for stemflow were as follows.
In control 1, there were 4 Korean pines with diameters at breast height of 4.0 cm, 5.7 cm, 9.1 cm, and 15.6 cm, respectively; 1 purple linden with a diameter at breast height of 14.7 cm; 1 elm with a diameter at breast height of 17.5 cm; 1 small-leaf poplar with a diameter at breast height of 31.4 cm; and 1 large-leaf linden with a diameter at breast height of 32 cm.
In control 2, there were 4 Korean pines with diameters at breast height of 4.2 cm, 6.4 cm, 9.1 cm, and 12.4 cm, respectively; 2 purple lindens with diameters at breast height of 16.2 cm and 20.0 cm, respectively; 1 elm with a diameter at breast height of 16.4 cm; 1 Mongolian oak with a diameter at breast height of 26.1 cm; and 1 large-leaved linden with a diameter at breast height of 28.2 cm.
In control 3, there were 3 Korean pines with diameters at breast height of 4.0 cm, 5.8 cm, and 9.5 cm, respectively; 2 purple lindens with diameters at breast height of 6.4 cm and 22.6 cm, respectively; 1 Mongolian oak with a diameter at breast height of 32.0 cm; and 1 large-leaved linden with a diameter at breast height of 20.4 cm.
In low light-felling 1, there were 3 Korean pines with diameters at breast height of 4.8 cm, 6.3 cm, and 9.9 cm, respectively; 1 purple linden with a diameter at breast height of 14.5 cm; 1 Mongolian oak with a diameter at breast height of 22.6 cm; and 1 golden cypress with a diameter at breast height of 26.3 cm.
In low light-felling 2, there were 5 Korean pines with diameters at breast height of 4.4 cm, 6.3 cm, 9.9 cm, 15.1 cm, and 17.9 cm, respectively; 1 purple linden with a diameter at breast height of 9.9 cm; 1 Mongolian oak with a diameter at breast height of 14.3 cm; 1 elm with a diameter at breast height of 17.6 cm; and 1 large-leaved linden with a diameter at breast height of 34.2 cm.
In low light-felling 3, there were 6 Korean pines with diameters at breast height of 4.3 cm, 6.3 cm, 10.4 cm, 13.4 cm, 18.1 cm, and 23.8 cm, respectively; 1 purple linden with a diameter at breast height of 13.8 cm; and 1 large-leaved linden with a diameter at breast height of 20.8 cm.
In medium light-felling 1, there were 5 Korean pines with diameters at breast height of 5.7 cm, 9.2 cm, 13.5 cm, 18.8 cm, and 26.5 cm, respectively; 2 purple lindens with diameters at breast height of 7.0 cm and 17.7 cm, respectively; 1 Mongolian oak with a diameter at breast height of 20.1 cm; and 1 elm with a diameter at breast height of 20.1 cm.
In medium light-felling 2, there were 4 Korean pines with diameters at breast height of 4.3 cm, 6.2 cm, 9.7 cm, and 13.2 cm, respectively; 3 purple lindens with diameters at breast height of 7.4 cm, 11.8, and 23.2 cm, respectively; 1 Mongolian oak with a diameter at breast height of 28.3 cm; and 1 elm with a diameter at breast height of 18.9 cm.
In medium light-felling 3, there were 5 Korean pines with diameters at breast height of 4.6 cm, 6.3 cm, 10.0 cm, 13.1 cm, and 22.1 cm, respectively; 1 purple linden with a diameter at breast height of 20.7 cm; 1 Mongolian oak with a diameter at breast height of 35 cm; and 1 elm with a diameter at breast height of 16.8 cm.
In heavy light-felling 1, there were 7 Korean pines with diameters at breast height of 4.3 cm, 6.0 cm, 10.1 cm, 13.3 cm, 13.8 cm, 18.0 cm, and 23.4 cm, respectively; 1 purple linden with a diameter at breast height of 18.7 cm; and 1 large-leaved linden with a diameter at breast height of 14.4 cm.
In heavy light-felling 2, there were 5 Korean pines with diameters at breast height of 6.0 cm, 11.0 cm, 14.0 cm, 21.6 cm, and 25.9 cm, respectively; 1 purple linden with a diameter at breast height of 5.0 cm; 1 Mongolian oak with a diameter at breast height of 41.4 cm; and 1 large-leaved linden with a diameter at breast height of 8.8 cm.
In heavy light-felling 3, there were 6 Korean pines with diameters at breast height of 5.3 cm, 10.2 cm, 14.7 cm, 18.4 m, 21.2, and 26.7 cm, respectively; 1 purple linden with a diameter at breast height of 10.3 cm; and 1 Mongolian oak with a diameter at breast height of 35 cm;.
In clear-cutting 1, there were 5 Korean pines with diameters at breast height of 4.2 cm, 10.6 cm, 14.6 cm, 19.1 cm, and 22.2 cm, respectively; 2 elms with diameters at breast height of 10.2 cm and 15.3, respectively; and 2 small-leaf poplars with diameters at breast height of 17.7 cm and 20.5 cm, respectively.
In clear-cutting 2, there were 6 Korean pines with diameters at breast height of 14.4 cm, 17.3 cm, 21.7 cm, 26.5 cm, 30.9 cm, and 34.7 cm, respectively; and 2 elms with diameters at breast height of 9.0 cm and 21.4 cm, respectively.
In clear-cutting 3, there were 7 Korean pines with diameters at breast height of 6.4 cm, 10.0 cm, 13.7 cm, 17.6 cm, 21.8 cm, 25.7 cm, and 35.2 cm, respectively. 1 purple linden with a diameter at breast height of 25.1 cm; and 1 elm with a diameter at breast height of 17.9 cm.
Appendix B
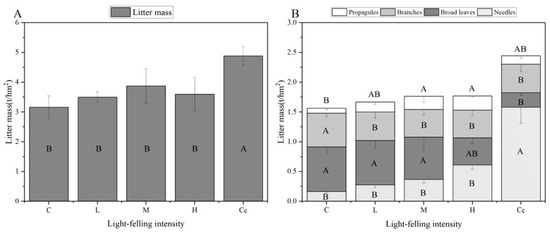
Figure A1.
Monthly average litter mass (A) and monthly average litter mass of components of the undecomposed layer (B) during the growing season (different capital letters indicate significant differences among light-felling intensity levels for the same item, while different lowercase letters indicate significant differences among items for the same light-felling intensity; p < 0.05).
References
- Liu, S.-R.; Sun, P.-S.; Wen, Y.-G. Comparative analysis of hydrological functions of major forest ecosystems in China. Chin. J. Plant Ecol. 2003, 27, 16. [Google Scholar] [CrossRef]
- Lawrence, D.; Coe, M.; Walker, W.; Verchot, L.; Vandecar, K. The unseen effects of deforestation: Biophysical effects on climate. Front. For. Glob. Chang. 2022, 5, 756115. [Google Scholar] [CrossRef]
- Han, C.; Chen, N.; Sun, S.; Zhao, C.-M. A review on hydrological mediating functions and mechanisms in forest ecosystems. Chin. J. Ecol. 2019, 38, 2191. [Google Scholar]
- Xiao, Q.; McPherson, E.G. Rainfall interception by Santa Monica’s municipal urban forest. Urban Ecosyst. 2002, 6, 291–302. [Google Scholar] [CrossRef]
- Sadeghi, S.M.M.; Attarod, P.; Van Stan II, J.T.; Pypker, T.G.; Dunkerley, D. Efficiency of the reformulated Gash’s interception model in semiarid afforestations. Agric. For. Meteorol. 2015, 201, 76–85. [Google Scholar] [CrossRef]
- Gerrits, A.; Pfister, L.; Savenije, H. Spatial and temporal variability of canopy and forest floor interception in a beech forest. Hydrol. Process. 2010, 24, 3011–3025. [Google Scholar] [CrossRef]
- Carlyle-Moses, D. Throughfall, stemflow, and canopy interception loss fluxes in a semi-arid Sierra Madre Oriental matorral community. J. Arid Environ. 2004, 58, 181–202. [Google Scholar] [CrossRef]
- Ahmadi, M.T.; Attarod, P.; MOHADJER, M.R.; Rahmani, R.; Fathi, J. Partitioning rainfall into throughfall, stemflow, and interception loss in an oriental beech (Fagus orientalis Lipsky) forest during the growing season. Turk. J. Agric. For. 2009, 33, 557–568. [Google Scholar] [CrossRef]
- Mazza, G.; Amorini, E.; Cutini, A.; Manetti, M.C. The influence of thinning on rainfall interception by Pinus pinea L. in Mediterranean coastal stands (Castel Fusano—Rome). Ann. For. Sci. 2011, 68, 1323–1332. [Google Scholar] [CrossRef]
- Sun, X.; Onda, Y.; Kato, H. Incident rainfall partitioning and canopy interception modeling for an abandoned Japanese cypress stand. J. For. Res. 2014, 19, 317–328. [Google Scholar] [CrossRef]
- Levia, D.F.; Carlyle-Moses, D.; Tanaka, T. Forest Hydrology and Biogeochemistry: Synthesis of Past Research and Future Directions; Springer Science & Business Media: Berlin/Heidelberg, Germany, 2011; Volume 216. [Google Scholar]
- Levia, D.F., Jr.; Frost, E.E. Variability of throughfall volume and solute inputs in wooded ecosystems. Prog. Phys. Geogr. 2006, 30, 605–632. [Google Scholar] [CrossRef]
- Dunkerley, D. Measuring interception loss and canopy storage in dryland vegetation: A brief review and evaluation of available research strategies. Hydrol. Process. 2000, 14, 669–678. [Google Scholar] [CrossRef]
- Johnson, M.S.; Lehmann, J. Double-funneling of trees: Stemflow and root-induced preferential flow. Ecoscience 2006, 13, 324–333. [Google Scholar] [CrossRef]
- Zhang, Y.; Wang, X.; Hu, R.; Pan, Y.; Paradeloc, M. Rainfall partitioning into throughfall, stemflow and interception loss by two xerophytic shrubs within a rain-fed re-vegetated desert ecosystem, northwestern China. J. Hydrol. 2015, 527, 1084–1095. [Google Scholar] [CrossRef]
- Crockford, R.; Richardson, D. Partitioning of rainfall into throughfall, stemflow and interception: Effect of forest type, ground cover and climate. Hydrol. Process. 2000, 14, 2903–2920. [Google Scholar] [CrossRef]
- Gash, J. An analytical model of rainfall interception by forests. Q. J. R. Meteorol. Soc. 1979, 105, 43–55. [Google Scholar] [CrossRef]
- Nanko, K.; Hotta, N.; Suzuki, M. Evaluating the influence of canopy species and meteorological factors on throughfall drop size distribution. J. Hydrol. 2006, 329, 422–431. [Google Scholar] [CrossRef]
- Deguchi, A.; Hattori, S.; Park, H.-T. The influence of seasonal changes in canopy structure on interception loss: Application of the revised Gash model. J. Hydrol. 2006, 318, 80–102. [Google Scholar] [CrossRef]
- Saito, T.; Matsuda, H.; Komatsu, M.; Xiang, Y.; Takahashi, A.; Shinohara, Y.; Otsuki, K. Forest canopy interception loss exceeds wet canopy evaporation in Japanese cypress (Hinoki) and Japanese cedar (Sugi) plantations. J. Hydrol. 2013, 507, 287–299. [Google Scholar] [CrossRef]
- Attiwill, P.M.; Leeper, G.W. Forest Soils and Nutrient Cycles; Melbourne University Press: Melbourne, Australia, 1987. [Google Scholar]
- Sato, Y.; Kumagai, T.O.; Kume, A.; Otsuki, K.; Ogawa, S. Experimental analysis of moisture dynamics of litter layers—The effects of rainfall conditions and leaf shapes. Hydrol. Process. 2004, 18, 3007–3018. [Google Scholar] [CrossRef]
- Du, J.; Niu, J.; Gao, Z.; Chen, X.; Zhang, L.; Li, X.; van Doorn, N.S.; Luo, Z.; Zhu, Z. Effects of rainfall intensity and slope on interception and precipitation partitioning by forest litter layer. Catena 2019, 172, 711–718. [Google Scholar] [CrossRef]
- Dunkerley, D. Percolation through leaf litter: What happens during rainfall events of varying intensity? J. Hydrol. 2015, 525, 737–746. [Google Scholar] [CrossRef]
- Sayer, E.J. Using experimental manipulation to assess the roles of leaf litter in the functioning of forest ecosystems. Biol. Rev. 2006, 81, 1–31. [Google Scholar] [CrossRef] [PubMed]
- Bruijnzeel, L.A. Hydrological functions of tropical forests: Not seeing the soil for the trees? Agric. Ecosyst. Environ. 2004, 104, 185–228. [Google Scholar] [CrossRef]
- Villegas, J.C.; Breshears, D.D.; Zou, C.B.; Law, D.J. Ecohydrological controls of soil evaporation in deciduous drylands: How the hierarchical effects of litter, patch and vegetation mosaic cover interact with phenology and season. J. Arid Environ. 2010, 74, 595–602. [Google Scholar] [CrossRef]
- Deng, W.; Zheng, X.; Xiao, S.; Chen, Q.; Gao, Y.; Zhang, L.; Huang, J.; Bai, T.; Xie, S.; Liu, Y. Effects of leaf type, litter mass and rainfall characteristics on the interception storage capacity of leaf litter based on process simulation. J. Hydrol. 2023, 624, 129943. [Google Scholar] [CrossRef]
- Van Dijk, A.I.; Keenan, R.J. Planted forests and water in perspective. For. Ecol. Manag. 2007, 251, 1–9. [Google Scholar] [CrossRef]
- Kramer, P.J.; Boyer, J.S. Water Relations of Plants and Soils; Academic Press: Cambridge, MA, USA, 1995. [Google Scholar]
- Gómez-Plaza, A.; Martınez-Mena, M.; Albaladejo, J.; Castillo, V. Factors regulating spatial distribution of soil water content in small semiarid catchments. J. Hydrol. 2001, 253, 211–226. [Google Scholar] [CrossRef]
- Moreno-de las Heras, M.; Nicolau, J.M.; Merino-Martín, L.; Wilcox, B.P. Plot-scale effects on runoff and erosion along a slope degradation gradient. Water Resour. Res. 2010, 46. [Google Scholar] [CrossRef]
- Neris, J.; Tejedor, M.; Rodríguez, M.; Fuentes, J.; Jiménez, C. Effect of forest floor characteristics on water repellency, infiltration, runoff and soil loss in Andisols of Tenerife (Canary Islands, Spain). Catena 2013, 108, 50–57. [Google Scholar] [CrossRef]
- Li, X.; Xiao, Q.; Niu, J.; Dymond, S.; McPherson, E.G.; van Doorn, N.; Yu, X.; Xie, B.; Zhang, K.; Li, J. Rainfall interception by tree crown and leaf litter: An interactive process. Hydrol. Process. 2017, 31, 3533–3542. [Google Scholar] [CrossRef]
- Martín-Benito, D.; Del Río, M.; Heinrich, I.; Helle, G.; Cañellas, I. Response of climate-growth relationships and water use efficiency to thinning in a Pinus nigra afforestation. For. Ecol. Manag. 2010, 259, 967–975. [Google Scholar] [CrossRef]
- Chase, C.W.; Kimsey, M.J.; Shaw, T.M.; Coleman, M.D. The response of light, water, and nutrient availability to pre-commercial thinning in dry inland Douglas-fir forests. For. Ecol. Manag. 2016, 363, 98–109. [Google Scholar] [CrossRef]
- Whitehead, D.; Kelliher, F. A canopy water balance model for a Pinus radiata stand before and after thinning. Agric. For. Meteorol. 1991, 55, 109–126. [Google Scholar] [CrossRef]
- del Campo, A.D.; González-Sanchis, M.; Lidón, A.; Ceacero, C.J.; García-Prats, A. Rainfall partitioning after thinning in two low-biomass semiarid forests: Impact of meteorological variables and forest structure on the effectiveness of water-oriented treatments. J. Hydrol. 2018, 565, 74–86. [Google Scholar] [CrossRef]
- Ma, C.; Luo, Y.; Shao, M. Comparative modeling of the effect of thinning on canopy interception loss in a semiarid black locust (Robinia pseudoacacia) plantation in Northwest China. J. Hydrol. 2020, 590, 125234. [Google Scholar] [CrossRef]
- Sun, X.; Onda, Y.; Kato, H.; Gomi, T.; Komatsu, H. Effect of strip thinning on rainfall interception in a Japanese cypress plantation. J. Hydrol. 2015, 525, 607–618. [Google Scholar] [CrossRef]
- Ruprecht, J.; Schofield, N.; Crombie, D.; Vertessy, R.A.; Stoneman, G. Early hydrological response to intense forest thinning in southwestern Australia. J. Hydrol. 1991, 127, 261–277. [Google Scholar] [CrossRef]
- Bréda, N.; Granier, A.; Aussenac, G. Effects of thinning on soil and tree water relations, transpiration and growth in an oak forest (Quercus petraea (Matt.) Liebl.). Tree Physiol. 1995, 15, 295–306. [Google Scholar] [CrossRef]
- Molina, A.J.; del Campo, A.D. The effects of experimental thinning on throughfall and stemflow: A contribution towards hydrology-oriented silviculture in Aleppo pine plantations. For. Ecol. Manag. 2012, 269, 206–213. [Google Scholar] [CrossRef]
- Aussenac, G.; Granier, A. Effects of thinning on water stress and growth in Douglas-fir. Can. J. For. Res. 1988, 18, 100–105. [Google Scholar] [CrossRef]
- Simonin, K.; Kolb, T.; Montes-Helu, M.; Koch, G. The influence of thinning on components of stand water balance in a ponderosa pine forest stand during and after extreme drought. Agric. For. Meteorol. 2007, 143, 266–276. [Google Scholar] [CrossRef]
- Baker, M.B., Jr. Effects of ponderosa pine treatments on water yield in Arizona. Water Resour. Res. 1986, 22, 67–73. [Google Scholar] [CrossRef]
- Komatsu, H.; Kume, T.; Otsuki, K. The effect of converting a native broad-leaved forest to a coniferous plantation forest on annual water yield: A paired-catchment study in northern Japan. For. Ecol. Manag. 2008, 255, 880–886. [Google Scholar] [CrossRef]
- Yang, H.; Choi, H.T.; Lim, H. Effects of forest thinning on the long-term runoff changes of coniferous forest plantation. Water 2019, 11, 2301. [Google Scholar] [CrossRef]
- Roig, S.; del Río, M.; Cañellas, I.; Montero, G. Litter fall in Mediterranean Pinus pinaster Ait. stands under different thinning regimes. For. Ecol. Manag. 2005, 206, 179–190. [Google Scholar] [CrossRef]
- Pereira, L.C.; Balbinot, L.; Lima, M.T.; Bramorski, J.; Tonello, K.C. Aspects of forest restoration and hydrology: The hydrological function of litter. J. For. Res. 2022, 33, 543–552. [Google Scholar] [CrossRef]
- Ares, A.; Neill, A.R.; Puettmann, K.J. Understory abundance, species diversity and functional attribute response to thinning in coniferous stands. For. Ecol. Manag. 2010, 260, 1104–1113. [Google Scholar] [CrossRef]
- Slodicak, M.; Novak, J.; Dusek, D. Canopy reduction as a possible measure for adaptation of young Scots pine stand to insufficient precipitation in Central Europe. For. Ecol. Manag. 2011, 262, 1913–1918. [Google Scholar] [CrossRef]
- Bäumler, R.; Zech, W. Atmospheric deposition and impact of forest thinning on the throughfall of mountain forest ecosystems in the Bavarian Alps. For. Ecol. Manag. 1997, 95, 243–251. [Google Scholar] [CrossRef]
- Wang, Y. Broadleaved Korean Pine Forests; Northeast Forestry University Press: Harbin, China, 1995. [Google Scholar]
- Chen, D.; Zhou, X.; Ding, B.; Hu, Z. Research on natural secondary forest in Heilongjiang Province (II)—Dynamic management system. J. Northeast. For. Coll. 1985, 13, 1–18. [Google Scholar]
- Han, Y.; Mu, C.; Zhuang, C.; Zhang, L.; Tong, J. Effects of light-felling on carbon budget of mid-term Korean pine forests by planting coni-fer and reserving broad-leaved tree in Changbai Mountains of China. Chin. J. Ecol. 2014, 33, 2296–2307. [Google Scholar] [CrossRef]
- Zhang, X.; Mu, C.; Zhang, X.; Han, Y. Effect of liberation cutting on the soil carbon storage of a Korean pine forest restored by planting conifers and reserving broad-leaved trees in Changbai Mountains of China. J. Beijing For. Univ. 2015, 37, 22–30. [Google Scholar] [CrossRef]
- Wang, Y.; Mu, C.; Yang, Z.; Liu, T.; Li, X. Effects of release cutting intensity on the carbon storage of Korean pine forests by planting conifer and reserving broadleaved trees in Xiaoxingan Mountains of northeastern China. J. Beijing For. Univ. 2021, 43, 54–64. [Google Scholar]
- Fang, J.; Wang, X.; Shen, Z.; Tang, Z.; He, J.; Yu, D.; Jiang, Y.; Wang, Z.; Zheng, C.; Zhu, J.; et al. Methods and protocols for plant community inventory. Biodivers. Sci. 2009, 17, 533–548. [Google Scholar] [CrossRef]
- Fries, J. Growth Models for Tree and Stand Simulation; Skogshögskolan: Umea, Sweden, 1974. [Google Scholar]
- Meng, X. Tree Surveying; China Forestry Publishing House: Beijing, China, 2009. [Google Scholar]
- Sun, J.; Yu, X.; Wang, H.; Jia, G.; Zhao, Y.; Tu, Z.; Deng, W.; Jia, J.; Chen, J. Effects of forest structure on hydrological processes in China. J. Hydrol. 2018, 561, 187–199. [Google Scholar] [CrossRef]
- Zagyvainé Kiss, K.A.; Kalicz, P.; Csáfordi, P.; Gribovszki, Z. Forest Litter Interception Model for a Sessile Oak Forest. Acta Silv. Lign. Hung. 2014, 10, 91–101. [Google Scholar] [CrossRef]
- Yang, J.; Wang, A.; Shen, L.; Dai, G.; Liu, Y.; Zhang, Y.; Fei, W.; Wu, J. The Impact of Canopy on Nutrient Fluxes through Rainfall Partitioning in a Mixed Broadleaf and Coniferous Forest. Forests 2024, 15, 623. [Google Scholar] [CrossRef]
- Levia, D.F.; Germer, S. A review of stemflow generation dynamics and stemflow-environment interactions in forests and shrublands. Rev. Geophys. 2015, 53, 673–714. [Google Scholar] [CrossRef]
- Holder, C.D. Effects of leaf hydrophobicity and water droplet retention on canopy storage capacity. Ecohydrology 2013, 6, 483–490. [Google Scholar] [CrossRef]
- Roberts, J. The influence of physical and physiological characteristics of vegetation on their hydrological response. Hydrol. Process. 2000, 14, 2885–2901. [Google Scholar] [CrossRef]
- Richardson, A.D.; O’Keefe, J. Phenological differences between understory and overstory: A case study using the long-term Harvard Forest records. In Phenology of Ecosystem Processes; Noormets, A., Ed.; Springer: New York, NY, USA, 2009; pp. 87–117. [Google Scholar] [CrossRef]
- Zagyvai-Kiss, K.A.; Kalicz, P.; Szilágyi, J.; Gribovszki, Z. On the specific water holding capacity of litter for three forest ecosystems in the eastern foothills of the Alps. Agric. For. Meteorol. 2019, 278, 107656. [Google Scholar] [CrossRef]
- Zhou, Q.; Keith, D.M.; Zhou, X.; Cai, M.; Cui, X.; Wei, X.; Luo, Y. Comparing the water-holding characteristics of broadleaved, coniferous, and mixed forest litter layers in a Karst Region. Mt. Res. Dev. 2018, 38, 220–229. [Google Scholar] [CrossRef]
- Lousier, J.; Parkinson, D. Litter decomposition in a cool temperate deciduous forest. Can. J. Bot. 1976, 54, 419–436. [Google Scholar] [CrossRef]
- Marin, C.T.; Bouten, I.; Dekker, S. Forest floor water dynamics and root water uptake in four forest ecosystems in northwest Amazonia. J. Hydrol. 2000, 237, 169–183. [Google Scholar] [CrossRef]
- Zhao, L.; Meng, P.; Zhang, J.; Zhang, J.; Sun, S.; He, C. Effect of slopes on rainfall interception by leaf litter under simulated rainfall conditions. Hydrol. Process. 2022, 36, e14659. [Google Scholar] [CrossRef]
- Aerts, R. Climate, leaf litter chemistry and leaf litter decomposition in terrestrial ecosystems: A triangular relationship. Oikos 1997, 79, 439–449. [Google Scholar] [CrossRef]
- Cornejo, F.H.; Varela, A.; Wright, S.J. Tropical forest litter decomposition under seasonal drought: Nutrient release, fungi and bacteria. Oikos 1994, 70, 183–190. [Google Scholar] [CrossRef]
- Misson, L.; Tang, J.; Xu, M.; McKay, M.; Goldstein, A. Influences of recovery from clear-cut, climate variability, and thinning on the carbon balance of a young ponderosa pine plantation. Agric. For. Meteorol. 2005, 130, 207–222. [Google Scholar] [CrossRef]
- Bosch, J.M.; Hewlett, J. A review of catchment experiments to determine the effect of vegetation changes on water yield and evapotranspiration. J. Hydrol. 1982, 55, 3–23. [Google Scholar] [CrossRef]
- Chandler, K.; Stevens, C.; Binley, A.; Keith, A. Influence of tree species and forest land use on soil hydraulic conductivity and implications for surface runoff generation. Geoderma 2018, 310, 120–127. [Google Scholar] [CrossRef]
- Vafakhah, M.; Karamizad, F.; Sadeghi, S.; Noor, H. Spatial variations of runoff generation at watershed scale. Int. J. Environ. Sci. Technol. 2019, 16, 3745–3760. [Google Scholar] [CrossRef]
- Jensen, M.E.; Haise, H.R. Estimating evapotranspiration from solar radiation. J. Irrig. Drain. 1963, 89, 15–41. [Google Scholar] [CrossRef]
- Cheng, X.; Bai, Y.; Zhu, J.; Han, H. Effects of forest thinning on interception and surface runoff in Larix principis-rupprechtii plantation during the growing season. J. Arid Environ. 2020, 181, 104222. [Google Scholar] [CrossRef]
- Gartner, T.B.; Cardon, Z.G. Decomposition dynamics in mixed-species leaf litter. Oikos 2004, 104, 230–246. [Google Scholar] [CrossRef]
Disclaimer/Publisher’s Note: The statements, opinions and data contained in all publications are solely those of the individual author(s) and contributor(s) and not of MDPI and/or the editor(s). MDPI and/or the editor(s) disclaim responsibility for any injury to people or property resulting from any ideas, methods, instructions or products referred to in the content. |
© 2025 by the authors. Licensee MDPI, Basel, Switzerland. This article is an open access article distributed under the terms and conditions of the Creative Commons Attribution (CC BY) license (https://creativecommons.org/licenses/by/4.0/).