Abstract
Negative air ions (NAIs) can purify the atmosphere and maintain human health. In this study, we selected six tree species, Pinus tabuliformis, Pinus bungeana, Acer truncatum, Sophora japonica, Koelreuteria paniculata, Quercus variabilis, Robinia pseudoacacia, and Populus tomentosa, and we established for the first time five “capacity indicators” to characterize and judge the capacity of plants to release negative ions: they comprised the release contribution rate L, release coefficient n, release rate s, instantaneous current number v, and total level of release Z. These indicators were used to assess the ability of the plants to release NAIs by themselves. The results showed the following. (1) The daily variations in L and n show “W” and “concave” shapes, respectively, and the contribution capacity at night is significantly higher than that during the day. The diurnal variations in s, v, and Z all showed a “bimodal” pattern. The NAI release rate and release level of each tree species during the day were significantly higher than those at night. (2) The trees released the most NAIs during the day at approximately 10:00, while Robinia pseudoacacia and Populus tomentosa peaked with a 2 h lag (12:00). The NAI release capacity of each tree species was the worst at 13:00. (3) During the growing season, the self-contribution effects L and n of the plants were the strongest in May. The release rates and release levels s, v, and Z were the lowest in August. The coniferous plants released NAIs at the fastest rate in September and broad-leaved plants in July, with the highest release levels. In this study, the plants released the most NAIs from 10:00 a.m. to 11:00 a.m., which is the best time to travel. Quercus variabilis was preferentially recommended in the pairing of species of tree with the quickest NAI release and the highest total number released, followed by Koelreuteria paniculata and Sophora japonica.
1. Introduction
With the accelerated development of urbanization, environmental issues are increasingly receiving widespread attention, and the concentration of negative air ions (NAIs) has become one of the important indicators in the national “Outline of the Plan for Promoting the Construction of Ecological Civilization (2013–2020),” which has played a significant role in improving environmental quality [1,2,3,4,5] and human health [6,7]. Studies have shown that increasing the coverage and quality of urban forests and gardens and green spaces are key ways to enhance the environment [8,9,10,11]. Because of the strong characteristics of NAIs themselves, the rate of production and extinction is extremely quick, and they cannot be easily captured. The mechanism by which plants release NAIs from plants is extremely complex. The natural environmental conditions change rapidly, and this release is co-regulated by a variety of biotic and abiotic factors. Thus, it is difficult to distinguish the contributions of plants themselves. Therefore, scientific evaluation of the ability of plants to release NAIs and the search for high-quality greening species of tree with a strong ability to release these ions has become a hot topic and one of urgent concern.
According to the current status of related research in China and throughout the world, the process of releasing NAIs from green plants is highly complex. The characteristics vary at different spatial and temporal scales, and the release is affected by a variety of factors [12,13]. The primary focus is currently on the continuous monitoring of NAI concentrations (NAICs) in the wild natural environment, such as urban forests, green spaces, and plant communities [6,14,15,16,17,18]. There has been minimal research on the mechanism that green plants use to release NAIs by themselves at the scale of a single tree. Thus, there is an urgent need for relevant studies in controlled environments. An open-top chamber (OTC) is considered to be an important mechanism to conduct research on the community-scale to individual-scale crossing, which can effectively isolate the external environment, exclude disruption from the natural environment, and capture the NAI ability of plants. Most of the research has utilized simple numerical values to evaluate the effect of NAIs released from plants. It is difficult to distinguish the ability of plants to produce NAIs and an even greater lack of uniform and comparable judgement indices. In this study, we established a new system to evaluate the ability to release NAIs, comprising the release contribution rate L, the release coefficient n, the release rate s, the instantaneous current number v, and the total level of release Z. The system is based on the following criteria. To this end, this study was conducted to investigate the ability of plants to release NAIs at the scale of a single tree using the OTC control method in a more precise and controlled semi-natural state and five “capacity indicator” methods of evaluation. This study can provide scientific theoretical guidance to select and configure species of garden trees, enhance regional planning, improve the coverage provided by garden greening, inject more negative ions into the atmospheric environment, build a high-quality environment, and create a more livable ecological environmental place.
2. Materials and Methods
2.1. Overview of the Study Site and Selection of Species of Tree
The experimental site was located in the experimental base of the Institute of Forestry and Fruit Tree Research, Beijing Academy of Agricultural and Forestry Sciences (latitude 39°58′01″ N, longitude 116°13′02″ E), which is located at the foot of Fragrant Hill in Beijing, China. It is adjacent to Xishan Mountain and has a warm–temperate continental monsoon climate with four distinct seasons, with high temperatures and heavy rainfall in the summer, cold and dry winters, and short springs and autumns, with extremely uneven precipitation. The average annual temperature is 16.2 °C, and the annual precipitation is approximately 484 mm [12].
Two evergreen species of conifers were selected for this study in Beijing, namely, Pinus tabuliformis Carrière and Pinus bungeana Zucc. ex Endl. Six deciduous broadleaf tree species were selected, namely, Acer truncatum Bunge, Styphnolobium japonicum (L.) Schott, Koelreuteria paniculata Laxm., Quercus variabilis Bl., Robinia pseudoacacia Linn. sp. Pl., and Populus tomentosa Carr. The species of trees that were selected are the key species that have been recommended for the plains afforestation project in Beijing and have certain universality and application value in landscaping. The selected species were all well-grown, had a consistent shape and did not harbor any pests or diseases. Plants that were three years old were planted in 25 cm high pots that were 23.5 cm wide at their top and 19 cm wide at their base (Table 1). There was a 3:1 ratio of substrate/soil in the test base after cultivation to adapt to the start of the experiment (Table 2).

Table 1.
Overview of the experimental species of tree.
Table 2.
Basic properties of soil.
2.2. Research Methodology
2.2.1. Test Setup
A semi-closed device—an OTC—was used, so that the plants in the box and the external environment were isolated to some degree (Figure 1). This effectively reduced the interference of external environmental factors and was closed around the upper part of the open top to ensure that the plants could conduct normal respiration. The height of the OTC was approximately 2.5 m, and the primary structure was composed of a stainless steel tube and colorless transparent glass. An electrically insulating polytetrafluoroethylene (PTFE) film was pasted onto the inside of the chamber wall to ensure a relatively stable testing environment with little external interference. There was a 0.2 m diameter test hand entrance at 0.5 m from the ground on each side of the east and west sides of the OTC, which enabled the maintenance and determination of the instrument during the experiment.
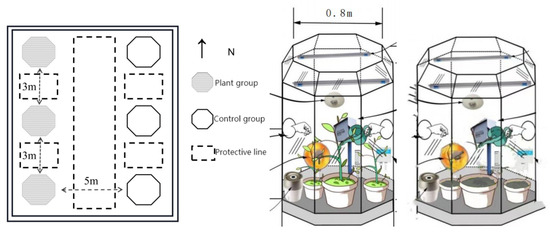
Figure 1.
Schematic diagram of the OTC experimental setup. OTC, open-top chamber.
2.2.2. Test Methods
The experiment was chosen to be conducted during the growing season from May to October. We selected potted plants that had been slowed down and treated in the previous period, and put 3 OTC clocks into 6 pots each of the same tree species for 3 replications for the test group. The other 3 OTC clocks were placed in the same number of pots with soil as the control group. The outer surface of the pots in both the test and blank control groups were wrapped with PTFE film to reduce the experimental error.
Translated with DeepL.com (free version) Before the beginning of the experiment, the dust on the leaf surface was washed off with a sprayer, and the surface was dried. We then wiped the surface of the leaves with a wet towel, and then wrapped the pots in PTFE film, and the control group (the same specification of flower pots with soil) was treated synchronously, and the height and diameter at breast height of the plants were measured. The plants were placed from the upper part of the open-top box, and counting was started after the plants were stabilized for 2 h. NAIs were observed for 3 consecutive days for each species, and 24 h NAIC data were collected from 8:00 every day to 8:00 the next day, during which time the temperature and humidity settings inside the open-top box were kept the same as those outside the box, and the room was left empty for 24 h after the monitoring was completed, and the next batch of species were rotated until testing of all 8 experimental species had been completed.
2.2.3. NAI Monitoring and Data Processing
The monitoring of negative air ions by negative ion instruments, data processing and evaluation methods, and other technical requirements were handled using the specifications of the Technical Specification for Observation of Negative (Oxygen) Ion Concentration of Air (LY/T 2586-2016) [19] issued by the State Forestry Administration (SFA) in 2016. Inside each OTC, one set of a negative ion automatic monitoring system (model: AQ3600, Thermo Fisher Scientific, Waltham, MA, USA) was placed, and there was an internal GPRS remote transmission module, which transmitted the data directly to a cell phone server. The instrument primarily measured the concentration of small-sized atmospheric negative ions with an ion mobility ≥ 0.7 ion·cm−3·v−1·s−1, with a measurement range of 0~5.0 × 10⁶ ion·cm−3 and an error of ≤5% in the measurement of ion concentration. The collection interval was set to 5 min time−1. The height of NAI measurement was adjusted in parallel with the growth of the different species of trees, which was the average height of the growth of the tree measured. After each species had been monitored, the empty chamber was used for 24 h for the next batch of trees to reduce the influence on the results of the next test. The NAI measurement heights of the blank control group were synchronized with those of the planted test group.
For the NAI data processing, the NAI data obtained at the end of the test were processed using the specifications of the Technical Specification for the Observation of Negative (Oxygen) Ion Concentration in Air (LY/T 2586-2016) issued by the State Forestry Administration in 2016. The NAI data were screened and organized using Microsoft Excel 2010 (Redmond, WA, USA), and the screening methods were as follows: (1) Abnormal data owing to instrument failure were discarded; (2) Multiple consecutive identical values were discarded; (3) The difference between the front and back values was three times or less than 1/3; and (4) Missing values were filled in by interpolation [20]. SPSS 26.0 was used to analyze the variance between the five capacity indicators. A Pearson correlation was used for the solar radiation and temperature, and Origin 2021Pro (OriginLab, Northampton, MA, USA) was used to plot the release characteristics of the five capacity indicators and the linear fit with solar radiation and temperature.
2.2.4. Construction and Establishment of the Model for the “Five Capability Indicators”
Based on the annual NAI model of forest ecosystems proposed by Wang et al. [21], and the value model proposed by Li Shaoning [22], five capacity indicators for the NAI forest release were extended and established. These indicators were used as unified and comparable judgment indicators to evaluate the level of contribution of the forest itself and the ability of forests to release NAIs.
For the indicator model and parameters, the following equations were used.
Release contribution rate: L = (GTreat − GCK)/GTreat × 100%
The number of NAIs released by the plant as a percentage of the total number of NAIs is used to describe the overall release effect of the plant, i.e., the size of the plant’s contribution to the total NAIC.
Here, GTreat is the average NAIC value during this period in the forest (number/cm3), and GCK is the average NAIC value (number/cm3) in the open area outside the forest during this period.
Release coefficient: n = (GTreat − GCK)/GCK × 100%
The ratio of the number of NAIs released by the forest to the number of blank control groups, i.e., the ability of the forest to release NAI immediately (%).
Here, GTreat is the average NAIC value during this period in the forest (number/cm3), and GCK is the average NAIC value (number/cm3) in the open area outside the forest during this period.
Release rate: s = (GTreat − GCK) × S1 × h/(t survival × LAI × S2)
The number of NAI increases per unit leaf area per unit time in a forest, i.e., the rate of NAI release from the forest (number/cm2/min).
Here, GTreat is the average NAIC value during this period in the forest (number/cm3); GCK is the average NAIC value of the open area outside the forest during this period (number/cm3); t is the sampling frequency (min) for this period of time; LAI is the leaf area index; min is the survival time of the NAIs in the air; S1 is the area occupied by the experimental site; h is the average tree height of the forest stand; and S2 is the area occupied by the forest stand area of the experimental site.
Instantaneous stock on hand: v = (GTreat − GCK) × S1 × h/(LAI × S2)
The difference between the number of NAI released by a forest per unit area and the number of blank groups represents the effect of the NAIs released by the forest at a certain moment (number/cm2).
Here, GTreat is the average value of the NAICs during this period in the forest (number/cm3); GCK is the average value of the NAICs in the open area outside the forest during this period (number/cm3); LAI is the leaf area index; S1 is the area occupied by the experimental site; h is the average tree height of the forest stand; and S2 is the area occupied by the forest stand area of the experimental site.
Total Release: Z = (GTreat − GCK) × S1 × h × Total T/(t Survival × LAI × S2)
This represents the number of NAIs released per unit area of a forest, which is the total number of NAIs released by the forest during a period of time (number/cm2).
In the formula, GTreat is the average NAIC value during this period in the forest (number/cm3); GCK is the average NAIC value of the open area outside the forest during this period (number/cm3); T is the sampling frequency (min) for this period of time; LAI is the leaf area index; min is the survival time of the NAIs in the air; S1 is the area occupied by the experimental site; h is the average tree height of the forest stand; and S2 is the area occupied by the forest stand area of the experimental site.
2.2.5. Assumptions Based on the Evaluation Index System Model
Continuous observation of the NAICs inside and outside the forest in the study area enabled the establishment of a model of the changes (Figure 2). The daily trend of fluctuation was found to exhibit a “bimodal” pattern, with higher NAIC values both inside and outside the forest during the noon and evening. Based on this, we primarily hypothesized regarding the changing trends and interrelationships of the “five capacity indicators,” which have two hypothetical results:
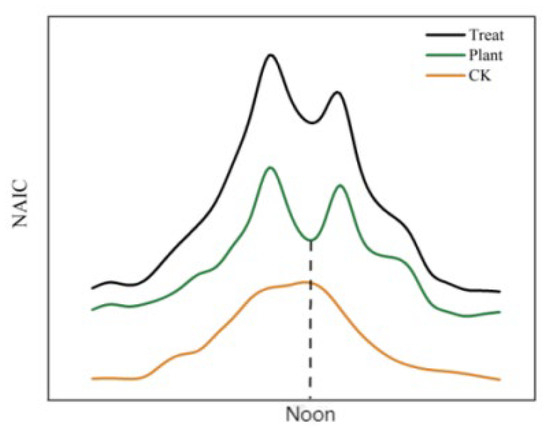
Figure 2.
NAIC variation model.
- (1)
- Linkage: The dynamic characteristics of L, n, s, v, and Z have a consistent trend of change, with one eliminating the other, and the other increasing;
- (2)
- Unilaterality: L, n, s, v, and Z tended to fluctuate inconsistently, with one fluctuating and the other increasing.
The purpose of this study was to ask the following questions based on the model of changes in the NAICs and the calculation of the parameters of the five “capacity indicators” and the relationship between them. (1) Are the respective trends of L (release contribution rate), n (release coefficient), s (release rate), v (instantaneous stock on hand), and Z (total release) consistent with the NAICs? and (2) Is there a consistent trend between L, n, s, v, and Z? It was applied to an artificially controlled open-top chamber (OTC) environment to test both of these results and to assess the effect of releasing NAIs from each species of tree using the total release parameter.
3. Results
3.1. Characteristics of the Daily NAI Release Capacity of Different Species of Trees
3.1.1. Daily Variation in the NAI Release Contribution L
As shown in Figure 3 and Table 3, there were significant differences in the contribution of the different species of trees to the release of NAIs. The conifers contributed significantly more to the total atmospheric NAIs than the broadleaf species. The range of contributions released from each species of tree during the growing season was as follows: Pinus tabuliformis (78.27%~80.76%), Pinus bungeana (76.56%~80.12%), Acer truncatum (73.76%~75.79%), Sophora japonica (72.86%~74.91%), Quercus variabilis (72.26%~74.21%), Koelreuteria paniculata (71.92%~73.34%), Robinia pseudoacacia (65.97%~71.61%), and Populus tomentosa (64.38%~67.67%).
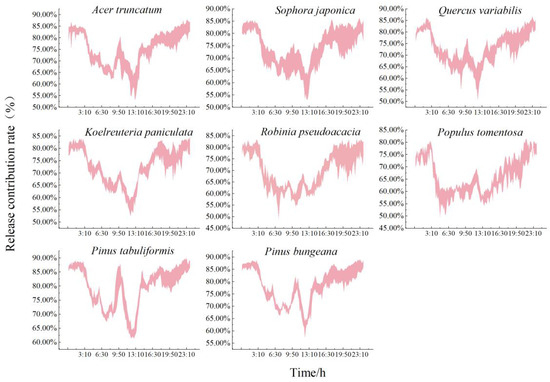
Figure 3.
Daily variation in the rate of NAIs released by typical green species of tree. NAIs, negative air ions.
Table 3.
Rate of contribution of the NAIs released from typical greening species of tree.
The trend of the contribution of each species of tree to the release of NAIs was relatively consistent, with a “W” shape. Overall, the ratio of the ability of the tree to contribute NAIs to the total contribution of NAIs was significantly higher at night than during the day. The change was smoother, with a continuous increase in the contribution capacity. The contribution capacity decreased at approximately 3:00 until after sunrise when the contribution capacity of each species of tree began to increase. Robinia pseudoacacia and Populus tomentosa reached their first peak at 12:00 (66.72% ± 1.49% and 64.35% ± 1.50%, respectively). The remaining broadleaf and conifer species contributed the most NAIs at 10:00, when Pinus tabuliformis had the highest contribution (83.10% ± 3.88%) and Populus tomentosa had the lowest (61.79% ± 1.50%). The maximum difference in the contribution capacity between the conifers and broadleaf species was 1.34-fold. The ability of each tree to contribute NAIs began to decrease at midday owing to the decrease in photosynthesis, which reached a trough at 13:00. The contributions of the conifer Pinus bungeana and the broadleaf species Koelreuteria paniculata were the lowest at this time (60.55% ± 3.46% and 56.02% ± 3.28%, respectively). There was then an upward trend, and the ability to contribute NAIs gradually increased.
There were inter-species differences in the magnitude of daily variation and diurnal release capacity, with distinct biological characteristics. The rate and magnitude of the increase after sunrise increased significantly more for the conifers than for the broadleaf species with an increase of approximately 1.82-fold. Differences in the ability to contribute NAIs between day and night were significantly higher for the broadleaf species than the conifers, and the day/night ratio of the contribution of each species to the release of NAIs was as follows: Robinia pseudoacacia (1.130) > Koelreuteria paniculata (1.122) > Populus tomentosa (1.116) > Acer truncatum (1.108) > Quercus variabilis (1.104) > Sophora japonica (1.103) > Pinus bungeana (1.092) > Pinus tabuliformis (1.077). Robinia pseudoacacia contributed the most NAIs at night and Pinus tabuliformis the least compared to their daytime contributions.
3.1.2. Daily Variation in the Release Coefficient n of the NAIs
As shown in Figure 4 and Table 4, the daily variation in the coefficients of the number of NAIs released by each species of tree was characterized. The conifers immediately released significantly more NAIs than the broadleaf species, and the immediate ability of each species of tree to release NAIs was in the order Pinus tabuliformis (4.47 ± 0.69) > Pinus bungeana > Acer truncatum > Sophora japonica > Quercus variabilis > Koelreuteria paniculata > Robinia pseudoacacia > Populus tomentosa (2.12 ± 0.29). The range of the ability to immediately release NAIs for each species of tree during the growing season was Pinus tabuliformis (4.02~5.06), Pinus bungeana (3.59~4.84), Acer truncatum (3.16~3.71), Sophora japonica (2.95~3.47), Quercus variabilis (2.83~3.31), Koelreuteria paniculata (2.73~3.11), Robinia pseudoacacia (2.07~2.96), and Populus tomentosa (1.91~2.31). Overall, the release coefficients of all the species of trees were higher at night than during the day, but there were significant inter-species differences in the daily trends. The broadleaf species released fewer NAIs, and the number released increased less after sunrise, which was significantly lower than that of the conifers. The daily variation in the broadleaf species was almost in a “concave” shape, with the capacity of the immediate release of NAIs gradually decreasing from 3:00 to 7:00. Most of the broadleaf species released the greatest number of NAIs at 10:00. Populus tomentosa released the highest number immediately (3.13 ± 1.03), which was 2.41-fold higher than that of the species of trees that released the least. Robinia pseudoacacia and Populus tomentosa had a lag in their release and released the most in the day at 12:00 (1.81 ± 0.12 and 1.62 ± 0.10, respectively). However, the time of the lowest instantaneous ability to release NAIs was the same for all the broadleaf species (13:00), with a range of 1.30 to 1.48 releases.
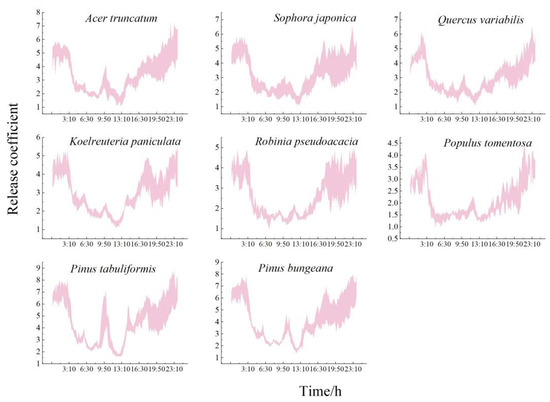
Figure 4.
Daily variation in the NAI release coefficient of typical greening species of tree.
Table 4.
NAI release coefficients of typical greening species of tree.
The daily trends of the conifers were consistent, while those of the broadleaf species varied. The diurnal variation trend of the conifers showed a “W” shape, and the increase in the rate after sunrise was significantly enhanced. It was 2.39-fold greater than those of the broadleaf trees. The highest and lowest moments of immediate release capacity during the day occurred at 10:00 and 13:00, respectively. The release range was 3.82~5.58 and 1.70~1.99, respectively, and the release capacity was 2.35 times and 1.32 times that of the broadleaf species of trees.
The immediate ability of the trees to release NAIs differed significantly between the day and night, and they were able to release significantly more at night than in the day. The diurnal ratio of the NAI release ability of each species was as follows: Pinus bungeana (1.64) > Acer truncatum (1.63) > Robinia pseudoacacia (1.61) > Quercus variabilis (1.58) > Populus tomentosa (1.57) > Pinus tabuliformis (1.54) > Koelreuteria paniculata (1.52) > Sophora japonica (1.36). Pinus bungeana had the greatest difference in its diurnal release capacity, while Sophora japonica had the least.
3.1.3. Daily Change in the NAI Release Rate s
As shown in the daily trend of the NAI release rate for each species in Figure 5, the conifers released significantly more NAIs than the broadleaf species. Each species of tree showed a rate of NAI release as follows: Pinus bungeana (2.26 × 10³ ± 0.23 × 10³ ion·cm−2·min−1) > Pinus tabuliformis > Quercus variabilis > Koelreuteria paniculata > Sophora japonica > Robinia pseudoacacia > Populus tomentosa > Acer truncatum (0.88 × 10³ ± 0.14 × 10³ ion·cm−2·min−1). The rates of NAIs released from the conifers during the growing season were 1.16 × 10³~2.33 × 10³ ion·cm−2·min−1, while the broadleaf species released NAIs at a rate of 0.80 × 10³~1.26 × 10³ ion·cm−2·min−1.
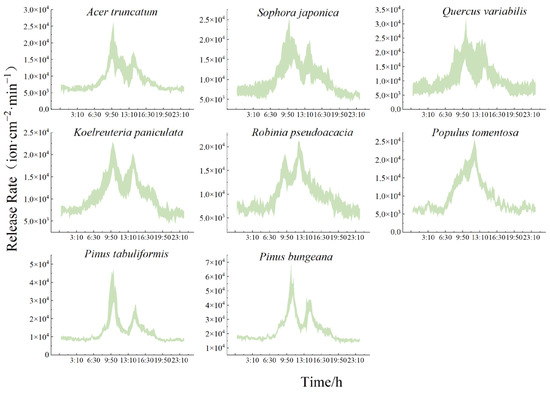
Figure 5.
Daily variation in the NAI release rate from typical greening species of trees.
There was both consistency and variability in the rate of NAIs released from each species, and the daily trends in the release rates of different species showed a “bimodal” pattern. However, the species varied in the time it took them to reach the peak. Overall, the rate of NAI release was significantly higher during the day than at night for all the species of trees, and the changes were all smoother during the night. The rate of release by the broadleaf species at night consistently fluctuated within 0.63 × 10³~0.77 × 10³ ion·cm−2·min−1. The conifers released 0.87 × 10³ to 1.63 × 10³ ion·cm−2·min−1. The release rates of the individual species of tree began to intensify after daylight. This was primarily owing to the influence of solar radiation. Robinia pseudoacacia and Populus tomentosa showed an advance and lag in the timing of peaks and troughs compared to the other species. They had quicker release rates at 12:00 and 10:00 (1.95 × 10³ ± 0.17 × 10³ ion·cm−2·min−1, 1.59 × 10³ ± 0.26 × 10³ ion·cm−2·min−1: 2.28 × 10³ ± 0.30 × 10³ ion·cm−2·min−1, and 1.76 × 10³ ± 0.28 × 10³ ion·cm−2·min−1), while the 10:30 release rate was the slowest (1.29 × 10³ ± 0.13 × 10³ ion·cm−2·min−1 and 1.68 × 10³ ± 0.27 × 10³ ion·cm−2·min−1, respectively). All the other species of trees had peaks at 10:00 and 14:00, and a trough at 13:00. Quercus variabilis has the quickest release rate (2.37 × 10³ ± 0.63 × 10³ ion·cm−2·min−1), which was approximately 1.14-fold that of the slowest release rate that was observed in Populus tomentosa.
Conifers have strong biological characteristics(Table 5). They are affected by solar radiation and other influences, and the average rate of increase min−1 after sunrise was extremely fast. It was approximately 68% higher than that of the broadleaf species and increased in nearly a straight line, and the rate of release in the afternoon dramatically decreased quickly. The minimum daytime release rates were all significantly higher than the nighttime release rates for the broadleaf species and almost the same as at night for the conifers. Each species of tree had the following rate of increase after sunrise: Pinus tabuliformis (392%), Pinus bungeana (261%), Acer truncatum (239%), Quercus variabilis (210%), Sophora japonica (187%), Populus tomentosa (181%), Robinia pseudoacacia (129%), and Koelreuteria paniculata (110%). Acer truncatum had the quickest rate of increase among the broadleaf species, followed by Quercus variabilis, while Koelreuteria paniculata had the lowest.
Table 5.
Release rates of NAIs by typical greening species of trees.
3.1.4. Instantaneous Stock vs. Daily Change
As shown in Figure 6, the daily variation in the NAI transient inventory for each species of tree is characterized by a “bimodal” pattern, which is consistent with the trend of the release rate. The daily average of NAI instantaneous stock of the release of NAIs for each species of tree was as follows: Pinus bungeana (22.59 ± 2.27 × 10³ ion·cm−2) > Pinus tabuliformis > Quercus variabilis > Koelreuteria paniculata > Sophora japonica > Robinia pseudoacacia > Populus tomentosa > Acer truncatum (8.82 ± 1.35 × 10³ ion·cm−2). The range of the NAI release rates from the conifers during the growing season was 11.55 × 10³~23.26 × 10³ ion·cm−2·min−1, while the rate of NAI release from the broadleaf species ranged from 7.34 × 10³~15.73 × 10³ ion·cm−2·min−1.
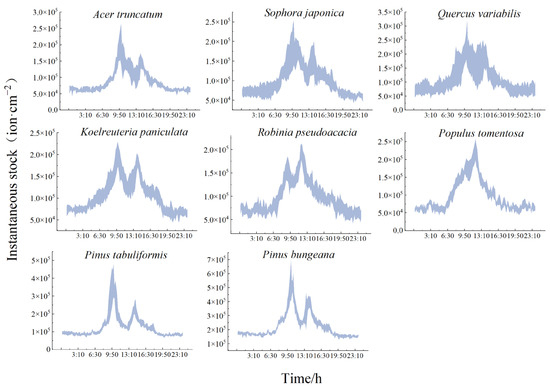
Figure 6.
Daily change in the NAI instantaneous existing stock of typical greening species of trees.
The daytime instantaneous current value was significantly higher than the nighttime value for all the species of trees, and the change was relatively smooth at night. The nighttime instantaneous current value for the broadleaf species fluctuated between 6.30 × 10³~7.67 × 10³ ion·cm−2 and 8.68 × 10³~16.32 × 10³ ion·cm−2 for the conifers. There were significant inter-species differences in the instantaneous stock, with a lag in the peaks of Robinia pseudoacacia and Populus tomentosa. The instantaneous stock reached its highest daytime value at 12:00 (19.54 × 10³ ± 1.74 × 10³ ion·cm−2 and 22.76 × 10³ ± 2.30 × 10³ ion·cm−2, respectively). The daytime low occurred at 10:30 (12.92 × 10³ ± 1.32 × 10³ ion·cm−2). The rest of the species reached their first peak at 10:00 and the trough at 13:00. Quercus variabilis had the highest instantaneous existing stock at the time of release. The peaks and troughs were 23.67 × 10³ ± 8.52 × 10³ ion·cm−2 and 14.35 × 10³ ± 5.80 × 10³ ion·cm−2, respectively. The conifers had significantly higher rates of increase than the broadleaf species, and the rate of increase was consistent with the rate of release. As shown in Table 6, the instantaneous existing stocks were not necessarily high for species with fast rates of increase.
Table 6.
NAI instantaneous existing stocks of typical greening species of trees.
3.1.5. Daily Changes in the Total Releases of Z
As shown in Figure 7, the daily trend of the total number of NAIs released hour−1 by each species of tree was found to be consistent with the release rate s and the instantaneous present number v, which also showed a “bimodal” pattern. The total number released by the conifers was significantly higher than that of the broadleaf species. Each species released significantly more during the day than at night, with a smooth trend at night that ranged from 37.82 × 10³ to 47.15 × 10³ ion·cm−2 for the broadleaf species, and from 52.06 × 10³ to 97.90 × 10³ ion·cm−2 for the conifers. As shown in Table 7, the total hourly releases of each species of tree showed a daily average, for daytime and nighttime, as follows: Pinus bungeana > Pinus tabuliformis > Quercus variabilis > Koelreuteria paniculata > Sophora japonica > Robinia pseudoacacia > Populus tomentosa > Acer truncatum. The range of total releases from the conifers during the growing season was 69.30 × 10³~139.53 × 10³ ion·cm−2·h−1, while the NAI release rate of the broadleaf species of tree was as follows: 46.56 × 10³~94.41 × 10³ ion·cm−2·h−1. The peaks of Robinia pseudoacacia and Populus tomentosa in the total level of release also had a lag, and the highest total number was released from 11:00 to 12:00 (121.32 × 10³ ± 11.90 × 10³ ion·cm−2 and 128.36 × 10³ ± 17.80 × 10³ ion·cm−2, respectively). The other species of trees released the most from 9:00 to 10:00, and the conifers released a total of 2.38-fold more than the broadleaf species of tree. The broadleaf tree species Quercus variabilis released a total of 1.25-fold more NAIs than Acer truncatum.
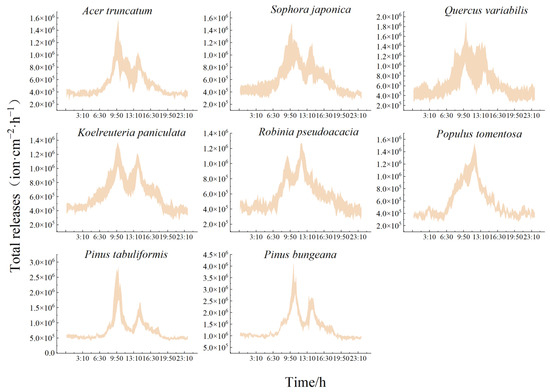
Figure 7.
Daily variation in the total NAIs released from typical greening species of trees.
Table 7.
Total number of NAIs released by typical greening species of trees.
3.2. Monthly Changes in the NAI Release Capacity of Different Species of Trees
A graph of the monthly trend of the five capacity indicators of the NAIs released from the different species of trees is shown in Figure 8. Overall, the release contribution L and the release coefficient n varied consistently from month to month and occurred in the following order: Pinus tabuliformis > Pinus bungeana > Acer truncatum > Sophora japonica > Quercus variabilis > Koelreuteria paniculata > Robinia pseudoacacia > Populus tomentosa. The release rate s, the instantaneous current number v, and the total number Z varied consistently and the species performed as follows: Pinus bungeana > Pinus tabuliformis > Quercus variabilis > Koelreuteria paniculata > Sophora japonica > Robinia pseudoacacia > Populus tomentosa > Acer truncatum.
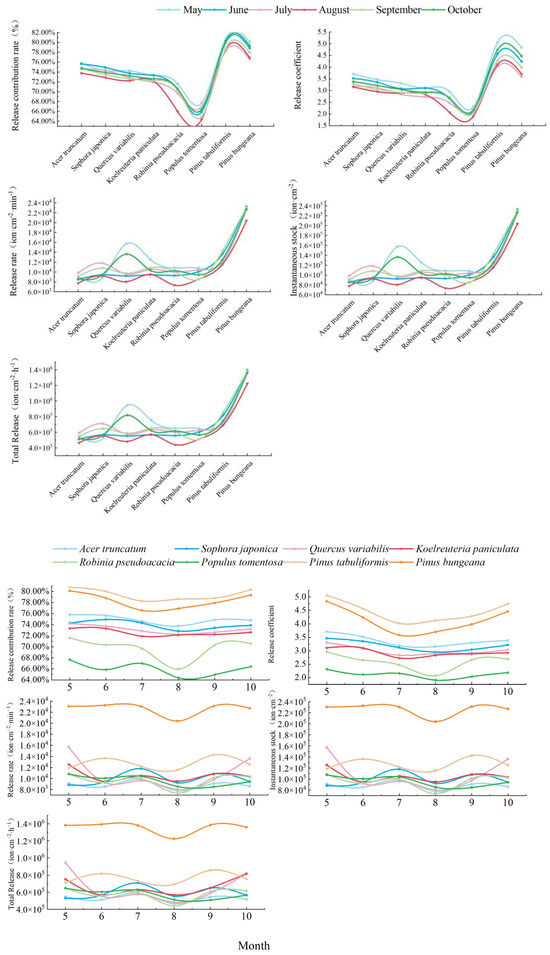
Figure 8.
Monthly variation in the NAI release capacity of typical greening species of trees.
There were significant differences in the five NAI “capacity indicators” between the conifer and broadleaf species in each month. The release contribution rate (L) and release coefficient (n) of the conifer species were as follows: May > October > June > September > August > July; the highest NAI contribution capacity and immediate release capacity of the species occurred in May, reaching the following levels: Pinus tabuliformis (L: 80.76%, n: 5.06) and Pinus bungeana (L: 80.12%, n: 4.84). In July, Pinus tabuliformis (L: 78.27%, n: 4.02) and Pinus bungeana (L: 76.56%, n: 3.59) had the smallest contribution capacity and immediate release capacity.
The release contribution rate (L) and release coefficient (n) of the broadleaf tree species occurred as follows: May > June > October > July > September > August. The contribution capacity and immediate release capacity of the broadleaf tree species were the highest in May, and the range in variation was L: 67.67%~75.79% and n: 2.31~3.71. In August, the contribution capacity and immediate release capacity of the broadleaf tree species to NAIs were the lowest, and the range in variation was L: 64.38%~73.76% and n: 1.91~3.16.
The release rate s of conifer species, the instantaneous existing stock v, and the total number Z showed the following patterns: September > June > October > July > May > August. The quickest rate of release occurred in September, and the instantaneous existing stock and the maximum number released hour−1 were as follows, respectively: Pinus tabuliformis (s: 1.43 × 10³ ion· cm−2· min−1, v: 14.28 × 10³ ion· cm−2, and Z: 85.70 × 10³ ion·cm−2·h−1) and Pinus bungeana (s: 2.31 × 10³ ion·cm−2·min−1, v: 23.10 × 10³ ion·cm−2, and Z: 138.59 × 10³ ion·cm−2·h−1). The slowest release rate occurred in August, and the instantaneous current stock and the total number released per hour were the lowest, respectively, as follows: Pinus tabuliformis (s: 1.16 × 10³ ion·cm−2·min−1, v: 11.55 × 10³ ion·cm−2, and Z: 69.30 × 10³ ion·cm−2·h−1) and Pinus bungeana (s: 2.04 × 10³ ion·cm−2·min−1, v: 20.40 × 10³ ion·cm−2, and Z: 122.39 × 10³ ion·cm−2·h−1). The s, v, and Z of the broadleaf trees showed characteristics as follows: July > May > September > October > June > August. The release rate in July was the quickest; the most instantaneous stock and the total number released hour−1; and the range in variation was s: 0.96 × 10³~1.18 × 10³ ion·cm−2·min−1, v: 9.60 × 10³~11.80 × 10³ ion·cm−2, and Z: 57.59 × 10³~70.81 × 10³ ion·cm−2·h−1.
In summary, the contribution rate and immediate release ability of the conifers and broadleaf species of tree were the highest in May, and the contribution ability and immediate release ability were the lowest in July (conifer) and August (broadleaf) in the summer. The release rate and number of the NAIs released by the conifers were the slowest and the lowest in August, and the conifers released the most NAIs and at the quickest rate in September. Those of the broadleaf species occurred in July.
3.3. Trend of Changes in the Five “Capability Indicators”
Figure 9 shows the daily variation trend of the five “ability indicators” of the number of NAIs released by each species of tree. Combined with Figure 7, the contribution rate of release L and the release coefficient n were found to be opposite to the trend of variation in NAICs, while the release rate s, instantaneous existing stock v, and total release Z were consistent with the trend of variation in the NAICs.
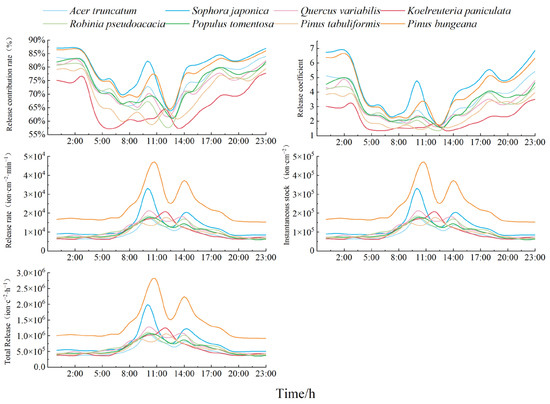
Figure 9.
Analysis of the trend of the NAI release capacity of typical greening species of trees.
Overall, with the morning and afternoon as the limit, the fluctuations in L, n, s, v, and Z from 8:00 to 14:00 were synchronized, i.e., in this period of time, with the increase in NAICs, or with the decrease and decrease, the plant contribution NAI capacity, immediate release NAI capacity, release rate, and release number also increased and increased or decreased and decreased. From 14:00 to 8:00 the next day, L, n and s, v, and Z fluctuated with an opposite trend, and from 14:00 to 3:00 the next day, with the increase in NAICs, the release of NAIs by the plants accelerated. However, the contribution of the NAI ability and immediate release ability of the plants decreased. From 3:00 a.m. to 8:00 a.m., with the decrease in NAICs, the rate of NAIs released by the plants decreased, and the release number gradually decreased. However, the ability of the plants to contribute NAIs and to immediately release them increased.
3.4. Advantage of the Five “Capability Indicators”
This section primarily constructs five “ability indicators” to characterize and evaluate the ability of plants to release NAIs, namely, the release contribution rate L, release coefficient n, release rate s, instantaneous existing stock v, and total release Z. The ability of the plants to release NAIs was analyzed from five dimensions, namely, contribution capacity to the total number of NAIs in the atmosphere, immediate release capacity, release speed, instantaneous release number per unit time, and level of total release in a period of time. Compared with traditional statistical methods, our method for measuring the NAI release capacity of plants has the following advantages:
- (1)
- It disrupts traditional quantitative methods and broadens the means and scope of analysis and research. To disrupt the bottleneck of the traditional single study on the change in the NAIC content in plants, preceding studies tended to study and analyze the “release contribution rate”, which is relatively simple. In this study, other indicators were added to broaden the means and scope of the analysis of NAIs and conduct research from different dimensions, such as the abilities to contribute, immediately release, and release quantity.
- (2)
- Research in the field of NAIs is more precise and detailed. Plants are the primary source of atmospheric NAIs. A control treatment was added to the five “ability indicators” to “strip” the release effect of the plants themselves from the atmospheric total NAIs and provide a more accurate method of calculation and more precise and detailed NAI field research.
- (3)
- It offers a wider scope of application and stronger applicability. The five “ability indicators” constructed in this study were primarily constructed based on the artificially controlled open-top box (OTC) environment, which can effectively reduce the interference of external environmental factors. The formulae of the five “ability indicators” can be modified according to the conditions in the natural environment, and environmental factors can be added to explore the ability of plants in different vegetation types, such as wild forests and plant communities, to emit NAIs.
4. Discussion
This study explores a new dimension in the field of NAI research and constructed five “ability indicators” to characterize and evaluate the ability of species of tree to release NAIs and isolate the interference of the external natural environment and other factors under controlled conditions. The daily and monthly NAI release capacity of different species of trees and the relationship between the five capacity indicators were analyzed from the perspective of contribution rate L, release coefficient n, release rate s, instantaneous existing stock v, and total release Z.
4.1. There Are Individual Differences Among the Different Species of Trees
The leaves of plants are one of the important sites for the generation of air negative ions (NAIs), and the morphological and structural characteristics of the leaves of different plant species can affect the ability to release NAIs. Since Nemeryuk first demonstrated that plants can release NAIs under normal conditions [23], numerous studies have confirmed significant differences in NAI release capacity among the leaves of different plant species.
Studies have found that coniferous tree species exhibit a more pronounced ability to release air negative ions compared to broad-leaved tree species, which is attributed to their smaller leaf curvature radius and more significant photoelectric effect [24]. We conducted a control experiment to measure whether the negative ion concentration released by 32 species of the Cactaceae family was significantly higher than that of the blank control group, indicating that Cactaceae plants possess the ability to release negative ions into the air. By performing stepwise spine-removal treatments on combinations of different Cactaceae plants and measuring the differences in negative ion concentrations, it was found that as the number of spines on Cactaceae plants decreased, the negative ion concentration gradually decreased. The results suggest that the more spines Cactaceae plants have, the more air negative ions they release. However, Wu Zhiping et al. and Shao Hairong et al. [25,26] found that the concentration of negative ions released by different types of green spaces that the broadleaf trees released significantly higher concentrations of negative ions than turf types of vegetation. In contrast to the results of this study, the concentration of negative ions may be affected by the different growth conditions of plants and research conditions.
4.2. Diurnal Variation Characteristics of Five “Ability Indices” of NAIs Released by Each Tree Species
The ability of plants to release NAIs is substantially affected by meteorological factors such as solar radiation, temperature, and humidity. In this study, the release contribution rate L and release coefficient n of the coniferous and broadleaf tree species were found to be higher at night than during the day. Each species of tree instantly contributed more NAIs at night, which indicated that the contributing role of plants at night was higher than that during the day. In addition, the negative ions produced by the plants at night accounted for a higher percentage of the concentration of total atmospheric NAIs. This is because during the day, under the influence of solar radiation and temperature, the increase in temperature accelerates the movement and collision between molecules, raises the ionization level of oxygen molecules, generates some NAIs [27], and weakens the proportion of NAIs generated by plants. Since the nights are dark and have low temperatures, the contribution of plants is substantially strengthened.
The release rate s, instantaneous current number v, and total release level Z of each species of tree were higher during the day than at night. The quickest rates and largest numbers of NAIs were released during the day, primarily because photosynthesis is the primary pathway for plants to release NAIs, and solar radiation affects the photosynthesis of vegetation [28]. This accelerates the release of NAIs. The five “ability indicators” of the NAI release of all the species of trees was slight at night but fluctuated during the day. In addition, the plant release ability (L, n, s, v, and Z) gradually strengthened after sunrise. The peak value of all the species of trees primarily appeared around 10:00 when the plants photosynthesized the most, and the release ability was the strongest. The trough value appeared at 13:00. At this time, the plant stomata are closed, and photosynthesis is disrupted. Thus, the release capacity has the lowest value during the day.
4.3. Characteristics of Monthly Changes in the Five “Capacity Indicators” for the Release of NAIs from Different Species of Trees
Inter-species differences were identified among the individual species of trees in different months of the growing season. The release contribution rate L and release coefficient n of the conifers and broadleaf trees were the highest in May. The contribution capacity and immediate release capacity of each species of tree to the total NAIC in the atmosphere were the strongest in this month because May is the initial stage of plant growth. The light and temperature at this time are the most conducive for plant growth, so it is easier for them to release more NAIs [29]. July and August in the summer have the lowest contribution capacity and the weakest immediate release NAI capacity because they are the months that are the hottest and have the least humidity. The plants are prone to stop photosynthesizing, while the atmosphere is the strongest under solar radiation and contains the highest concentration of ionized negative ions [30]. Thus, the plants have the weakest contribution capacity and the lowest immediate release capacity in the summer.
In terms of the release rate s, instantaneous existing stock v, and total release Z, the release rate and numbers for each species of tree in the growing season were the slowest and the lowest in August, respectively. However, the release rate and levels for the conifers were the quickest and the highest in September, respectively, and the broadleaf species were the most strongly affected in July. This is because August is the peak period of plant growth, which is affected by physiological and ecological effects, such as leaf morphology. At this stage, the leaves have their largest area; there are high temperatures and low humidity; the plants easily stop photosynthesizing; and the ability to release NAIs is significantly reduced. Therefore, each species of tree has the slowest release rate and the lowest release level per unit area. There is photosynthesis, but it does not reach the photosynthetic disruption at midday; the release rate is the quickest, and the release number is the largest [31].
4.4. Trend of Change in the Five Ability Indices of Different Species of Trees
Overall, the release contribution rate L and release coefficient n are consistent with the model of change in the NAICs, while the release rate s, instantaneous existing stock v and total release Z contrast with the model of change in NAICs. The fluctuations in L, n, s, v, and Z are synchronized at approximately 8:00~14:00 under the segmented treatment, which are eliminated and increased, and show linkage. During the period of time from 14:00 to 8:00 the next day, L, n and s, v, Z fluctuated in the opposite trend and pointed in one direction. The primary influencing factor that causes the difference between these two time periods is solar radiation. After 14:00, the role of solar radiation gradually decreases; the temperature decreases; the rate of NAI release from plants slows down; and the level of release decreases. At this time, the atmospheric ionization is weakened, and fewer NAIs are produced by air ionization in the total NAICs of the atmosphere. The contribution of the plants is strengthened, and the instantaneous release capacity is elevated. The decrease in L and n after approximately 3:00 is owing to the higher humidity in the air at this time, and the O2− (H2O) balances to larger cluster ions. This increases the size of the hydrated NAIs. It then becomes a charged aerosol and is excluded from the NAI category because its mobility is too low to have the biological effect of small particles [32,33].
5. Conclusions and Outlook
In this study, an open-top box (OTC) controlled test was set up to establish five “ability indicators” to characterize and evaluate the ability of plants to release NAIs. This study found the following. (1) Daily and monthly changes in the NAI release capacity (L, n, s, v, and Z) of each species of tree during the growing season showed that the conifers produced significantly more NAIs than the broadleaf species. (2) The release capacity of each species of tree is as follows: L: 64.38%~80.76%, n: 1.91~4.84, s: 0.73 × 10³~2.33 × 10³ ion·cm−2·min−1, v: 7.34 × 10³~23.26 × 10³ ion·cm−2, and Z: 44.06 × 10³~139.53 × 10³ ion·cm−2·h−1. (3) The ability of each species of tree to release NAIs is higher at night than during the day for L and n and higher during the day than the night for s, v, and Z. (4) L and n were the highest in May and the lowest in July and August for each species of tree during the growing season. S, v, and Z were the lowest in August and highest in July and September.
This study mainly examines the release of air negative ions by individual plants under controlled conditions. This study mainly examines the release of air negative ions by individual plants under controlled conditions. At present, more attention is paid to the combination design of plants in the planning of garden greening. The five “ability indicators” can be utilized to strengthen the research on the configuration of plant communities and explore the combination model with stronger NAI release ability. Moreover, since most of the selected experimental tree species under artificial control were deciduous, they were in the plant growth period from May to October. In winter, the broad-leaved tree species had no leaves and their ability to release NAIs was basically zero. In order to better compare the differences between coniferous and broad-leaved tree species, the ability of coniferous tree species to release NAIs in winter was not studied separately. Therefore, the experiment was conducted during the growing season from May to October. In the natural environment, the study area mainly consists of deciduous tree species, and the five ability indicators are basically zero in winter. Therefore, this paper does not conduct research into NAI release in this season. However, coniferous tree species continue photosynthesis in winter, which requires further study.
Author Contributions
S.L. (Shaoning Li): Methodology, Writing—Review & Editing, Supervision, Project administration, Funding acquisition; D.Y.: Formal analysis, Writing—Review & Editing, Investigation; B.L.: Formal analysis, Writing—Review & Editing, Investigation; T.L.: Conceptualization, Methodology, Data curation, Investigation, Writing—Original Draft, Visualization; N.Z.: Formal analysis, Writing—Review & Editing, Investigation; X.X.: Methodology, Validation, Writing—Review & Editing, Visualization; S.L. (Shaowei Lu): Conceptualization, Resources, Supervision, Project administration, Funding acquisition. All authors have read and agreed to the published version of the manuscript.
Funding
National Natural Science Foundation of China (32171844), Innovation Capacity Building Project of Beijing Academy of Agriculture and Forestry Sciences (KJCX20230306, KJCX20251202).
Data Availability Statement
Data will be made available on request. If you have any questions, please contact the only corresponding author, “Shaowei Lu”.
Acknowledgments
Thanks to the following units for their support: Institute of Forestry and Pomology, Beijing of Agriculture and Forestry Sciences; Beijing Yanshan Forest Ecosystem Observation and Research Station; and Forestry College of Shenyang Agricultural University.
Conflicts of Interest
The authors declare no conflicts of interest.
References
- Liu, R.; Lian, Z.; Lan, L.; Qian, X.; Chen, K.; Hou, K.; Li, X. Effects of negative oxygen ions on sleep quality. Procedia Eng. 2017, 205, 2980–2986. [Google Scholar] [CrossRef]
- Bowers, B.; Flory, R.; Ametepe, J.; Staley, L.; Patrick, A.; Carrington, H. Controlled trial evaluation of exposure duration to negative air ions for the treatment of seasonal affective disorder. Psychiatry Res. 2018, 259, 7–14. [Google Scholar] [CrossRef] [PubMed]
- Deng, L.; Deng, Q. The basic roles of indoor plants in human health and comfort. Environ. Sci. Pollut. Res. 2018, 25, 36087–36101. [Google Scholar] [CrossRef]
- Liu, S.; Huang, Q.; Wu, Y.; Song, Y.; Dong, W.; Chu, M.; Yang, D.; Zhang, X.; Zhang, J.; Chen, C.; et al. Metabolic linkages between indoor negative air ions, particulate matter and cardiorespiratory function: A randomized, double-blind crossover study among children. Environ. Int. 2020, 138, 105663. [Google Scholar] [CrossRef] [PubMed]
- Lin, W.; Zeng, C.; Nie, W.; Nan, X.; Shen, S.; Shi, Y.; Yan, H.; Yang, F.; Wu, R.; Bao, Z. Study of the vertical structures, thermal comfort, negative air ions, and human physiological stress of forest walking spaces in Summer. Forests 2022, 13, 335. [Google Scholar] [CrossRef]
- Nadali, A.; Arfaeinia, H.; Asadgol, Z.; Fahiminia, M. Indoor and outdoor concentration of PM10, PM2.5 and PM1 in residential building and evaluation of negative air ions (NAIs) in indoor PM removal. Environ. Pollut. Bioavailab. 2020, 32, 47–55. [Google Scholar] [CrossRef]
- Jiang, S.Y.; Ma, A.L.; Ramachandran, S. Negative air ions and their effects on human health and air quality improvement. Int. J. Mol. Sci. 2018, 19, 2966. [Google Scholar] [CrossRef]
- Willis, K.J.; Petrokofsky, G. The natural capital of city trees. Science 2017, 356, 374–376. [Google Scholar] [CrossRef]
- Feng, J.; Liu, Q.; Ding, H.; Wang, X.; Qi, Y.; Guo, W.; Wang, H. Effect of Fountain on Variation of Aero-anion and Its Correlation with Meteorological Factors. In Proceedings of the 2015 International Conference on Intelligent Transportation, Big Data and Smart City, Halong Bay, Vietnam, 19–20 December 2015; IEEE: Piscataway, NJ, USA, 2015; pp. 358–361. [Google Scholar]
- Laakso, L.; Hussein, T.; Aarnio, P.; Komppula, M.; Hiltunen, V.; Viisanen, Y.; Kulmala, M. Diurnal and annual characteristics of particle mass and number concentrations in urban, rural and Arctic environments in Finland. Atmos. Environ. 2003, 37, 2629–2641. [Google Scholar] [CrossRef]
- Horrak, U.; Salm, J.; Tammet, H. Bursts of intermediate ions in atmospheric air. J. Geophys. Res. Atmos. 1998, 103, 13909–13915. [Google Scholar] [CrossRef]
- Beijing Water Resources Bulletin; Beijing Municipal Water Affairs Bureau: Beijing, China, 2022.
- Zhou, B.; Yu, S.Q.; Zhang, C.; Yi, L. Aero-anion ecological efficiency of 13 tree species in Zhejiang Province. J. Zhejiang A F Univ. 2011, 28, 200–206. (In Chinese) [Google Scholar]
- Wu, R.; Deng, C.; Wang, B.; Huang, D.; Lin, L.; Huang, J.; Zheng, J. Research on germplasm resources of indoor plants with the function of releasing negative ions. Chin. Agric. Sci. Bull. 2011, 27, 91–97. (In Chinese) [Google Scholar]
- Jin, M.J.; Zhang, Y. The Distribution of Air Anion Concentration above Ground at Some Scenic Sites in Guangxi. Environ. Sci. Res. 2004, 17, 25–27. [Google Scholar]
- Bai, B.; Chi, D.; Xu, T.; Shen, Z.; Cao, H. Differences in the Changes of Negative Air lon Concentration among Diffperent Vegetation Types in North Central Henan Province, China. J. Ecol. Environ. 2016, 25, 1629–1637. (In Chinese) [Google Scholar]
- Li, Y.; Li, F.; Xiao, N. Variation Law of Negative Air lons Concentration in Urban Forests of Qiqihar City. J. Northeast For. Univ. 2020, 48, 71–75. [Google Scholar]
- Gao, T.; Lu, J.; Li, J.R.; Han, X.-H.; Baima, Y.-Z. Air Quality Evaluation of Typical Ecological Land in the Main Urban Area of Nyingchi City. J. Southwest Norm. Univ. Nat. Sci. Ed. 2020, 45, 130–137. [Google Scholar]
- LY/T 2586-2016; Technical Specification for Observation of Negative (Oxygen) Ion Concentration in Air. State Forestry Administration of China: Beijing, China, 2016.
- Wang, B.; Lu, S. Evaluation of Ecosystem Service Value of Economic Forests in China. Chin. J. Appl. Ecol. 2009, 20, 417–425. [Google Scholar]
- Li, S. Research on the Service Function of the Forest Ecosystem in Jiangxi Province and Dagangshan. Ph.D. Thesis, Chinese Academy of Forestry, Beijing, China, 2007. [Google Scholar]
- Du, W.G.; Wang, C.; Wang, Q.; Bao, H.G.; He, R.; Xu, C.; Gao, F.; Xie, J. Evaluation of Summer Environmental Effects of the Main Vegetation Types in Beijing Fragrant Hills Park. Chin. J. For. 2018, 54, 155–164. [Google Scholar]
- Ding, X.L.; Zhang, W.C.; Huang, L.F.; Zheng, J.G.; Wu, R.Y.; Deng, C.Y. Correlation between the spine number and the release of negative air ions by cactaceous in the natural state. J. Anhui Agric. Univ. 2015, 42, 263–267. [Google Scholar]
- Cai, L.; Wang, C.; Zhang, J.; Meng, P.; Shi, G. The influence mechanism of negative air ion in forest ecosystem based on structural equation. Acta Ecol. Sin. 2024, 44, 1662–1670. [Google Scholar]
- Wu, Z.; Wang, C.; Xu, J.; Hu, L. Six kinds of Summer air Negative ions and particulate matter in Urban Green Spaces. J. Tsinghua Univ. Nat. Sci. Ed. 2007, 47, 2153–2157. [Google Scholar]
- Shao, H.R.; He, Q.T.; Yan, H.P.; Hou, Z.; Li, T. Spatio-temporal changes of negative air ion concentrations in Beijing. J. Beijing For. Univ. 2005, 27, 35–39. (In Chinese) [Google Scholar]
- Jin, Q.; Yan, J. Study on the Division of the Grade of Air Negative Oxygen Ion Concentration in Hubei Province. Environ. Sci. Technol. 2017, 40, 194–199. (In Chinese) [Google Scholar]
- Yin, S.; Zhu, D.; Chen, L. Characteristics of Air Negative Ion Concentration Changes in Dongguan Botanical Garden. Meteorol. Hydrol. Oceanogr. Instrum. 2012, 29, 33–36. [Google Scholar]
- Yan, X.; Wang, H.; Hou, Z.; Wang, S.; Zhang, D.; Xu, Q.; Tokola, T. Spatial analysis of the ecological effects of negative air ions in urban vegetated areas: A case study in Maiji, China. Urban For. Urban Green. 2015, 14, 636–645. [Google Scholar] [CrossRef]
- Cheung, H.C.; Chou, C.C.K.; Jayaratne, E.R.; Morawska, L. Impact of particle formation on atmospheric ions and particle number concentrations in an urban environment. Atmos. Res. 2015, 157, 127–136. [Google Scholar] [CrossRef]
- Dos Santos, V.N.; Herrmann, E.; Manninen, H.E.; Manninen, H.E.; Hussein, T.; Hakala, J.; Nieminen, T.; Aalto, P.P.; Merkel, M.; Wiedensohler, A.; et al. Variability of air ion concentrations in urban Paris. Atmos. Chem. Phys. 2015, 15, 13717–13737. [Google Scholar] [CrossRef]
- Lehtipalo, K.; Sipilä, M.; Junninen, H.; Ehn, M.; Berndt, T.; Kajos, M.K.; Worsnop, D.R.; Petäjä, T.; Kulmala, M. Observations of nano-CN in the nocturnal boreal forest. Aerosol Sci. Technol. 2011, 45, 499–509. [Google Scholar] [CrossRef]
- Nemerjuk, G.E. Salt losses into the atmosphere during respiration. Fiziol. Rastenii 1970, 17, 673–679. [Google Scholar]
Disclaimer/Publisher’s Note: The statements, opinions and data contained in all publications are solely those of the individual author(s) and contributor(s) and not of MDPI and/or the editor(s). MDPI and/or the editor(s) disclaim responsibility for any injury to people or property resulting from any ideas, methods, instructions or products referred to in the content. |
© 2025 by the authors. Licensee MDPI, Basel, Switzerland. This article is an open access article distributed under the terms and conditions of the Creative Commons Attribution (CC BY) license (https://creativecommons.org/licenses/by/4.0/).