Article

Mapping Commercial Forests Infected by the Novel Variant of Elsinoë masingae, Using Unmanned Aerial Technology in Southern Africa

by
Kabir Peerbhay
*,
Nishka Devsaran
,
Romano Lottering
,
Naeem Agjee
and
Mikka Parag
Discipline of Geography, School of Agricultural, Earth and Environmental Sciences, University of KwaZulu-Natal, Scottsville Campus, Pietermaritzburg 3209, South Africa
*
Author to whom correspondence should be addressed.
Forests 2025, 16(6), 966; https://doi.org/10.3390/f16060966
Submission received: 30 April 2025 / Revised: 26 May 2025 / Accepted: 4 June 2025 / Published: 7 June 2025
(This article belongs to the Section Forest Health)

Abstract

Eucalyptus scab disease (Elsinoë) is a harmful plant fungus that can disrupt various ecological and economic services provided by commercial forests. To effectively control and monitor the occurrence of forest pathogens, it is important to understand their spatial distribution within the infected area. Consistent monitoring, together with high-resolution imagery obtained from unmanned aerial vehicles (UAVs), has become important in forest management. Therefore, this study focuses on detecting and mapping the spatial distribution of E. masingae within commercial forests using image texture and vegetation indices (VIs) computed from a UAV sensor with machine learning (ML) and deep learning (DL) models. The fast large margin (FLM), random forest (RF), and deep learning (DL) models were used to determine which model effectively mapped the spatial distribution of the disease. The results indicated that image texture significantly increased the model accuracies (FLM = 94.8%; RF = 98.9%; DL = 98.9%) as opposed to the results without the use of image texture (FLM = 84.4%; RF = 76.1%; DL = 81.7%). Since the DL model obtained the fastest model run time and was proven to be the most significant model, it selected the mean, homogeneity, second moment, and correlation texture parameters which were predominantly determined from the red and blue bands of the UAV sensor containing visible bands. Additionally, the 3 × 3 moving window size was ideal for detecting E. masingae since the estimation of texture parameters was reduced efficiently. Overall, this study showcases the ability of UAVs to effectively map forest disease. Together with that, it has proven that the DL model outperformed the conventional ML models.

1. Introduction

There are approximately 1.5 million hectares of commercial forestry covering South Africa’s land surfaces, and a majority of it is located along the eastern coast of KwaZulu-Natal and Mpumalanga [1,2]. The commercial forest industry plays a crucial role in boosting various countries’ economies as it opens up opportunities for employment for local people [3]. They also provide a valuable timber resource that is beneficial for generating wealth among many industries, such as mining, construction, pulp, and paper manufacturers. Furthermore, the commercial forest industry contributes to approximately 2% of South Africa’s gross domestic product by producing hardwood and softwood [1]. The commercial forest industry is susceptible to the exposure of various insects, fungi, bacteria, and viruses, which may have a parasitic, mutualistic, or symbiotic relationship with the surrounding environment [4]. The increased number of pests and diseases in forest ecosystems has the ability to disrupt forest productivity by reducing multiple tree species, thus diminishing forest value [5,6,7].
Elsinoë masingae, also known as a ‘Eucalyptus Scab’, is a plant fungus and is characterized by causing spot anthracnose and scabs on several plants [8]. The various species of Elsinoë are known to display symptoms on leaves, stems, and pods of different plants since there have been records evident in forested and agricultural areas worldwide [9]. One of the key factors driving the spread of Elsinoë species includes suitable climatic conditions such as rain, wind, humidity, and a source of inoculum [10]. According to Roux, et al. [11], symptoms were first observed near Ixopo in KwaZulu-Natal, South Africa as tree leaves illustrated red blemishes and dark spots on young and green shoots. Furthermore, this disease contributed to the feathering appearance of branches and resulted in thin tree crown structures. The name ‘masingae’ has been given to this pathogen by the local forester who first reported this in South Africa, which was later identified as a new variant of the disease [11]. According to Bulman, et al. [12], it is important to have various forms of forest health surveillance techniques to effectively monitor and manage the spread of diseases before this reaches pandemic levels.
The images in Figure 1 visually represent the symptoms associated with the Eucalyptus Scab in Indonesia with similar symptoms noticed in South Africa. It is important to note that Elsinoë species are often dispersed via wind, rainwater, warm temperatures, and a source of inoculum that allows scabbing to persist [10].
The increased demand for forest products makes it necessary to have proper forest protection and management strategies in place. According to [7], chemical control methods in controlling forest diseases negatively affect the surrounding environment since they promote environmental disturbances, affect areas that are not targeted, and are considered a costly process. The application of chemical control methods through fungicides has the potential to create genotypes that are resistant to the targeted pathogen [14]. In the case of forest fungal diseases, biological control methods may be the most viable option in forest management since it is cost-effective, environmentally friendly, and sustainable [7,14]. However, these methods can be successful based on the ability to identify the spatial occurrence of fungal diseases to help determine effective management strategies.
Traditional methods of detecting forest disease entailed consistent ground-based surveys carried out by trained professionals that are conducted annually to assist in forest planning and decision-making [15,16]. Since traditional field surveys are often time-consuming, labor-intensive, impractical for steep terrains, and limited to small-scale areas, modern remote sensing techniques emerged to enhance ground-based surveys by increasing the spatial coverage of detection [16,17]. Many studies have used satellite remote sensing to map the different forest types based on their structural characteristics [18]. For example, Chemura, et al. [19] easily distinguished coffee leaf rust (CLR) through the red and red-edge bands of the Sentinel-2 multispectral sensor, while Oumar, et al. [20] utilized Landsat 8 bands to detect forest damage caused by the Uromycladium acacia (wattle rust) fungus. Since both Sentinel-2 and Landsat 8 are characterized by medium spatial resolution, the development of unmanned aerial vehicles (UAVs) with their high spatial resolution characteristics has the ability to improve disease detection since they can provide detailed spatial resolution imagery.
In recent years, the application of UAVs, also known as ‘drones’, has become an important remote sensing tool for various forest applications [21]. UAVs consist of several remote sensing instruments such as visible light, shortwave infrared, thermal infrared, near-infrared, LiDAR, and Radar technologies [21]. According to Allen, et al. [22], these technologies can fill in the data collection gap that remote sensing sensors have since they contain high flexibility, fast responses, and a high spatial resolution. Thus, UAVs contain characteristics that are capable of overcoming the limitations that many satellite sensors contain. The most commonly used sensors in forestry are the red, green, and blue (RGB) band sensors since they are easy to operate, cheaper, and have an increased ability to process data [23]. It has also been revealed that from 2010 to 2019, approximately 57% of UAV forest applications utilized RGB sensors [23]. Therefore, high-resolution UAV technology, together with the RGB spectral characteristics, has significant potential to provide relevant information for mapping and detecting the distribution of E. masingae infestation within commercial forests, further improving the decision-making of forest managers. Vegetation indices (VIs) play an important role in remote sensing since they assist in capturing the spectral characteristics of vegetation allowing for effective analysis.
The use of VIs in UAV remote sensing applications has been proven successful in numerous studies [24,25]. For example, Marin, et al. [25] successfully detected coffee leaf rust (CLR) using machine learning (ML) algorithms and VIs extracted from UAV-based data. Similarly, Abdulridha, et al. [24] detected citrus canker disease using ML algorithms and VIs extracted from UAV hyperspectral data. These studies utilized spectral bands together with VIs to detect and map the occurrence and spread of diseases. However, it has been noted that VIs such as the simple ratio and the normalized difference vegetation index (NDVI) alter the results of studies as factors such as linearity and saturation affect areas consisting of a large amount of biomass [26,27]. Therefore, it would be appropriate to introduce an alternative technique, such as image texture, in detecting and mapping the spatial distribution of forest diseases.
Image texture has proven to be useful in distinguishing changes in forest canopy structure along with changes in tree age, density, and vegetation defoliation in several studies [28]. Image texture is important since it has the ability to identify the spatial distribution of objects, but dependent on the spatial resolution of images. Furthermore, image texture identifies the spatial characteristics present in an image, which allows for improved identification of forest features. The effectiveness of image texture increases with the use of high spatial resolution imagery. Many studies successfully detected and mapped spatial phenomena using image texture. For instance, Lottering, et al. [2] successfully used texture analysis to assist in detecting and mapping Solanum mauritianum (bugweed) within a forested environment. Additionally, Moskal and Franklin [29] also found that airborne remote sensing imagery with a spatial resolution of 60 cm combined with image texture produced detailed information pertaining to the crown structure of individual trees. According to Champion, et al. [30], texture has the ability to distinguish between different forest canopy structures allowing for efficient detection of vegetation characteristics. Furthermore, image texture uses local variance on an image and is often dependent on the properties of the neighborhood pixels [28]. However, image texture parameters often consist of an increased data dimensionality and redundancy [2,31]. Therefore, an appropriate approach for feature extraction is necessary for successful image texture classification [32] and may enhance the detection of cryptic pathogens such as Elsinoë. However, to our knowledge, no study has explored the potential of remote sensing in detecting and mapping Elsinoë infestation, specifically in South Africa. Therefore, this study aims to determine the effectiveness of UAV data in detecting and mapping commercial forests infected by E. masingae. This study tested the ability of VIs and image texture to enhance the detection and map the spatial distribution of E. masingae using three competitive algorithms namely, fast large margin (FLM), random forest (RF), and deep learning (DL) models.

2. Methods and Materials

In this study, image texture parameters and vegetation indices (VIs) were used to supplement field information on the occurrence and severity of Elsinoë infection in commercial Eucalyptus plantations. The random forest (RF), fast large margin (FLM), and deep learning (DL) models were used to classify and map the spatial distribution of E. masingae using high-resolution RGB imagery obtained from a UAV sensor on board the DJI Mavic 2 Enterprise Dual drone (Figure 2).

2.1. Study Site

The study was conducted on the South Coast of the KwaZulu-Natal province, South Africa (Figure 3). Two study plantation areas were surveyed for disease-infested forested compartments. The plantation that had high infestation severities was Rosslea which is located at 30°23′16″ S 30°20′42″ E, covering approximately 516,786 ha of land. The plantation that consisted of moderate to low disease infestation levels, was Braemar, which is located at 30°17′1″ S 30°25′48″ E. This plantation area covers approximately 724,772 ha of land. These plantations are known for their commercial forestry landscape and mainly consist of Rose Gum (Eucalytus grandis) varieties. The warm waters along the coastline contribute to the humidity experienced along the coast of KwaZulu-Natal. The region has an average temperature of between 23.8 and 24.5 °C, with February experiencing the hottest conditions while June experiencing the coldest conditions. The coastal area receives approximately 1000 to 1200 mm of rainfall per annum.

2.2. Image Acquisition and Processing

High-resolution imagery (5 cm) was acquired from both study areas using the DJI Mavic 2 Enterprise Dual drone, which was sourced from a local vendor in Cape Town South Africa and consists of a red (600–700 nm), green (500–600 nm), and blue (400–500 nm) band camera. The aerial survey was undertaken during the months of April and May 2022 at an altitude of 100 m above ground. The flights of the drone took place between 10:00 am and 12:00 pm, with a total of 2 flights capturing images of each study area. There had been a total of 340 and 458 images calibrated for the Rosslea and Braemar, respectively. Ground sample distance (GSD) essentially views the distance between the centers of two adjacent pixels on the ground. The lower the GSD, the higher the accuracy. The average GSD for imagery obtained over the Rosslea Plantation was 4.63 cm, while Braemar had a GSD of 5.39 cm. Image processing entailed image correction, mosaicking, and exporting the images into a GeoTiff file format. Thereafter, image analysis occurred on ArcGIS Drone2Map software (version 2024.1.0), whereby GPS field recordings of all sample trees and field plots were digitized into points and polygons using the editing features across the two GeoTiff images.

2.3. Field Data Collection

A field survey was conducted during the months of April and May 2022, in which plant disease experts went into the field to collect Eucalyptus tree health samples. Sampling took place using the purposive sampling method whereby ninety 10 × 10 m grids were placed in forest stands confirmed to be infected by the newly discovered E. masingae disease [11]. Trees within the plots were observed for symptoms of leaf malformation, feathering, and scabbing, and their positions were recorded using a survey-grade Trimble GPS (Made by Trimble, sourced in Durban, South Africa) range rod system with an accuracy of <20 cm. This was also sourced from a local vendor within the vicinity of the city of Durban, South Africa. There were 3 categories of infection levels identified across both study areas such as highly infected, medium or intermediate, and low infected trees. Across the Braemar and Rosslea plantations, there was a total of 655 sample points collected, including 373 highly infected trees, 182 medium-high infected trees, and 100 low-infected trees across both study areas. The final dataset consists of 655 sample points, which were then used to extract image spectra from subsequent texture derivatives and vegetation indices.

2.4. Image Texture Analysis

According to Chetty, et al. [33], the grey level vo-occurrence matrix (GLCM) is superior to understanding forest environments compared to the grey level occurrence matrix (GLOM). Therefore, in this study, the GLCM variables as illustrated in Table 1 were generated from the UAV imagery across the study sites using a moving window size of 3 × 3. The texture was extracted from the UAV images while using a shift of x = 1, y = 1, and θ = 45° in R studio version 4.3.2, using the glcm package. Thereafter, each generated texture image (i.e., contrast, correlation, dissimilarity, homogeneity, mean, second movement, variance, entropy) was imported into ArcGIS Pro to extract the mean values of field sample locations for the inclusion in the classification of Elsinoë infection. The smaller moving windows were used since they are capable of reducing the estimation of texture parameters as compared to larger moving window sizes.

2.5. Vegetation Indices

The spectral characteristics of vegetated areas entail a combination of soil brightness, shadows, soil colors, vegetation, and moisture which is often affected by atmospheric was to reduce soil background effects and solar energy while enhancing vegetation signals under stress [40]. For the purpose of this study, four visible vegetation indices were selected as illustrated in Table 2.

2.6. Statistical Analysis

RapidMiner software, version 9.10 was used to statistically assess and compute the fast large margin (FLM), random forest (RF), and deep learning (DL) models. Using the field data collected in the field, combined with the extracted image textural and VI spectra, classification analysis was conducted and subsequently analyzed.

2.6.1. Fast Large Margin

The fast large margin classification is the most suitable method for large and sparse data and the most suitable for large-scale training data [44]. This model uses the support vector machine (SVM) learning model which uses a supervised non-parametric statistical learning method whereby the underlying distribution of data is not assumed [45]. The SVM is an algorithm that learns using an example to allocate a label to an object, and it is useful for solving large data problems, especially in a large data environment [46,47]. According to Mountrakis, et al. [45], when using labeled data, the SVM training model aims to separate the data into different classes by allocating a hyperplane.

2.6.2. Random Forest

Random forest is known as an ensemble learning technique that integrates many decision trees to improve the overall classification. According to Breiman [48], RF produces each tree using the bootstrapping method, which then randomly selects samples and features from the original dataset. Furthermore, this model is at an advantage since it combines many decision trees as opposed to the classification and regression trees (CART) method. Additionally, RF also uses mtry and ntree to optimize the model, whereby mtry uses the different predictors which are tested at the node with a default of 1/3, while ntree uses the number of trees grown through using the bootstrapped observation [48,49]. Since the RF model is a nonparametric model, assumptions based on data distribution are not required. The advantages of this model include its easy and efficient implementation as well as its improved ability to cope with large datasets [50]. Furthermore, it has the ability to optimize the classification and regression technique through the combination of decision trees.

2.6.3. Deep Learning

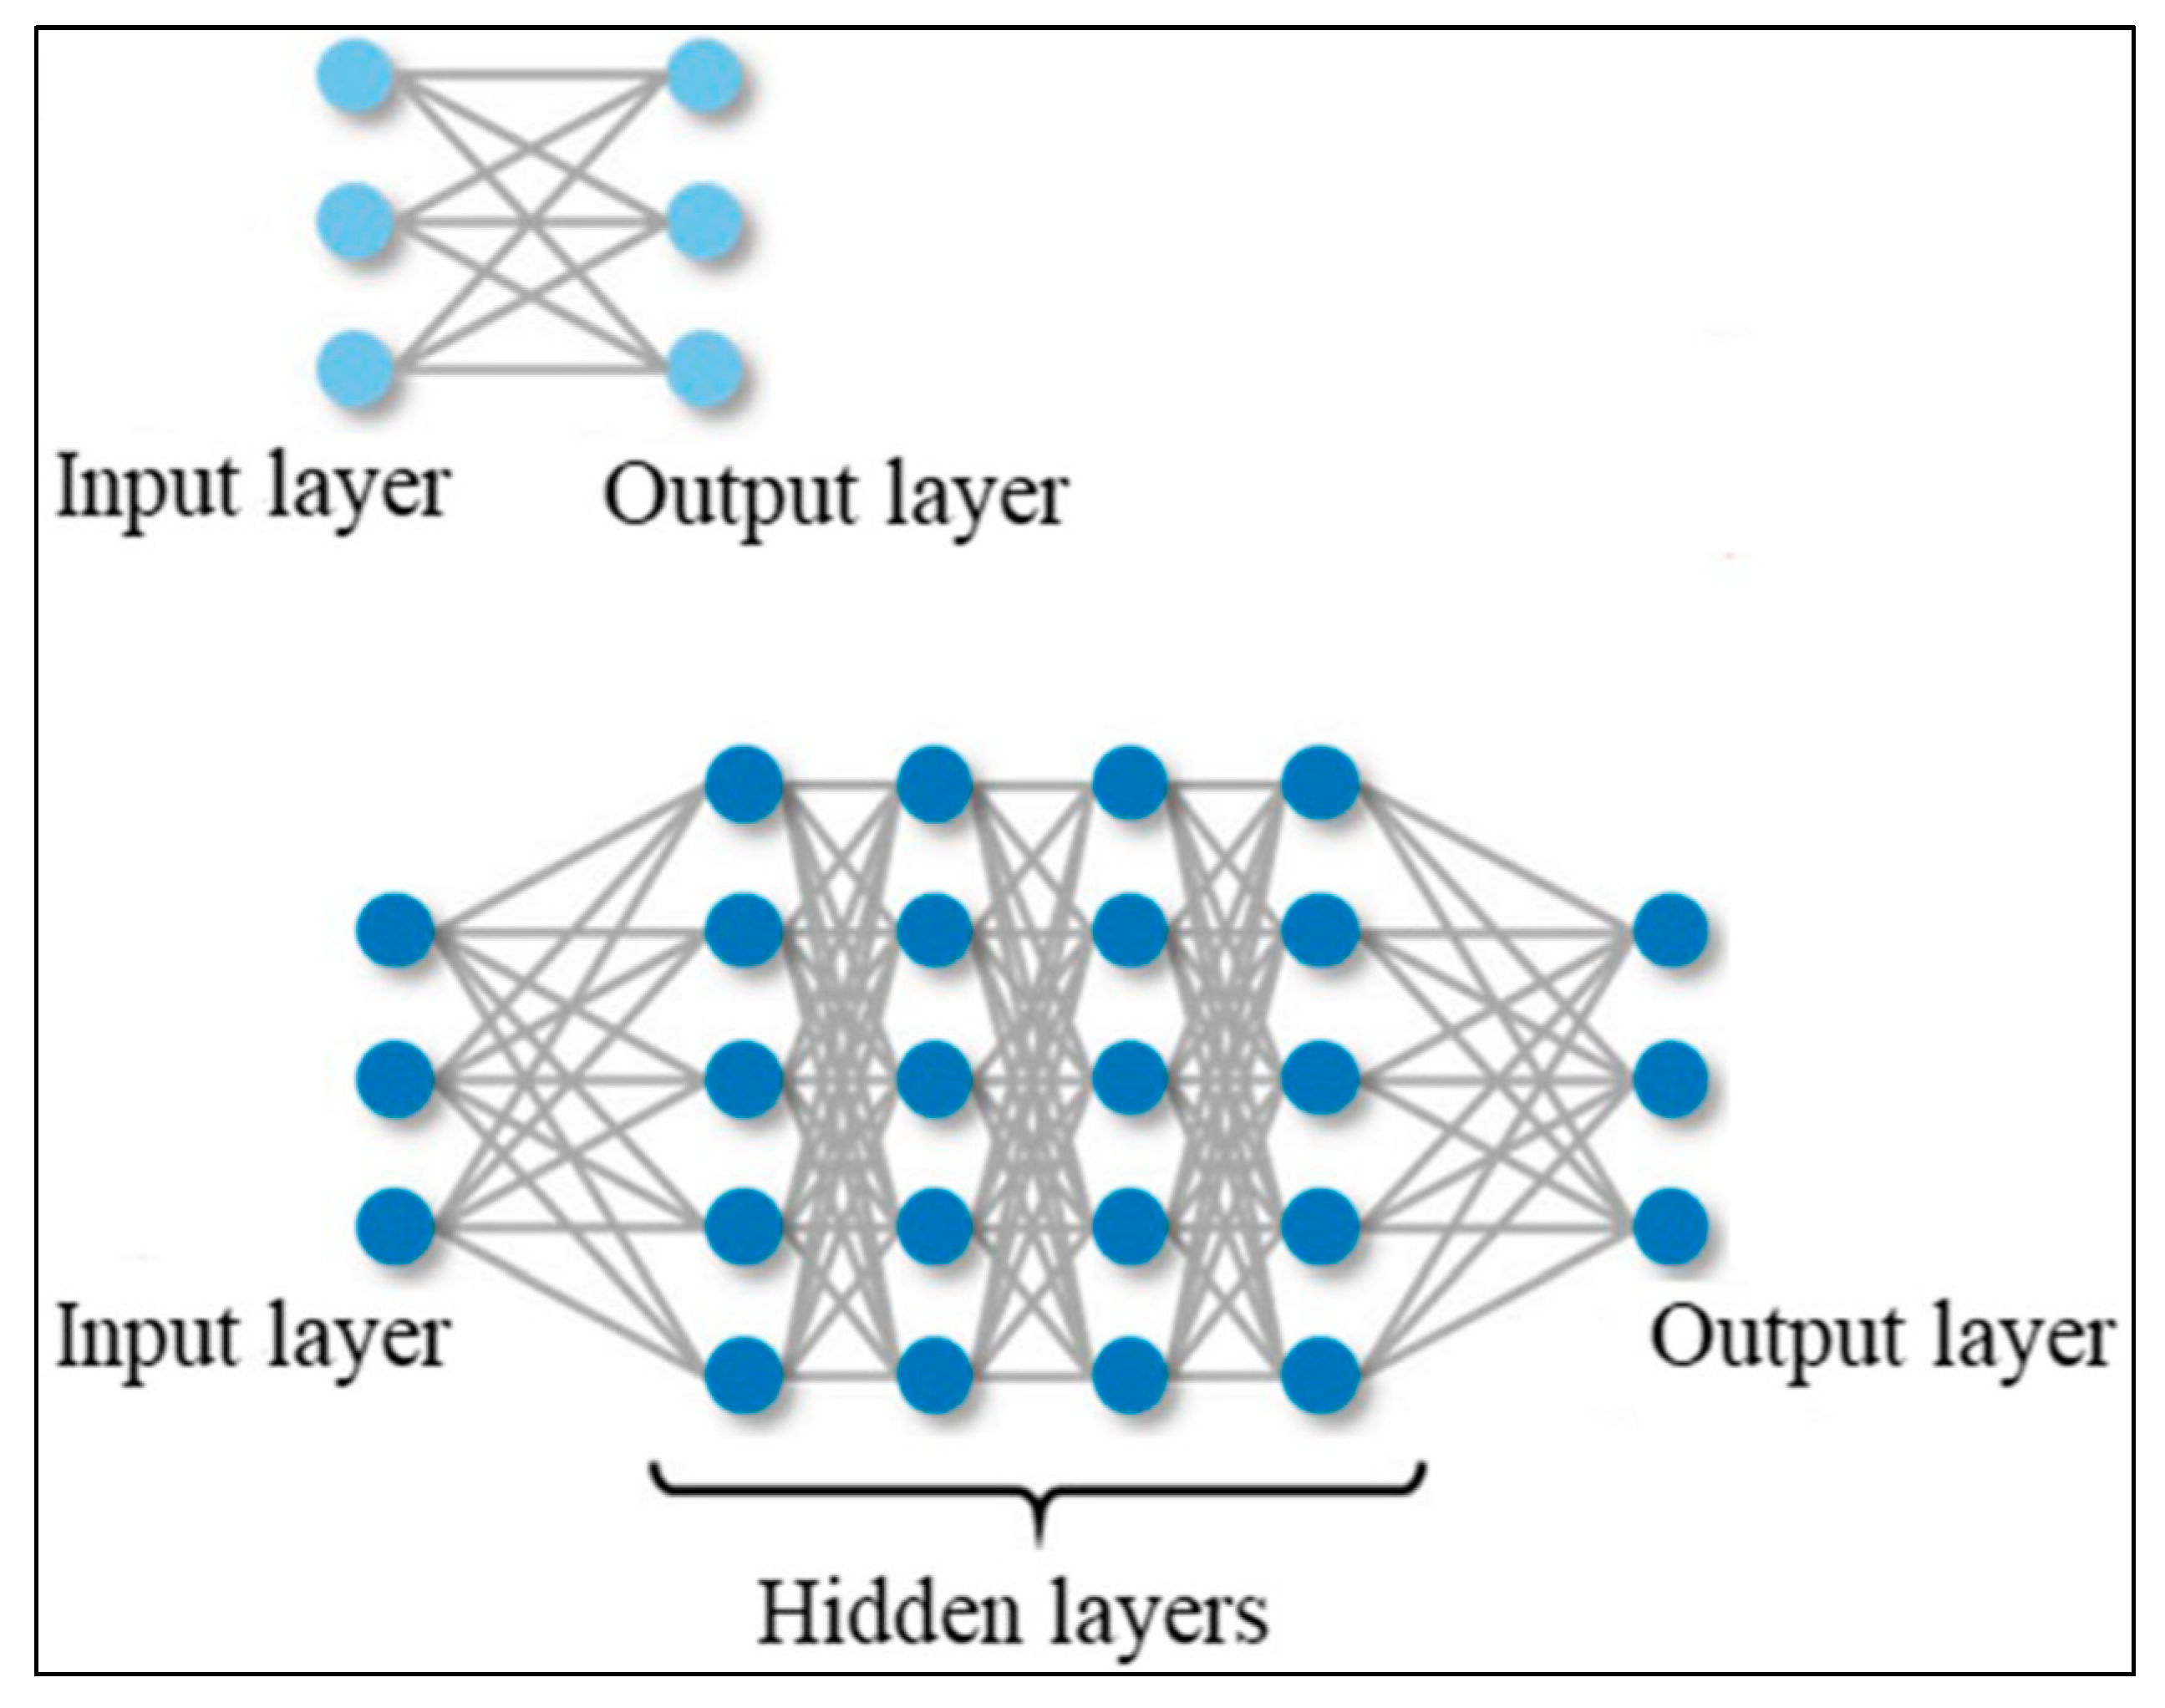
Deep learning models make use of advanced computer techniques that allow the model to learn feature representations in the dataset while using various processing layers [51]. Additionally, DL models are an extension of ML algorithms since they consist of algorithms that perform tasks without human programming [52]. DL models make use of neural networks and consist of many layers that transform the input data into outputs while using and learning higher-level features [52]. Furthermore, the layers that are situated between the input and output are known as hidden layers, as illustrated in Figure 4 [52]. Since DL is based on artificial neural networks (ANNs) and contains many hidden layers, it is considered ‘deep’ hence producing the term ‘deep learning’ and referred to as deep neural networks (DNNs) [53]. Furthermore, the learning of higher features allows the computer system to randomly find representations of classifications from raw datasets [51]. The main advantage of DL is that they can cope with large datasets and are often associated with heterogeneity [54].

2.7. Accuracy Assessment

Using a confusion matrix, the results of the overall accuracy (OA) were calculated. The confusion matrix was calculated by categorizing the total dataset into training datasets (70%) and test datasets (30%) while utilizing a repeated holdout sample with 100 iterations [55]. The class accuracies for individual infected trees were compared to the producer’s accuracy. To calculate the producer’s accuracy, the correct number of infected trees is divided by the total number of tree species that were classified. In order to determine the error matrix, the kappa analysis was used whereby it uses the k (KHAT) statistic, where coefficients that are equal or closer to one adopt a perfect agreement [55].

3. Results

3.1. Classification Accuracies Using RGB Bands and Derived Visible Indices Only

Figure 5 indicates that the FLM model produced the highest overall accuracy of 84.4%, k = 0.78, and a total model run time of 6 s. The DL model had the second-highest accuracy of 81.7%, k = 0.75, and total model run time of 4 s, while the RF model achieved the lowest accuracy (OA = 76.1%, k = 0.72, 7 s).

3.2. Frequency Analysis Showing the Most Contributing Variables Selected by FLM

Figure 6 indicates that the red band (Band 1) obtained the highest frequency of 0.43 while the blue band (Band 3) obtained the lowest frequency of 0.10. When viewing the VIs, SCI obtained the highest frequency of 0.07, VARI obtained the second-highest frequency of 0.06, and GLI had the lowest frequency (0.01).

3.3. Classification Accuracies When Combining RGB Bands and Indices with Texture

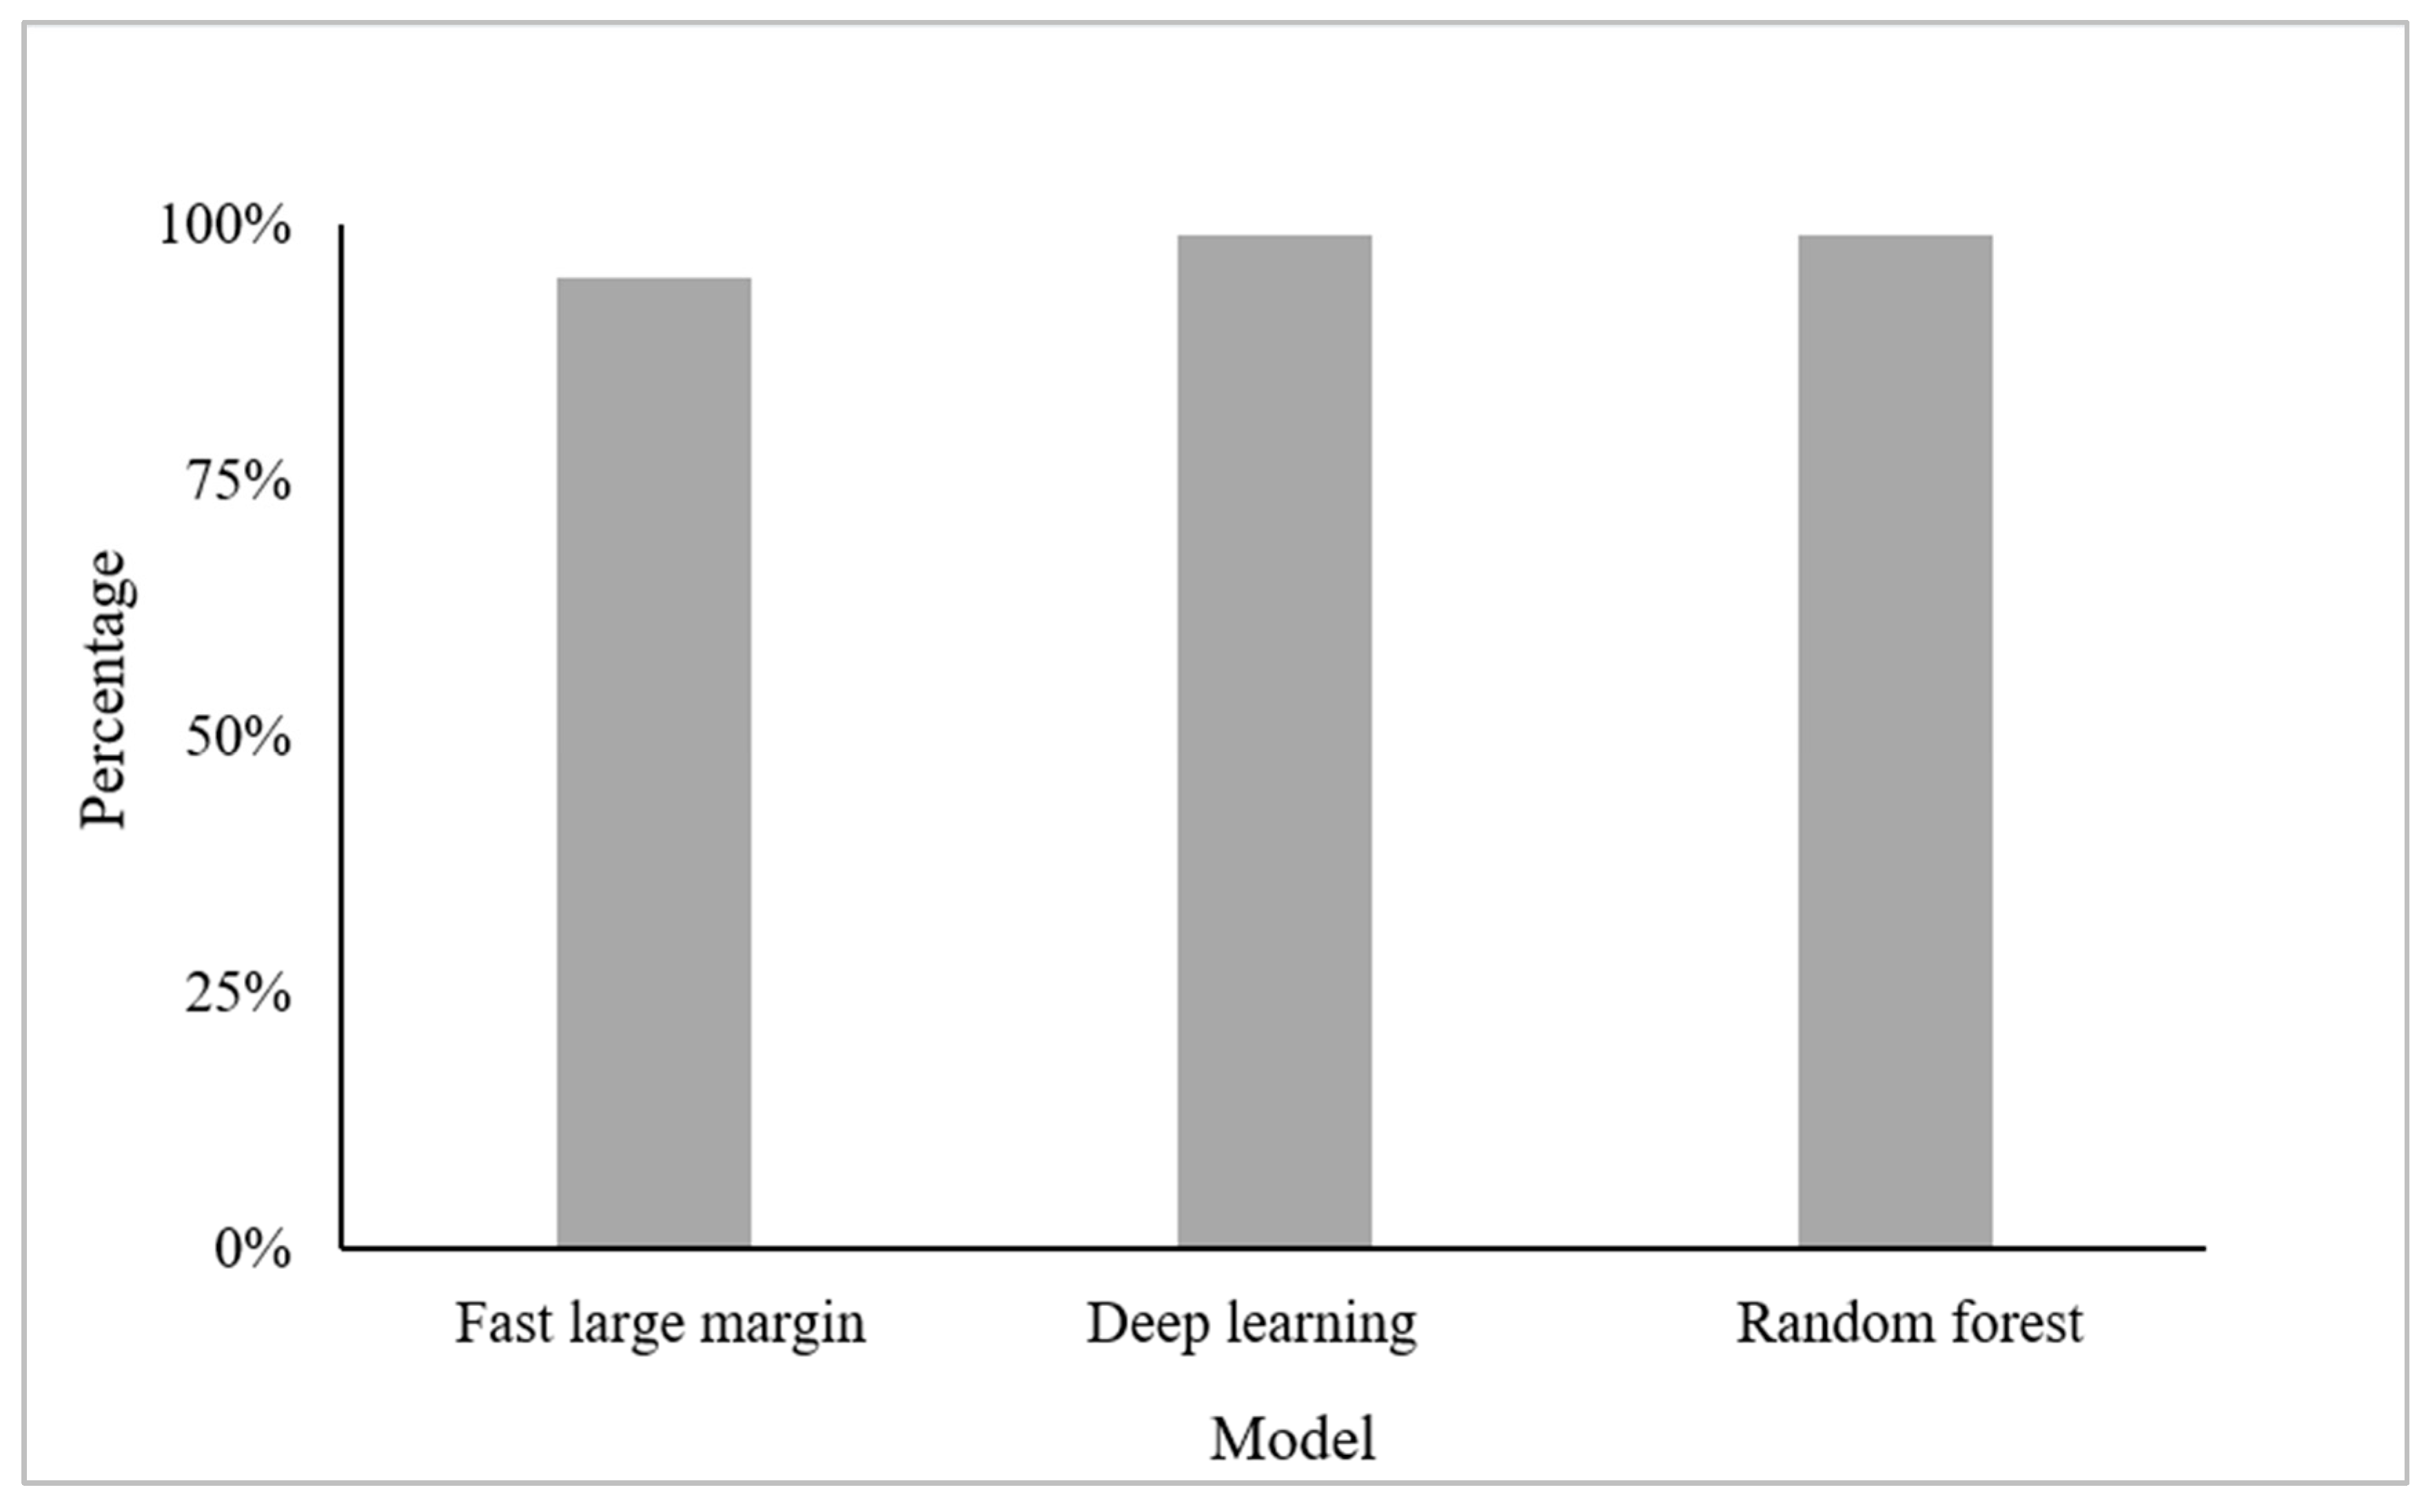
Figure 7 indicates that the DL model obtained the highest overall accuracy of 98.9% with a k of 0.86 and a total model run time of 6 s. The model used 30 epochs using 4 hidden layers with 200 neurons. The RF model also obtained the highest accuracy of 98.9%, with a k of 0.84 and a total model run time of 11 s, while the FLM model had the lowest accuracy (OA = 94.8%, k = 0.79 with a total model run time of 9 s. Based on the highest accuracy and total run time, the DL model obtained the fastest model run time using 8 Epochs and was considered the best-performing model.

3.4. Frequency of Variables Selected by the DL Model

Figure 8 indicates that the red band (Band 1) remains the highest selected band with a frequency of 0.04, while the green band (Band 2) obtained the lowest frequency of 0.01. When viewing the VIs, VARI obtained the highest frequency of 0.04, SCI obtained the second-highest frequency of 0.02, and GLI remained the lowest with a frequency of 0.01.
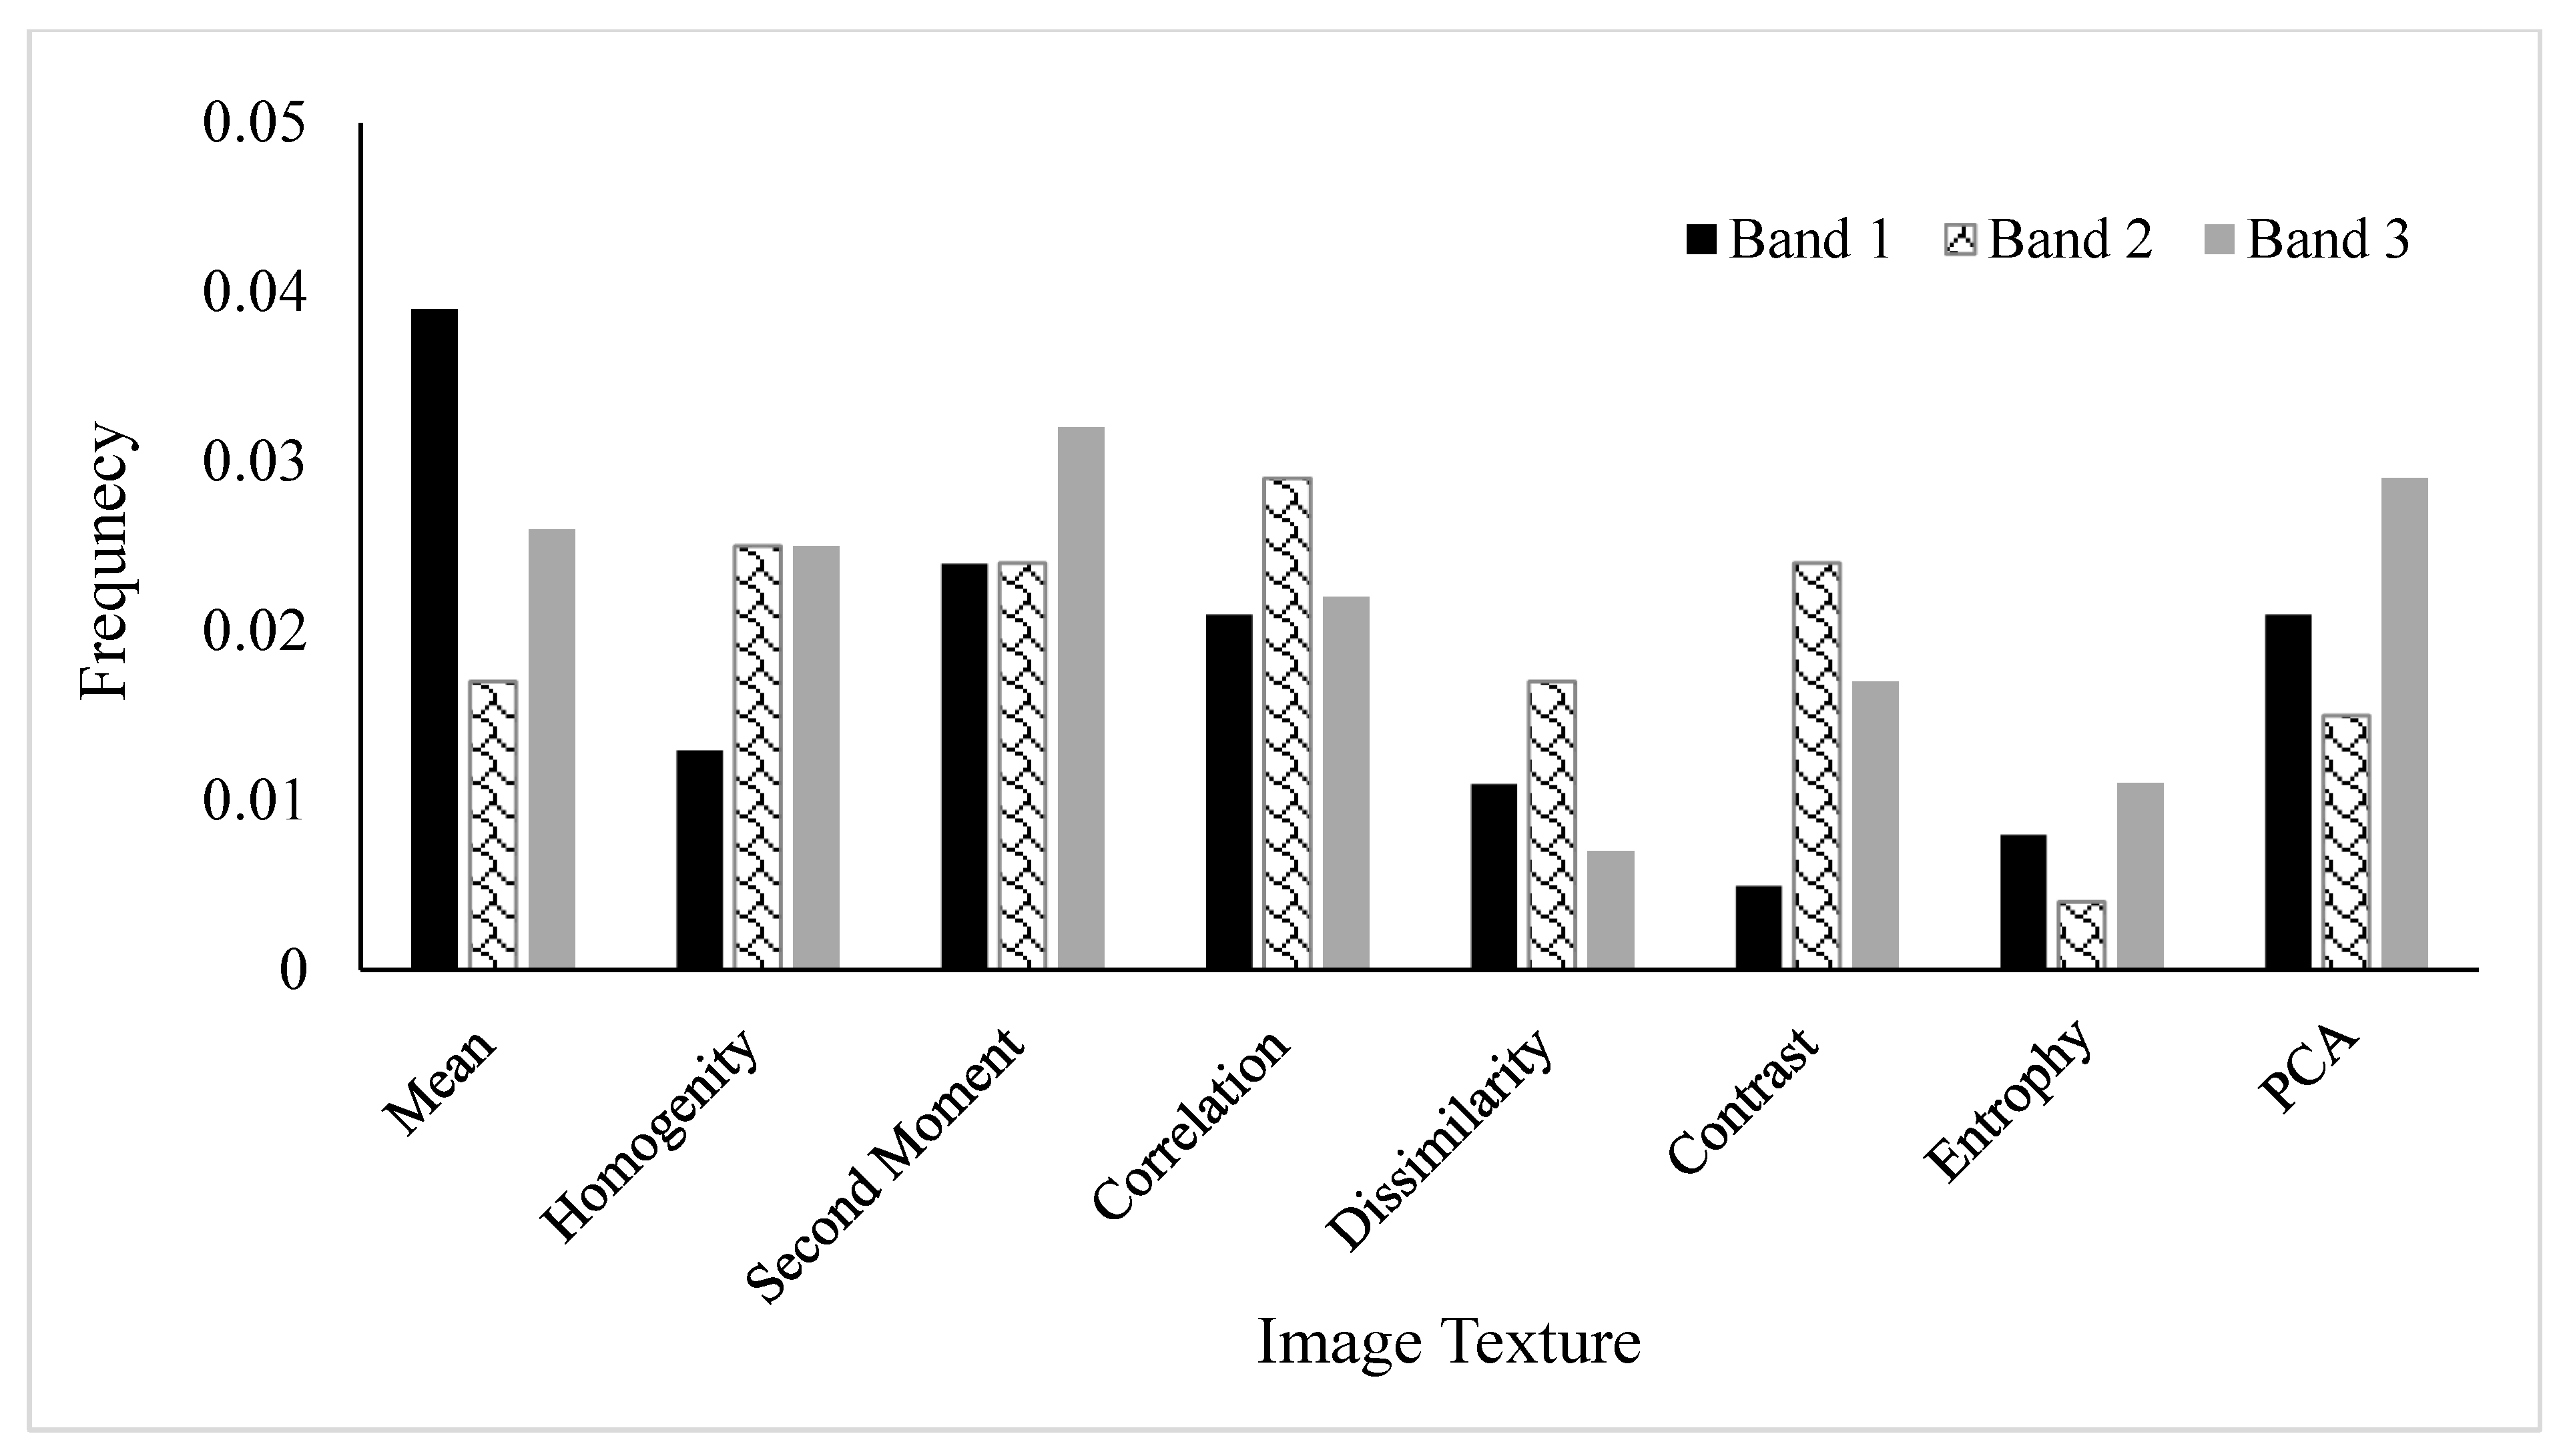
The inclusion of textural variables derived from each band, was also evaluated for their contribution to the DL model. Noticeable is the consistency in frequency of the first four texture variables while the combination of all information into three principle components (PCA) proved insightful (Figure 9).
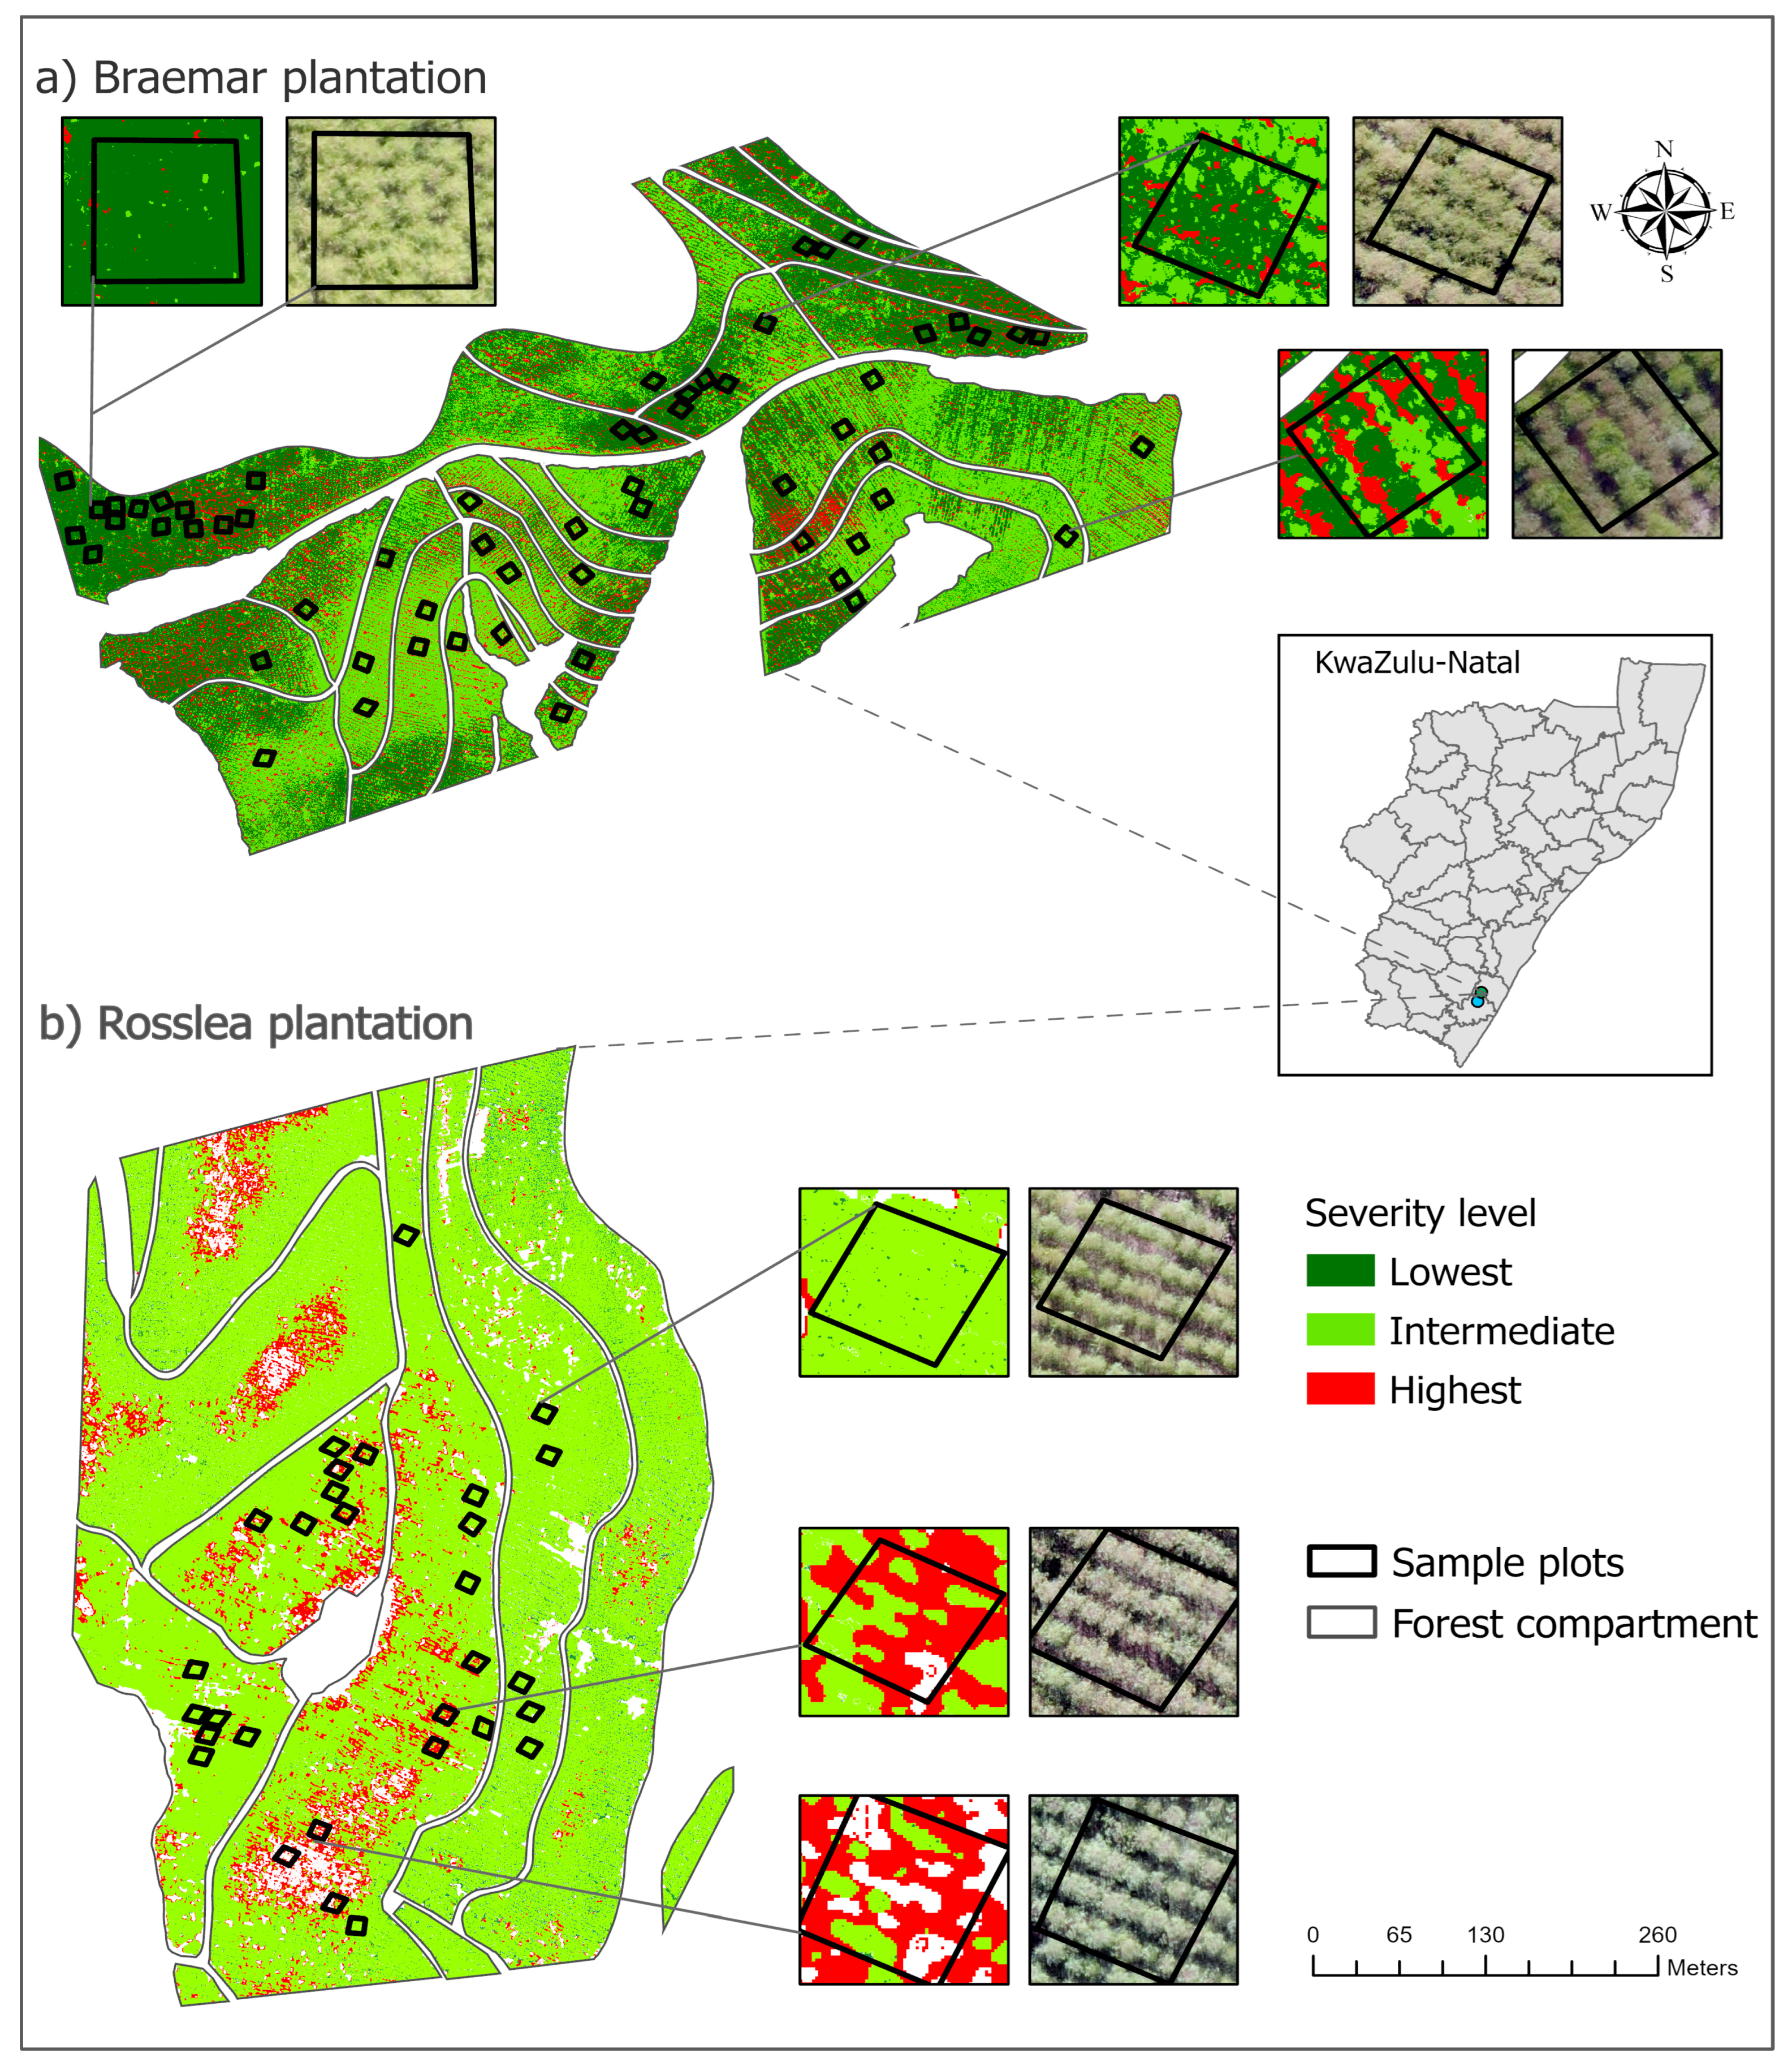
The overall accuracy is shown in Table 3 for the best model (i.e., DL) for using a combination of visible bands, indices, and image texture to accurately classify the varying infection levels noticed in commercial Eucalyptus plantations in South Africa. The spatial distribution map produced by the classification procedure for the selected comparmtents is shown by Figure 10.

4. Discussion

It is important to understand the spatial distribution of E. masingae within commercial forests as it will allow forest managers to identify disease-infested areas and adopt early protection protocols. Consequently, it will allow for appropriate forest management strategies to take place to reduce and mitigate the negative impacts on tree health as well as limit the spread of occurrence. There have been no studies that documented the use of UAVs together with combining texture analysis, vegetation indices (VIs), machine learning (ML), and deep learning (DL) algorithms in detecting and mapping the spatial distribution of E. masingae within a commercial forest. Hence, this study is the first to detect and map this forest disease within commercial forestry in South Africa. Further studies may upscale such methodologies to a landscape level for a broader assessment of this newly discovered plant pathogen variant.

4.1. Image Texture, Visible Indices, and Implications on Disease Mapping in Forestry

This study showed the potential of image texture and VIs computed from UAV-based data together with the use of the Rapidminer software (version 9.10) in analyzing the performance of the FLM, RF, and DL models in mapping the occurrence of E. masingae within commercial forest plantations. The study has shown that the models integrated with VIs and image texture outperformed the models with the use of VIs alone. The importance of image texture in forestry has been recognized by many studies [56]. However, its ability has not been properly investigated in detecting commercial forest diseases. The results of this study have shown that incorporating image texture into the investigation outperformed the analysis with VIs. This could be due to the changes in the tree structures and color as well as the high-resolution imagery obtained from the UAV sensor.
The results of this study are consistent with existing studies that noted the importance of high spatial resolution imagery in texture analysis [29,57,58]. For example, Feng, et al. [56] used high-resolution imagery obtained from a UAV sensor with the co-occurrence texture parameters and nine different moving window sizes to map urban vegetation. Moskal and Franklin [29] also found that airborne remote sensing imagery with a spatial resolution of 60 cm performed better as opposed to imagery consisting of a spatial resolution of 1 m since the texture combined with the highest resolution imagery produced detailed information pertaining to the crown structure of individual trees. The co-occurrence texture parameters selected the mean, second moment, and correlation parameters which contributed significantly as they helped analyze disease distribution efficiently. These results were observed in numerous studies such as Sibiya, et al. [28] and Feng, et al. [56] as they utilized the co-occurrence texture parameters which contributed to the effective vegetation mapping and discrimination of species. Recently, Lottering, et al. [2] showed that the co-occurrence texture parameters, namely homogeneity, second moment, and mean, effectively detected Bugweed in a commercial forest using the partial least square discriminant analysis (PLS-DA) and the sparse partial least square discriminant analysis (SPLS-DA) models.

4.2. Model Comparisons and Variable Importance

In addition, the classification method that included image texture has shown that the DL model obtained the highest classification accuracy of 98.9% and a k statistic of 0.84. The DL model frequently selected the red band; however, the visible atmospheric resistance index (VARI) was the highest-performing vegetation index in classifying disease distribution. This is due to the index’s reduced sensitivity to experiencing atmospheric effects resulting in an improved assessment of vegetation characteristics [17]. The results of this study were supported by the findings of Nazir, et al. [17], as they also found the VARI-green index to be most significant in mapping forest pathogens in Eucalyptus trees. However, the classification method without image texture has shown that the FLM model obtained the highest classification accuracy of 84.4% and a k statistic of 0.78. The FLM model selected the red and green bands of the UAV sensor which were useful in detecting infected trees. According to Lottering, et al. [2], the selection was based on the necessary information contained in these bands. The red band was most significant and illustrated its potential to detect disease-infested areas. This could be attributed to the spectral range proving sufficient information pertaining to plant characteristics and stress, allowing for the effective analysis of vegetation health. According to Feriansyah, et al. [59], unhealthy and stressed forests are prone to reflecting the red wavelength, hence indicating that a large number of trees in this study were infected.
Although both methods effectively discriminate the spatial distribution of the forest disease, the DL model was most efficient in detecting disease areas with the use of VIs and image texture. The results of the study have shown that the DL model outperformed the RF and FLM models. The results indicated that the DL and RF models obtained the highest classification accuracy of 98.9%. However, when viewing the fastest run time of each model, the DL model had the fastest time of 6 s as opposed to the RF model, which had a run time of 11 s. The outperformance of the DL model could be due to the improved ability of the model to analyze the textural and spectral characteristics of the tree structure as well as the use of the many hidden layers without human intervention of features [60].
Since the DL model had the highest accuracy and the fastest run time, it was the most efficient model in detecting E. masingae infestation. In a similar study conducted by Hartling, et al. [60], they compared the support vector machine (SVM) and the RF model to the DL model when classifying urban tree species. The results of this study indicated that the DL model significantly outperformed the RF and SVM classifiers [60]. Similarly, Nezami, et al. [61] also found that deep neural networks (DNNs) illustrated superior results as opposed to the conventional ML models. The 3D convolutional neural network (CNN) model used hyperspectral and RGB UAV imagery to classify tree species and obtained the best results since the overall accuracy was 98.3% [61]. Nevertheless, the classification of forest disease without image texture has shown that the FLM model had the highest accuracy of 84.4%, while DL had the second-highest accuracy of 81.7%. The outperformance of the FLM model may be due to the fast and large margin approach that the FLM model adopts, as well as the semi-supervised technique that works well with large datasets [62]. Together with that, FLM contains an improved efficiency using smaller datasets as opposed to the DL model since it works best with larger datasets [62]. However, since the DL model obtained the fastest run time of 4 s, it can be viewed as the most effective model. In this regard, DL models proved to be most effective over conventional ML models, which have also been supported by the results gathered in this study.

4.3. Spatial Distribution of E. masingae Within the Forest

The results of the study indicated that the DL model, integrated with image texture, effectively mapped E. masingae within the Rosslea and Braemar study areas of KwaZulu-Natal. The spatial distribution map in Figure 10 indicates a consistent distribution of the Eucalyptus Scab within both study areas as noticed in the field. The Rosslea plantation is densely concentrated with Elsinoë along the west of the commercial plantation and more prominent along the border and central regions of the compartments indicating the high levels of disease infestation. The eastern compartment is characterized by an intermediate infestation which may be due to the tree age, their soil types, and their geographical location [7]. Furthermore, climatic conditions and humidity are key drivers of forest pathogens, which contributed to their dense occurrence along the study areas resulting in reduced forest health [63,64]. In terms of E. masingae distribution within the Braemar plantation, the southern compartments indicate an intermediate infestation, whereas the northern compartments indicate an extremely low infestation. According to Chungu, et al. [65], the increase in trade, poor planting techniques, and inadequate pruning techniques play a role in the emergence of forest pathogens. For example, Pham, et al. [13] found that El necatrix (Elsinoe species) severely impacted approximately 40,000 ha of Eucalyptus in North Sumatra of Indonesia. Furthermore, it was noted that the pathogen might have accidentally entered the environment, or has encountered vulnerable host trees, thus favoring spread.
Nonetheless, it is expected that when the presence of a disease has an impact on the wellbeing of trees, remotely sensed imageries such as those collected from UAVs will generally show a reduction in vegetation and green phytomass. Thus, the limitation of investigating the occurrence of only one disease without comparison to any other could lead to another plant disease displaying similar signs and symptoms of Elsinoë when using remotely sensed image datasets. For this reason, there is a need for a multi-site validation of the results and transfer learning for broader applicability than the two plantations used in this study. This includes testing the applicability of the DL models’ limited generalization capacity beyond this region.

5. Conclusions

Overall, this study was the first to use machine learning and deep learning models for mapping Elsinoë masingae, recently identified in southern Africa. In addition, it was the first to use vegetation indices and image texture to map the spatial distribution of the disease within commercial forests in KwaZulu-Natal. The imagery obtained from the UAV sensor was seen to be a reliable remote sensing tool due to its enhanced efficiency in the data collection process. The results obtained from this study will play a role in understanding the spatial distribution of the disease within the forest environment, further allowing for the implementation of effective management strategies to reduce disease spread. Furthermore, the implementation of proper management strategies within commercial forests has the potential to promote sustainable resource use of forest products, together with conserving biodiversity while also promoting economic growth. Therefore, it is important to make use of advanced remote sensing technologies such as UAVs to allow for successful disease detection, which will promote economic growth while also creating job opportunities within the forest sector. Hence, this study showcases the ability of inexpensive technologies that may contribute positively to the social, environmental, and economic domains of society.

Author Contributions

Conceptualization, N.D., K.P. and R.L.; Data curation R.L. and K.P.; Investigation, N.D. and N.A.; Formal analysis, N.D. and K.P.; Methodology, N.D. and K.P.; Software, N.D.; Writing—original draft, N.D. and N.A.; Writing—review and editing, N.D., N.A. and M.P.; Visualization N.D. and K.P.; Validation, K.P. and M.P.; Supervision, R.L. All authors have read and agreed to the published version of the manuscript.

Funding

This research was financially supported by the National Research Foundation of South Africa Grant No. 114898 and 127354.

Data Availability Statement

The raw data supporting the conclusions of this article will be made available by the authors upon request.

Conflicts of Interest

The authors declare no conflict of interest.

References

  1. DAFF. Report on Commercial Timber Resources and Primary Roundwood Processing in South Africa; DAFF: Gauteng, South Africa, 2008. [Google Scholar]
  2. Lottering, R.T.; Govender, M.; Peerbhay, K.; Lottering, S. Comparing partial least squares (PLS) discriminant analysis and sparse PLS discriminant analysis in detecting and mapping Solanum mauritianum in commercial forest plantations using image texture. ISPRS J. Photogramm. Remote Sens. 2020, 159, 271–280. [Google Scholar] [CrossRef]
  3. Uzu, J.; Bettinger, P.; Siry, J.; Mei, B. Timber business in West Africa: A review and outlook. Int. For. Rev. 2022, 24, 240–256. [Google Scholar] [CrossRef]
  4. Freer-Smith, P.H.; Webber, J.F. Tree pests and diseases: The threat to biodiversity and the delivery of ecosystem services. Biodivers. Conserv. 2017, 26, 3167–3181. [Google Scholar] [CrossRef]
  5. Sturrock, R.; Frankel, S.; Brown, A.; Hennon, P.; Kliejunas, J.; Lewis, K.; Worrall, J.; Woods, A. Climate change and forest diseases. Plant Pathol. 2011, 60, 133–149. [Google Scholar] [CrossRef]
  6. Ramsfield, T.; Bentz, B.; Faccoli, M.; Jactel, H.; Brockerhoff, E. Forest health in a changing world: Effects of globalization and climate change on forest insect and pathogen impacts. Forestry 2016, 89, 245–252. [Google Scholar] [CrossRef]
  7. Balla, A.; Silini, A.; Cherif-Silini, H.; Chenari Bouket, A.; Moser, W.K.; Nowakowska, J.A.; Oszako, T.; Benia, F.; Belbahri, L. The threat of pests and pathogens and the potential for biological control in forest ecosystems. Forests 2021, 12, 1579. [Google Scholar] [CrossRef]
  8. Fan, X.; Barreto, R.; Groenewald, J.; Bezerra, J.; Pereira, O.; Cheewangkoon, R.; Mostert, L.; Tian, C.; Crous, P. Phylogeny and taxonomy of the scab and spot anthracnose fungus Elsinoë (Myriangiales, Dothideomycetes). Stud. Mycol. 2017, 87, 1–41. [Google Scholar] [CrossRef]
  9. Swart, L.; Crous, P.W.; Kang, J.-C.; Mchau, G.R.; Pascoe, I.; Palm, M.E. Differentiation of species of Elsinoë associated with scab disease of Proteaceae based on morphology, symptomatology, and ITS sequence phylogeny. Mycologia 2001, 93, 366–379. [Google Scholar] [CrossRef]
  10. Chung, K.R. Elsinoë fawcettii and Elsinoë australis: The fungal pathogens causing citrus scab. Mol. Plant Pathol. 2011, 12, 123–135. [Google Scholar] [CrossRef]
  11. Roux, J.; Wingfield, M.J.; Marincowitz, S.; Solís, M.; Phungula, S.; Pham, N.Q. Eucalyptus scab and shoot malformation: A new disease in South Africa caused by a novel species, Elsinoe masingae. For. Int. J. For. Res. 2024, 97, 327–338. [Google Scholar] [CrossRef]
  12. Bulman, L.; Bradshaw, R.; Fraser, S.; Martín-García, J.; Barnes, I.; Musolin, D.L.; La Porta, N.; Woods, A.; Diez, J.J.; Koltay, A. A worldwide perspective on the management and control of Dothistroma needle blight. For. Pathol. 2016, 46, 472–488. [Google Scholar] [CrossRef]
  13. Pham, N.Q.; Marincowitz, S.; Solís, M.; Duong, T.A.; Wingfield, B.D.; Barnes, I.; Slippers, B.; Muro Abad, J.I.; Durán, A.; Wingfield, M.J. Eucalyptus scab and shoot malformation: A new and serious foliar disease of Eucalyptus caused by Elsinoe necatrix sp. nov. Plant Pathol. 2021, 70, 1230–1242. [Google Scholar] [CrossRef]
  14. Prospero, S.; Botella, L.; Santini, A.; Robin, C. Biological control of emerging forest diseases: How can we move from dreams to reality? For. Ecol. Manag. 2021, 496, 119377. [Google Scholar] [CrossRef]
  15. Coops, N.; Stanford, M.; Old, K.; Dudzinski, M.; Culvenor, D.; Stone, C. Assessment of Dothistroma needle blight of Pinus radiata using airborne hyperspectral imagery. Phytopathology 2003, 93, 1524–1532. [Google Scholar] [CrossRef]
  16. Dash, J.P.; Watt, M.S.; Pearse, G.D.; Heaphy, M.; Dungey, H.S. Assessing very high resolution UAV imagery for monitoring forest health during a simulated disease outbreak. ISPRS J. Photogramm. Remote Sens. 2017, 131, 1–14. [Google Scholar] [CrossRef]
  17. Nazir, M.M.; Najib, M.; Razak, T.; Ahmad, N.; Sheriza, M.R.; Roger, M. Early monitoring of health status of plantation-grown eucalyptus pellita at large spatial scale via visible spectrum imaging of canopy foliage using unmanned aerial vehicles. Forests 2021, 12, 1393. [Google Scholar] [CrossRef]
  18. Lausch, A.; Erasmi, S.; King, D.J.; Magdon, P.; Heurich, M. Understanding forest health with remote sensing-part I—A review of spectral traits, processes and remote-sensing characteristics. Remote Sens. 2016, 8, 1029. [Google Scholar] [CrossRef]
  19. Chemura, A.; Mutanga, O.; Dube, T. Separability of coffee leaf rust infection levels with machine learning methods at Sentinel-2 MSI spectral resolutions. Precis. Agric. 2017, 18, 859–881. [Google Scholar] [CrossRef]
  20. Oumar, M.S.; Peerbhay, K.; Germishuizen, I.; Mutanga, O.; Oumar, Z. Detecting canopy damage caused by Uromycladium acaciae on South African Black Wattle forest compartments using moderate resolution satellite imagery. South Afr. J. Geomat. 2019, 8, 69–83. [Google Scholar] [CrossRef]
  21. Ecke, S.; Dempewolf, J.; Frey, J.; Schwaller, A.; Endres, E.; Klemmt, H.-J.; Tiede, D.; Seifert, T. UAV-based forest health monitoring: A systematic review. Remote Sens. 2022, 14, 3205. [Google Scholar] [CrossRef]
  22. Allen, B.; Dalponte, M.; Ørka, H.O.; Næsset, E.; Puliti, S.; Astrup, R.; Gobakken, T. UAV-based hyperspectral imagery for detection of root, butt, and stem rot in Norway Spruce. Remote Sens. 2022, 14, 3830. [Google Scholar] [CrossRef]
  23. Shamaoma, H.; Chirwa, P.W.; Ramoelo, A.; Hudak, A.T.; Syampungani, S. The application of UASs in forest management and monitoring: Challenges and opportunities for use in the Miombo woodland. Forests 2022, 13, 1812. [Google Scholar] [CrossRef]
  24. Abdulridha, J.; Batuman, O.; Ampatzidis, Y. UAV-based remote sensing technique to detect citrus canker disease utilizing hyperspectral imaging and machine learning. Remote Sens. 2019, 11, 1373. [Google Scholar] [CrossRef]
  25. Marin, S.; Santos, L.; Barbosa, B.D.S.; Barata, R.A.P.; Osco, L.P.; Ramos, A.P.M.; Guimarães, P.H.S. Detecting coffee leaf rust with UAV-based vegetation indices and decision tree machine learning models. Comput. Electron. Agric. 2021, 190, 106476. [Google Scholar] [CrossRef]
  26. Mutanga, O.; Skidmore, A. Integrating imaging spectroscopy and neural networks to map grass quality in the Kruger National Park, South Africa. Remote Sens. Environ. 2004, 90, 104–115. [Google Scholar] [CrossRef]
  27. Purevdorj, T.; Tateishi, R.; Ishiyama, T.; Honda, Y. Relationships between percent vegetation cover and vegetation indices. Int. J. Remote Sens. 1998, 19, 3519–3535. [Google Scholar] [CrossRef]
  28. Sibiya, B.; Lottering, R.; Odindi, J. Discriminating commercial forest species using image texture computed from a worldview-2 pan-sharpened image and partial least squares discriminant analysis. Remote Sens. Appl. Soc. Environ. 2021, 23, 100605. [Google Scholar] [CrossRef]
  29. Moskal, L.; Franklin, S. Multi-layer forest stand discrimination with spatial co-occurrence texture analysis of high spatial detail airborne imagery. Geocarto Int. 2002, 17, 55–68. [Google Scholar] [CrossRef]
  30. Champion, I.; Germain, C.; Da Costa, J.P.; Alborini, A.; Dubois-Fernandez, P. Retrieval of forest stand age from SAR image texture for varying distance and orientation values of the gray level co-occurrence matrix. IEEE Geosci. Remote Sens. Lett. 2013, 11, 5–9. [Google Scholar] [CrossRef]
  31. Li, J.; Rich, W.; Buhl-Brown, D. Texture analysis of remote sensing imagery with clustering and Bayesian inference. Int. J. Image Graph. Signal Process. 2015, 7, 1–10. [Google Scholar] [CrossRef]
  32. Journaux, L.; Simon, J.-C.; Destain, M.-F.; Cointault, F.; Miteran, J.; Piron, A. Plant leaf roughness analysis by texture classification with generalized Fourier descriptors in a dimensionality reduction context. Precis. Agric. 2011, 12, 345–360. [Google Scholar] [CrossRef]
  33. Chetty, S.; Mutanga, O.; Lottering, R. Detecting and mapping invasive Parthenium hysterophorus L. along the northern coastal belt of KwaZulu-Natal, South Africa using image texture. Sci. Afr. 2021, 13, e00966. [Google Scholar] [CrossRef]
  34. Yuan, X.; King, D.; Vlcek, J. Sugar maple decline assessment based on spectral and textural analysis of multispectral aerial videography. Remote Sens. Environ. 1991, 37, 47–54. [Google Scholar] [CrossRef]
  35. Alvarenga, A.V.; Pereira, W.C.; Infantosi, A.F.C.; Azevedo, C.M. Complexity curve and grey level co-occurrence matrix in the texture evaluation of breast tumor on ultrasound images. Med. Phys. 2007, 34, 379–387. [Google Scholar] [CrossRef]
  36. Gebejes, A.; Huertas, R.; Tremeau, A.; Tomic, I.; Biswas, P.R.; Fraza, C.; Hauta-Kasari, M. Texture characterization by grey-level co-occurrence matrix from a perceptual approach. In Proceedings of the Color and Imaging Conference, San Diego, CA, USA, 7–11 November 2016; pp. 271–277. [Google Scholar]
  37. Lottering, R.; Mutanga, O.; Peerbhay, K.; Ismail, R. Detecting and mapping Gonipterus scutellatus induced vegetation defoliation using WorldView-2 pan-sharpened image texture combinations and an artificial neural network. J. Appl. Remote Sens. 2019, 13, 014513. [Google Scholar] [CrossRef]
  38. Materka, A.; Strzelecki, M. Texture analysis methods–a review. Tech. Univ. Lodz Inst. Electron. COST B11 Rep. Bruss. 1998, 10, 4968. [Google Scholar]
  39. Yuan, Y.; Hu, X. Random forest and objected-based classification for forest pest extraction from UAV aerial imagery. Int. Arch. Photogramm. Remote Sens. Spat. Inf. Sci. 2016, 41, 1093–1098. [Google Scholar] [CrossRef]
  40. Jackson, R.D.; Huete, A.R. Interpreting vegetation indices. Prev. Vet. Med. 1991, 11, 185–200. [Google Scholar] [CrossRef]
  41. Eng, L.S.; Ismail, R.; Hashim, W.; Baharum, A. The use of VARI, GLI, and VIgreen formulas in detecting vegetation in aerial images. Int. J. Technol. 2019, 10, 1385–1394. [Google Scholar] [CrossRef]
  42. Elazab, A.; Ordóñez, R.A.; Savin, R.; Slafer, G.A.; Araus, J.L. Detecting interactive effects of N fertilization and heat stress on maize productivity by remote sensing techniques. Eur. J. Agron. 2016, 73, 11–24. [Google Scholar] [CrossRef]
  43. Pretorius, M.; Van Huyssteen, C.; Brown, L. Soil color indicates carbon and wetlands: Developing a color-proxy for soil organic carbon and wetland boundaries on sandy coastal plains in South Africa. Environ. Monit. Assess. 2017, 189, 1–18. [Google Scholar] [CrossRef] [PubMed]
  44. Pandesenda, A.I.; Yana, R.R.; Sukma, E.A.; Yahya, A.; Widharto, P.; Hidayanto, A.N. Sentiment analysis of service quality of online healthcare platform using fast large-margin. In Proceedings of the 2020 International Conference on Informatics, Multimedia, Cyber and Information System (ICIMCIS), online, 19–20 November 2020; pp. 121–125. [Google Scholar]
  45. Mountrakis, G.; Im, J.; Ogole, C. Support vector machines in remote sensing: A review. ISPRS J. Photogramm. Remote Sens. 2011, 66, 247–259. [Google Scholar] [CrossRef]
  46. Suthaharan, S. Support vector machine. In Machine Learning Models and Algorithms for Big Data Classification: Thinking with Examples for Effective Learning; Springer: Berlin/Heidelberg, Germany, 2016; pp. 207–235. [Google Scholar]
  47. Noble, W.S. What is a support vector machine? Nat. Biotechnol. 2006, 24, 1565–1567. [Google Scholar] [CrossRef] [PubMed]
  48. Breiman, L. Random forests. Mach. Learn. 2001, 45, 5–32. [Google Scholar] [CrossRef]
  49. Adam, E.; Mutanga, O.; Odindi, J.; Abdel-Rahman, E.M. Land-use/cover classification in a heterogeneous coastal landscape using RapidEye imagery: Evaluating the performance of random forest and support vector machines classifiers. Int. J. Remote Sens. 2014, 35, 3440–3458. [Google Scholar] [CrossRef]
  50. Liao, K.; Yang, F.; Dang, H.; Wu, Y.; Luo, K.; Li, G. Detection of Eucalyptus leaf disease with UAV multispectral imagery. Forests 2022, 13, 1322. [Google Scholar] [CrossRef]
  51. Ahmed, S.F.; Alam, M.S.B.; Hassan, M.; Rozbu, M.R.; Ishtiak, T.; Rafa, N.; Mofijur, M.; Shawkat Ali, A.; Gandomi, A.H. Deep learning modelling techniques: Current progress, applications, advantages, and challenges. Artif. Intell. Rev. 2023, 56, 13521–13617. [Google Scholar] [CrossRef]
  52. Janiesch, C.; Zschech, P.; Heinrich, K. Machine learning and deep learning. Electron. Mark. 2021, 31, 685–695. [Google Scholar] [CrossRef]
  53. Onishi, M.; Ise, T. Explainable identification and mapping of trees using UAV RGB image and deep learning. Sci. Rep. 2021, 11, 903. [Google Scholar] [CrossRef]
  54. Zhang, J.; Huang, Y.; Pu, R.; Gonzalez-Moreno, P.; Yuan, L.; Wu, K.; Huang, W. Monitoring plant diseases and pests through remote sensing technology: A review. Comput. Electron. Agric. 2019, 165, 104943. [Google Scholar] [CrossRef]
  55. Peerbhay, K.Y.; Mutanga, O.; Ismail, R. Commercial tree species discrimination using airborne AISA Eagle hyperspectral imagery and partial least squares discriminant analysis (PLS-DA) in KwaZulu–Natal, South Africa. ISPRS J. Photogramm. Remote Sens. 2013, 79, 19–28. [Google Scholar] [CrossRef]
  56. Feng, Q.; Liu, J.; Gong, J. UAV remote sensing for urban vegetation mapping using random forest and texture analysis. Remote Sens. 2015, 7, 1074–1094. [Google Scholar] [CrossRef]
  57. Sarker, L.R.; Nichol, J.E. Improved forest biomass estimates using ALOS AVNIR-2 texture indices. Remote Sens. Environ. 2011, 115, 968–977. [Google Scholar] [CrossRef]
  58. Zhang, X.; Cui, J.; Wang, W.; Lin, C. A study for texture feature extraction of high-resolution satellite images based on a direction measure and gray level co-occurrence matrix fusion algorithm. Sensors 2017, 17, 1474. [Google Scholar] [CrossRef]
  59. Feriansyah, A.; Safe’i, R.; Darmawan, A.; Kaskoyo, H. Comparison of crown health assessment using forest health monitoring and remote sensing techniques (Case study: KTH Lestari Jaya 8, KPHL Kota Agung Utara, Lampung). IOP Conf. Ser. Earth Environ. Sci. 2022, 1115, 012055. [Google Scholar] [CrossRef]
  60. Hartling, S.; Sagan, V.; Sidike, P.; Maimaitijiang, M.; Carron, J. Urban tree species classification using a WorldView-2/3 and LiDAR data fusion approach and deep learning. Sensors 2019, 19, 1284. [Google Scholar] [CrossRef]
  61. Nezami, S.; Khoramshahi, E.; Nevalainen, O.; Pölönen, I.; Honkavaara, E. Tree species classification of drone hyperspectral and RGB imagery with deep learning convolutional neural networks. Remote Sens. 2020, 12, 1070. [Google Scholar] [CrossRef]
  62. Alam, A.; Reza, R.; Abrar, A.; Ahmed, T.; Ahmed, S.; Sharar, S.; Rasel, A.A. Patients’ Severity States Classification based on Electronic Health Record (EHR) Data using Multiple Machine Learning and Deep Learning Approaches. arXiv 2022, arXiv:2209.14907. [Google Scholar]
  63. Ghelardini, L.; Pepori, A.L.; Luchi, N.; Capretti, P.; Santini, A. Drivers of emerging fungal diseases of forest trees. For. Ecol. Manag. 2016, 381, 235–246. [Google Scholar] [CrossRef]
  64. La Porta, N.; Capretti, P.; Thomsen, I.; Kasanen, R.; Hietala, A.; Von Weissenberg, K. Forest pathogens with higher damage potential due to climate change in Europe. Can. J. Plant Pathol. 2008, 30, 177–195. [Google Scholar] [CrossRef]
  65. Chungu, D.; Muimba-Kankolongo, A.; Wingfield, M.J.; Roux, J. Plantation forestry diseases in Zambia: Contributing factors and management options. Ann. For. Sci. 2010, 67, 802. [Google Scholar] [CrossRef]
Figure 1. Symptoms associated with Eucalyptus Scab Disease (Elsinoë) (Adapted from [13]).
Forests 16 00966 g001
Figure 2. Flow diagram illustrating the research methodology undertaken to detect and map the occurrence and infection level of Elsinoë masingae in commercial Eucalyptus plantations.
Forests 16 00966 g002
Figure 3. Location of study area consisting of two commercial Eucalyptus plantations infected with varying severities of Elsinoë masingae.
Forests 16 00966 g003
Figure 4. Image illustrating the functioning of the deep learning model adapted from [51].
Forests 16 00966 g004
Figure 5. Model accuracy and total run time for each model using visible bands and derived indices for mapping Elsinoe infection levels in commercial Eucalytpus forests.
Forests 16 00966 g005
Figure 6. Indicates the frequency of selected variables of the FLM model from the visible bands and indices for mapping Elsinoë infection levels.
Forests 16 00966 g006
Figure 7. Model accuracy and total run time for each model including textural information.
Forests 16 00966 g007
Figure 8. Indicates the frequency of selected variables of the DL model from the RGB bands and indices.
Forests 16 00966 g008
Figure 9. Provides insight into the co-occurrence textural matrix which played an important role as the most frequently selected variables were the mean, homogeneity, second moment, and correlation when classifying levels of Elsinoe infection in commercial Eucalyptus forests.
Forests 16 00966 g009
Figure 10. Spatial distribution map indicating the occurrence and severity of the pathogen E. masingae within the selected forest compartments.
Forests 16 00966 g010
Table 1. Texture parameters for the grey level co-occurrence matrix (GLCM) used in this study to enhance the detection and classification of Elsinoë in plantation forestry.
ParameterFormulaDescription Texture Sample
Contrast i , j =   0 M 1 P i , j   j 2 Views the local variation concerning image texture [34].Forests 16 00966 i001
Correlation i , j =   0 M 1 P i , j   i μ i   i μ j   σ i 2 σ j 2 Determines the local grey level that is evident on a textured image [35]. Forests 16 00966 i002
Dissimilarity i , j =   0 M 1 P i , j   |   i j   | Measures the different grey level pairs that are evident on an image [36].Forests 16 00966 i003
Homogeneity i ,   j =   0 M 1   P i , j 1 + j 2 Views how smooth the texture is [37]. Forests 16 00966 i004
Mean μ i = i ,   j =   0 M 1 i ( P i , j )   Examines texture by looking at the average intensity level [38].Forests 16 00966 i005
Second Moment i ,   j =   0 M 1 P i , j 2 Views local homogeneity [34]. Forests 16 00966 i006
Variance σ i 2 = i ,   j =   0 M 1   P i , j μ i 2 Calculates the pixels using their unique spectral characteristics [38]. Forests 16 00966 i007
Entropy i ,   j =   0 M 1 P i , j ( 1 n P i , j ) Calculates uncertainty using statistics [39]. Forests 16 00966 i008
Table 2. List of the visible vegetation indices that were explored in this study for enhancing the detection of Elsinoë masingae in commercial Eucalyptus plantations.
Vegetation IndexAbbreviationEquationReference Image Sample
1.Visible Atmospheric Resistance Index VARI G r e e n R e d G r e e n + R e d B l u e [41]Forests 16 00966 i009
2.Normalized Green Red Difference Index NGRDI G r e e n R e d G r e e n + R e d [42]Forests 16 00966 i010
3.Green Leaf Index GLI 2 G r e e n R e d B l u e 2 G r e e n + R e d + B l u e [41]Forests 16 00966 i011
4.Soil Colour IndexSCI(R − G)/(R + G)[43]Forests 16 00966 i012
Table 3. Confusion matrix demonstrating the results obtained from the co-occurrence texture parameters and the vegetation indices using the DL model.
High InfectionMed-High InfectionLow InfectionUser Accuracy
High infection10,60000100%
Med-high infection050000100%
Low infection0200280093.33%
Producer accuracy100%96.15%100%98.9%
Disclaimer/Publisher’s Note: The statements, opinions and data contained in all publications are solely those of the individual author(s) and contributor(s) and not of MDPI and/or the editor(s). MDPI and/or the editor(s) disclaim responsibility for any injury to people or property resulting from any ideas, methods, instructions or products referred to in the content.