Article

The Effects of Fungal Infection Combined with Insect Boring on the Induction of Agarwood Formation and Transcriptome Analysis of Aquilaria sinensis

1
Yunnan Academy of Forestry and Grassland, Kunming 650201, China
2
College of Forestry, Southwest Forestry University, Kunming 650224, China
*
Author to whom correspondence should be addressed.
Forests 2025, 16(6), 960; https://doi.org/10.3390/f16060960
Submission received: 31 March 2025 / Revised: 20 May 2025 / Accepted: 3 June 2025 / Published: 6 June 2025
(This article belongs to the Section Forest Health)

Abstract

:
This study investigates the main insects and endophytic fungi that promote the formation of agarwood in Aquilaria sinensis (Lour.) Spreng. and elucidates the effects and mechanisms of different ‘insect + fungus’ combinations on agarwood formation. The results showed that 16 strains of endophytic fungi were isolated from A. sinensis. Fusarium solani, Penicillium chrysogenum, Fusarium equiseti, and Phaeoacremonium alvesii were identified as dominant fungi promoting agarwood formation, while Nadezhdiella cantori was recognized as the dominant insect facilitating this process. The optimal ‘insect + fungus’ combination was Nadezhdiella cantori + Fusarium equiseti. The average agarotetrol contents were 0.046% and 0.054% in February and June, respectively, which were significantly higher than those in cold drilling, fungal-only, and insect-only treatments. RNA sequencing revealed 23,801 differentially expressed unigenes in cjYB1Z4 (optimal combination) versus control BMZ. Upregulated unigenes were enriched in isoflavone biosynthesis, flavonoid biosynthesis, and sesquiterpenoid and triterpene biosynthesis. Fifty sesquiterpene-related differential unigenes encoded seven key enzymes in the MVA pathway, seven key enzymes in the MEP pathway, and seven terpene synthases. Co-expression network analysis indicated that transcription factors (e.g., WRKY33, ABF, WRKY2) potentially regulate agarwood sesquiterpene formation. This work elucidates preliminary effects and molecular mechanisms of insect- and fungi-induced agarwood formation in A. sinensis, advancing agarwood induction technology.

1. Introduction

Aquilaria sinensis (Lour.) Spreng. belongs to Thymelaeaceae Aquilaria. It is a rare medicinal plant endemic to China [1], and it is mainly found in evergreen broad-leaved mixed forests in low-altitude mountains and hills, such as those in Guangdong, Hainan, Fujian, Yunnan, and Taiwan. Agarwood is often used in the production of drugs, as it has sedative, aphrodisiac, cardiotonic, antiemetic, anti-asthmatic, neuroregulatory, anti-inflammatory [2], antibacterial, antitumor [3], antidepressant [4], antioxidant [5], hypoglycemic, hypolipidemic, antipyretic, and analgesic effects, with additional therapeutic potential against diabetes [6,7] and Alzheimer’s disease. It is considered by the Pharmacopoeia of the People’s Republic of China (2020 Edition) to be the only plant source of Chinese agarwood. Agarwood formation in A. sinensis is a result of the host’s defensive response to mechanical damage, insect attack, or microbial invasion [8,9], and a healthy plant will not produce this product without such external damage or stimulation. Despite research having been carried out over the past 100 years, agarwood formation mechanisms are still controversial and have not yet been clarified. There are five main hypotheses: the pathological hypothesis [10], the non-pathological hypothesis (physical and chemical injury induction hypothesis) [11], the traumatic pathology hypothesis, the defense response induction hypothesis, and the elicitor induction hypothesis. These hypotheses represent the foundation for the study of the formation mechanisms of agarwood. However, these existing hypotheses have limitations. One limitation is that each hypothesis attempts to explain complex phenomena with a single dominant factor (e.g., fungi, oxidation, genes), but agarwood formation is fundamentally a result of synergistic interactions among multiple factors, including biological (fungi, insects), chemical (oxidation, enzyme catalysis), physical (damage, environmental stress), and genetic (gene expression) factors. Second, these studies overlook the temporal dynamics. Natural agarwood formation takes decades, but most existing research is based on short-term experiments (months to years), which fails to capture long-term processes, such as resin synthesis, oxidative polymerization, and microbial community succession. Third, there is a lack of strong interdisciplinary integration. Chemical analyses are often conducted in isolation from the ecological context (e.g., overlooking the role of symbiotic microorganisms), and biological research is insufficiently linked to the functions of specific compounds, resulting in a fragmented understanding of agarwood formation mechanisms. These problems deserve our further attention.
Many agarwood induction techniques have been widely examined. At present, methods for creating agarwood are divided into three categories. One is the physical trauma method [12,13], including the chiseling method, the chopping method, the fire stud method, the trunk burning method, the semi-trunk breaking method, full-trunk breaking method, or the branch breaking method; the second is the artificial inoculation induction method [14,15]; and the third is the chemical induction method. These induction methods greatly promote the efficiency of agarwood output. Of course, artificial induction technology for agarwood is still developing. Although the formation time of agarwood has been shortened to a certain extent and output efficiency has improved, the quality of the agarwood produced has not yet reached that of wild agarwood, and the induction technology needs to be improved further.
The authenticity of agarwood on the market is difficult to determine, and the quality is varied. Authentic agarwood has a special aroma and bitterness, the surface is uneven, and it contains more oily substances than its artificially induced counterpart [16]. Counterfeit agarwood is mainly derived from heartwood, such as Caesalpinia sappan, Pinus massoniana, and Dalbergia. Its surface color is different, and its texture is hard and heavy. Authentic agarwood has a strong, lasting aroma during combustion and leaves no black carbon residue afterwards [17]. However, counterfeit agarwood produces an unpleasant odor during burning, and the burning ash leaves a black carbon residue [18]. At present, the quality of agarwood is mainly determined using high-performance liquid chromatography (HPLC) by identifying the contents of the main indicator compounds of agarwood. For instance, agarotetrol is the main active ingredient of agarwood and can be used as a potential quality marker [19]. In addition, agarwood contains more than 300 compounds. These include flavonoids, sesquiterpenes, and 2-(2-phenylethyl) chromones [20], with the latter two displaying the widest range of pharmacological activities, and their contents and concentrations are often used as criteria for evaluating the quality of agarwood [20,21]. That being said, there are a variety of aromatic compounds and pharmacologically active ingredients in agarwood that are important factors for determining its quality [22,23].
Sesquiterpenes are important compounds in agarwood and have been widely studied. Sesquiterpene biosynthesis in agarwood involves two pathways—one is the MVA pathway that starts in the cytoplasm and the other is the MEP pathway that starts in the plastid [24,25]. In the MVA pathway, AACT is the primary enzyme acting in the initial stage. HMGS and HMGR are the key enzymes responsible for the conversion of acetyl-CoA to mevalonate in the second and third stages. MVK and PMK cause phosphorylation. In the final stage, MVD acts as the rate-limiting enzyme during the synthesis of the terpenoid precursor IPP in the MVA synthesis pathway. These enzymes have been identified as homologous genes [26]. In the MEP pathway, DXS is the primary rate-limiting enzyme in terpenoid biosynthesis, and DXR, MCT, CMK, MDS, and HDR also play important regulatory roles. The general precursor of terpenoid synthesis is formed via these two pathways, and then the monoterpene precursor, GPP, the sesquiterpene precursor, FPP, and the diterpene and tetraterpene terpenoid precursor, GGPP [27], are synthesized by GPPS [28], FPS, GGPPS, and other enzymes. Finally, the terpenoid synthase TPS reacts with these terpenoid precursors through a series of modification reactions to further generate terpenols, aldehydes, acids, esters, and other derivatives [29,30].
The purpose of this study is to explore the dominant strains and wood-eating insects that promote the formation of agarwood in A. sinensis and to examine its induction through physical damage, fungi, wood-eating insects, and fungal infections combined with insect damage. The content of agarotetrol in the samples under different treatments was used to identify the best way to promote and improve the efficiency and quality of agarwood formation in A. sinensis using the ‘insect + fungus’ method. At the same time, a transcriptome analysis of agarwood samples under different treatments was carried out in order to explore the mechanisms of agarwood induction by insects combined with fungi, to find the key genes and transcriptional regulators of the sesquiterpene synthesis pathway of agarwood, to provide experience and reference for the future development and promotion of stable, efficient, environmentally friendly, and sustainable artificial induction methods of agarwood in A. sinensis, and to offer a theoretical basis for exploring the formation mechanism of agarwood.

2. Materials and Methods

2.1. Experimental Material

The A. sinensis plants used in this study were located in Naban River Nature Reserve, Xishuangbanna Dai Autonomous Prefecture, Yunnan Province. The trees were in good condition. The fungi used were all from the laboratory of fungal preservation of the Institute of Forest Protection, Yunnan Academy of Forestry and Grassland Sciences. Odontotermes formosanus was collected from the base of A. sinensis; Tomicus yunnanensis and Cerambycidae sp. were collected from Huanglishan, Chengjiang City, Yuxi City; and Scleroderma guani Xiao et Wu was purchased from the Beijing Glinghong Biological Science and Technology Development Center.

2.2. Screening of Fungi and Insects

We collected agarwood tissue from the base of the Aquilaria tree and removed surface soil and debris using a soft brush. We then disinfected the samples with 75% alcohol for 2 min and transferred them into a 10%–20% sodium hypochlorite solution for 10–20 min under gentle shaking. The samples were rinsed 3–5 times with sterile distilled water for 1–2 min each and cut into small wood chips (5 mm in length and 1 mm in width) and then rinsed 2–3 times with sterile water. The sterilized samples were placed on potato dextrose agar (PDA) medium and incubated at 25 °C in the dark. Colony isolation was performed until pure fungal strains were obtained. The core workflow for fungal sequencing identification involves the following steps. Fungal DNA was extracted using a QIAGEN DNeasy Plant Mini Kit (Wuhan Sevier Biotechnology Co., Ltd., Wuhan, China) and assessed for purity and integrity through agarose gel electrophoresis. A PCR protocol targeting the ITS regions was performed with specific primers (ITS1/ITS4) (Supplementary Materials, Table S1) under an annealing temperature of 50–60 °C, followed by electrophoretic verification of amplified products. Purified PCR amplicons were sequenced using Sanger sequencing. Downstream analysis included BLAST alignment against the NCBI database, with taxonomic classification determined based on sequence similarity thresholds (≥98% for species-level, ≥95% for genus-level). For ambiguous species, multi-locus phylogenetic analysis supplemented by morphological characterization was employed to ensure reliable identification. By consulting the literature, we identified fungi reported to induce agarwood formation in A. sinensis. The obtained fungi were analyzed, and then the agarwood test was carried out using the fungal treatment induction method, as shown in Section 2.3. The induced agarwood samples were analyzed using GC-MS to detect whether they contained chemical components similar to the main components of agarwood, and strains with the ability to induce agarwood formation in A. sinensis were determined.
We disinfected the insects by immersing them in 3% hydrogen peroxide for 1–2 min. Then, we immediately rinsed them 3–5 times with sterile distilled water to thoroughly remove any residual disinfectant. The insects were transferred to a Petri dish for observation of their survival condition. Based on literature findings, the most appropriate insects for inducing agarwood in A. sinensis were selected. Subsequently, insect analysis was carried out using the insect boring treatment, as described in Section 2.3. After 7~15 days, the survival and feeding activity of the insects in the tree were observed to assess their potential to promote agarwood formation.

2.3. Processing and Sampling of A. sinensis

The experiment employed a randomized complete block design with six treatments and three temporal replicates. Thirty-six healthy 8-year-old A. sinensis trees with comparable growth status (DBH 15 ± 2 cm, height 4 ± 0.5 m) were randomly assigned to six treatment groups (n = 6 trees per group): cold drilling treatment, fungal induction treatment, PDA treatment, insect boring treatment, insects combined with fungi treatment, and untreated control. All mechanical interventions were performed by trained technicians using sterilized tools. Between-tree contamination was prevented using disposable gloves and surface-disinfected equipment (75% ethanol). Treatments were applied during morning hours (08:00–10:00) to minimize circadian rhythm effects. The cold drilling treatment used a puncher positioned 50 cm from the ground at an inclination angle of 45°. From the base to the apex of the trees, each trunk was drilled in four directions—east, south, west, and north—with an average of 4 holes, a pore size of 1 cm, hole spacing of 7 cm, a depth of 3–4 cm, and row spacing of 15 cm, with a total of 9 rows. The fungal induction treatment was based on the cold drilling treatment. A 5 mm sterilized puncher was used to punch holes in the activated fungal PDA plate; a fungal block was placed in the pre-made hole using a sterile bamboo stick, and then the holes were sealed from first to last using parafilm. The PDA treatment involved inserting sterile PDA blocks into the hole using the same process as in the fungal induction method, which was based on the cold drilling treatment. For the insect boring treatment, based on the cold drilling treatment, sterile tweezers were used to insert the insect into the hole, and then the hole was covered with parafilm from the base to the apex of the trees and pricked with a needle to allow for gas flow. For the treatment involving insects combined with fungi, based on the cold drilling treatment, insects were held with tweezers, dipped into a beaker containing fungal suspension for 5~10 s, and quickly placed in the hole, which was then sealed. For the blank treatment, the above induction techniques were not required, and the trees were left to grow naturally. Systematic destructive sampling was conducted at 2, 4, and 6 months post-induction, with 2 trees per treatment group sampled at each time point. Using an autoclaved coring tool (150 mm diameter, 200 mm maximum depth), three vertical sampling zones were established along the trunk: lower (0–50 cm above ground), middle (50–100 cm), and upper (100–150 cm). Within each vertical zone, three equidistant horizontal quadrants (120° apart, aligned with the original treatment orientations of east, south, west, and north) were sampled, maintaining a 2 cm buffer from treatment hole edges to avoid boundary effects. Each tree yielded 9 standardized core samples (3 vertical zones × 3 horizontal quadrants) with ≥15 cm spacing between adjacent sampling points. For artificially treated groups, samples were specifically collected from the reactive interface between induced resinous tissue and healthy xylem, identified by in situ dark pigmentation. Untreated controls were equivalently sampled from healthy xylem in non-manipulated trunk regions. Samples were immediately flash-frozen in liquid nitrogen and stored at −80 °C.

2.4. Volatile Detection

The samples treated with fungi in February, April, and June were selected. Grinding was performed using a grinder, and 5 g of samples was accurately weighed for each treatment and sent to Yunnan Tongchuang Detection Technology Co., Ltd. (Kunming, China) for GC-MS detection. Splitless injection was used, and the solvent delay time was 4.0 min. The mass spectrometry conditions were as follows: electron bombardment (EI) ion source; the electron energy was 70 eV; the interface temperature was 280 °C; the ion source temperature was 230 °C; the quadrupole temperature was 150 °C; standard tuning mode was used; the electron multiplication voltage was 1718 V; and the mass scanning range was 40–800 m/z. Using a data analysis workstation, combined with the NIST 20 version mass spectrometry database and the related literature, the chromatographic peaks of the sample were analyzed [31,32], and the total ion flow diagram was obtained. The relative content of the chemical composition of the sample was determined using the peak area normalization method.

2.5. Determination of Agarotetrol Content

In accordance with the method [33] of Li et al., the content of agarotetrol in the sample was determined. The reference solution was prepared as follows: a total of 2 mg of the agarotetrol reference standard was weighed and placed in a 100 mL volumetric flask, and an appropriate amount of HPLC-grade anhydrous ethanol was added for dissolution. The mixture was then shaken to obtain the 20 μg/mL agarotetrol reference solution. The preparation of sample solution was as follows: 0.10 g of agarwood sample was placed in a 25 mL conical flask, 10 mL of methanol was added, and the total mass was weighed and shaken well. Ultrasonic extraction (power 250 W; frequency 35 kHz) was performed for 60 min; then, the flask was cooled, replenished to initial mass with methanol, and filtered. The filtrate was collected, and 2.5 mL of the filtrate was withdrawn with a sterile syringe (Yunnan Sanxin Medtec Co., Ltd., Kunming, China) and passed through a 0.45 μm membrane filter into the HPLC vial. For the negative control solution (‘Chinese medicinal agarwood control’), the method was the same as that used for the sample solution’s preparation. The chromatographic conditions were as follows. For high-performance liquid chromatography (Thermo UltiMate 3000, Thermo Fisher Scientific, Waltham, MA, USA), a liquid chromatography column (Thermo Fisher Scientific, Waltham, MA, USA) was used, where the column length was 250 mm, the inner diameter was 4.6 mm, and the particle size was 5 μm. Acetonitrile (FISHER) was used as mobile phase A, 0.1% formic acid aqueous solution (Ron Reagent Company, Shanghai, China) was used as mobile phase B, and gradient elution was performed according to the specified time (Table 1), where the flow rate was 0.7 mL per minute and the column temperature was 30 °C. The detection wavelength was 252 nm. The control solution, sample solution, and the reference solution were placed on the injection plate according to the number, and 10 μL of each solution was injected according to the procedure. The content was then quantified, and the chromatogram was obtained.

2.6. Transcriptome Sequencing

According to the analysis of the chemical composition of agarwood samples and the content of agarotetrol, samples with better induction effects and blank treatments were selected for sequencing. Sequencing was repeated three times on each sample. The samples were numbered (Supplementary Materials, Table S2) and sent to Wuhan Bena Technology Co., Ltd. (Wuhan, China) for transcriptome sequencing, including RNA extraction, quality control, and library construction. Raw sequencing data were processed by removing reads with >5% ambiguous bases (N), reads where >50% of bases had Phred quality scores ≤ 5, adapter-contaminated reads, and PCR duplicates. The transcriptome sequencing data were deposited in the NCBI Sequence Read Archive (SRA) under BioProject accession number PRJNA1232343, with release scheduled for 1 March 2026.

2.7. Transcript Assembly and Annotation

Clean reads were assembled using Trinity v2.11.0 [34]. Subsequently, CD-HIT v4.8.1 [35] was used for clustering (95% similarity threshold) to remove redundant transcripts and obtain unigenes. Functional annotation of unigenes was then performed against the Nr, Pfam, Uniprot, KEGG, GO, and KOG/COG databases.

2.8. Differential Expression Analysis and Functional Enrichment

RSEM was used to quantify unigene expression levels and generate read counts for each sample. Differential expression analysis was performed using DESeq2 (v1.26.0) [36], with a significance threshold of padj < 0.01. When fewer than 10 differentially expressed unigenes (DEGs) were identified, the threshold was relaxed to an unadjusted p-value < 0.05. Functional enrichment analysis of GO terms and KEGG pathways was then conducted using the R (v4.1.2) package clusterProfiler. Significant enrichments were determined by comparing DEGs against the whole transcriptome background, with parameters set as pAdjustMethod = ‘BH’ (Benjamini–Hochberg) and pvalueCutoff = 0.05.

2.9. Construction of a Co-Expression Network

Based on the FPKM values of differentially expressed genes (DEGs) and transcription factor (TF) genes involved in sesquiterpene biosynthesis, Pearson correlation coefficients were calculated using R. Significant co-expression pairs were defined as those with an absolute correlation ≥ 0.9 and a permutation test p-value < 0.05 (10,000 iterations) [37]. The co-expression network was visualized using Cytoscape (v3.10.3) [38]. Betweenness centrality (BC) values of genes were computed with the CytoNCA plugin to identify hub genes.

3. Results

3.1. Screening Results of Fungi and Insects Inducing Agarwood Formation in A. sinensis

Through the separation and purification of fungi from agarwood blocks, 16 fungal species were isolated (Figure 1). Morphological and ITS sequence analyses confirmed species-level diversity (Table 2). The isolates comprised seven Fusarium species, three Penicillium species, one Trichoderma species, one Neodeightonia species, one Leptographium species, one Pestalotiopsis kenyana, one Acrodontium species, and one Phaeoacremonium species (Table 3). Literature analysis (Supplementary Materials, Table S3) showed that as of December 2023, 339 articles focused on agarwood research, with 348 publications included in the analysis. Recent research surged after 2015, peaking from 2020 onwards. Teams led by Wei Jianhe, Liu Yangyang, Yang Yun, Mei Wenli, and Dai Haofu formed the core research groups; notably, the team led by Wei Jianhe published predominantly during 2020–2023, while the team led by Mei Wenli and Dai Haofu published primarily during 2018–2020. This concentration of research activity indicates a maturing field in agarwood biotechnology. The analysis identified 50 fungal genera harboring species with potential induction effects, among which 23 species exhibited confirmed activity. Fusarium spp. (representing 10% of the confirmed active species) and Trichoderma spp. (7%) were the predominant genera, suggesting their key role in agarwood induction. Consequently, strains from these genera were prioritized for subsequent experiments.
Research on insect-induced agarwood formation remains limited, with only 14 studies retrieved (primarily from Wei Jianhe and Mei Wenli). Based on a literature analysis of insect-mediated mechanisms, candidate species from Cerambycidae, Formicidae, Cossidae, Bethylidae, and Scolytidae were evaluated. Survival assays in trunk microhabitats (Table 4) revealed significant interspecific differences; Odontotermes formosanus exhibited obligate social dependence with rapid mortality (<24 h) upon isolation; Scleroderma guani survived up to 48 h without gallery formation; Tomicus yunnanensis maintained viability for 96 h in gallery-free conditions; and Nadezhdiella cantori demonstrated exceptional xylem colonization capacity, sustaining 14-day survival while constructing continuous larval galleries. These results establish N. cantori as the sole species capable of autonomous A. sinensis infestation under experimental conditions, leading to its prioritization for fungal–insect co-induction trials.

3.2. Analysis of Volatile Chemical Components

The essential oil of agarwood mainly includes aromatic compounds (benzylacetone, methoxyphenylacetone, benzylideneacetone, benzaldehyde, furfural, etc.), sesquiterpene compounds (agarwood furans, 1,8-cineole, irimophilanes, agarwood spiranes, guaiacols, etc.), some volatile chromones (5,6,7,8-tetrahydro-2-(2-phenylethyl) chromones; 5,6-epoxy-2-(2-phenylethyl) chromones; 5,6,7,8-diepoxy-2-(2-phenylethyl) chromones; Flidersia type 2-(2-phenylethyl) chromones, etc.), and a small number of fatty acid compounds [20,39]. After analyzing the total ion chromatograms (TIC, Figure 2) of all test samples, the results showed that under the treatments of YB-1, YB3-1, HLH, and YML, the samples contained (-)-β-elemene, β-eudesmol, and alloaromadendrene. In addition to these compounds, the samples obtained in April also contained camphor, humulene, naphthalene, and 1-tetradecene, which overlap with characteristic agarwood components (Table 5). Given this chemical similarity, these four fungi may be potential dominant strains for inducing agarwood formation in A. sinensis, and they were selected for fungal–insect co-induction trials.

3.3. Analysis of Agarotetrol Content

A total of 72 samples were obtained via continuous sampling of three batches of agarwood at 2-month intervals. The chromatogram of agarotetrol was measured using HPLC (Figure 3), and its content was calculated via the chromatograph’s integrated data tool (Table 6). The results showed that after 2 months of induction, agarotetrol content in all experimental groups exceeded that in cold-drilled controls. CJYB-1 (fungal–insect co-induction) yielded the highest content (0.046%), significantly differing from other groups (p < 0.05). At 4 months, agarotetrol decreased markedly in most groups, with only seven samples surpassing controls. ZCX-5 (fungal treatment) showed peak content (0.274%), which was significantly higher than others (p < 0.05). By 6 months, eight samples exceeded control levels, among which CJYB-1 (co-induction) again showed maximal content (0.054%, p < 0.05). These results indicate that co-induction treatments consistently outperformed fungal-only or insect-only methods in enhancing agarotetrol accumulation, accelerating agarwood formation in A. sinensis. We propose that the ‘high (February) → low (April) → high (June)’ fluctuation pattern reflects three alternating physiological phases, short-term defense (stress response), medium-term repair (tissue adjustment), and long-term homeostasis (metabolite accumulation), rather than linear accumulation. This suggests that co-induction rapidly stresses A. sinensis, potentiating secondary metabolism and enhancing agarwood production. Furthermore, ZCX-5, CX-3, YB-1, and ZCX-1 maintained relatively high agarotetrol across multiple timepoints, identifying them as potential dominant induction strains, although fungal viability and infectivity declined over time.

3.4. Sequencing Data and Quality Control

Quality control of sequencing raw data showed effective reads of 41,651,524–43,366,270 across all samples (Supplementary Materials, Table S4). Q20 and Q30 base percentages were 97%–98% and 94%–98% respectively, with GC content at 46%–56%. These high-quality data were suitable for subsequent bioinformatic processing and analysis.

3.5. Analysis and Evaluation of Assembled Transcripts

Clean reads were de novo assembled using Trinity, yielding contigs with an average length of 645 bp and N50 of 1088 bp. After clustering, 852,360 unigenes were obtained, with transcript averages of 285 bp (N50 = 583 bp; Supplementary Materials, Figure S1). Unigene sequences underwent BUSCO evaluation [40], assessing completeness via conserved single-copy orthologs (Supplementary Materials, Figure S2). Results indicated that 92.3% complete BUSCOs were detected, comprising 85.9% single-copy and 6.4% duplicated genes, confirming high assembly completeness.

3.6. Functional Annotation, Classification, and Metabolic Pathway Analysis of Assembled Transcripts

To comprehensively characterize unigene functions, functional annotations were performed using seven databases: Nr, Pfam, UniProt, KEGG, GO, KOG/COG, and PATHWAY. Results (Table 7) showed that 386,360 unigenes (45.33% of total) had ≥1 annotation. KEGG yielded the highest coverage (319,215 unigenes, 37.45%), followed by Nr (306,813, 36.00%), indicating varying homology levels with known proteins, UniProt (292,397, 34.30%), GO (233,210, 27.36%), Pfam (180,758, 21.21%), PATHWAY (155,112, 18.20%), and KOG (18,582, 2.18%). This >45% annotation rate confirms high sequencing and assembly quality. Nr-annotated sequences (306,813) showed the highest homology to Quercus suber (111,523 genes, 56.72%) and Carpinus fangiana (44,844, 22.81%), reflecting limited genomic resources for A. sinensis (Figure 4). KEGG-annotated unigenes (319,215, 37.45%) were classified into metabolic pathways (Figure 5), revealing ‘Global metabolism overview’ as dominant (76,042 genes) among 22 pathways, with high representation in carbohydrate metabolism, translation, signal transduction, and secondary metabolite biosynthesis. GO annotation (233,210 unigenes, 27.36%) simplified via GO Slim showed (Figure 6) biological processes dominated by translation (GO:0006412, 10,156 genes) and carbohydrate metabolism (GO:0046872, 5427); cellular components led by the membrane (GO:0016021, 44,952), nucleus (GO:0005634, 13,591), and cytoplasm (GO:0005737, 15,177); molecular functions dominated by ATP binding (GO:0005524, 33,584); and metal ion binding (GO:0046872, 15,680).

3.7. Differentially Expressed Unigene Analysis

Differential expression analysis (Figure 7) used untreated A. sinensis (BMZ) as the reference. Compared to BMZ controls, April-collected cold-drilled samples (LZZ4) contained 18,277 DEGs (12,889 upregulated, 5388 downregulated); fungal induction samples (jYB1Z4) showed 15,620 DEGs (10,532 upregulated, 5088 downregulated); insect infestation samples (CZ4) exhibited 28,992 DEGs (23,772 upregulated, 5220 downregulated); and fungal–insect co-induction samples (cjYB1Z4) displayed 23,801 DEGs (19,758 upregulated, 4043 downregulated). All treatments induced significant transcriptional reprogramming with 77.5% upregulated genes.

3.8. Functional Enrichment Analysis of Differential Unigenes

GO enrichment analysis (Figure 8) revealed 143 significantly enriched GO terms across treatments. In biological processes, defense response (GO:0006952), cell wall organization (GO:0071555), and cell wall biogenesis (GO:0042546) contained the most DEGs. For cellular components, cytoplasm (GO:0005737) and chloroplast thylakoid membrane (GO:0009535) showed the highest DEG frequency; among molecular functions, ADP binding (GO:0043531) was predominant. KEGG enrichment (Figure 9 and Figure 10) indicated consistent metabolic pathways across treatments: upregulated DEGs primarily enriched in isoflavonoid biosynthesis, flavonoid biosynthesis, and sesquiterpenoid/triterpenoid biosynthesis (Figure 9). Downregulated DEGs were concentrated in circadian rhythm, photosynthesis, and gibberellin biosynthesis (Figure 10). These results suggest that the treatments likely triggered defense responses in A. sinensis and potentially stimulated the biosynthesis of diverse secondary metabolites, whose synthesis may contribute to agarwood formation.

3.9. Differential Unigenes Related to Sesquiterpene Synthesis

Sesquiterpenes are characteristic components of agarwood. Differentially expressed unigenes were annotated to sesquiterpenoid/triterpenoid biosynthesis [ko00909] and terpenoid backbone biosynthesis [ko00900] pathways. Key terpenoid biosynthetic enzymes showed significant expression changes. Based on RPKM values, we predicted expression levels of MVA and MEP pathway enzymes in sesquiterpene biosynthesis. Terpenoid backbone pathway DEGs were predominantly upregulated versus BMZ controls, encoding 14 key enzymes—ACAT, HMGCS, HMGCR, MVK, PMVK, MVD, FDPS, DXS, DXR, MCT, MDS, HDS, HDR, and IDI (Figure 11)—critical for IPP precursor formation. Sesquiterpene/triterpenoid pathway DEGs were also mainly upregulated, encoding seven terpene synthases: germacrene D synthase, germanicol synthase, squalene monooxygenase, farnesyl-diphosphate farnesyltransferase, premnaspirodiene oxygenase, costunolide synthase, and lupeol synthase (Figure 12). Heatmaps revealed treatment-specific expression patterns for enzymes in the MVA pathway (Figure 13), with cjYB1Z4 showing the highest expression for ACAT, HMGCS, and HMGCR. In the MEP pathway (Figure 14), expression variation was insignificant versus controls. This suggests coordinated enzymatic regulation and MVA pathway dominance in A. sinensis induction. Sesquiterpenes are primarily synthesized via the cytoplasmic MVA pathway, whereas the MEP pathway operates in plastids, explaining MVA’s pivotal role in agarwood formation. SS (sesquiterpene synthase) expression was lowest in BMZ but elevated in CZ4 and cjYB1Z4 (Figure 15), indicating that fungal–insect co-induction potentially enhances SS expression to accelerate agarwood formation.

3.10. Co-Expression Network of Transcription Factors and Sesquiterpene Biosynthetic Genes

Sesquiterpene biosynthetic gene expression was primarily regulated by WRKY, AP2/ERF, bZIP, and bHLH transcription factors (TFs). Heatmaps revealed significant upregulation of most TFs post-treatment (Figure 16). Co-expression networks constructed using Pearson correlation coefficients identified key regulators via betweenness centrality (BC). Ninety-two DEGs encoded WRKY/AP2/bHLH/bZIP TFs, while fifty DEGs encoded sesquiterpene biosynthetic enzymes (Figure 17). Except for MYC2 (Unigene1757, bHLH) showing negative correlation with HMGCS/HMGCR, all other genes exhibited positive co-expression. BC analysis pinpointed twenty hub unigenes (inner circle) encoding nine TFs and six sesquiterpene synthases. WRKY33, ABF, and WRKY2 displayed the highest BC values and strong network connectivity, suggesting pivotal roles in agarwood formation. These findings indicate WRKY/AP2/bZIP/bHLH TFs likely mediate agarwood formation in response to mechanical damage, fungal induction, insect infestation, or combined stress.

4. Discussion

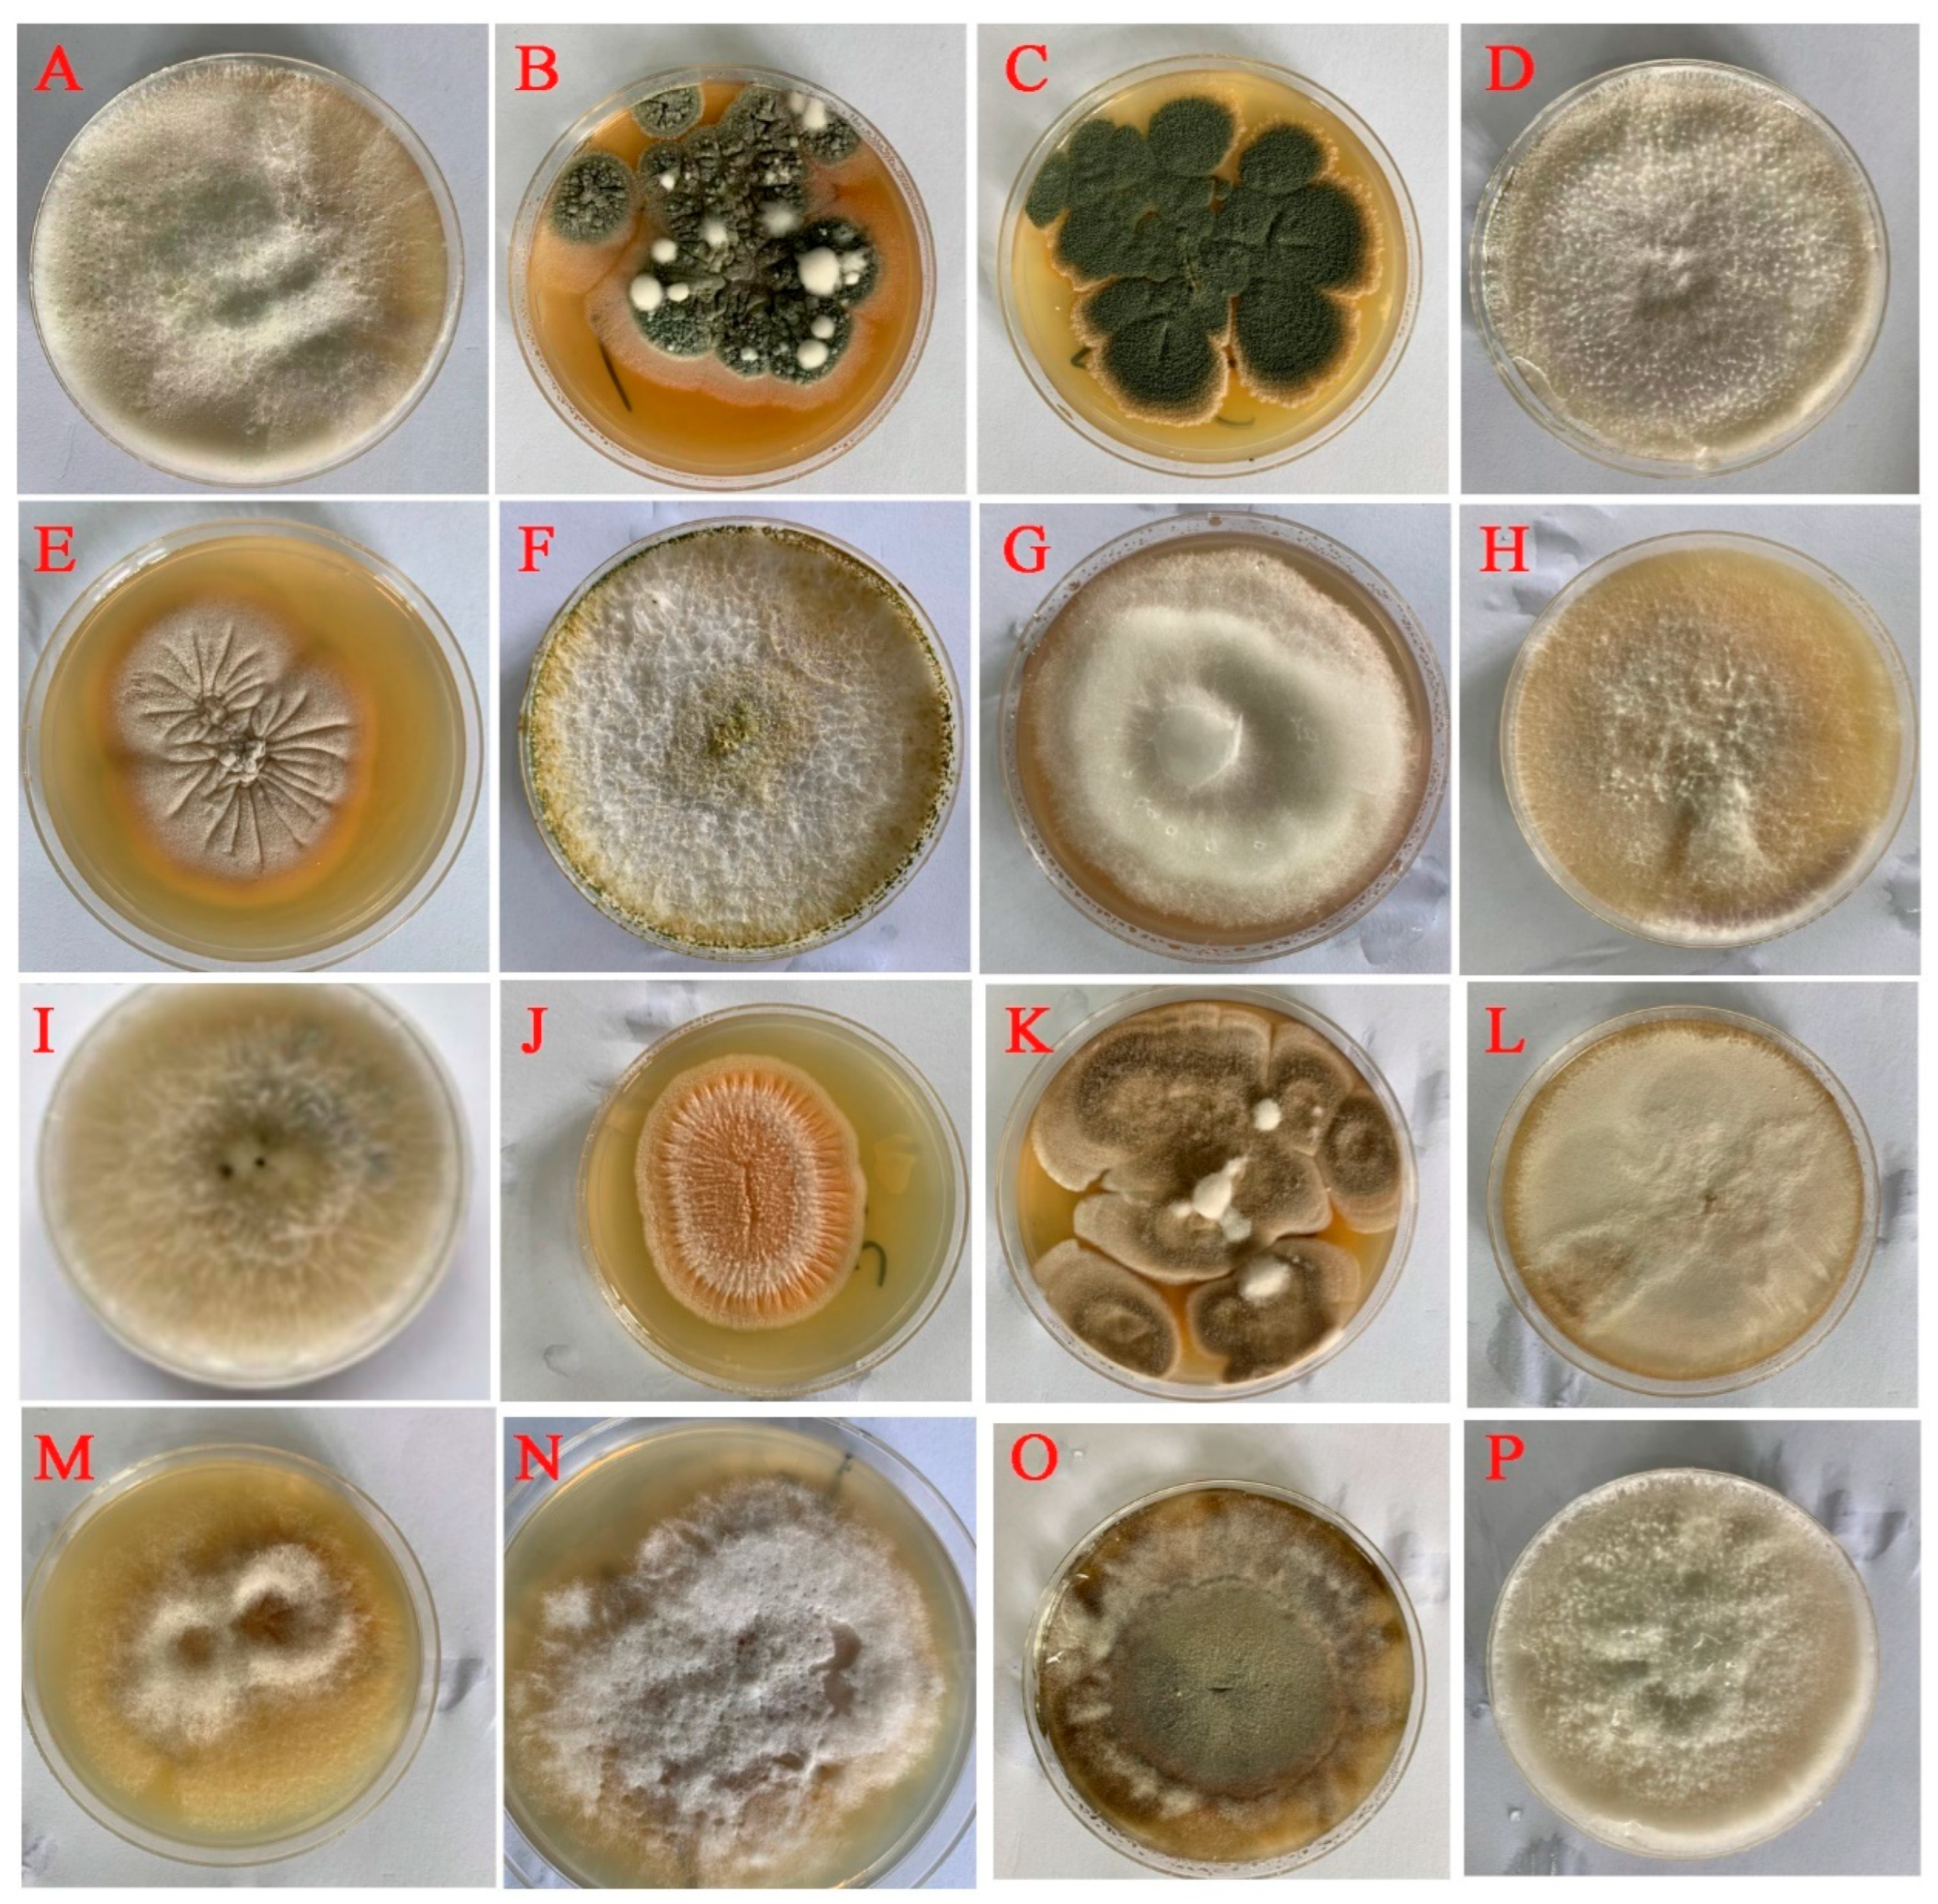
This study analyzed 16 potential agarwood-inducing fungal strains. Samples treated with these strains contained terpenoids resembling characteristic agarwood components: (-)-β-elemene, β-eudesmol, alloaromadendrene, camphor, humulene, naphthalene, and 1-tetradecene. Fusarium solani, Penicillium chrysogenum, Fusarium equiseti, and Phaeoacremonium alvesi exhibited elevated agarotetrol levels. Quantifying alcohol-soluble extracts, 2-(2-phenylethyl) chromones, and other biomarkers could validate their efficacy as dominant induction strains. Nadezhdiella cantori larvae demonstrated ideal biotic induction by forming feeding galleries within A. sinensis xylem. Although termites are documented consumers of A. sinensis, their exclusion was necessitated by obligate eusociality requiring intact colonies for survival, coupled with destructive feeding behavior that causes structural collapse when tree defenses are compromised.
When A. sinensis experiences physical/chemical/fungal stress, it activates defense responses producing antibacterial sesquiterpenes and chromones [41]. Prior transcriptomics identified 26 sesquiterpene biosynthetic genes in mechanically injured xylem [42]. Our study revealed that April treatments induced significant transcriptional reprogramming with consistent pathway enrichment versus BMZ controls; upregulated genes in isoflavonoid/flavonoid/sesquiterpenoid biosynthesis potentially drive sesquiterpene production, while downregulated photosynthesis/light-harvesting/circadian genes reflect adaptive stress responses [43,44]. This dynamic equilibrium enhances stress tolerance during agarwood formation [45,46,47,48]. Sesquiterpene biosynthesis correlated positively with MVA/MEP pathway enzymes and terpene synthases (TPS), particularly under fungal–insect co-induction (cjYB1Z4), suggesting enhanced sesquiterpenoid production and positioning this treatment as a key research model.
Transcriptional regulation [49] of sesquiterpenoid biosynthesis involves AP2/ERF, WRKY, bZIP, and bHLH families [50,51,52,53]. bHLH member MYC directly activates TPS promoters [54], consistent with our observed bHLH upregulation. AP2/ERF and bZIP regulate terpenoid genes across plants [55,56,57], exemplified by ORCA3-mediated DXS activation in Catharanthus roseus [57]. WRKY proteins modulate stress responses and sesquiterpenoid synthesis, as shown by GaWRKY1 activation and WRKY44 repression of TPS promoters [52]. Our co-expression network indicates WRKY/AP2/bHLH/bZIP families exert dual (positive/negative) regulation on sesquiterpenoid biosynthesis, with WRKY33, ABF, and WRKY2 showing high connectivity to synthase genes, suggesting pivotal regulatory roles requiring functional validation.
In conclusion, we propose that A. sinensis rapidly activates a protective mechanism upon injury by secreting resin containing compounds like sesquiterpenes and chromones. Under the dual ‘insect infestation + fungal invasion’ induction mode, genes associated with sesquiterpene and chromone biosynthesis exhibit significant upregulation, accelerating this process. Simultaneously, insect-bored tree tissues facilitate biochemical interactions between fungi and resin, triggering biochemical reactions that gradually transform resin into aromatic constituents (e.g., agarotetrol). This dual biological induction mechanism promotes agarwood formation and endows the product with distinctive aroma and medicinal properties. Our study addresses oversimplified induction methods by elucidating treatment-specific effects on agarwood formation. However, limitations exist, as molecular mechanisms require further characterization; although sesquiterpene/chromone biosynthesis genes showed significant upregulation, functional validation of key regulators (e.g., via gene knockout/overexpression) is needed to clarify precise roles. Additionally, environmental influences (temperature/humidity/light) were not quantified due to uncontrolled variables, and standardized production parameters await establishment. These unresolved issues warrant further investigation to advance fundamental understanding and practical applications.

5. Conclusions

In this study, fungal–insect co-induction significantly altered A. sinensis secondary metabolism, enhancing agarwood biosynthesis. Agarotetrol content in ‘insect + fungus’ samples surpassed other groups (e.g., 0.054% vs. control), demonstrating synergistic efficacy. This dual induction accelerates and prolongs agarwood formation, addressing fungal treatment limitations like activity loss and limited colonization periods. Transcriptomic analysis revealed differential unigenes characterizing agarwood formation across treatments (cold-drilling, fungal induction, insect infestation, co-induction). We propose that injury triggers resin secretion (sesquiterpenes/chromones) in A. sinensis, with co-induction upregulating related biosynthetic genes to accelerate resin production. Simultaneously, insect galleries promote biochemical interactions between fungi and resin, progressively transforming it into aromatic compounds (e.g., agarotetrol), thus enhancing agarwood quality with a distinctive aroma and medicinal properties. Thus, ‘insect + fungus’ may represent a promising method combining potentially higher efficiency and quality for artificial agarwood production.

Supplementary Materials

The following supporting information can be downloaded at https://www.mdpi.com/article/10.3390/f16060960/s1, Figure S1: [Unigene length distribution]; Figure S2: [Unigene BUSCO evaluation result diagram]; Table S1: [Primer information]; Table S2: [Sample number information]; Table S3: [Fungi causing agarwood formation of Aquilaria sinensis]; Table S4: [Sequencing data information statistics].

Author Contributions

Conceptualization, P.C., D.F. and R.Y.; methodology, L.Z.; software, L.Z.; validation, L.Z.; formal analysis, P.C., D.F. and R.Y.; investigation, L.Z., R.Y., D.F. and P.C.; resources, J.Y.; data Curation, J.Y.; writing—original draft preparation, J.Y.; writing—review and editing, J.X. and J.Y.; visualization, J.Y.; supervision, P.C., D.F., J.X. and R.Y.; project administration, P.C., D.F. and R.Y.; funding acquisition, P.C. All authors have read and agreed to the published version of the manuscript.

Funding

National Natural Science Foundation of China (32060357).

Data Availability Statement

The data presented in this study are available upon request from the corresponding author. The transcriptome sequencing data have been deposited in the NCBI Sequence Read Archive (SRA) under BioProject accession number PRJNA1232343. Fungal sequencing data are available in GenBank under accessions PV662761-PV662774. All data will be released on 1 March 2026.

Conflicts of Interest

The authors declare no conflicts of interest.

References

  1. Liu, J.; Xu, H. Research progress of domestic agarwood. Chin. Herb. Med. 2005, 28, 627–632. [Google Scholar] [CrossRef]
  2. Kumphune, S.; Prompunt, E.; Phaebuaw, K.; Sriudwong, P.; Pankla, R.; Thongyoo, P. Anti-inflammatory effects of the ethyl acetate extract of Aquilaria crassna inhibits LPS-induced tumour necrosis factor-alpha production by attenuating P38 MAPK activation. Int. J. Green Pharm. (IJGP) 2011, 5, 43. [Google Scholar] [CrossRef]
  3. Tabana, Y.M.; Al-Suede, F.S.R.; Ahamed, M.B.K.; Dahham, S.S.; Hassan, L.E.A.; Khalilpour, S.; Taleb-Agha, M.; Sandai, D.; Majid, A.S.A.; Majid, A.M.S.A. Cat’s whiskers (Orthosiphon stamineus) tea modulates arthritis pathogenesis via the angiogenesis and inflammatory cascade. BMC Complement. Altern. Med. 2016, 16, 480. [Google Scholar] [CrossRef]
  4. Takemoto, H.; Ito, M.; Shiraki, T.; Yagura, T.; Honda, G. Sedative effects of vapor inhalation of agarwood oil and spikenard extract and identification of their active components. J. Nat. Med. 2008, 62, 41–46. [Google Scholar] [CrossRef] [PubMed]
  5. Dahham, S.S.; Ahamed, M.B.K.; Saghir, S.M.; Alsuede, F.S.; Iqbal, M.A.; Majid, A.M.S.A. Bioactive essential oils from Aquilaria crassna for cancer prevention and treatment. Glob. J. Advences Appl. Sci. 2014, 4, 26–31. [Google Scholar] [CrossRef]
  6. Hishamuddin, M.S.; Lee, S.Y.; Syazwan, S.A.; Ramlee, S.I.; Lamasudin, D.U.; Mohamed, R. Highly divergent regions in the complete plastome sequences of Aquilaria are suitable for DNA barcoding applications including identifying species origin of agarwood products. 3 Biotech 2023, 13, 78. [Google Scholar] [CrossRef]
  7. Pranakhon, R.; Aromdee, C.; Pannangpetch, P. Effects of iriflophenone 3-C-β-glucoside on fasting blood glucose level and glucose uptake. Pharmacogn. Mag. 2015, 11, 82. [Google Scholar] [CrossRef]
  8. Nobuchi, T.; Siripatanadilok, S. Preliminary observation of Aquilaria crassna wood associated with the formation of aloeswood. Forest Res. 1991, 63, 226–235. [Google Scholar] [CrossRef]
  9. Pojanagaroon, S.; Kaewrak, C. Mechanical methods to stimulate aloes wood formation in Aquilaria crassna Pierre ex H. Lec.(Kritsana) trees. Acta Hortic. 2003, 676, 88–93. [Google Scholar] [CrossRef]
  10. Mohamed, R.; Jong, P.L.; Zali, M.S. Fungal diversity in wounded stems of Aquilaria malaccensis. Fungal Divers. 2010, 43, 67–74. [Google Scholar] [CrossRef]
  11. Tamuli, P.; Boruah, P.; Samanta, R. Biochemical changes in agarwood tree (Aquilaria malaccensis Lamk.) during pathogenesis. J. Spices Aromat. Crops 2004, 13, 87–91. [Google Scholar]
  12. Mei, W.; Zuo, W.; Yang, D.; Dong, W.; Dai, H. Advances in the Mechanism, Artificial Agarwood-induction Techniques and Chemical Constituents of Artificial Agarwood Production. Chin. J. Trop. Crops 2013, 34, 2513–2520. [Google Scholar]
  13. Wijitphan, P. Method to Stimulate Resin Formation by Wounding on the Aquilaria’s Trunk. US7485309B1, 3 February 2009. [Google Scholar]
  14. Bhore, S.; Preveena, J.; Kandasamy, K. Isolation and identification of bacterial endophytes from pharmaceutical agarwood-producing Aquilaria species. Pharmacogn. Res. 2013, 5, 134–137. [Google Scholar] [CrossRef]
  15. Huang, Y.; Kuang, Z.; Song, M.; Zhang, R. The community structure and changes of endophytic bacteria in agarwood formed and unformed Aquilaria sinensis. China J. Chin. Mater. Med. 2015, 40, 63–67. [Google Scholar]
  16. Huang, G.; Chen, Y.; Li, J.; Li, H. Identification of agarwood and its common counterfeits in circulation field. Pharm. Today 2019, 29, 769–772+776. [Google Scholar]
  17. Hou, S. Research progress on identification methods of agarwood and its counterfeits. Med. J. Chin. People’s Health 2019, 31, 4–6. [Google Scholar]
  18. Shang, L.; Chen, Y.; Yan, T.; Li, G. Research progress on chemical constituents and quality evaluation of agarwood. Drvna Ind. 2018, 32, 29–33. [Google Scholar] [CrossRef]
  19. Yang, H.; He, R.; Li, Y.; Ge, X. Prediction of quality markers of agarwood and verification of fingerprint analysis. Chin. J. Mod. Appl. Pharm. 2022, 39, 285–293. [Google Scholar] [CrossRef]
  20. Wang, S.; Yu, Z.; Wang, C.; Wu, C.; Guo, P.; Wei, J. Chemical Constituents and Pharmacological Activity of Agarwood and Aquilaria Plants. Molecules 2018, 23, 342. [Google Scholar] [CrossRef]
  21. Chen, H.Q.; Wei, J.H.; Yang, J.S.; Zhang, Z.; Yang, Y.; Gao, Z.H.; Sui, C.; Gong, B. Chemical Constituents of Agarwood Originating from the Endemic Genus Aquilaria Plants. Chem. Biodivers. 2012, 9, 236–250. [Google Scholar] [CrossRef]
  22. Hashim, Y.Z.H.Y.; Kerr, P.G.; Abbas, P.; Salleh, H.M. Aquilaria spp. (agarwood) as source of health beneficial compounds: A review of traditional use, phytochemistry and pharmacology. J. Ethnopharmacol. 2016, 189, 331–360. [Google Scholar] [CrossRef] [PubMed]
  23. Chen, D.; Bi, D.; Song, Y.-L.; Tu, P.-F. Flavanoids from the stems of Aquilaria sinensis. Chin. J. Nat. Med. 2012, 10, 287–291. [Google Scholar] [CrossRef]
  24. Dudareva, N.; Andersson, S.; Orlova, I.; Gatto, N.; Reichelt, M.; Rhodes, D.; Boland, W.; Gershenzon, J. The nonmevalonate pathway supports both monoterpene and sesquiterpene formation in snapdragon flowers. Proc. Natl. Acad. Sci. USA 2005, 102, 933–938. [Google Scholar] [CrossRef]
  25. Rohmer, M. The discovery of a mevalonate-independent pathway for isoprenoid biosynthesis in bacteria, algae and higher plants. Nat. Prod. Rep. 1999, 16, 565–574. [Google Scholar] [CrossRef] [PubMed]
  26. Hemmerlin, A.; Harwood, J.L.; Bach, T.J. A raison d’être for two distinct pathways in the early steps of plant isoprenoid biosynthesis? Prog. Lipid Res. 2012, 51, 95–148. [Google Scholar] [CrossRef]
  27. Degenhardt, J.; Köllner, T.G.; Gershenzon, J. Monoterpene and sesquiterpene synthases and the origin of terpene skeletal diversity in plants. Phytochemistry 2009, 70, 1621–1637. [Google Scholar] [CrossRef]
  28. Vranová, E.; Coman, D.; Gruissem, W. Structure and dynamics of the isoprenoid pathway network. Mol. Plant 2012, 5, 318–333. [Google Scholar] [CrossRef] [PubMed]
  29. Mcgarvey, D.J.; Croteau, R. Terpenoid metabolism. Plant Cell 1995, 7, 1015–1026. [Google Scholar] [CrossRef]
  30. Liang, P.H.; Ko, T.P.; Wang, A.H. Structure, mechanism and function of prenyltransferases. Eur. J. Biochem. 2002, 269, 3339–3354. [Google Scholar] [CrossRef]
  31. Liu, X.; Wang, Y.; Wang, H.; Wang, L.; Mei, W.; Dai, H.; Wang, J. GC-MS analysis of chemical constituents of volatile oil from leaves of 4 species of Aquilaria sinensis. Chin. J. Trop. Crops 2022, 43, 196–206. [Google Scholar] [CrossRef]
  32. Wang, M.-R.; Li, W.; Luo, S.; Zhao, X.; Ma, C.-H.; Liu, S.-X. GC-MS study of the chemical components of different Aquilaria sinensis (Lour.) gilgorgans and agarwood from different Asian countries. Molecules 2018, 23, 2168. [Google Scholar] [CrossRef]
  33. Li, Y.; Wang, L.; Deng, X.; Yang, L.; Chen, R.; Zeng, C.; Luo, S.; Chen, J.; Lai, X. Determination of alcohol extract and agarotetrol content and quality classification of agarwood. Chin. J. Exp. Tradit. Med. Formulae 2017, 23, 70–75. [Google Scholar] [CrossRef]
  34. Grabherr, M.G.; Haas, B.J.; Yassour, M.; Levin, J.Z.; Thompson, D.A.; Amit, I.; Adiconis, X.; Fan, L.; Raychowdhury, R.; Zeng, Q. Full-length transcriptome assembly from RNA-Seq data without a reference genome. Nat. Biotechnol. 2011, 29, 644–652. [Google Scholar] [CrossRef] [PubMed]
  35. Fu, L.; Niu, B.; Zhu, Z.; Wu, S.; Li, W. CD-HIT: Accelerated for clustering the next-generation sequencing data. Bioinformatics 2012, 28, 3150–3152. [Google Scholar] [CrossRef] [PubMed]
  36. Love, M.I.; Huber, W.; Anders, S. Moderated estimation of fold change and dispersion for RNA-seq data with DESeq2. Genome Biol. 2014, 15, 550. [Google Scholar] [CrossRef] [PubMed]
  37. Ma, C.; Wang, X. Application of the Gini Correlation Coefficient to Infer Regulatory Relationships in Transcriptome Analysis. Plant Physiol. 2012, 160, 192–203. [Google Scholar] [CrossRef]
  38. Shannon, P.; Markiel, A.; Ozier, O.; Baliga, N.S.; Wang, J.T.; Ramage, D.; Amin, N.; Schwikowski, B.; Ideker, T. Cytoscape: A software environment for integrated models of biomolecular interaction networks. Genome Res. 2003, 13, 2498–2504. [Google Scholar] [CrossRef]
  39. Yan, T.; Yang, S.; Chen, Y.; Wang, Q.; Li, G. Chemical profiles of cultivated agarwood induced by different techniques. Molecules 2019, 24, 1990. [Google Scholar] [CrossRef]
  40. Manni, M.; Berkeley, M.R.; Seppey, M.; Simão, F.A.; Zdobnov, E.M. BUSCO update: Novel and streamlined workflows along with broader and deeper phylogenetic coverage for scoring of eukaryotic, prokaryotic, and viral genomes. Mol. Biol. Evol. 2021, 38, 4647–4654. [Google Scholar] [CrossRef]
  41. Hou, M.; Qi, S.; Hu, L. Induced formation of chromone compounds in isolated lateral roots of Aquilaria sinensis. Chin. Herb. Med. 2010, 41, 281–284. [Google Scholar]
  42. Zhang, Z.; Gao, Z.-H.; Wei, J.-H.; Xu, Y.-H.; Li, Y.; Yang, Y.; Meng, H.; Sui, C.; Wang, M.-X. The mechanical wound transcriptome of three-year-old Aquilaria sinensis. Yao Xue Xue Bao 2012, 47, 1106–1110. [Google Scholar] [PubMed]
  43. Zhang, J.M.; Huang, G.Q.; Li, Y.; Zheng, Y.; Li, X.B. Cotton photosynthesis-related PSAK1 protein is involved in plant response to aphid attack. Mol. Biol. Rep. 2014, 41, 3191–3200. [Google Scholar] [CrossRef] [PubMed]
  44. Bilgin, D.D.; Zavala, J.A.; Zhu, J.; Clough, S.J.; Ort, D.R.; Delucia, E.H. Biotic stress globally downregulates photosynthesis genes. Plant Cell Environ. 2010, 33, 1597–1613. [Google Scholar] [CrossRef] [PubMed]
  45. Zhan, X.; Chen, Z.; Chen, R.; Shen, C. Environmental and Genetic Factors Involved in Plant Protection-Associated Secondary Metabolite Biosynthesis Pathways. Front. Plant Sci. 2022, 13, 877304. [Google Scholar] [CrossRef]
  46. Isah, T. Stress and defense responses in plant secondary metabolites production. Biol. Res. 2019, 52, 39. [Google Scholar] [CrossRef]
  47. Chapman, J.M.; Muhlemann, J.K.; Gayomba, S.R.; Muday, G.K. RBOH-Dependent ROS Synthesis and ROS Scavenging by Plant Specialized Metabolites To Modulate Plant Development and Stress Responses. Chem. Res. Toxicol. 2019, 32, 370–396. [Google Scholar] [CrossRef]
  48. Petrussa, E.; Braidot, E.; Zancani, M.; Peresson, C.; Bertolini, A.; Patui, S.; Vianello, A. Plant flavonoids--biosynthesis, transport and involvement in stress responses. Int. J. Mol. Sci. 2013, 14, 14950–14973. [Google Scholar] [CrossRef]
  49. Meraj, T.A.; Fu, J.; Raza, M.A.; Zhu, C.; Shen, Q.; Xu, D.; Wang, Q. Transcriptional Factors Regulate Plant Stress Responses Through Mediating Secondary Metabolism. Genes 2020, 11, 346. [Google Scholar] [CrossRef]
  50. Zhang, F.; Fu, X.; Lv, Z.; Lu, X.; Shen, Q.; Zhang, L.; Zhu, M.; Wang, G.; Sun, X.; Liao, Z.; et al. A Basic Leucine Zipper Transcription Factor, AabZIP1, Connects Abscisic Acid Signaling with Artemisinin Biosynthesis in Artemisia annua. Mol. Plant 2015, 8, 163–175. [Google Scholar] [CrossRef]
  51. Shen, S.L.; Yin, X.R.; Zhang, B.; Xie, X.L.; Jiang, Q.; Grierson, D.; Chen, K.S. CitAP2.10 activation of the terpene synthase CsTPS1 is associated with the synthesis of (+)-valencene in ‘Newhall’ orange. J. Exp. Bot. 2016, 67, 4105–4115. [Google Scholar] [CrossRef]
  52. Sun, P.-W.; Xu, Y.-H.; Yu, C.-C.; Lv, F.-F.; Tang, X.-L.; Gao, Z.-H.; Zhang, Z.; Wang, H.; Liu, Y.; Wei, J.-H. WRKY44 represses expression of the wound-induced sesquiterpene biosynthetic gene ASS1 in Aquilaria sinensis. J. Exp. Bot. 2019, 71, 1128–1138. [Google Scholar] [CrossRef]
  53. Xu, Y.H.; Liao, Y.C.; Lv, F.F.; Zhang, Z.; Sun, P.W.; Gao, Z.H.; Hu, K.P.; Sui, C.; Jin, Y.; Wei, J.H. Transcription Factor AsMYC2 Controls the Jasmonate-Responsive Expression of ASS1 Regulating Sesquiterpene Biosynthesis in Aquilaria sinensis (Lour.) Gilg. Plant Cell Physiol. 2017, 58, 1924–1933. [Google Scholar] [CrossRef] [PubMed]
  54. Hong, G.J.; Xue, X.Y.; Mao, Y.B.; Wang, L.J.; Chen, X.Y. Arabidopsis MYC2 interacts with DELLA proteins in regulating sesquiterpene synthase gene expression. Plant Cell 2012, 24, 2635–2648. [Google Scholar] [CrossRef] [PubMed]
  55. Xu, J.; Wu, S.-R.; Xu, Y.-H.; Ge, Z.-Y.; Sui, C.; Wei, J.-H. Overexpression of BcbZIP134 negatively regulates the biosynthesis of saikosaponins. Plant Cell Tissue Organ Cult. (PCTOC) 2019, 137, 297–308. [Google Scholar] [CrossRef]
  56. Yu, Z.X.; Li, J.X.; Yang, C.Q.; Hu, W.L.; Wang, L.J.; Chen, X.Y. The jasmonate-responsive AP2/ERF transcription factors AaERF1 and AaERF2 positively regulate artemisinin biosynthesis in Artemisia annua L. Mol. Plant 2012, 5, 353–365. [Google Scholar] [CrossRef]
  57. Van Der Fits, L.; Memelink, J. ORCA3, a jasmonate-responsive transcriptional regulator of plant primary and secondary metabolism. Science 2000, 289, 295–297. [Google Scholar] [CrossRef]
Figure 1. Fungal morphology. Note: (AP) represent fungi number, respectively, CX-1, CX-2, CX-3, CX-5, ZCX-1, ZCX-4, ZCX-5, ZCX-7, ZCX-8, ZCX-13, ZCX-15, ZCX-17, YB-1, YB3-1, HLH, YML.
Forests 16 00960 g001
Figure 2. (A) (YB-1), (B) (YB3-1), (C) (HLH), (D) (YML); (A1D1) are two-month total ion chromatograms. (A2D2) are fourth-month total ion chromatograms.
Forests 16 00960 g002
Figure 3. Part of the sample chromatogram.
Forests 16 00960 g003
Figure 4. Annotated Nr results.
Forests 16 00960 g004
Figure 5. Annotated KEGG results.
Forests 16 00960 g005
Figure 6. Annotated GO results.
Forests 16 00960 g006
Figure 7. Differential gene expression profiles of A. sinensis under multiple induction treatments versus control.
Forests 16 00960 g007
Figure 8. Functional GO enrichment.
Forests 16 00960 g008
Figure 9. KEGG pathway enrichment of upregulated genes. Note: A—LZZ4 vs. BMZ; B—jYB1Z4 vs. BMZ; C—CZ4 vs. BMZ; D—cjYB1Z4 vs. BMZ.
Forests 16 00960 g009
Figure 10. KEGG pathway enrichment of downregulated genes. Note: A—LZZ4 vs. BMZ; B—jYB1Z4 vs. BMZ; C—CZ4 vs. BMZ; D—cjYB1Z4 vs. BMZ.
Forests 16 00960 g010
Figure 11. Terpenoid backbone biosynthesis pathway. Note: Green indicates that the expression level of the enzyme involved in sesquiterpene biosynthesis in the sample is downregulated compared with the BMZ control, red indicates upregulation, and blue indicates both upregulation and downregulation.
Forests 16 00960 g011
Figure 12. Sesquiterpenoid and triterpenoid biosynthesis pathway. Note: Green indicates that the expression level of the enzyme involved in sesquiterpene biosynthesis in the sample is downregulated compared with the BMZ control, red indicates upregulation, and blue indicates both upregulation and downregulation.
Forests 16 00960 g012
Figure 13. Heatmap of differential unigenes involved in the MVA pathway.
Forests 16 00960 g013
Figure 14. Heatmap of differential unigenes involved in the MEP pathway.
Forests 16 00960 g014
Figure 15. Differential unigene heatmaps encoding sesquiterpene synthases.
Forests 16 00960 g015
Figure 16. Differential unigene transcription factor heatmap.
Forests 16 00960 g016
Figure 17. Differential unigene co-expression network. Note: Genes involved in sesquiterpene biosynthesis are represented by circles, and transcription factors are represented by triangles.
Forests 16 00960 g017
Table 1. Gradient elution conditions for high-performance liquid chromatography.
Time (min)Mobile Phase A (%)Mobile Phase B (%)
0~1015→2085→80
10~1920→2380→77
19~2123→3377→67
21~393367
39~4033→3567→65
40~503565
50.1~60955
Table 2. Summary of BLAST alignment results and taxonomic assignments for fungal isolates (ITS).
No.Scientific NameAccessionQuery CoverE ValuePer. Ident
CX-1Fusarium proliferatumON181987.1100%0.00 100%
KR861510.1100%0.00 100%
CX-2Penicillium citrinumMT141138.198%0.00 100%
LT558887.198%0.00 99%
CX-3Penicillium chrysogenumKX349473.1100%0.00 100%
KR233462.1100%0.00 100%
CX-5Fusarium proliferatumON181987.1100%0.00 100%
OQ983868.1100%0.00 100%
ZCX-1Phaeoacremonium alvesiiOW985201.195%0.00 99%
OW985834.195%0.00 99%
ZCX-4Trichoderma atrovirideOP178975.1100%0.00 100%
MH357337.1100%0.00 100%
ZCX-5Fusarium solaniMN783104.1100%0.00 100%
KF255997.1100%0.00 100%
ZCX-7Fusarium proliferatumON181987.1100%0.00 100%
OQ983868.1100%0.00 100%
ZCX-8Neodeightonia subglobosaLC177544.1100%0.00 98%
LC317703.1100%0.00 98%
ZCX-13Acrodontium saloneumJF449870.1100%0.00 98%
OW983741.1100%0.00 99%
ZCX-15Penicillium paxilliJN617709.1100%0.00 100%
MN783046.1100%0.00 100%
ZCX-17Pestalotiopsis kenyanaOR777892.1100%0.00 100%
OR777895.1100%0.00 100%
YB-1Fusarium equisetiMK729628.1100%0.00 100%
MT428183.1100%0.00 100%
YB3-1Fusarium equisetiMK729628.1100%0.00 100%
MT428183.1100%0.00 100%
HLHLeptographium truncatumJX444638.1100%0.00 100%
KU319006.1100%0.00 100%
YMLFusarium proliferatumON181987.1100%0.00 100%
KR861510.1100%0.00 100%
Table 3. Fungal identification results.
Fungi NumberingFigure 1 NumberingGenus NameSpecies Name
CX-1AFusariumFusarium proliferatum
CX-2BPenicilliumPenicillium citrinum
CX-3CPenicilliumPenicillium chrysogenum
CX-5DFusariumFusarium proliferatum
ZCX-1EPhaeoacremoniumPhaeoacremonium alvesi
ZCX-4FTrichodermaTrichoderma atroviride
ZCX-5GFusariumFusarium solani
ZCX-7HFusariumFusarium proliferatum
ZCX-8INeodeightoniaNeodeightonia subglobosa
ZCX-13JAcrodontiumAcrodontium saloneum
ZCX-15KPenicilliumPenicillium paxilli
ZCX-17LPestalotiopsis kenyanaPestalotiopsis kenyana
YB-1MFusariumFusarium equiseti
YB3-1NFusarium-
HLHOLeptographiumLeptographium koreanum
YMLPFusariumFusarium proliferatum
Table 4. Survival and colonization capacity of wood-boring insects in A. sinensis under controlled conditions.
No.NameDay 2Day 4Days 7–14
SurvivalLarval GallerySurvivalLarval GallerySurvivalLarval Gallery
1Odontotermes formosanusYNNNNN
2Scleroderma guaniYNNNNN
3Tomicus yunnanensisYNYNNN
4Nadezhdiella cantoriYYYYYY
Note: Y—yes; N—no.
Table 5. GC-MS compound content summary table.
No.CompoundTwo-Month Average Content (%)Four-Month Average Content (%)
YB-1YB3-1YB-1YB3-1YB-1YB3-1YB-1YB3-1
1Nonanal1.861.941.122.311.651.341.381.45
2Naphthalene0.140.110.070.110.610.90.740.74
3Hexanal0.590.660.330.492.051.130.821.04
4Ethanol0.270.170.130.13.310.620.50.76
5Octanal0.170.240.090.190.510.370.310.34
6Dodecane-0.060.050.08-0.210.210.18
7Tridecane0.060.140.140.170.220.60.560.59
8Tetradecane0.761.561.361.540.852.642.622.78
9Pentadecane3.023.993.393.651.824.914.644.51
10Hexadecane3.283.63.253.561.673.293.453.33
11Heptadecane-0.86-0.83-0.770.910.69
12Acetic acid0.940.230.220.215.93---
13(-)-β-elemene0.380.192.760.17-0.27--
14β-Eudesmol1.982.222.982.13.831.481.952.14
15Alloaromadendrene0.38---0.46---
16Cyclopentadecane-0.76-0.66-0.18--
17Decanal0.210.250.130.310.170.270.420.41
18Heptane0.17----2.252.442.78
19Heptanal-0.180.090.120.220.290.270.3
201-Octanol0.10.080.050.09-0.260.150.06
211-Pentanol0.130.11--0.890.650.620.55
222,6,10-Trimethylpentadecane---2.07-1.461.61.59
232,6,10-Trimethyltetradecane---0.78-0.710.650.6
242,6,10-Trimethyltridecane1.52.142.021.860.92.392.162.27
252,6,10-Trimethyldodecane0.20.250.190.21-0.320.310.24
262,6,10,14-Tetramethylpentadecane1.771.821.951.920.621.191.391.28
271-methoxy-2-Propanol0.330.350.20.232.560.790.720.76
281-Methylnaphthalene0.030.030.020.03-0.060.09-
291-Heptanol0.030.050.020.02-0.24--
301,6-Dimethylnaphthalene0.090.170.120.14-0.20.170.15
31Benzaldehyde0.220.180.110.160.10.490.260.34
32Phenol0.430.280.170.31-0.10.05-
337-Methylpentadecane1.291.7-1.460.751.541.41.46
347,9-Dimethylhexadecane-0.530.27-----
356-Methyltridecane---0.04--0.17-
365-Methyltetradecane0.490.750.670.67-0.880.850.81
374-Methylpentadecane1.111.311.191.25-1.251.191.33
384-Methyltetradecane0.60.910.830.79-0.990.850.84
394-Methyltridecane--0.050.07-0.08--
403-Methyltetradecane0.731.150.961.02-2.43--
413-Methyltridecane0.050.160.110.15-0.250.230.2
423-Methylbutanal0.130.110.070.061.480.410.350.44
433-Methyl-5-propylnonane-0.410.4-0.670.360.370.1
442-Ethyl-3-methylbutanal0.050.03--0.660.220.130.2
452-Ethyl-1-hexanol0.410.310.260.250.90.450.50.46
462-Pentylfuran0.080.090.060.080.290.230.190.19
472-Tetradecyl methoxyacetate-0.95------
482-Methylpentanal0.10.090.050.07----
492-Methylpentadecane1.061.321.091.170.541.221.251.24
502-Methyltridecane-0.140.090.13-0.20.230.18
512-Methylnaphthalene-0.070.05--0.20.160.14
521-Butanol--0.210.16-1.14-1.35
53Ethyl acetate---0.22-0.49-0.46
Table 6. Agarotetrol content.
TreatmentNumberingAgarotetrol Content (%)
Two MonthsFour MonthsSix Months
Fungal inductionCX-10.02 ± 0.001 h0.006 ± 0.001 h0.007 ± 0.003 i
Fungal inductionCX-20.02 ± 0.003 h0.01 ± 0.004 ef0.035 ± 0.001 de
Fungal inductionCX-30.028 ± 0.002 fg0.152 ± 0.107 b0.042 ± 0.004 b
Fungal inductionCX-50.03 ± 0.002 f0.01 ± 0.002 ef0.002 ± 0.002 j
Fungal inductionZCX-10.022 ± 0.003 h0.012 ± 0.003 e0.017 ± 0.001 h
Fungal inductionZCX-40.015 ± 0.001 i0.008 ± 0.002 fg0.028 ± 0.003 f
Fungal inductionZCX-50.015 ± 0.001 i0.274 ± 0.100 a0.043 ± 0.004 b
Fungal inductionZCX-70.021 ± 0.003 h0.008 ± 0.002 fg0.036 ± 0.004 cde
Fungal inductionZCX-80.03 ± 0.001 f0.012 ± 0.001 e0.025 ± 0.002 fg
Fungal inductionZCX-130.027 ± 0.005 g0.007 ± 0.002 fg0.015 ± 0.005 h
Fungal inductionZCX-150.015 ± 0.001 i0.007 ± 0.004 fg0.028 ± 0.002 f
Fungal inductionZCX-170.017 ± 0.002 i0.013 ± 0.003 e0.008 ± 0.001 ij
Fungal inductionYB-10.034 ± 0.015 e0.039 ± 0.012 c0.038 ± 0.003 c
Fungal inductionYB3-10.035 ± 0.013 de0.008 ± 0.002 fg0.036 ± 0.001 cde
Fungal inductionHLH0.037 ± 0.010 bcd0.009 ± 0.001 fg0.030 ± 0.002 ef
Fungal inductionYML0.039 ± 0.008 b0.008 ± 0.002 fg0.002 ± 0.001 j
PDAPDA0.014 ± 0.004 i0.025 ± 0.023 d0.004 ± 0.002 j
Cold drillLZ0.006 ± 0.001 j0.002 ± 0.002 i0.037 ± 0.004 cd
Thermal drillRZ0.017 ± 0.006 i0.006 ± 0.005 h0.033 ± 0.001 e
Insect boringC0.035 ± 0.013 de0.007 ± 0.002 fg0.037 ± 0.012 cd
Insect + fungiCJYB-10.046 ± 0.003 a0.007 ± 0.002 fg0.054 ± 0.001 a
Insect + fungiCJYB3-10.038 ± 0.009 bc0.007 ± 0.003 fg0.045 ± 0.001 b
Insect + fungiCJHLH0.036 ± 0.012 bcd0.008 ± 0.002 fg0.035 ± 0.002 de
Insect + fungiCJYML0.035 ± 0.013 cde0.006 ± 0.004 h0.031 ± 0.003 ef
Note: Different lowercase letters in the same column indicate significant difference at the p < 0.05 level.
Table 7. Gene function annotations.
ItemCountPercentage
All852,360 100.00%
Annotation386,360 45.33%
KEGG319,215 37.45%
KEGG PATHWAY155,112 18.20%
Nr306,813 36.00%
Uniprot292,397 34.30%
GO233,210 27.36%
KOG18,582 2.18%
Pfam180,758 21.21%
TFs1347 0.16%
Disclaimer/Publisher’s Note: The statements, opinions and data contained in all publications are solely those of the individual author(s) and contributor(s) and not of MDPI and/or the editor(s). MDPI and/or the editor(s) disclaim responsibility for any injury to people or property resulting from any ideas, methods, instructions or products referred to in the content.

