Article

Integrating UAV-RGB Spectral Indices by Deep Learning Model Enables High-Precision Olive Tree Segmentation Under Small Sample

1
College of Big Data and Intelligent Engineering, Southwest Forestry University, Kunming 650224, China
2
Yunnan Forestry Technological College, Kunming 650224, China
3
Kunming Electrical Science Research Institute, Kunming 650224, China
4
The Key Laboratory of National Forestry and Grassland Administration on Forestry and Ecological Big Data, Southwest Forestry University, Kunming 650224, China
5
Faculty of Computer and Mathematical Sciences, Universiti Teknologi MARA Perlis Branch, Arau Campus, Arau 02600, Perlis, Malaysia
6
Department of Information Systems, Faculty of Science and Technology, Universitas Airlangga, Surabaya 60115, Indonesia
*
Author to whom correspondence should be addressed.
These authors contributed equally to this work.
Forests 2025, 16(6), 924; https://doi.org/10.3390/f16060924
Submission received: 22 April 2025 / Revised: 13 May 2025 / Accepted: 30 May 2025 / Published: 31 May 2025

Abstract

Accurate maps of olive plantations are very important to monitor and manage the rapid expansion of olive cultivation. Nevertheless, in situations where data samples are limited and the study area is relatively small, the low spatial resolution of satellite imagery poses challenges in accurately distinguishing olive trees from surrounding vegetation. This study presents an automated extraction model for the rapid and accurate identification of olive plantations using unmanned aerial vehicle RGB (UAV-RGB) imagery, multi-index combinations, and deep learning algorithm based on ENVI-Net5. The combined use of Lightness, Normalized Green-Blue Difference Index (NGBDI), and Modified Green-Blue Vegetation Index (MGBVI) indices effectively capture subtle spectral differences between olive trees and surrounding vegetation, enabling more precise classification. Study results indicate that the proposed model minimizes omission and misclassification errors through incorporating ENVI-Net5 and the three spectral indices, especially in differentiating olive trees from other vegetation. Compared to conventional models such as Random Forest (RF) and Support Vector Machine (SVM), the proposed method yields the highest metrics—overall Accuracy (OA) of 0.98, kappa coefficient of 0.96, producer’s accuracy (PA) of 0.95, and user’s accuracy (UA) of 0.92. These values represent an improvement of 7%–8% in OA and 15%–17% in the kappa coefficient over baseline models. Additionally, the study highlights the sensitivity of ENVI-Net5 performance to iterations, underlining the importance of selecting an optimal number of iterations for achieving peak model accuracy. This research provides a valuable technical foundation for the effective monitoring of olive plantations.

1. Introduction

The olive tree (Olea europaea), native to Mediterranean regions [1], produces fruit rich in high-quality vegetable oil. Renowned for its high yield, superior quality, longevity, and substantial economic returns, it is recognized as one of the world’s four major woody oilseed crops, with notable economic and medicinal value [2]. Olive trees thrive on sloped terrains and nutrient-poor soils, and their ecosystems demonstrate greater stability compared to many other agricultural systems, offering significant ecological, economic, and social benefits to olive-producing regions [3]. The preservation of olive groves relies heavily on sustainable ecological monitoring and management. As olive cultivation continues to expand, the need for scientific, efficient monitoring, and management approaches has become increasingly critical. Consequently, the rapid and accurate acquisition of olive cultivation data, along with the adoption of automated and precision management practices, is essential for informed agricultural planning and sustainable development [4].
Traditional methods for obtaining tree crown information primarily depend on field-based manual measurements or visual interpretation of remote sensing imagery. These approaches are often limited by environmental conditions and high labor demands, rendering the processes time-consuming and inefficient [5]. However, the rapid advancement of remote sensing and geospatial technologies has facilitated more efficient and accurate surveys of olive trees [2]. Although satellite remote sensing can monitor a wide range, its spatial resolution is lower than that of cm-level UAV image data, which cannot clearly reflect the boundary of tree crown [6]. High-resolution remote sensing images such as QuickBird, WorldView, and GeoEye can also reach the sub-meter scale, but the flexibility of data acquisition is limited and data cannot be obtained in real time according to monitoring requirements [7,8].
Compared with satellite remote sensing and aerial photography, unmanned aerial vehicles have the advantages of low cost, high resolution, and rapid deployment, and have been widely used in forestry [9,10]. UAV can acquire data rapidly and frequently regardless of time and geography, effectively overcome the limitations of satellite remote sensing spatial resolution and reentry time, and meet the needs of rapid monitoring, assessment, and system of forest resources under user-defined space-time scales [9,11,12]. The sub-meter or sub-centimeter ultra-high spatial resolution image data obtained by UAV can clearly describe the canopy information of trees [13,14,15], significantly improve the feasibility of accurate detection of olive trees in complex environments, and become an important tool for contemporary forest and agricultural monitoring [16,17,18].
Machine learning algorithms such as K-Nearest Neighbor (KNN), RF, and SVM have been widely applied in the classification of remote sensing imagery, facilitating automated and efficient data interpretation [19]. In recent years, the emergence of deep learning techniques—particularly Convolutional Neural Networks (CNN)—has further advanced remote sensing applications in forest resource monitoring [20], including tree species identification, individual tree detection, forest change assessment, and forest fire surveillance. CNNs integrated with UAV imagery have been successfully employed for forest change detection [21], Mask R-CNN combined with UAV imagery, vegetation indices, and DSM have enabled effective classification of live and dead trees [22]. Moreover, CNNs have been applied to accurately identify different types of tree damage [23]. Despite their high classification accuracy and efficiency, CNN-based models generally require large volumes of labeled training data. For instance, Shilong Yao et al. utilized the R-CNN model to classify live and dead trees using 28,957 tree crown samples [22], whereas Pedro Freitas et al. applied the R-CNN model to monitor surface water bodies using 23,432 labeled polygon samples [24]. This dependency on large datasets not only increases the burden of data collection but also reduces model performance and stability when sample availability is limited. In this context, ENVI’s deep learning module offers a compelling alternative. It enables the development of high-resolution image segmentation models capable of delivering accurate ground object extraction even with limited training data [25,26]. This capability is particularly valuable for precise mapping and classification tasks in remote sensing applications with constrained data resources [27]. Bujar Fetai et al. compared the detection results of U-Net and ENVI-Net5 at the land boundary, and the overall accuracy of both models reached more than 95% [9]. Liu et al. used the ENVI-Net5 model to extract buildings with an accuracy of 0.977, which confirmed the feasibility of this method in high-resolution image segmentation [26]. Zheng et al. compared the extraction accuracy of ENVI-Net5 model and U-Net model in sparse plastic greenhouse and found that ENVI-Net5 is not only better than U-Net in accuracy, but also convenient to operate. It can directly input large size images without considering the problem of positive and negative sample balance, and is more suitable for object classification with large area and few targets [28].
The spectral reflectance of vegetation is influenced by multiple intrinsic factors, including vegetation type and internal water content of plant tissues [29]. In the context of remote sensing, the spectral similarity between olive trees and other types of vegetation in the study area poses a significant challenge for accurate extraction using only RGB spectral information. To address this limitation, land cover classification often incorporates vegetation indices (VIs) alongside RGB spectral data to construct multi-feature datasets, enhancing the distinction between vegetation types [30,31]. However, UAV-based RGB imagery provides limited spectral information, which can result in challenges such as “spectral confusion”—where identical vegetation types exhibit varying spectra or different vegetation types share similar spectral signatures [5]. To mitigate these issues, researchers generate additional VIs by combining various spectral bands to enrich the dataset and emphasize subtle differences in vegetation characteristics. Furthermore, variations in image brightness among land cover types also serve as a useful feature for classification [31]. Previous studies have underscored the limitations of relying solely on single-band spectral analysis for vegetation extraction [32]. Vegetation indices—digital models derived from the reflectance of two or more spectral bands—are specifically designed to highlight unique vegetation properties [33]. Normalized Difference Vegetation Index (NDVI), Enhanced Vegetation Index (EVI), and RVI have been widely used for monitoring vegetation distribution and canopy growth, primarily utilizing visible and near-infrared bands.
Currently, UAV remote sensing predominantly utilizes visible light (RGB) imaging, which offers less spectral information compared to conventional satellite remote sensing. Consequently, distinguishing between different types of vegetation with subtle spectral variations remains challenging [29,32]. Nevertheless, ongoing advancements in UAV technology have spurred the development of new vegetation indices tailored to the RGB spectral range. Wang et al. substituted the near-infrared band with the green band to propose the Visible-band Difference Vegetation Index (VDVI) [34]. Other RGB-based indices such as Excess Green (ExG), VDVI, NGBDI, MGBVI, and Excess Green minus Excess Red (ExG–ExR) have shown considerable effectiveness in various applications, including wetland vegetation classification [35], crop mapping [36], mangrove, and marsh biomass monitoring [37], and rice nutrient status estimation [38]. These studies underscore the practical utility of visible-light vegetation indices derived from UAV-RGB imagery for vegetation monitoring tasks.
Most existing deep learning models for object recognition in remote sensing imagery primarily rely on basic spectral band data. However, UAV imagery is typically constrained to the RGB, which introduces challenges such as spectral confusion—where identical objects exhibit different spectral signatures and distinct objects share similar ones. This issue is particularly pronounced when distinguishing between various vegetation types, which often exhibit minimal spectral variation [5,39].
This study addresses these limitations by optimizing the ENVI-Net5 deep learning model to operate effectively using only UAV-RGB imagery. By incorporating a comprehensive set of input features—including RGB spectral characteristics, visible light vegetation indices, and image brightness attributes—the model enhances its ability to accurately identify olive trees. This integrated approach simplifies the data requirements and reduces the dependence on large training datasets, enabling rapid and precise extraction of olive plantation information. The proposed method offers a novel and efficient framework for the identification of olive trees and potentially other plantation types using UAV-RGB data alone.

2. Data and Methodology

This study employs UAV-RGB imagery and a limited-sample olive tree dataset to develop a rapid and accurate extraction model for olive tree information by optimizing the ENVI-Net5 deep learning architecture. The methodological framework comprises five key steps (Figure 1): (1) preprocessing of UAV imagery in the study area; (2) construction of an olive tree sample dataset in the study area; (3) determination of optimal model parameters for olive tree extraction; (4) establishment of seven combinations based on R, G, B bands and EXG, NGBDI, MGBVI, and Lightness indices to identify the optimal index combination for olive tree extraction using the ENVI-Net5 model; and (5) comparison of extraction accuracy between the ENVI-Net5 model and SVM and RF machine learning models.

2.1. Survey Region

The study area is located in the olive cultivation region of Dianzhong Town, Eshan County, Yuxi City, in Yunnan Province (Figure 2). Eshan County, situated in central Yunnan, experiences a mid-subtropical semi-humid plateau monsoon climate. The region’s annual average temperature is 21.4 °C, with an accumulated temperature exceeding 10 °C of 5084.1 °C. The average annual precipitation is 874.7 mm, and the total annual sunshine duration is 2122.5 h. Winter temperatures average 6.8 °C, characterized by mild conditions without extreme cold, while summers remain moderate without excessive heat. This temperate climate, coupled with abundant sunlight and sufficient rainfall, provides an ideal environment for olive cultivation.

2.2. RGB-UAV Data and Samples

2.2.1. Data Acquisition

The drone imagery data were acquired on 1 June 2023 using a DJI MaVic 3 drone manufactured by Shenzhen DJI Technology Co., Ltd., Shenzhen, China, which is headquartered in Shenzhen, China. It’s a consumer drone equipped with RGB sensors. In order to avoid the impact of cloud cover and shooting angle on UAV image quality, we chose a sunny and windless weather condition and carried out UAV data acquisition between 11:00 a.m. and 14:00 p.m. The UAV flies according to the preset flight path, the flight speed is 7 m/s, the flight altitude is 100 m, the photo mode adopts equal time interval photography, the shutter is 1/s, and the overlap ratio of the front and side is set to 80% and 70%, respectively. Pix4D 4.5.6 mapping software was used to stitch the photos collected by UAV to generate an orthographic image map with 17,103 × 11,731 pixels and a spatial resolution of 0.04 m. Then, the clipping tool of ENVI 5.6 software was used to remove the blurred boundary part, and the image was linearly stretched by 2% to obtain the final UAV image map of the study area.

2.2.2. Sample Selection

The ENVI-Net5 model demonstrates robust anti-interference capabilities and does not require fully labeled samples. Various labeling methods, such as polygon labeling, line labeling, and point labeling, can be used for sample preparation. Polygon and line labeling often result in mixed pixels, which can compromise classification accuracy. To address this, this study utilizes the ROI Tool in ENVI to perform point labeling. Combined with GPS coordinates from field surveys, a total of 1854 olive tree training sample points were labeled in localized areas of the study region. Using ArcGIS randomly generated points in the study area, combined with visual interpretation and field survey data, a total of 341 olive validation sample points and 642 other feature samples were selected.

2.2.3. UAV-RGB Index Combination

The study selected three commonly used vegetation indices for vegetation extraction from UAV imagery (Table 1), in addition to the Lightness index, which was derived from the HLS transformation of the RGB bands. To obtain reliable results, we designed seven band combination schemes (S1–S7, Table 2) to assess the extraction accuracy of olive tree information using the ENVI-Net5 model under different feature combinations.

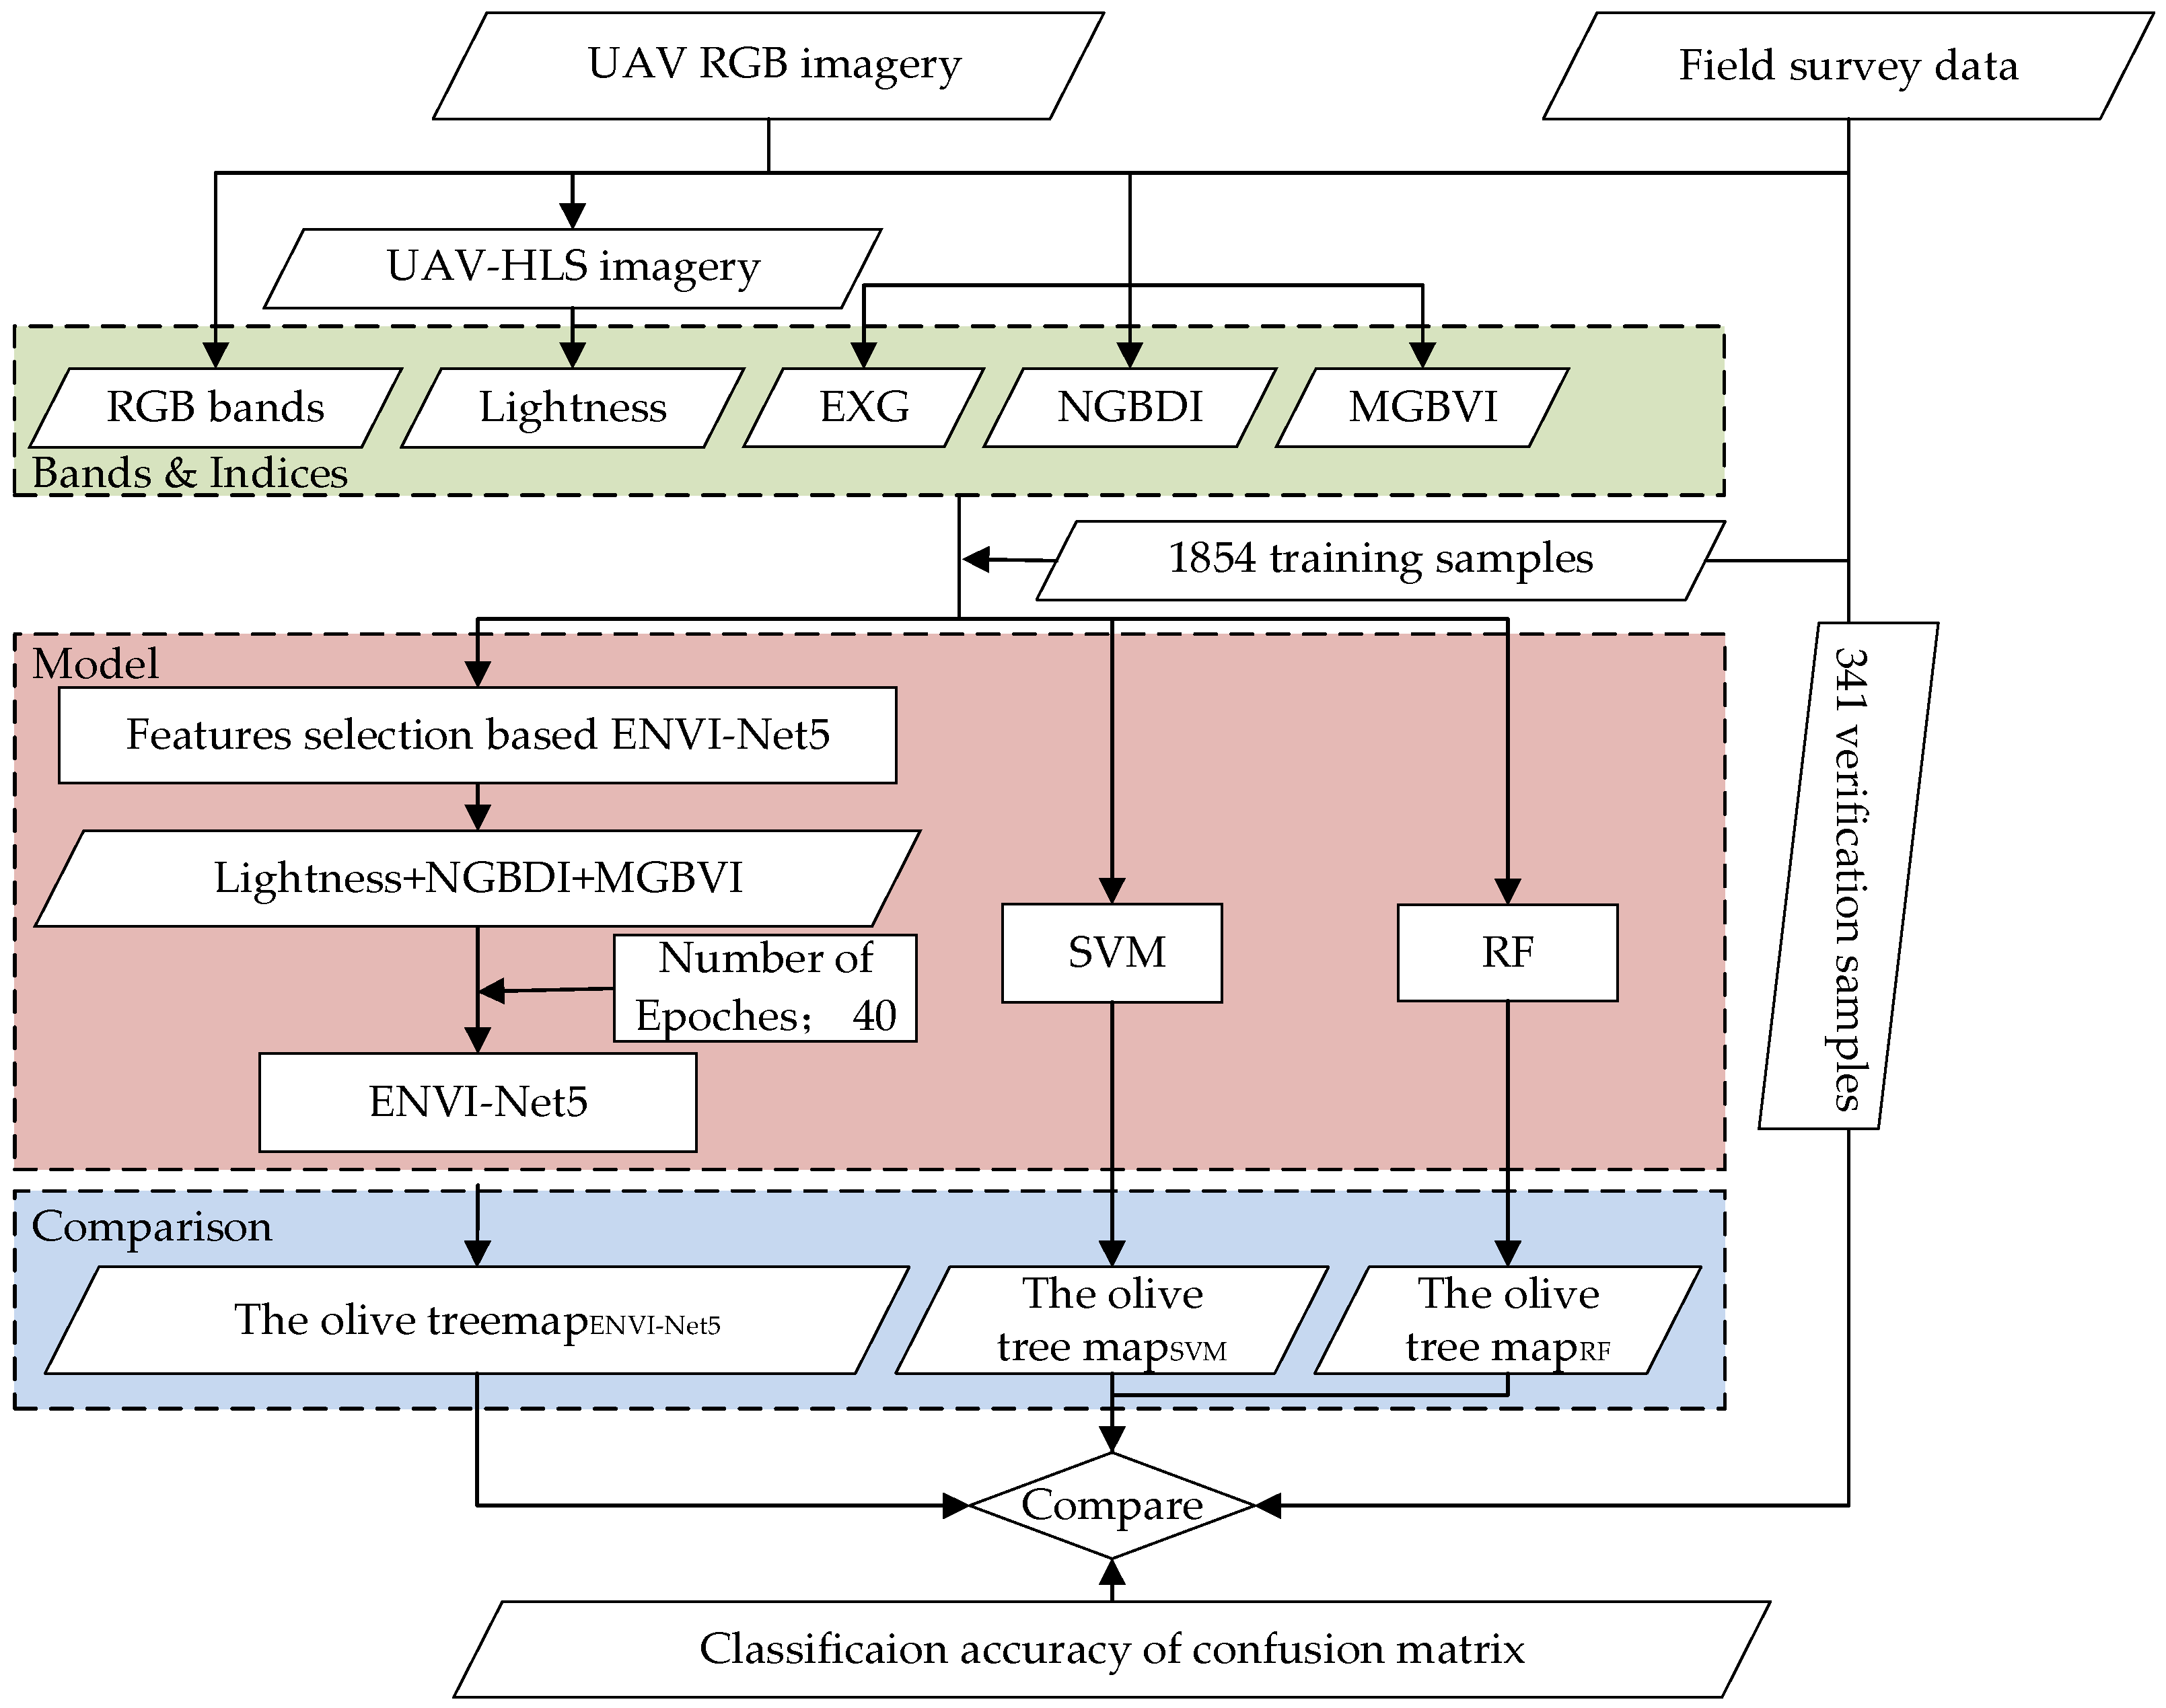
2.3. Model and Parameter Settings

2.3.1. ENVI-Net5 Model

The deep learning model used in the study is based on the Deep Learning 1.1.2 module in ENVI 5.6.1 software. The ENVI-Net5 framework is designed based on TensorFlow open source framework and U-Net model [40], which is specially designed for remote sensing image processing. U-Net is one of the classical algorithms for semantic segmentation of fully convolution networks (FCN) [41]. It is mainly composed of encoding process and decoding process. It increases the nonlinear characteristics of neural network model through activation function [42]. It has the characteristics of high fusion degree, less training data and fast training speed. It can still obtain good learning effect when the number of samples is small.

2.3.2. SVM Model

The SVM is a supervised classification algorithm based on statistical learning, first proposed by Vapnik et al. in 1964 [43]. It is particularly effective in handling small-sample, high-dimensional, and nonlinear data by maximizing the classification margin and utilizing kernel tricks. However, the performance of SVM is highly dependent on the selection of appropriate parameters. In practical applications, it is essential to choose between linear and kernel methods based on the characteristics of the data, while balancing model complexity and generalization capability through careful parameter tuning. Despite its strengths, SVM has limitations, including long training times and high memory consumption [44].

2.3.3. RF Model

RF introduced by Breiman in 2001, is a supervised machine learning algorithm based on ensemble learning, commonly used for both classification and regression tasks. The core principle of RF involves constructing multiple decision trees and aggregating their predictions to improve model accuracy and robustness [43].

2.3.4. Parameter Settings

The main parameters of ENVI-Net5 model include Number of Bands, Patch size, Number of Epoch, Number of Patches per Epochs, Number of patches per Image, etc. It is found that the deep learning results are greatly affected by the input band information and Number of Epoch parameters. Therefore, in the adjustment of parameters, model training is mainly carried out by setting different band combination input schemes and Number of Epoch parameters. First, S1 scheme was used as input to test the influence of Number of Epoch 30, 40, 50, and 60 on olive extraction results. Secondly, based on the optimal Number of Epoch parameter, the influence of different band combination schemes on olive extraction results was tested, and the other parameters were default parameters of the system.
SVM and RF models are derived from ENVI 5.6.1 software. Unlike deep learning models, the selection of sample points in machine learning is typically based on the final classification categories. For this study, the training sample points for olive trees were consistent with those used in deep learning. However, for other land cover types, sample points were selected according to the actual land cover categories, ensuring diversity and representativeness. Additionally, machine learning models require multi-feature combinations as input to capture the nonlinear relationships present in image data, thereby enhancing both model accuracy and generalization. Therefore, the R, G, and B bands of UAV imagery are combined with EXG, NGBDI, MGBVI, and Lightness to perform a total of 7 features as input data of SVM and RF models, and other parameters are set as system default values.

2.4. Accuracy Assessment

To evaluate the effectiveness of olive information extraction across different models, this study utilized a confusion matrix method combined with sample data to assess classification accuracy. The UA and PA for olive trees in the classification results of each model were compared, alongside the OA and the kappa coefficient.
U A = x k k x k + × 100 %
P A = x k k x + k × 100 %
O A = k = 1 n x k k N × 100 %
K a p p a = N i = 1 n x k k i = 1 n x k + x + k N 2 i = 1 n ( x k + x + k )
where N represents the total number of validation samples, n denotes the number of classification categories, x k k   is the number of samples correctly classified as K,   x k + stands for the number of samples classified into the k-th category, and x + k   indicates the predicted number of samples for the k-th category.

3. Results

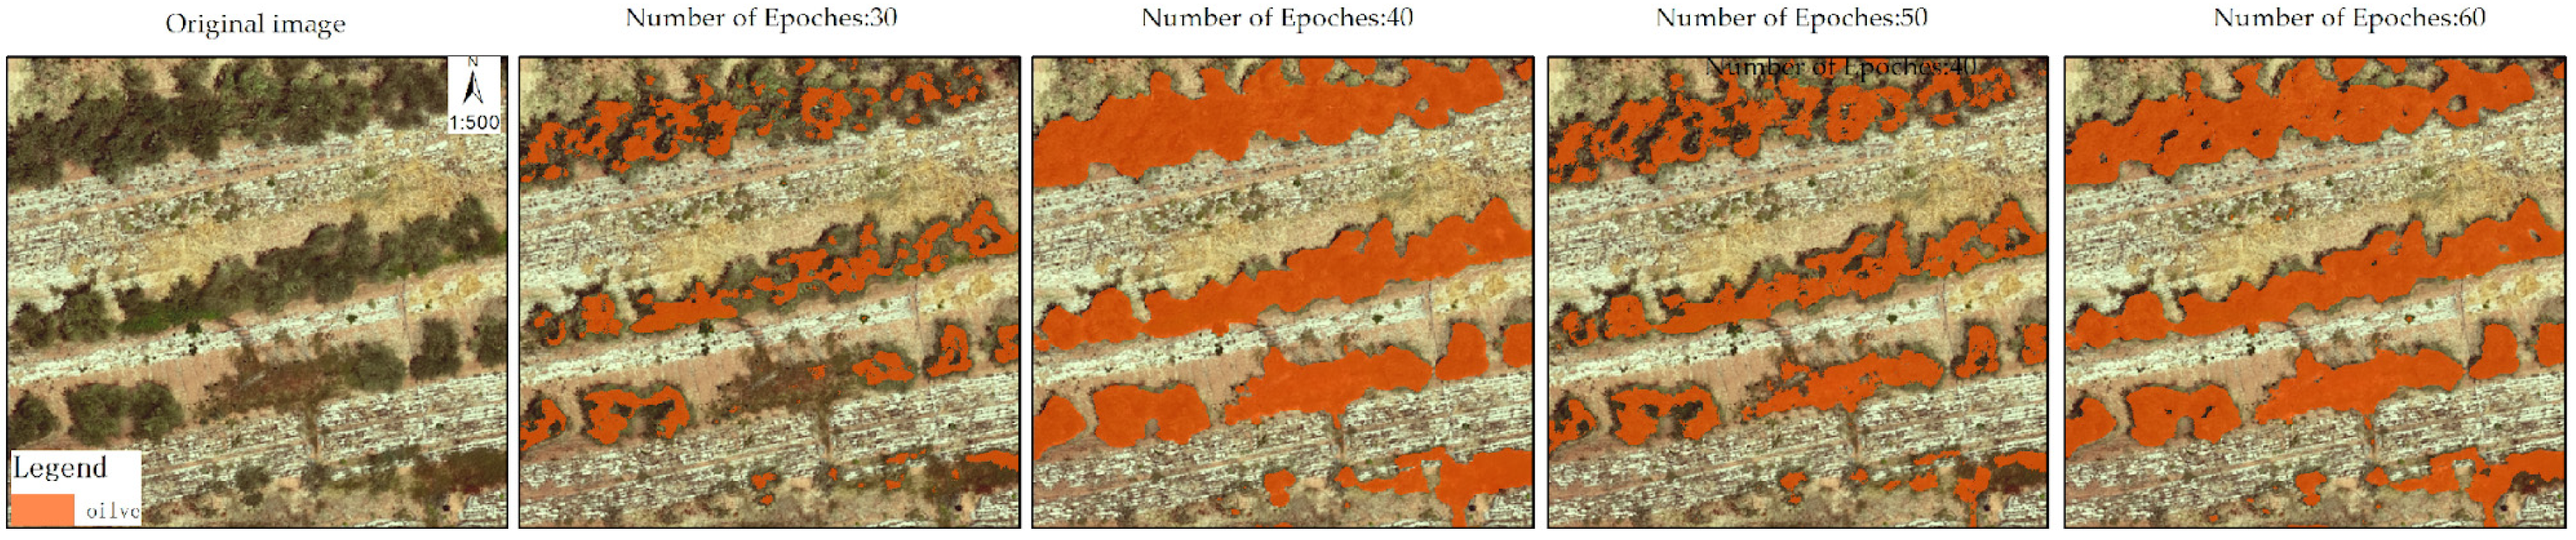
3.1. Extraction Accuracy of Olive Trees Under Different Iteration Numbers in the ENVI-Net5 Model

As shown in Figure 3, when the Number of Epochs is set to 30, significant omission errors occur due to insufficient iterations. Both omission and commission errors remain relatively low when the Number of Epochs is set to 40 and 60. However, noticeable omission errors are observed when the Number of Epochs is set to 50. The accuracy evaluation results from the confusion matrix (Table 3) show that the OA, kappa coefficient, PA, and UA reach their highest levels (0.92, 0.82, 0.89, and 0.87, respectively) when the Number of Epochs is 40. Therefore, this study selects 40 as the optimal number of iterations.

3.2. Comparison of Deep Learning Results Across Different Classification Schemes

Based on the RGB UAV image data and the optimal iteration number, along with other model parameters obtained from the 3.1 test, the accuracy of different band combination deep learning models for olive tree information extraction was evaluated. The classification results (Figure 4) and accuracy validation (Table 4) indicate the following. In Part A, the olive plantation area exhibits high density with significant canopy overlap and minimal presence of other tree species. Schemes S1, S2, S3, and S7 effectively extracted olive tree information with clear and accurate boundary delineation. Schemes S4 and S5 showed minor omission errors, while S6 exhibited noticeable misclassification.
In Part B, where olive trees are interplanted with other tree species, schemes S1, S3, S4, and S5 struggled to effectively distinguish olive trees from other species. Scheme S2 partially differentiated other tree species, while S6 and S7 outperformed S2 in distinguishing olive trees, though S6 still displayed significant misclassification.
In Part C, characterized by low canopy closure and gaps between olive tree crowns, all schemes except S6 accurately identified olive tree canopies with precise boundary delineation.
In Part D, schemes S1–S5 achieved high extraction accuracy for dense olive canopies but exhibited notable omission errors for sparse canopies. In contrast, S6 and S7 demonstrated superior performance in extracting sparse canopy olive information.
A comprehensive analysis across the study area indicates that S7 delivers the best olive tree recognition performance, effectively distinguishing olive trees from other species while minimizing omission errors for sparse canopies and maintaining the lowest misclassification rate with other land cover types. Accuracy validation further confirms that S7 yields the highest values for OA (0.98), kappa (0.96), PA (0.95), and UA (0.92). Although S7 generally achieves high accuracy, its UA is the lowest among the metrics. These findings demonstrate the feasibility of the deep learning approach combining Lightness, NGBDI, and MGBVI spectral bands for olive tree information extraction.

3.3. Results of Olive Information Extraction Based on SVM and RF Models

The accuracy validation of olive tree information extraction results from the SVM and RF models was conducted. As shown in Table 5, the SVM model exhibited the lowest classification accuracy, with OA, kappa, PA, and UA values of 0.90, 0.79, 0.93, and 0.81, respectively. Figure 5 demonstrates that the SVM classification model displayed the most pronounced misclassification between olive trees and other land cover types. In comparison, the RF model showed slightly improved classification accuracy, with OA, kappa, PA, and UA values of 0.91, 0.81, 0.89, and 0.87, respectively. However, significant omission and commission errors remained. Additionally, both SVM and RF are pixel-based classification methods, which resulted in noticeable “salt-and-pepper” noise. In contrast, the S7 model demonstrated clear advantages over both RF and SVM, particularly in distinguishing olive trees from other tree species, with lower misclassification rates. Regarding extraction accuracy (Table 5), the OA of S7 improved by 7%–8% compared to RF and SVM, while the kappa coefficient increased by 15%–17%. Both PA and UA also showed significant improvements.

4. Discussion

Based on low-cost UAV-RGB imagery and ENVI-Net5 model specially designed for small sample datasets, a simple, efficient, and accurate method for extracting olive tree information from complex environments is proposed. The evaluation metrics, including OA, kappa, PA, and UA, achieved values of 0.98, 0.96, 0.95, and 0.92, respectively. These results demonstrate a significant improvement in OA, with an increase of 7% to 8%, and a marked enhancement in the kappa coefficient, which rose by 15% to 17%, when compared to the RF and SVM methods.

4.1. Low-Cost UAV-RGB Remote Sensing Technology for Fine-Scale Monitoring of Plantation Forests

In comparison with satellite remote sensing, UAV-RGB remote sensing technology is less susceptible to weather conditions, ensuring consistent data quality and acquisition continuity. It can capture high-resolution imagery even under cloudy conditions [10,11], allowing for a more accurate characterization of vegetation canopy information and offering enhanced flexibility in selecting appropriate spatial resolutions [2,12]. With its lower flight altitudes, UAV-RGB sensing can capture finer details of vegetation dynamics and has become widely recognized as a reliable and accurate tool for vegetation conservation and monitoring [2]. The cost of data acquisition using conventional UAV-RGB technology is significantly lower than that of drones equipped with specialized sensors, such as multispectral or radar systems. Moreover, the data are simpler and more suitable for large-scale information extraction. As automated interpretation techniques in UAV remote sensing continue to advance, UAV-RGB imagery, combined with improved algorithms, can facilitate the extraction of ground object information in complex scenarios, such as building information extraction [45], environmental resource monitoring, and disaster assessment. An increasing number of researchers are utilizing UAV-RGB imagery for vegetation monitoring, including applications such as citrus tree canopy extraction [46], wetland vegetation classification [35], and rubber tree biomass estimation [47]. Consequently, the development of low-cost and rapid information extraction methods for UAV-RGB imagery is emerging as a key trend in agricultural and forestry resource monitoring and management.

4.2. The Combination of Lightness, NGBDI, and MGBVI Based on UAV-RGB Can Distinguish Subtle Differences Between Olive Trees and Other Vegetation

Compared to using only the original RGB images as input, incorporating effective vegetation indices alongside RGB bands leads to better classification outcomes. For example, the extraction accuracy of olive trees using RGB bands combined with the EXG index is higher than that achieved with RGB bands alone (Table 4). This improvement is primarily attributed to the fact that vegetation indices, based on spectral characteristics, more effectively amplify the spectral differences between ground objects. Numerous studies on RGB-based UAV imagery applications have also shown that adding vegetation indices to enhance spectral variability among different ground objects plays a crucial role in improving classification accuracy [29]. In remote sensing image classification, RGB bands are commonly used as input data. However, the color and brightness of different ground objects in RGB bands often exhibit significant overlaps. Visual interpretation of the imagery reveals notable differences in brightness between olive trees and other tree species. By transforming the RGB bands into the HLS (Hue, Lightness, Saturation) color space, the Lightness component can be extracted, allowing for independent analysis of brightness variations among different ground objects. The results (Figure 5, Table 4) further indicate that replacing RGB with Lightness, when combined with vegetation indices, reduces data redundancy while improving olive tree extraction performance.

4.3. ENVI-Net5 Based on Optimal Band Feature Combinations for High-Accuracy Classification of Plantations Under Small-Sample Conditions

With the rapid expansion of remote sensing data and the increasing complexity of information in high spatial resolution imagery, there is a growing need for more efficient and automated algorithms. Currently, the primary algorithms for automated information extraction from remote sensing images include machine learning and deep learning approaches. Machine learning algorithms, however, have limited analytical capabilities [4], often exhibiting higher levels of confusion when processing complex scene images and being prone to the “salt-and-pepper” effect. Additionally, these algorithms typically require a large number of input features, which can lead to the “curse of dimensionality”. An excessive number of feature inputs results in high computational demands and redundancy, ultimately diminishing prediction accuracy [22].
In contrast, deep learning methods are capable of extracting complex, nonlinear features from massive high-dimensional datasets, offering higher accuracy, better generalization, and improved stability. Our research confirms that reducing the number of input feature layers, when sufficient identifying features are available, can mitigate this issue.
With the continuous progress of deep learning technology, methods such as FCN, U-Net, and DeepLab effectively address the limitations of CNN. However, these methods usually require a large amount of training data [25]. In this study, we successfully extracted olive tree information within the study area using only 1854 sample data points.
Programming-based Deep Learning (e.g., U-Net, DeepLab) relies primarily on open source deep learning frameworks (PyTorch, MATLAB) [48], requiring environment configuration and code writing. Although it provides a more flexible processing method in terms of parameters and model settings, this method is relatively complex and requires high programming level. Moreover, not all researchers are proficient in programming [9]. ENVI-Net5 model provides automatic feature extraction and user-friendly interactive process interface without any programming. From sample selection to model training, operation is simple and convenient [49]. In addition, compared with the Object-Based Image Analysis (OBIA) method commonly used for UAV imagery information extraction, deep learning has a better degree of automation and generalization capabilities [35]. The created label datasets and training models can be used repeatedly, reducing the workload and error caused by human participation [50,51].

5. Conclusions

This study introduces an automated and efficient model for the accurate extraction of olive trees by integrating high-resolution UAV-RGB imagery and the ENVI-Net5 deep learning model. UAV-imagery has advantages of low-cost, high-frequency data acquisition capabilities, and ENVI-Net5 has powerful feature learning and classification abilities, especially for small sample sizes and complex spatial patterns. The performance of the model was rigorously evaluated using standard classification metrics, including OA, the kappa coefficient, PA, and UA, which achieved values of 0.98, 0.96, 0.95, and 0.92, respectively. These high accuracy values demonstrate the model′s strong classification capability and its potential for operational use in precision agriculture and plantation management. Results demonstrate significant improvements of 7%–8% in OA and 15%–17% in the kappa coefficient compared to the RF and SVM methods.
The study underscores the effectiveness of combining spectral indices (Lightness, NGBDI, and MGBVI) to capture subtle spectral variations between olive trees and other vegetations, thereby reducing errors and achieving accurate classification. The ENVI-Net5 model enhances classification accuracy for olive trees, even with small sample sizes, although excessively low or high iteration counts can adversely impact performance. Therefore, selecting an optimal iteration count is crucial for maximizing model efficiency. This research establishes a technical and methodological framework for rapidly, effectively, and accurately extracting information on olive tree cultivation, providing robust data support for scientific planning in this field.
Future work should focus on expanding the model’s applicability through multitemporal analyses to capture seasonal variations in olive canopy dynamics, and integrating multispectral or hyperspectral data to enhance species differentiation. Evaluating the model’s transferability across regions and olive cultivars would improve its generalization. Incorporating 3D structural data from UAV-derived point clouds could further refine segmentation accuracy. Additionally, automated hyperparameter optimization and the development of lightweight, real-time deployable versions of ENVI-Net5 would enhance operational efficiency. Finally, adapting the framework to other crop types or plantation systems could broaden its impact in precision agriculture and resource monitoring.

Author Contributions

Conceptualization, W.K., Y.Z. (Yuqi Zhang) and L.W.; data curation, Y.Z. (Yuqi Zhang), L.W. and Y.Z. (Yuling Zhou); formal analysis, L.W. and Y.Z. (Yuqi Zhang); funding acquisition, W.K.; methodology, L.W.; resources, L.W.; software, Y.Z. (Yuqi Zhang) and L.W.; supervision, W.K.; validation, Y.Z. (Yuqi Zhang), Y.Z. (Yuling Zhou) and S.S.M.F.; visualization, L.W.; writing—original draft, Y.Z. (Yuqi Zhang) and L.W.; writing—review and editing, Y.Z. (Yuling Zhou), W.K. and S.S.M.F. All authors have read and agreed to the published version of the manuscript.

Funding

This research was funded by Yunnan Fundamental Research Projects (grant NO. 202301BD070001-160), Yunnan International Joint Laboratory of Natural Rubber Intelligent Monitor and Digital Applications (202403AP140001), the National Natural Science Foundation of China (32260391), Xingdian Talent Support Program, and Key Project of Yunnan Forestry Technological College grant number KY (ZD) 202302.

Data Availability Statement

The data presented in this study are available on request from the corresponding author.

Conflicts of Interest

The authors declare no conflicts of interest.

References

  1. Michalopoulos, G.; Kasapi, K.A.; Koubouris, G.; Psarras, G.; Arampatzis, G.; Hatzigiannakis, E.; Kavvadias, V.; Xiloyannis, C.; Montanaro, G.; Malliaraki, S.; et al. Adaptation of Mediterranean Olive Groves to Climate Change through Sustainable Cultivation Practices. Climate 2020, 8, 54. [Google Scholar] [CrossRef]
  2. Šiljeg, A.; Panđa, L.; Domazetović, F.; Marić, I.; Gašparović, M.; Borisov, M.; Milošević, R. Comparative Assessment of Pixel and Object-Based Approaches for Mapping of Olive Tree Crowns Based on UAV Multispectral Imagery. Remote Sens. 2022, 14, 757. [Google Scholar] [CrossRef]
  3. Gomez, J.A.; Amato, M.; Celano, G.; Koubouris, G.C. Organic olive orchards on sloping land: More than a specialty niche production system? J. Environ. Manag. 2008, 89, 99–109. [Google Scholar] [CrossRef]
  4. Ye, Z.; Wei, J.; Lin, Y.; Guo, Q.; Zhang, J.; Zhang, H.; Deng, H.; Yang, K. Extraction of Olive Crown Based on UAV Visible Images and the U2-Net Deep Learning Model. Remote Sens. 2022, 14, 1523. [Google Scholar] [CrossRef]
  5. Yang, K.; Zhang, H.; Wang, F.; Lai, R. Extraction of Broad-Leaved Tree Crown Based on UAV Visible Images and OBIA-RF Model: A Case Study for Chinese Olive Trees. Remote Sens. 2022, 14, 2469. [Google Scholar] [CrossRef]
  6. Kerr, J.T.; Ostrovsky, M. From space to species: Ecological applications for remote sensing. Trends Ecol. Evol. 2003, 18, 299–305. [Google Scholar] [CrossRef]
  7. Neigh, C.S.R.; Masek, J.G.; Nickeson, J.E. High-Resolution Satellite Data Open for Government Research. Eos Trans. Am. Geophys. Union 2013, 94, 121–123. [Google Scholar] [CrossRef]
  8. Afroditi, T.; Thomas, A.; Xanthoula, P.; Anastasia, L.; Javid, K.; Dimitris, K.; Georgios, K.; Dimitrios, M. Application of Multilayer Perceptron with Automatic Relevance Determination on Weed Mapping Using UAV Multispectral Imagery. Sensors 2017, 17, 2307. [Google Scholar] [CrossRef]
  9. Fetai, B.; Račič, M.; Lisec, A. Deep Learning for Detection of Visible Land Boundaries from UAV Imagery. Remote Sens. 2021, 13, 2077. [Google Scholar] [CrossRef]
  10. Wan, L.; Li, Y.; Cen, H.; Zhu, J.; Yin, W.; Wu, W.; Zhu, H.; Sun, D.; Zhou, W.; He, Y. Combining UAV-Based Vegetation Indices and Image Classification to Estimate Flower Number in Oilseed Rape. Remote Sens. 2018, 10, 1484. [Google Scholar] [CrossRef]
  11. Yuan, H.; Liu, Z.; Cai, Y.; Zhao, B. Research on Vegetation Information Extraction from Visible UAV Remote Sensing Images. In Proceedings of the 2018 Fifth International Workshop on Earth Observation and Remote Sensing Applications (EORSA), Xi’an, China, 18–20 June 2018. [Google Scholar]
  12. Ahmed, H. A Comparison Between UAV-RGB and ALOS-2 PALSAR-2 Images for the Assessment of Aboveground Biomass in a Temperate Forest. Master’s Thesis, University of Twente, Enschede, The Netherlands, 2021. [Google Scholar]
  13. Näsi, R.; Honkavaara, E.; Lyytikäinen-Saarenmaa, P.; Blomqvist, M.; Litkey, P.; Hakala, T.; Viljanen, N.; Kantola, T.; Tanhuanpää, T.; Holopainen, M. Using UAV-Based Photogrammetry and Hyperspectral Imaging for Mapping Bark Beetle Damage at Tree-Level. Remote Sens. 2015, 7, 15467–15493. [Google Scholar] [CrossRef]
  14. Cini, E.; Marzialetti, F.; Paterni, M.; Berton, A.; Acosta, A.T.R.; Ciccarelli, D. Integrating UAV imagery and machine learning via Geographic Object Based Image Analysis (GEOBIA) for enhanced monitoring of Yucca gloriosa in Mediterranean coastal dunes. Ocean Coast. Manag. 2024, 258, 107377. [Google Scholar] [CrossRef]
  15. Niu, Q.; Feng, H.; Li, C.; Yang, G.; Fu, Y.; Li, Z.; Pei, H. Estimation of Leaf Nitrogen Concentration of Winter Wheat Using UAV-Based RGB Imagery. In Proceedings of the 11th International Conference on Computer and Computing Technologies in Agriculture (CCTA), Jilin, China, 12–15 August 2017; Springer: Berlin/Heidelberg, Germany; pp. 139–153. [Google Scholar]
  16. Schirrmann, M.; Giebel, A.; Gleiniger, F.; Pflanz, M.; Lentschke, J.; Dammer, K.H. Monitoring Agronomic Parameters of Winter Wheat Crops with Low-Cost UAV Imagery. Remote Sens. 2016, 8, 706. [Google Scholar] [CrossRef]
  17. Niu, S.; Nie, Z.; Li, G.; Zhu, W. Multi-Altitude Corn Tassel Detection and Counting Based on UAV RGB Imagery and Deep Learning. Drones 2024, 8, 198. [Google Scholar] [CrossRef]
  18. Adão, T.; Hruška, J.; Pádua, L.; Bessa, J.; Peres, E.; Morais, R.; Sousa, J.J. Hyperspectral Imaging: A Review on UAV-Based Sensors, Data Processing and Applications for Agriculture and Forestry. Remote Sens. 2017, 9, 1110. [Google Scholar] [CrossRef]
  19. Aly, M.H. Fusion-Based Approaches and Machine Learning Algorithms for Forest Monitoring: A Systematic Review. Wild 2025, 2, 7. [Google Scholar] [CrossRef]
  20. Hafemann, L.G. Forest Species Recognition Using Deep Convolutional Neural Networks. In Proceedings of the 2014 22nd International Conference on Pattern Recognition, Stockholm, Sweden, 24–28 August 2014. [Google Scholar]
  21. Xiang, J.; Zang, Z.; Tang, X.; Zhang, M.; Cao, P.; Tang, S.; Wang, X. Rapid Forest Change Detection Using Unmanned Aerial Vehicles and Artificial Intelligence. Forests 2024, 15, 1676. [Google Scholar] [CrossRef]
  22. Yao, S.; Hao, Z.; Post, C.J.; Mikhailova, E.A.; Lin, L. Individual Tree Crown Detection and Classification of Live and Dead Trees Using a Mask Region-Based Convolutional Neural Network (Mask R-CNN). Forests 2024, 15, 1900. [Google Scholar] [CrossRef]
  23. Maryono, T.; Andrian, R.; Safe’I, R.; Nopriyanto, Z. Utilisation of convolutional neural network on deep learning in predicting digital image to tree damage type. Int. J. Internet Manuf. Serv. 2024, 10, 77–90. [Google Scholar]
  24. Freitas, P.; Vieira, G.; Canário, J.; Vincent, W.F.; Pina, P.; Mora, C. A trained Mask R-CNN model over PlanetScope imagery for very-high resolution surface water mapping in boreal forest-tundra. Remote Sens. Environ. 2024, 304, 114047. [Google Scholar] [CrossRef]
  25. Ma, H.; Zhao, W.; Li, F.; Yan, H.; Liu, Y. Study on Remote Sensing Image Classification of Oasis Area Based on ENVI Deep Learning. Pol. J. Environ. Stud. 2023, 32, 2231–2242. [Google Scholar] [CrossRef] [PubMed]
  26. Liu, L.-Y.; Wang, C.-K. Building segmentation in agricultural land using high resolution satellite imagery based on deep learning approach. Int. Arch. Photogramm. Remote Sens. Spat. Inf. Sci. 2021, 43, 587–594. [Google Scholar] [CrossRef]
  27. Lyu, X.; Du, W.; Zhang, H.; Ge, W.; Chen, Z.; Wang, S. Classification of Different Winter Wheat Cultivars on Hyperspectral UAV Imagery. Appl. Sci. 2024, 14, 250. [Google Scholar] [CrossRef]
  28. Zheng, L.; He, Z.; Ding, H. Research on the Sparse Plastic Shed Extraction from High Resolution Images Using ENVINet 5 Deep Learning Method. Remote Sens. Technol. Appl. 2021, 36, 908–915. (In Chinese) [Google Scholar]
  29. Zhang, C.; Kovacs, J.M. The application of small unmanned aerial systems for precision agriculture: A review. Precis. Agric. 2012, 13, 693–712. [Google Scholar] [CrossRef]
  30. Zhang, H.; Wang, Y.; Shang, J.; Liu, M.; Li, Q. Investigating the impact of classification features and classifiers on crop mapping performance in heterogeneous agricultural landscapes. Int. J. Appl. Earth Obs. Geoinf. 2021, 102, 102388. [Google Scholar] [CrossRef]
  31. Baret, F.; Guyot, G. Potentials and limits of vegetation indices for LAI and APAR assessment. Remote Sens. Environ. 1991, 35, 161–173. [Google Scholar] [CrossRef]
  32. Xue, J.; Su, B. Significant Remote Sensing Vegetation Indices: A Review of Developments and Applications. J. Sens. 2017, 2017, 1353691. [Google Scholar] [CrossRef]
  33. Bendig, J.; Yu, K.; Aasen, H.; Bolten, A.; Bennertz, S.; Broscheit, J.; Gnyp, M.L.; Bareth, G. Combining UAV-based plant height from crop surface models, visible, and near infrared vegetation indices for biomass monitoring in barley. Int. J. Appl. Earth Obs. Geoinf. 2015, 39, 79–87. [Google Scholar] [CrossRef]
  34. Wang, X.; Wang, M.; Wang, S.; Wu, Y. Extraction of vegetation information from visible unmanned aerial vehicle images. Nongye Gongcheng Xuebao/Trans. Chin. Soc. Agric. Eng. 2015, 31, 152–159. [Google Scholar]
  35. Zhou, R.; Yang, C.; Li, E.; Cai, X.; Yang, J.; Xia, Y. Object-Based Wetland Vegetation Classification Using Multi-Feature Selection of Unoccupied Aerial Vehicle RGB Imagery. Remote Sens. 2021, 13, 4910. [Google Scholar] [CrossRef]
  36. Wei, L.; Yang, H.; Niu, Y.; Zhang, Y.; Xu, L.; Chai, X. Wheat biomass, yield, and straw-grain ratio estimation from multi-temporal UAV-based RGB and multispectral images. Biosyst. Eng. 2023, 234, 19. [Google Scholar] [CrossRef]
  37. Morgan, G.R.; Wang, C.; Morris, J.T. RGB Indices and Canopy Height Modelling for Mapping Tidal Marsh Biomass from a Small Unmanned Aerial System. Remote Sens. 2021, 13, 3406. [Google Scholar] [CrossRef]
  38. Lu, J.; Eitel, J.U.; Engels, M.; Zhu, J.; Ma, Y.; Liao, F.; Zheng, H.; Wang, X.; Yao, X.; Cheng, T.; et al. Improving Unmanned Aerial Vehicle (UAV) remote sensing of rice plant potassium accumulation by fusing spectral and textural information. Int. J. Appl. Earth Obs. Geoinf. 2021, 104, 102592. [Google Scholar] [CrossRef]
  39. Abdollahnejad, A.; Panagiotidis, D. Tree Species Classification and Health Status Assessment for a Mixed Broadleaf-Conifer Forest with UAS Multispectral Imaging. Remote Sens. 2020, 12, 3722. [Google Scholar] [CrossRef]
  40. Shaar, F.; Yılmaz, A.; Topcu, A.E.; Alzoubi, Y.I. Remote Sensing Image Segmentation for Aircraft Recognition Using U-Net as Deep Learning Architecture. Appl. Sci. 2024, 14, 2639. [Google Scholar] [CrossRef]
  41. Goswami, M.; Mohanty, S.; Dey, S.; Mukherjee, A.; Pattnaik, P.K. Convolutional Neural Network Segmentation for Satellite Imagery Data to Identify Landforms Using U-Net Architecture. In Networks and Systems, Proceeding of the International Conference on Computational Intelligence in Pattern Recognition (CIPR), Baripada, India, 15–16 March 2024; Das, A.K., Nayak, J., Naik, B., Himabindu, M., Vimal, S., Pelusi, D., Eds.; Springer: Singapore, 2025. [Google Scholar]
  42. Singh, G.; Dahiya, N.; Sood, V.; Singh, S.; Sharma, A. ENVINet5 deep learning change detection framework for the estimation of agriculture variations during 2012–2023 with Landsat series data. Environ. Monit. Assess. 2024, 196, 233. [Google Scholar] [CrossRef]
  43. Cortes, C.; Vapnik, V. Support-vector networks. Mach. Learn. 1995, 20, 273–297. [Google Scholar] [CrossRef]
  44. Balha, A.; Mallick, J.; Pandey, S.; Gupta, S.; Singh, C.K. A comparative analysis of different pixel and object-based classification algorithms using multi-source high spatial resolution satellite data for LULC mapping. Earth Sci. Inform. 2021, 14, 2231–2247. [Google Scholar] [CrossRef]
  45. Zheng, S.; Wei, L.; Yu, H.; Kou, W. UAV Imagery-Based Classification Model for Atypical Traditional Village Landscapes and Their Spatial Distribution Pattern. Drones 2024, 8, 297. [Google Scholar] [CrossRef]
  46. Modica, G.; Messina, G.; De Luca, G.; Fiozzo, V.; Praticò, S. Monitoring the vegetation vigor in heterogeneous citrus and olive orchards. A multiscale object-based approach to extract trees’ crowns from UAV multispectral imagery. Comput. Electron. Agric. 2020, 175, 105500. [Google Scholar] [CrossRef]
  47. Liang, Y.; Kou, W.; Lai, H.; Wang, J.; Wang, Q.; Xu, W.; Wang, H.; Lu, N. Improved estimation of aboveground biomass in rubber plantations by fusing spectral and textural information from UAV-based RGB imagery. Ecol. Indic. 2022, 142, 109286. [Google Scholar] [CrossRef]
  48. Chiu, W.T.; Lin, C.H.; Jhu, C.L.; Lin, C.; Chen, Y.C.; Huang, M.J.; Liu, W.M. Semantic Segmentation of Lotus Leaves in UAV Aerial Images via U-Net and DeepLab-based Networks. In Proceedings of the 2020 International Computer Symposium (ICS), Tainan, Taiwan, 17–19 December 2020. [Google Scholar]
  49. Huangfu, W.; Qiu, H.; Cui, P.; Yang, D.; Liu, Y.; Ullah, M.; Kamp, U. Automated extraction of mining-induced ground fissures using deep learning and object-based image classification. Earth Surf. Process. Landf. 2024, 49, 2189–2204. [Google Scholar] [CrossRef]
  50. Li, Q.; Yue, Y.; Liu, S.; Brandt, M.; Chen, Z.; Tong, X.; Wang, K.; Chang, J.; Fensholt, R. Beyond tree cover: Characterizing southern China’s forests using deep learning. Remote Sens. Ecol. Conserv. 2023, 9, 17–32. [Google Scholar] [CrossRef]
  51. Deng, Z.; Wang, T.; Zhao, X.; Zhou, Z.; Dong, J.; Niu, J. Extracting Spatial Distribution Information of Alfalfa Artificial Grassland Based on Deep Learning Method. Chin. J. Grassl. 2023, 45, 22–33. (In Chinese) [Google Scholar]
Figure 1. Methodological flowchart.
Forests 16 00924 g001
Figure 2. Location map of the study area. (A) Geographic location of the study area, (B) UAV-derived RGB orthophoto of the study area, (C) enlarged view of olive plantation captured by UAV, and (D) field photograph of olive cultivation.
Forests 16 00924 g002
Figure 3. Results of olive information extraction under different iteration counts.
Forests 16 00924 g003
Figure 4. Extraction results of olive trees using seven deep learning classification schemes. (A-Part) represents high-density olive cultivation areas within the study region, (B-Part) denotes mixed planting zones of olive trees with other tree species, (C-Part) indicates low-density olive planting areas, and (D-Part) shows mixed cultivation regions with olive trees exhibiting varying canopy growth vigor. S1–S7 correspond to seven classification schemes combining deep learning with different band combinations.
Forests 16 00924 g004
Figure 5. Comparison of olive tree information extraction results between the S7 deep learning model and RF/SVM learning models.
Forests 16 00924 g005
Table 1. Vegetation indices derived from RGB imagery ( ρ r ,   ρ g , and   ρ b represent the DN value of red, green, and blue bands, respectively).
VI.NameFormulaReference
MGBVIModified green-blue vegetation index ρ g 2 ρ b 2 ρ g 2 + ρ b 2 [27]
EXGExcess Green Vegetation Index 2 × ρ g ρ r   ρ b [18]
NGBDINormalized green-blue difference index ρ g   ρ b ρ g +   ρ b [18]
Table 2. Seven band combination schemes.
SchemeCombinationsImage Layers
S1RGB3
S2RGB + EXG4
S3RGB + NGBDI4
S4RGB + MGBVI4
S5RGB + Lightness4
S6Lightness + EXG + NGBDI3
S7Lightness + MGBVI + NGBDI3
Table 3. Accuracy of olive information extraction under different iteration counts.
Accuracy Evaluation IndexesNumber of Epoches
30405060
OA0.720.920.780.88
Kappa0.610.820.460.74
PA0.250.890.970.77
UA0.860.870.760.88
Table 4. Accuracy of olive information extraction under different schemes.
Accuracy Evaluation IndexesScheme
S1S2S3S4S5S6S7
OA0.920.930.880.900.920.930.98
Kappa0.820.840.740.780.820.860.96
PA0.890.900.700.710.790.980.95
UA0.870.900.900.910.890.850.92
Table 5. Comparison of olive extraction accuracy between the S7 deep learning model and RF/SVM learning models.
Accuracy Evaluation IndexesS7RFSVM
OA0.980.910.90
Kappe0.960.810.79
PA0.950.890.93
UA0.920.870.81
Disclaimer/Publisher’s Note: The statements, opinions and data contained in all publications are solely those of the individual author(s) and contributor(s) and not of MDPI and/or the editor(s). MDPI and/or the editor(s) disclaim responsibility for any injury to people or property resulting from any ideas, methods, instructions or products referred to in the content.

