Article

Comprehensive Transcriptome and Physiological Analysis Reveal the Effects of Cyrtotrachelus buqueti Guer on Carbohydrates in Dendrocalamus brandisii Kurz.

1
Biological Research and Utilization Innovation Team in Bamboo Resources of Yunnan Province, Southwest Forestry University, Kunming 650224, China
2
Forest Resources Exploitation and Utilization Engineering Research Center for Grand Health of Yunnan Provincial Universities, Southwest Forestry University, Kunming 650224, China
3
Research Innovation Team for Plateau Plant Protection and Utilization, Southwest Forestry University, Kunming 650224, China
*
Author to whom correspondence should be addressed.
Forests 2025, 16(6), 1020; https://doi.org/10.3390/f16061020
Submission received: 13 May 2025 / Revised: 13 June 2025 / Accepted: 14 June 2025 / Published: 18 June 2025
(This article belongs to the Section Genetics and Molecular Biology)

Abstract

The bamboo shoots of Dendrocalamus brandisii Kurz. are a type of nutritious and delicious vegetable. However, their quality is vulnerable to mechanical damage and pest infestation, which reduces their economic benefits. In order to study the effects of mechanical damage and pest infestation on the quality of bamboo shoots, the changes in the contents of carbohydrates, water, amino acids, proteins, total phenols, and lignin in bamboo shoots after mechanical damage and insect feeding were assessed through transcriptomics combined with physiology; additionally, these changes were analyzed and compared to the gene expression and physiological changes in bamboo shoots under different treatments. The results show that both mechanical damage and insect feeding can lead to an increase in the contents of starch, cellulose, hemicellulose, lignin, amino acids, and proteins, as well as a decrease in the contents of water, soluble sugars, and total phenols. Moreover, the changes in the insect feeding group were particularly significant. In addition, through transcriptomic analysis of bamboo shoots after mechanical damage plus insect feeding at 3, 6, 12, and 24 h, 1698, 29,786, 18,853, and 10,544 differentially expressed genes were screened out, respectively. Combined with physiological indexes, the GO and KEGG enrichment analyses revealed that a large number of differentially expressed genes were found in the sucrose and starch metabolism pathways, which might be related to the carbohydrate accumulation in bamboo shoots, suggesting that the impact of insect feeding on the quality of bamboo shoots is greater than that of mechanical damage. This study provides a reference for carbohydrate accumulation in D. brandisii Kurz. bamboo shoots and the impact of Cyrtotrachelus buqueti Guer feeding on their quality, as well as offering some ideas for improving the quality of bamboo shoots.

1. Introduction

Bamboo is a monocotyledonous perennial evergreen plant of the Poaceae family with important ecological and economic values. Worldwide, there are 88 genera and 1642 species of bamboo; of these, 39 genera and 857 species are distributed in China [1,2]. Bamboo shoots are traditional forest vegetables that are rich in dietary fiber, protein, amino acids, vitamins, minerals, and a large number of antioxidant components [3]. Carbohydrates are one of the main flavor substances in bamboo shoots, endowing them with a delicious taste [4]. D. brandisii Kurz., also known as sweet bamboo or Yunnan sweet bamboo, is widely distributed in Yunnan Province, China. It belongs to the Dendrocalamus genus of the Bambusoideae subfamily. It is a large and excellent clumping bamboo species that is often involved in shoot production, whereby the fresh shoots have an excellent quality. Additionally, Yunnan Province is focusing on developing this particular bamboo species for shoot production [5]. Furthermore, D. brandisii Kurz. is widely used in industries such as agriculture and construction, and it has good economic, medicinal, and environmental values [6]. Many researchers are currently conducting studies on the development and utilization of D. brandisii Kurz., and the planting area of bamboo forests is increasing from year to year [7]. With the large-scale promotion of D. brandisii Kurz. in many regions, the insect pests in bamboo forests are becoming more severe year on year. However, there is still no relevant report on the impact of pests on the quality of the bamboo shoots of D. brandisii Kurz.
Cyrtotrachelus buqueti Guer, also known as the bamboo transverse cone weevil, is a major boring pest of clumping bamboo in China [8]. It is mainly distributed in regions south of the Yangtze River in China, as well as in Southeast Asian countries such as Vietnam, Myanmar, and Thailand [9]. C. buqueti has a wide range of hosts. Its larvae bore into and damage the bamboo shoots of 28 bamboo species, such as those in the Bambusa, Dendrocalamopsis, and Dendrocalamus genera. In particular, the larvae prefer to bore into the shoots of clumping bamboo, often causing devastating losses [10]. The order of the digestive enzyme activities of the larvae of C. buqueti is as follows: hemicellulase > pectinase > cellulase > amylase > sucrase > lipase > protease [11]. Therefore, to a certain extent, the distribution of the types of digestive physiological enzymes reflects the correlation between the feeding habits and foraging behaviors of C. buqueti.
After fruits and vegetables have been mechanically damaged, microorganisms can easily invade the damaged parts and multiply in large numbers, accelerating their spoilage and affecting their edible value and economic benefits [12]. When plants are fed on by insects, their nutrients, physiological and biochemical processes, growth and development, and related genes, as well as the volatile substances, signaling molecules, and pathways within them, will all undergo changes [13]. At present, research investigating the quality and physiology of bamboo shoots mainly focuses on the storage stage after the bamboo shoots are picked [14,15], and there is relatively little research exploring the quality and physiological changes caused by mechanical damage and insect feeding.
The growth and development process of bamboo plants is closely related to the storage and consumption activities of the non-structural carbohydrates (NSCs) [16]. NSCs encompass soluble sugars and starch [17], and carbohydrates are considered to be participants in a complex communication system, which is necessary for coordinating metabolism with growth, development, and responses to environmental changes and stresses [18]. In higher plants, starch is synthesized in the plastids of photosynthetic and non-photosynthetic cells. As the main storage carbohydrate, starch plays an important role in the life cycle of plants [19]. Soluble sugars are not only the main components determining the sweetness of bamboo shoots but are also important nutrients for the human body [20]. Cellulose and hemicellulose are polysaccharides that make up the cell walls of bamboo shoots and are also the main components of the cell walls. The levels of their content determine the tender, fresh, and crispy taste of bamboo shoots [20,21]. Lignin crosslinks with substances such as cellulose and hemicellulose, increasing tissue strength in order to resist the invasion of pathogens and enhance the plant’s resistance to biotic and abiotic stresses. The water content in bamboo shoots directly affects their taste and quality. The higher the water content, the more tender the bamboo shoots and the better the taste [22]. Amino acids play a crucial role as nitrogen metabolites in plants. As the basic building blocks of proteins, they play a fundamental role in physiological processes such as the growth and development of plants. When plants are under stress, the content of free amino acids in plant tissues will change accordingly in order to enhance the resistance of plants to environmental changes [23]. In the face of environmental changes such as salinity, temperature differences, insect feeding, and nutritional imbalances, plant tissues will adopt the strategy of increasing their content of free amino acids to regulate nitrogen metabolism so as to better adapt to the environment [24]. Studies have found that up to 18 types of amino acids have been detected in shoots of square bamboo, water bamboo, large-headed bamboo, latiflorus, and sweet bamboo. Among them, they are also rich in eight essential amino acids that are indispensable for maintaining the normal physiological functions of the human body [25]. Bamboo shoots are rich in protein; in every 100 g of fresh bamboo shoots, the protein content ranges from 1.49 to 4.04 g. Eating bamboo shoots can effectively supplement protein for the human body, meeting daily protein requirements [4].
Transcriptomics and physiology are widely applied in the research of gene expression and physiological development [26]. These methods provide a large number of key genes and physiological changes for the study of plant development. When researching the impact of mechanical damage and insect pests on the sugar metabolism of bamboo shoots, it is necessary to know the expression of key genes and physiological changes. Currently, research on bamboo shoots mainly focuses on nutritional components and values, with very little research being conducted on mechanical damage and insect pests. In order to study the response of carbohydrates in D. brandisii shoots to mechanical damage and the insect pest C.buqueti, this study used a transcriptomics process combined with physiology, providing a reference for improving the quality of D. brandisii Kurz. bamboo shoots and for research into the insect resistance of bamboo shoots.

2. Materials and Methods

2.1. Materials

The D. brandisii used in this experiment was sourced from bamboo shoots in Yangjiazhai, Yixiang Town, Simao District, Pu’er City, Yunnan Province (101°12′67″ E, 22°74′97″ N; altitude 1216 m). The climate in this area is mild, and there is abundant rainfall. The average altitude is 1470 m, and the annual average temperature is 17 °C, while the annual rainfall reaches 1800 mm. The soil is lateritic red soil with a weakly acidic pH, and it is rich in minerals and organic matter. In this experiment, well-grown bamboo shoots with a height of about 80 cm were selected. The bamboo shoots of D. brandisii, sourced from Simao, Pu’er City, Yunnan Province, have a low crude fiber content (0.63%), a high total sugar content (1.54%), and a low tannin content (0.08 mg/100 g); therefore, these bamboo shoot samples have the best taste. Simao and Longchuan, as the provenance areas of D. brandisii Kurz., are superior to Cangyuan and Shiping and are more suitable for large-scale cultivation [27].
The third-instar larvae of C. buqueti have a higher food intake and cause more damage to bamboo shoots. It takes about three days for the third-instar larvae of C. buqueti to develop into fourth-instar larvae. The third-instar larvae of C. buqueti have a much faster increase in food intake compared to the first- and second-instar larvae, thus causing greater levels of damage to bamboo shoots. It takes approximately two to four days for the third-instar larvae to develop into fourth-instar larvae. Therefore, we measured the samples of bamboo shoots after they had been fed on by the insects for 3, 6, 12, and 24 h. Fourth- and fifth-instar larvae cause excessive damage to bamboo shoots, and most of the bamboo shoots lose their edible value at this stage. Third-instar larvae of C. buqueti were collected from the bamboo forests of D. brandisii.

2.2. Treatment and Sampling of Materials

Treatment of test insects: Healthy third-instar larvae of C. buqueti were starved for 24 h before the experiment.
Treatment of experimental group: A small knife was used to dig holes (which were effectively the same size) in the bamboo shoot; a starved third-instar larva of C. buqueti was placed into the hole, which was covered with a gauze net.
Treatment of the control group: A small knife was used to dig holes at the same height as those in the experimental group in the bamboo shoot; these were covered with a gauze net.
Both the experimental group and the control group treatments were repeated three times. The C. buqueti larvae were removed at 3, 6, 12, and 24 h after feeding, respectively. We excised cubic blocks (1 cm3) from the feeding sites (at the same height) of the bamboo shoots. Similarly, we took 1 cm3 blocks from the same height of control bamboo shoots that were not fed upon. The samples were immediately frozen in liquid nitrogen and stored at −80 °C.

2.3. Methods for Determining Physiological Indicators

Determination of water content: First, the samples were blanched at 130 °C for 30 min; then, they were dried in an oven at 70 °C until a constant weight was achieved before final weighing [28]. The phenol–sulfuric acid colorimetric method was used to determine the contents of soluble sugar and starch [28]. The contents of hemicellulose and lignin were determined using kits (product numbers: BC4440, BC4200) from Suzhou Keming Biotechnology Co., Ltd., Bio-Nano Park, Suzhou Industrial Park, China. The determination of cellulose was carried out using the Cellulose Content Detection Kit (product number: BC4280) from Solarbio, Tongzhou District, Beijing, China. We determined the protein content with the Bicinchoninic Acid (BCA) Protein Content Detection Kit (product number: CW0014S) from Conwin Reagent, Taizhou Pharmaceutical High—tech Zone, China. We determined the amino acids using the Amino Acid Content Detection Kit (product number: BC15070) from Solarbio, Tongzhou District, Beijing, China.

2.4. Transcriptome Data Sequencing

Following sample collection, RNA-seq analysis was conducted. MRNA profiles were generated using the Illumina NovaSeq6000 (Illumina, San Diego, CA, USA) platform with the PE150 sequencing strategy. Total RNA was extracted from the bamboo shoots using the Omega plant RNA kit (Omega Bio-Tek, Norcross, GA, USA) method for three biological replicates. The RNA concentration and purity (OD260/280 and OD260/230 ratios) were measured using a nanophotometer. The Qubit 2.0 fluorometer was used to accurately quantify the RNA concentration; then, the Agilent 2100 bioanalyzer (Agilent, CA, USA) was used to precisely detect the RNA integrity. Fastp (v0.18.0) was used to remove reads containing adapters, >10% unknown nucleotides (N), or >50% low-quality bases (Q-value ≤ 20), generating clean reads. Clean reads were mapped to an rRNA database using Bowtie2 (v2.2.8), and rRNA-mapped reads were discarded to retain mRNA sequences. Paired-end clean reads were mapped to the reference genome using HISAT2 (v2.1.0) with default parameters, after building genome indices. Transcripts were assembled by StringTie (v1.3.1), and gene expression was quantified by RSEM (RNA-Seq by Expectation-Maximization) using FPKM (Fragments Per Kilobase of transcript per Million mapped reads). DEGs between groups were identified using DESeq2 (for two groups) or edgeR (for two samples), with thresholds: FDR < 0.05 and |log2FC| ≥ 1 (fold change ≥ 2). DEGs were mapped to the Gene Ontology (GO) database, and significantly enriched GO terms (molecular function, cellular component, biological process) were identified via hypergeometric test (FDR ≤ 0.05). DEGs were analyzed for enrichment in metabolic/signal transduction pathways using the KEGG database, with the same statistical method as GO analysis. The reference genome selected is that of D. brandisii, and the URL is https://figshare.com/articles/dataset/_b_High-heterozygosity_chromosomal-level_genome_of_b_b_i_D_brandisii_i_b_/24455197 (accessed on 13 June 2025).

2.5. Validation Using Real-Time Fluorescent Quantitative PCR

Real-time fluorescent quantitative PCR was used to analyze the samples. Each reaction was repeated three times following the procedure described in a previous report, with the ACT3 (DhB05G001460) sequence serving as the endogenous control. The CT values obtained from real-time fluorescent quantitative PCR were analyzed using the 2−ΔCT method to calculate the relative fold-change values. The primers for real-time fluorescent quantitative PCR are shown in Table S1.

2.6. Data Processing

All experiments were carried out in three replicates, and the average value was taken. The average value of three replicates of each sample was expressed as the mean ± standard deviation (SD).
The independent-samples t-test was carried out using IBM SPSS Statistics 23 to analyze the significance of the differences between groups. A p-value less than 0.05 indicated a significant difference, and a p-value less than 0.01 indicated an extremely significant difference. Origin 2021 and GraphPad Prism 8 were used to draw graphs, and the letters “a, b, c, and d” were used to represent the differences between them. All experimental data were analyzed using Excel 2019, and heat maps were drawn using TBtools 1.6. The correlation heatmap was plotted using the LC-Biotech Cloud Platform ((https://www.omicstudio.cn/tool/59) accessed on 13 June 2025).

3. Results

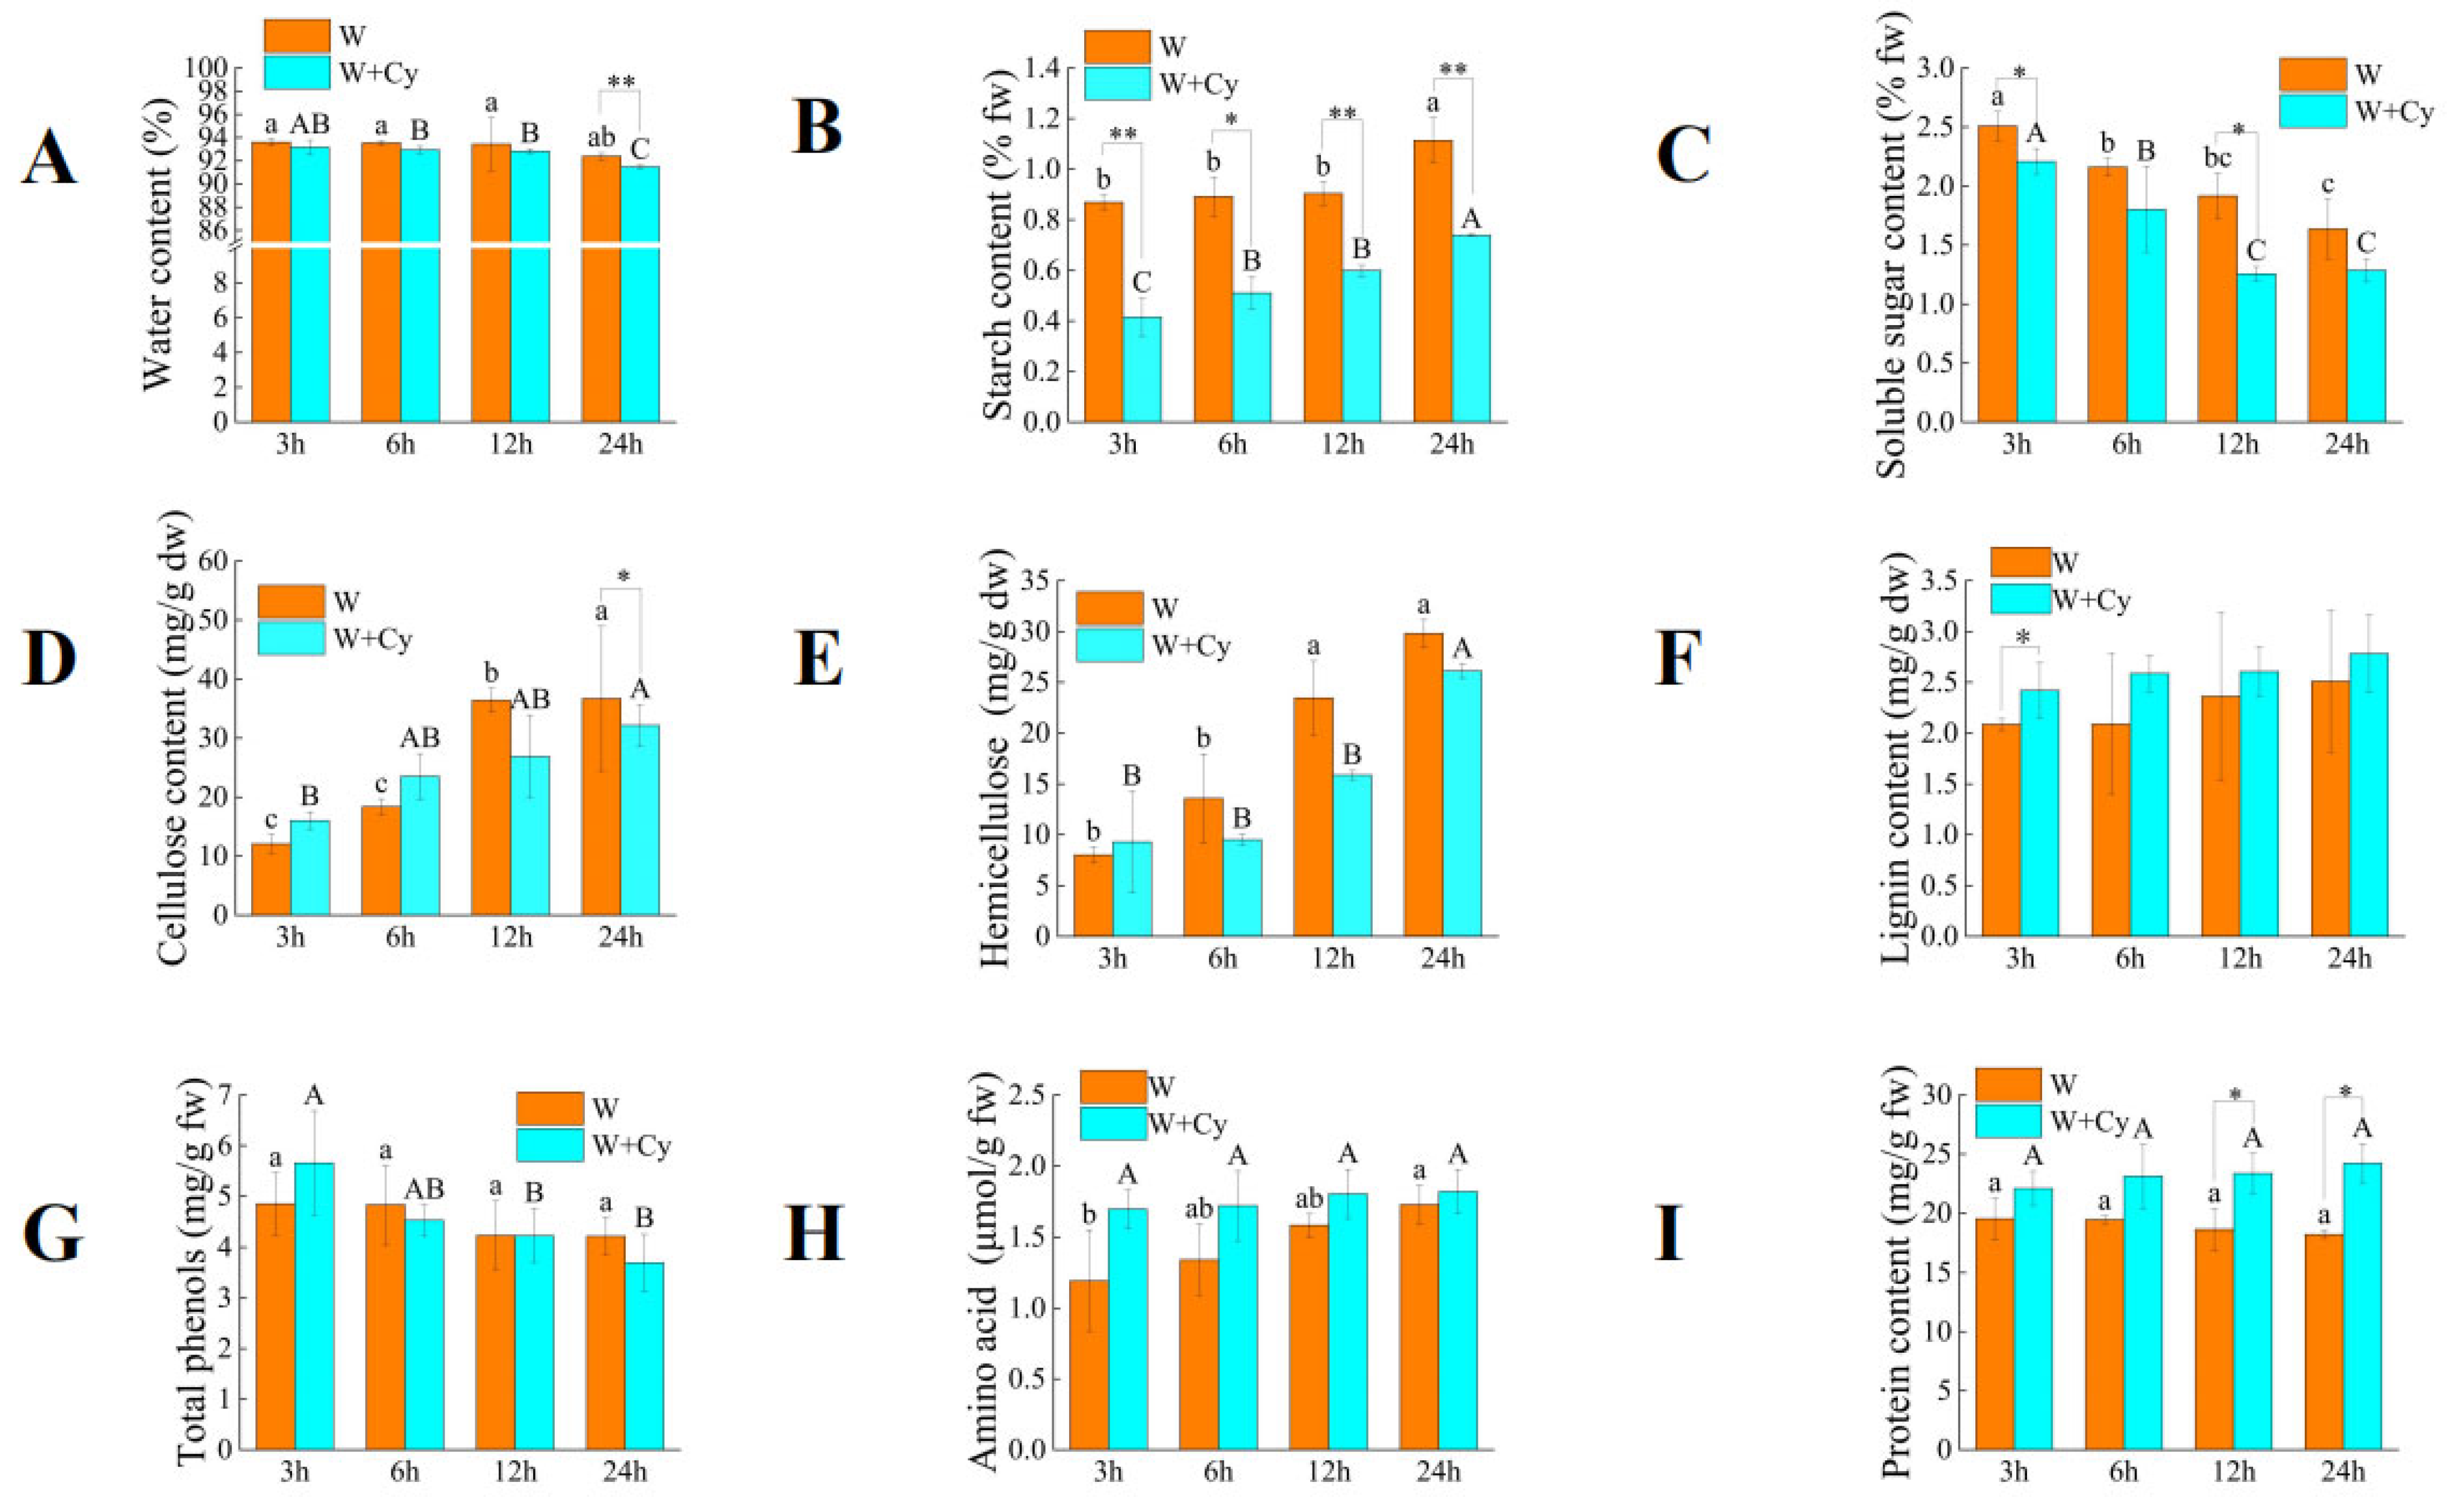
Both the mechanical damage treatment (W) and the insect feeding treatment (W+Cy) can cause changes in the contents of substances such as starch in the bamboo shoots. We collected the bamboo shoot samples after being treated for different durations (3, 6, 12, and 24 h) and analyzed the changes in physiological parameters such as carbohydrates (Figure 1).

3.1. Changes in Physiological Indices of Bamboo Shoots After Treatment with W and W+Cy

As shown in Figure 1, both W and W+Cy led to a decrease in the water content of bamboo shoots. The water content of Group W fluctuated within a small range with no significant difference, indicating that the W treatment had a limited impact on the water content of bamboo shoots. The water content of Group W+Cy showed no significant difference at 3 h, 6 h, and 12 h but was lower than that of Group W. The water contents (%) of Group W and Group W+Cy were 92.39 and 91.47, respectively, at 24 h, with extremely significant differences being observed between the two groups. This suggests that insect feeding led to a more obvious decrease in the water content of bamboo shoots. Both W and W+Cy treatments caused the starch content (percentage, fw) in bamboo shoots to show an increasing trend at 3, 6, 12, and 24 h. The starch content in the W+Cy group was significantly lower than that in the W group, with the largest difference being observed at 3 h, whereby the W+Cy group was 52.2% lower than the W group. This indicates that the insect feeding treatment had a strong impact on plant starch metabolism and inhibited starch accumulation. The amylase in the digestive tract of C. buqueti may be the cause of this change.
The trends in soluble sugar content after W and W+Cy treatments were opposite to those of starch. The soluble sugar content (percentage, fw) in bamboo shoots showed a downward trend at 3, 6, 12, and 24 h, with the soluble sugar content in the W+Cy group decreasing rapidly in the early stage and reaching a relatively stable level at 12 and 24 h. The soluble sugar content in the W+Cy group was lower than that in the W group, with significant differences being observed at 3 and 12 h. The largest difference occurred at 3 h, where the W+Cy group was 23.17% lower than the W group. Both mechanical damage and insect feeding could cause changes in the soluble sugar content of bamboo shoots, with insect feeding leading to a lower soluble sugar content. The presence of sucrase in the digestive tract of C. buqueti may be the reason for the lower soluble sugar content in the W+Cy group compared to the W group.
Both W and W+Cy treatments caused an increase in the cellulose content (mg/g dw) of bamboo shoots. The cellulose content in the W group was lower than that in the W+Cy group at 3 and 6 h but was higher than that in the W+Cy group at 12 and 24 h. There was a significant difference in cellulose content between the W group and the W+Cy group at 24 h, where the W+Cy group was 12.39% lower than the W group. The cellulase in the digestive tract of C. buqueti may be the cause of this interesting change.
The changing trend of hemicellulose content (mg/g dw) in bamboo shoots was similar to that of cellulose. Both the W and W+Cy treatments caused an increase in the hemicellulose content (mg/g dw) of bamboo shoots. The hemicellulose content in the W group was lower than that in the W+Cy group at 3 h but was higher than that in the W+Cy group at 6, 12, and 24 h. The hemicellulase in the digestive tract of C. buqueti may be the cause of this interesting change. The activity of hemicellulase in C. buqueti is higher than that of cellulase, which may be the reason for the difference in data between the two groups at 6 h.
The lignin content (mg/g dw) in both the W group and the W+Cy group showed an overall upward trend, indicating that the lignin continued to accumulate over time. The lignin content in the W+Cy group was 10.76% higher than that in the W group at 24 h, suggesting that the W+Cy treatment promoted more lignin accumulation.
The W treatment had no significant effect on the change in total phenol content (mg/g fw). The total phenol content in the W+Cy group was significantly higher at 3 h than at 12 h and 24 h. The W+Cy treatment could increase the total phenol content of plants in the early stage, enhancing the stress resistance of plants. However, an excessively high total phenol content would have adverse effects on bamboo shoots. The decrease in the total phenol content at the later stage might be due to self-metabolism.
Both the W and W+Cy treatments led to an increase in amino acid content (μmol/gL, fw), with the W+Cy group being consistently higher than the W group. The largest difference between W+Cy and W groups occurred at 3 h, where the W+Cy group was 42.16% higher than the W group. When bamboo shoots are subjected to insect feeding, they synthesize various defensive substances, whose production requires amino acids as raw materials. This may explain why the amino acid content in the W+Cy group was higher than that in the W group.
The W and W+Cy treatments caused opposing trends in protein content—the protein content in the W group continuously decreased, while that in the W+Cy group continuously increased. There were significant differences between the two groups at 12 and 24 h, with the W+Cy group being 32.86% higher than the W group at 24 h. This difference may be attributed to insect feeding inducing the synthesis of stress-related proteins in bamboo shoots in order to resist stress.
In summary, the water, soluble sugar, and starch contents in the W+Cy group were lower than those in the W group. The cellulose and hemicellulose contents in the W+Cy group were lower than those in the W group at certain time points. The lignin, amino acid, and protein contents in the W+Cy group were higher than those in the W group, while the total phenol content in the W+Cy group was higher than that in the W group at certain time points.

3.2. Transcriptome Data Analysis

In order to understand the gene expression and molecular basis of 
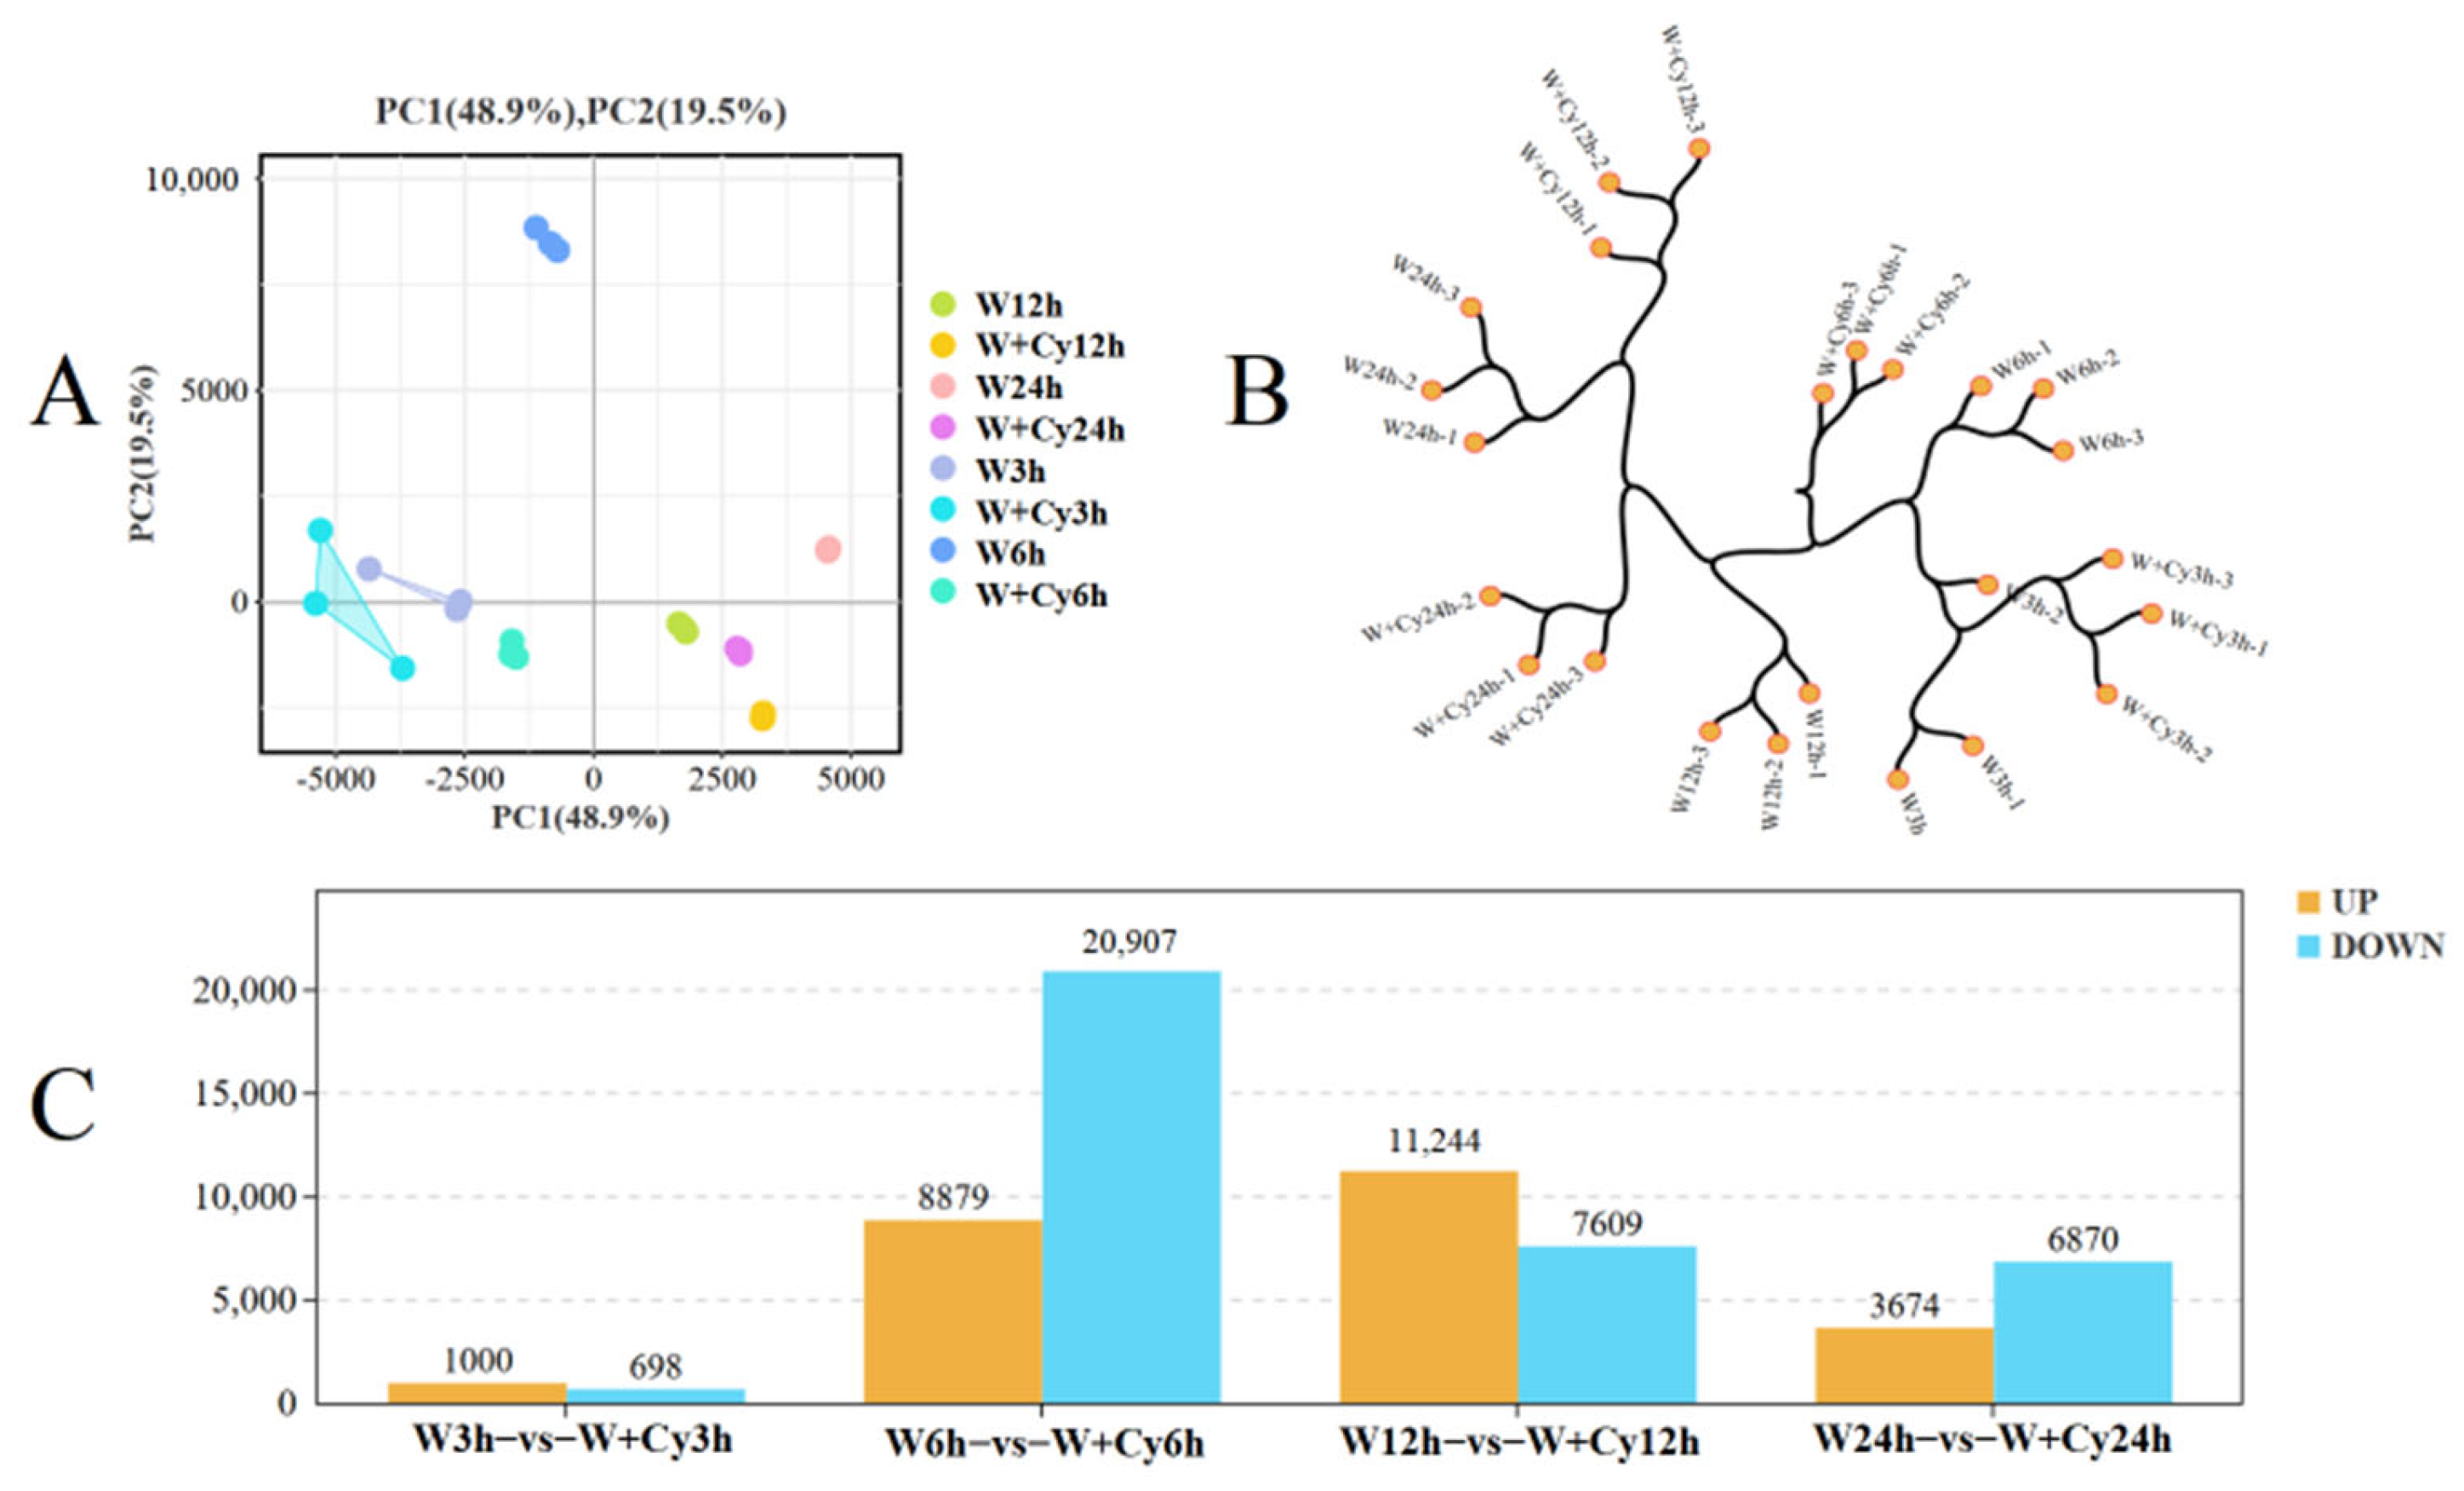
D. brandisii Kurz. bamboo shoots under W and W+Cy treatments, transcriptome sequencing and analysis were carried out. Three biological replicates were conducted for D. brandisii Kurz. bamboo shoots under the W and W+Cy treatments, and high-quality clean data were obtained for all. More than 99% of the clean reads were mapped to the reference genes in the bamboo shoots. The PCA plot (Figure 2A) shows that the samples within the group have good repeatability, and there are significant differences between groups. The cluster dendrogram (Figure 2B) indicates that the samples have good repeatability and there are no outlier samples. Inter-group differential analysis and screening were performed on bamboo shoots under the W and W+Cy treatments at 3, 6, 12, and 24 h (
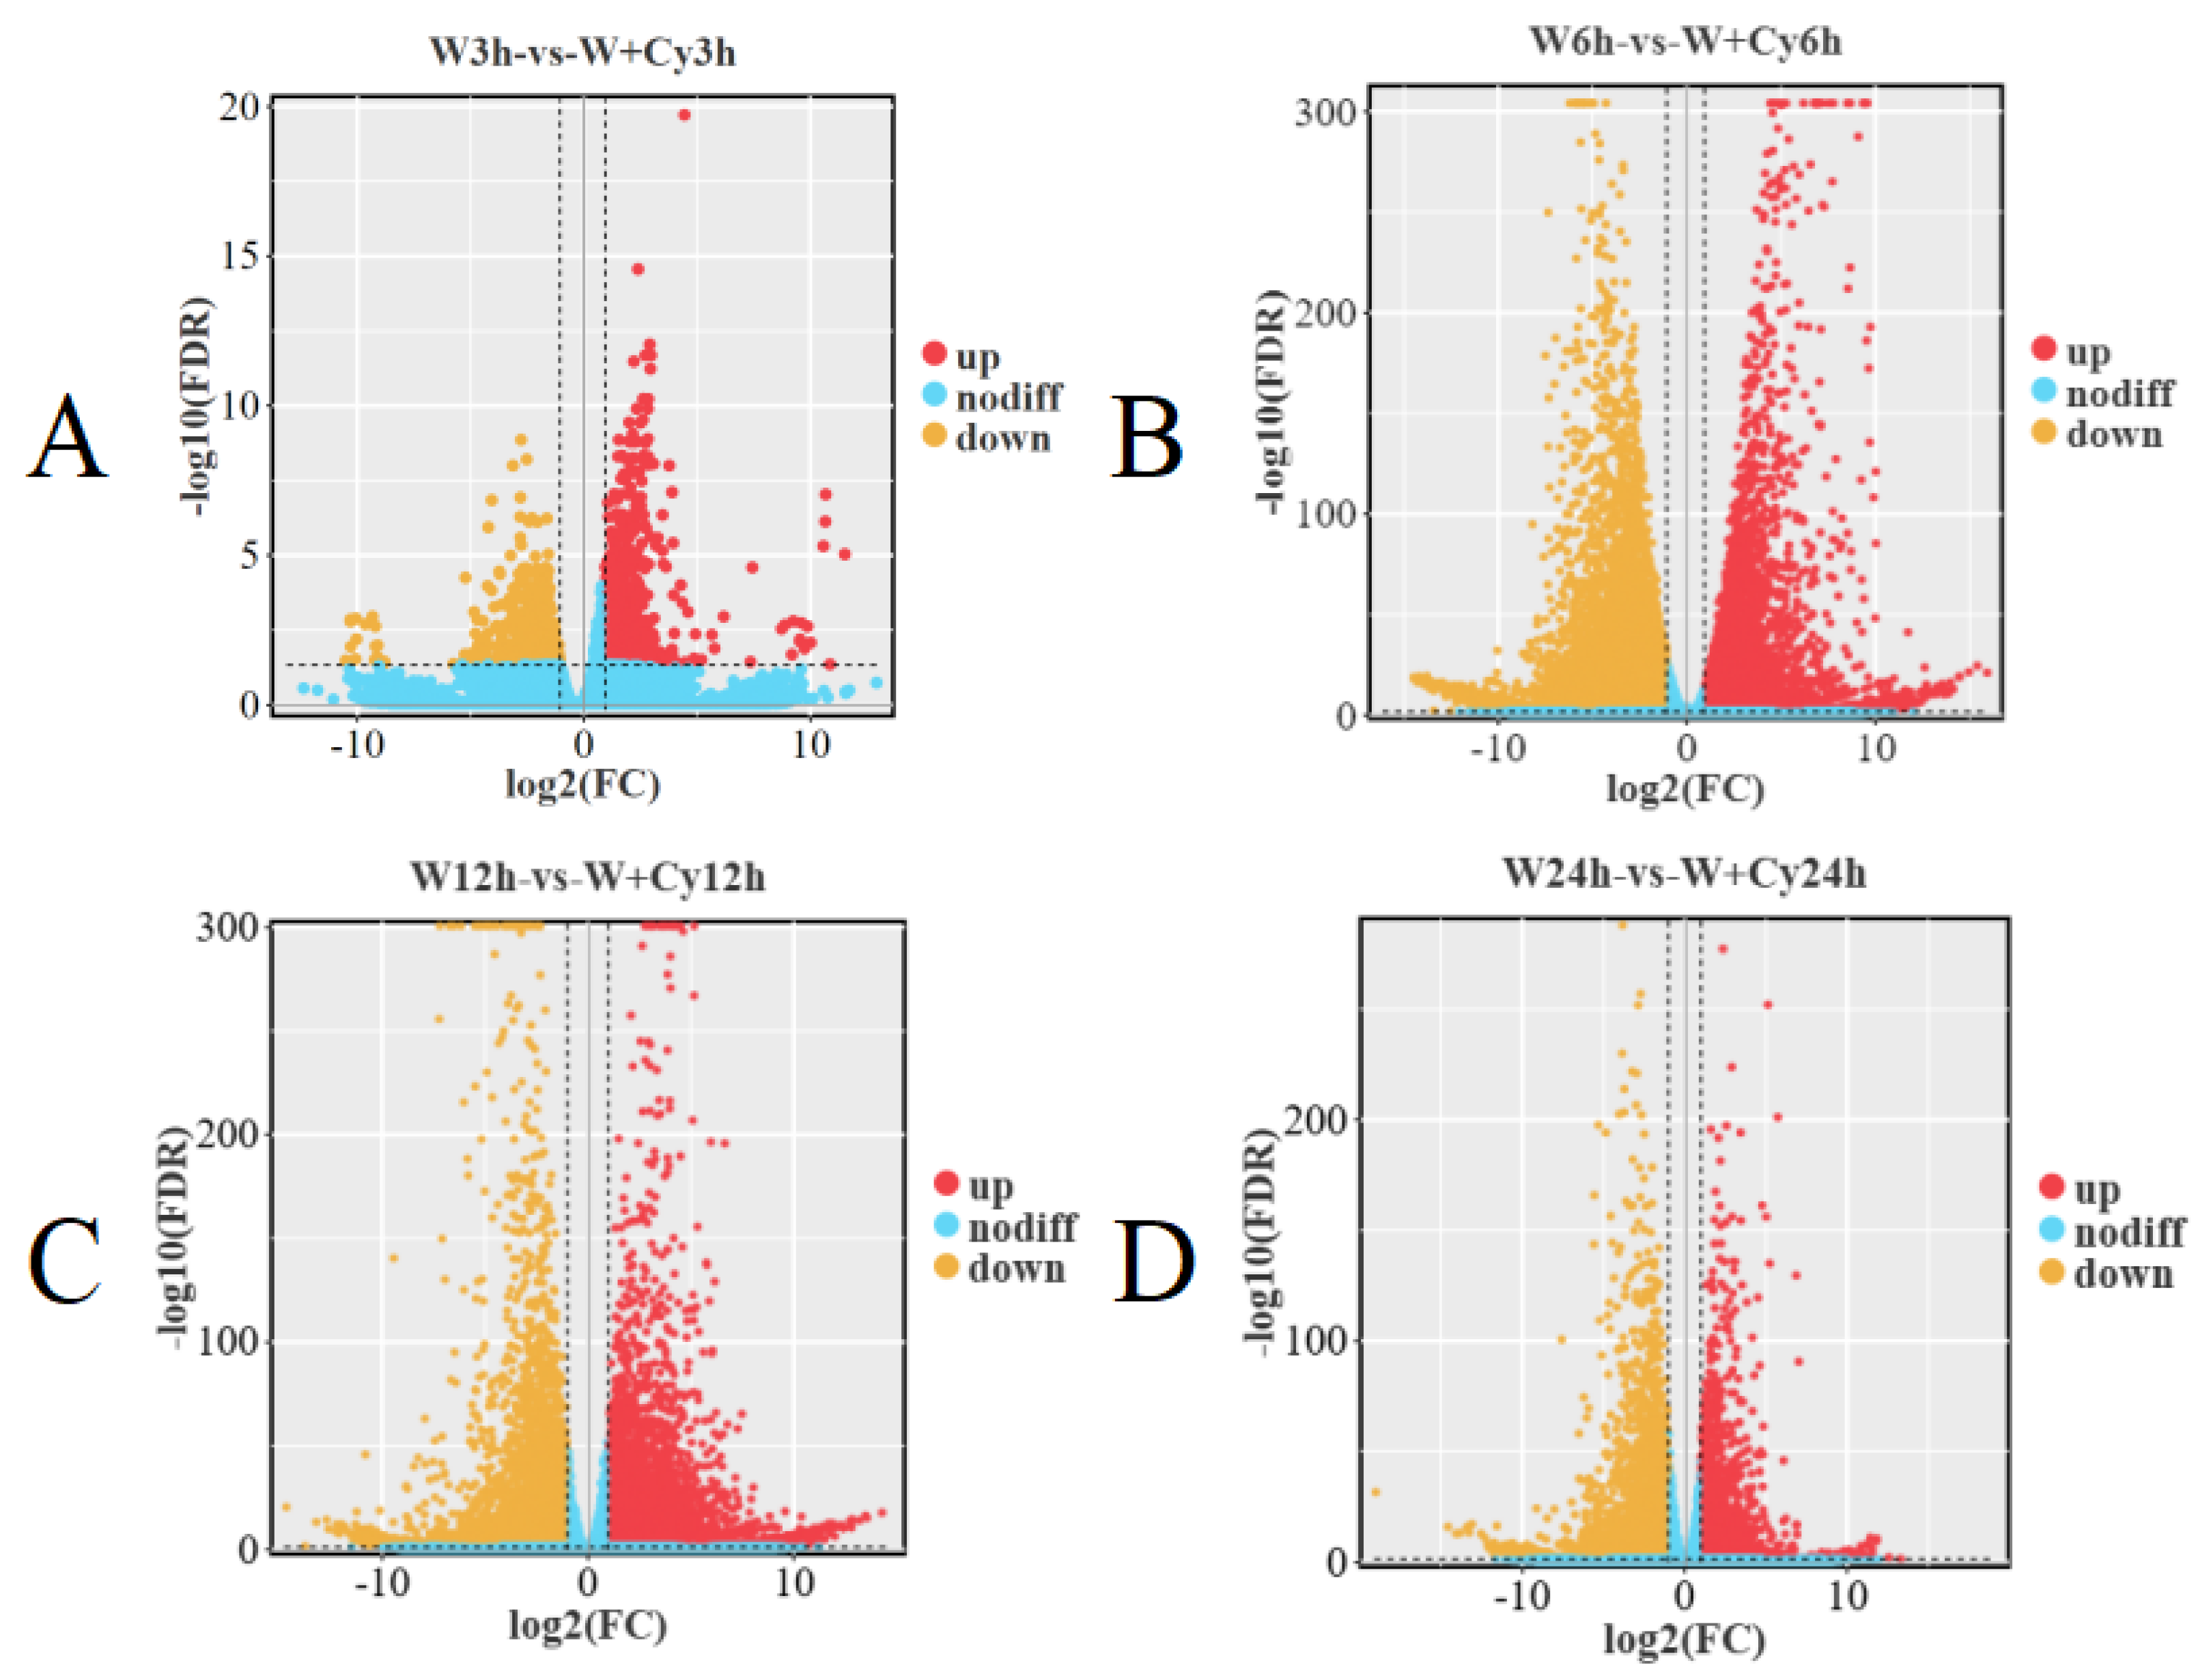
Figure 2C). A total of 1698, 29,786, 18,853, and 10,544 differentially expressed genes were identified, with 1000 up-regulated and 698 down-regulated; 8879 up-regulated and 20,907 down-regulated; 11,244 up-regulated and 7096 down-regulated; and 3674 up-regulated and 6870 down-regulated, respectively. In addition, the volcano plot (Figure 3) analysis shows that there are significant differences in gene expression between the W and W+Cy groups of bamboo shoots, and the differences between the W and W+Cy groups at 6 and 12 h are more obvious.
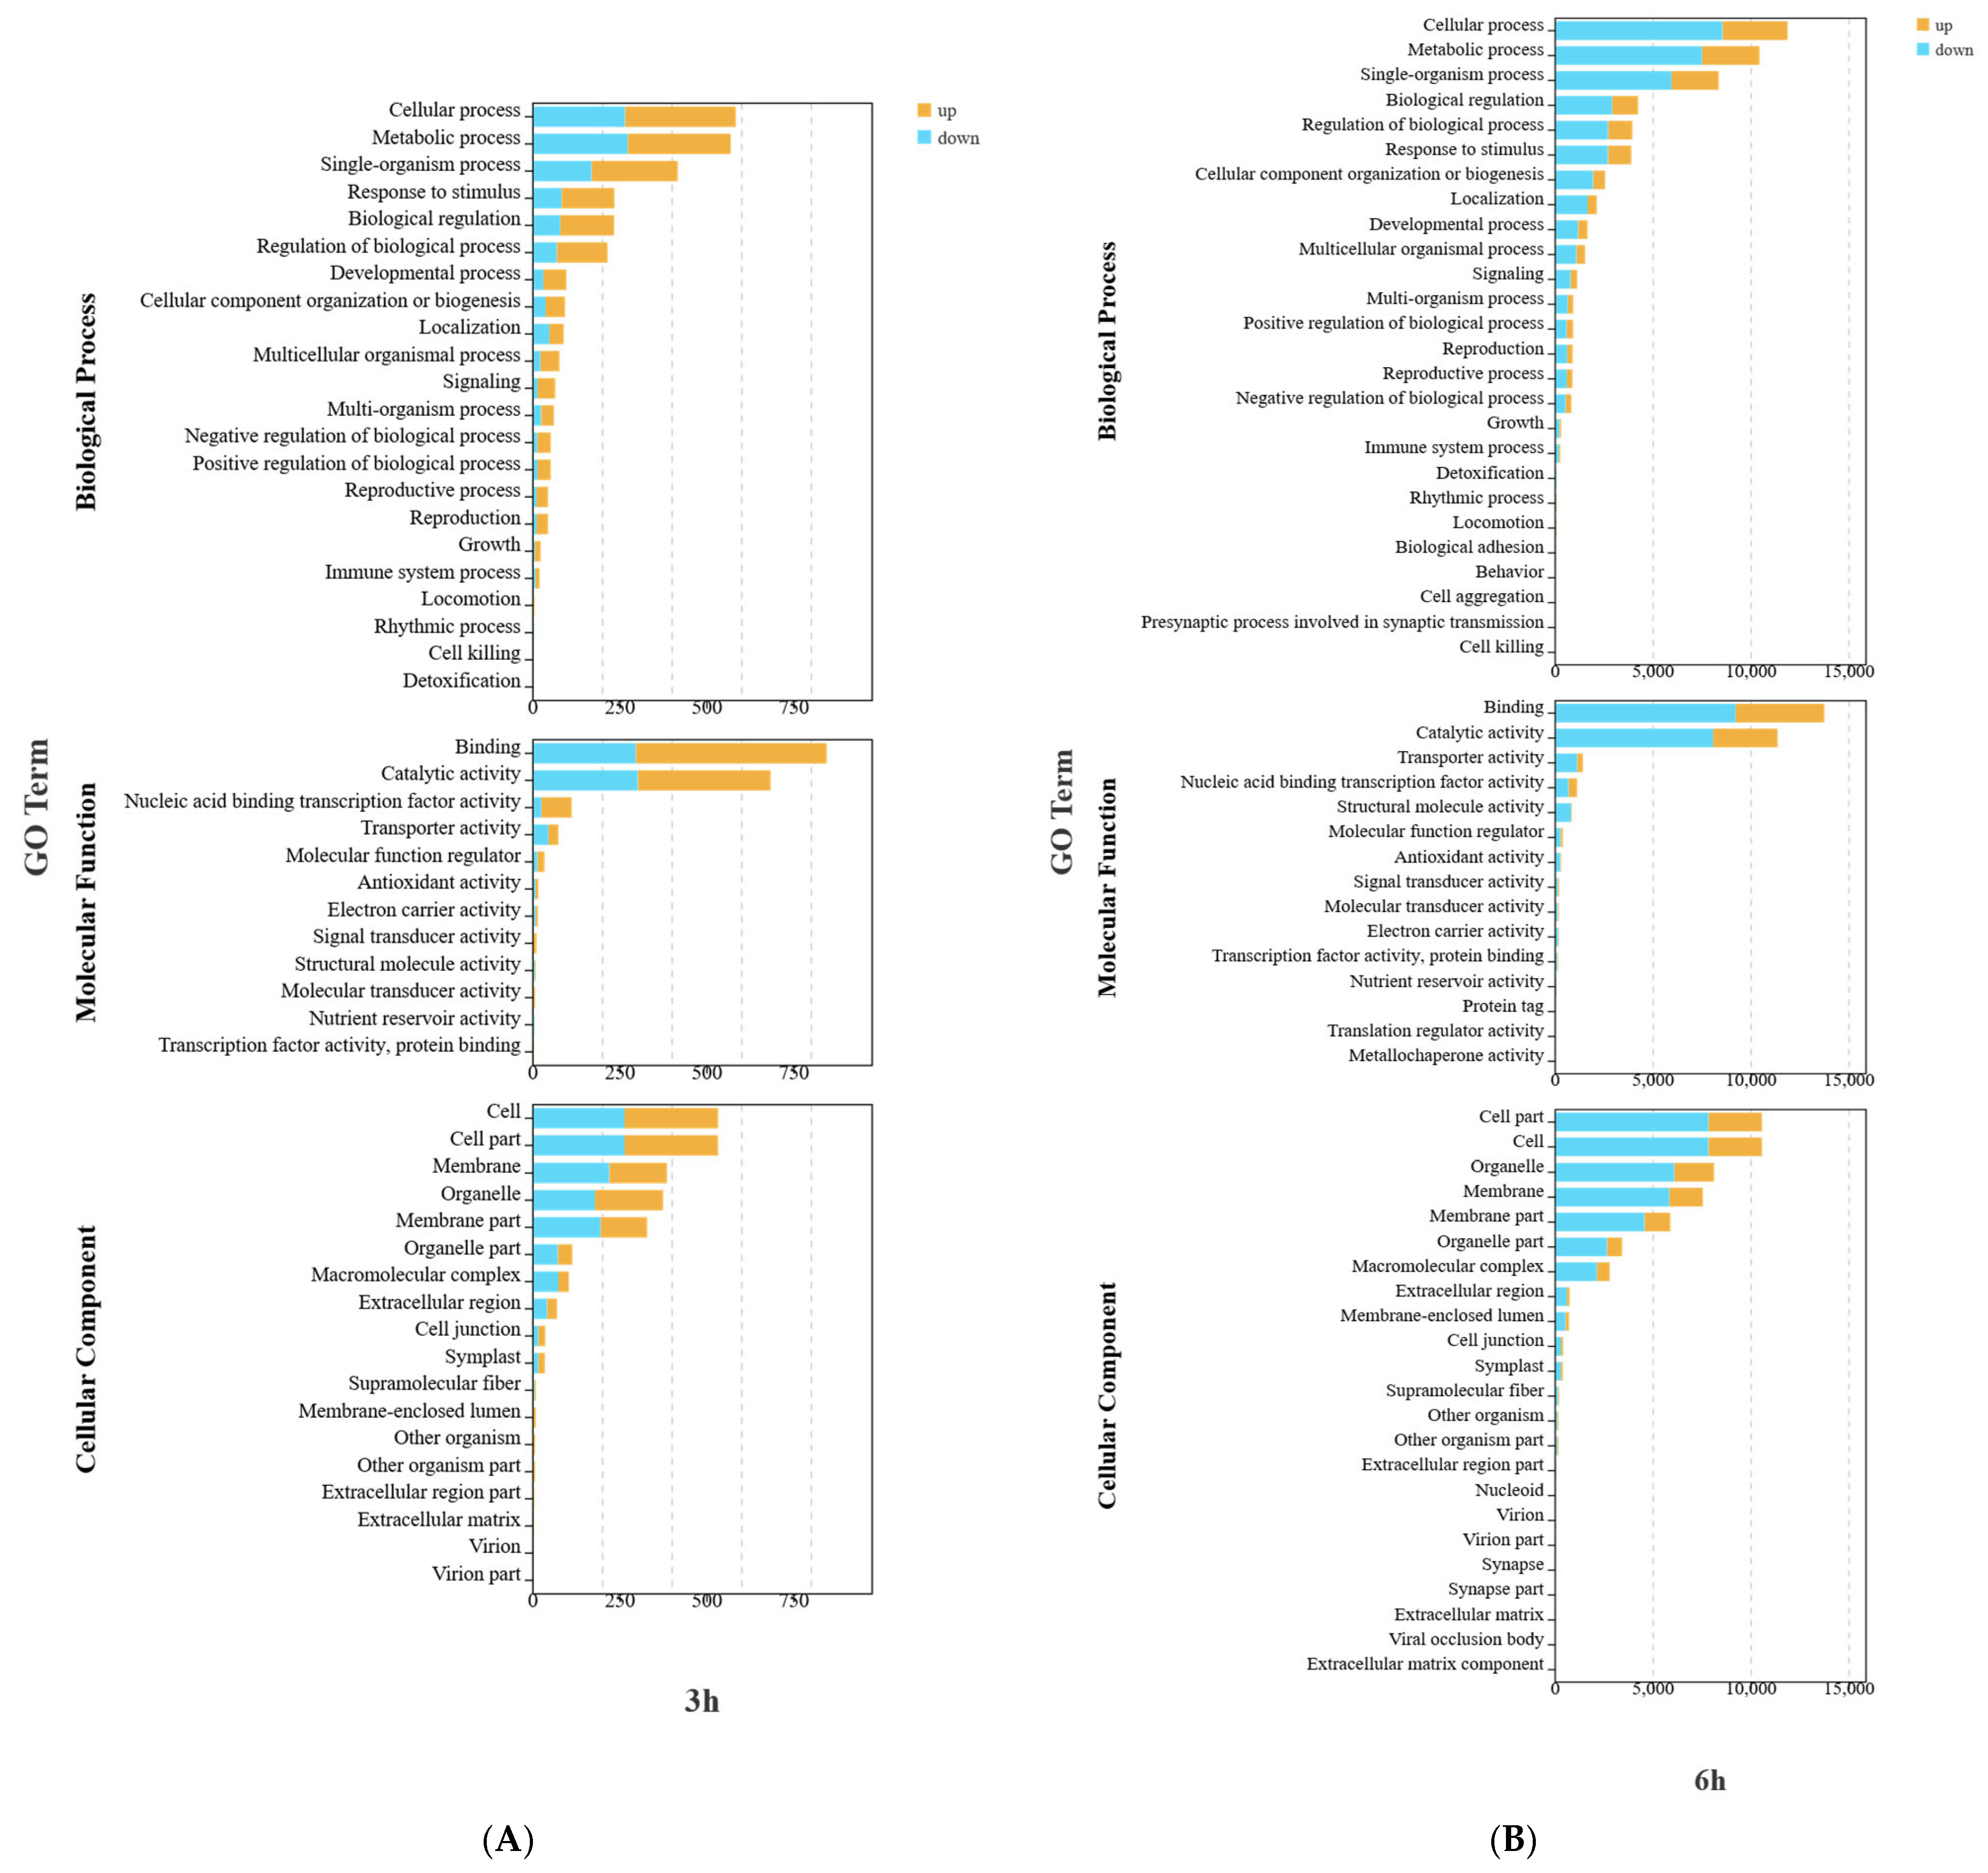
When exploring the potential roles of DEGs, GO enrichment (Figure 4) analysis revealed that in terms of biological processes, the DEGs in the W and W+Cy groups at 3, 6, 12, and 24 h were mainly involved in metabolic processes and cellular processes. For metabolic processes, the number of both the up-regulated and down-regulated genes was relatively large. For cellular processes, the numbers of up-regulated and down-regulated genes were similar, suggesting that gene expression related to cells changed in both directions. In terms of molecular functions, the DEGs in the W and W+Cy groups at 3, 6, 12, and 24 h were mainly involved in catalytic activity and binding. The number of down-regulated genes for catalytic activity was significantly higher than that of up-regulated genes, indicating that genes related to catalytic functions were more likely to show a down-regulation trend. In terms of cellular components, the DEGs in the W and W+Cy groups at 3, 6, 12, and 24 h were mainly related to cell parts and cells, suggesting that the treatment factor (W+Cy) may have caused stable and extensive effects on the basic cellular structures. These changes may lead to alterations in the nutrient content of bamboo shoots.
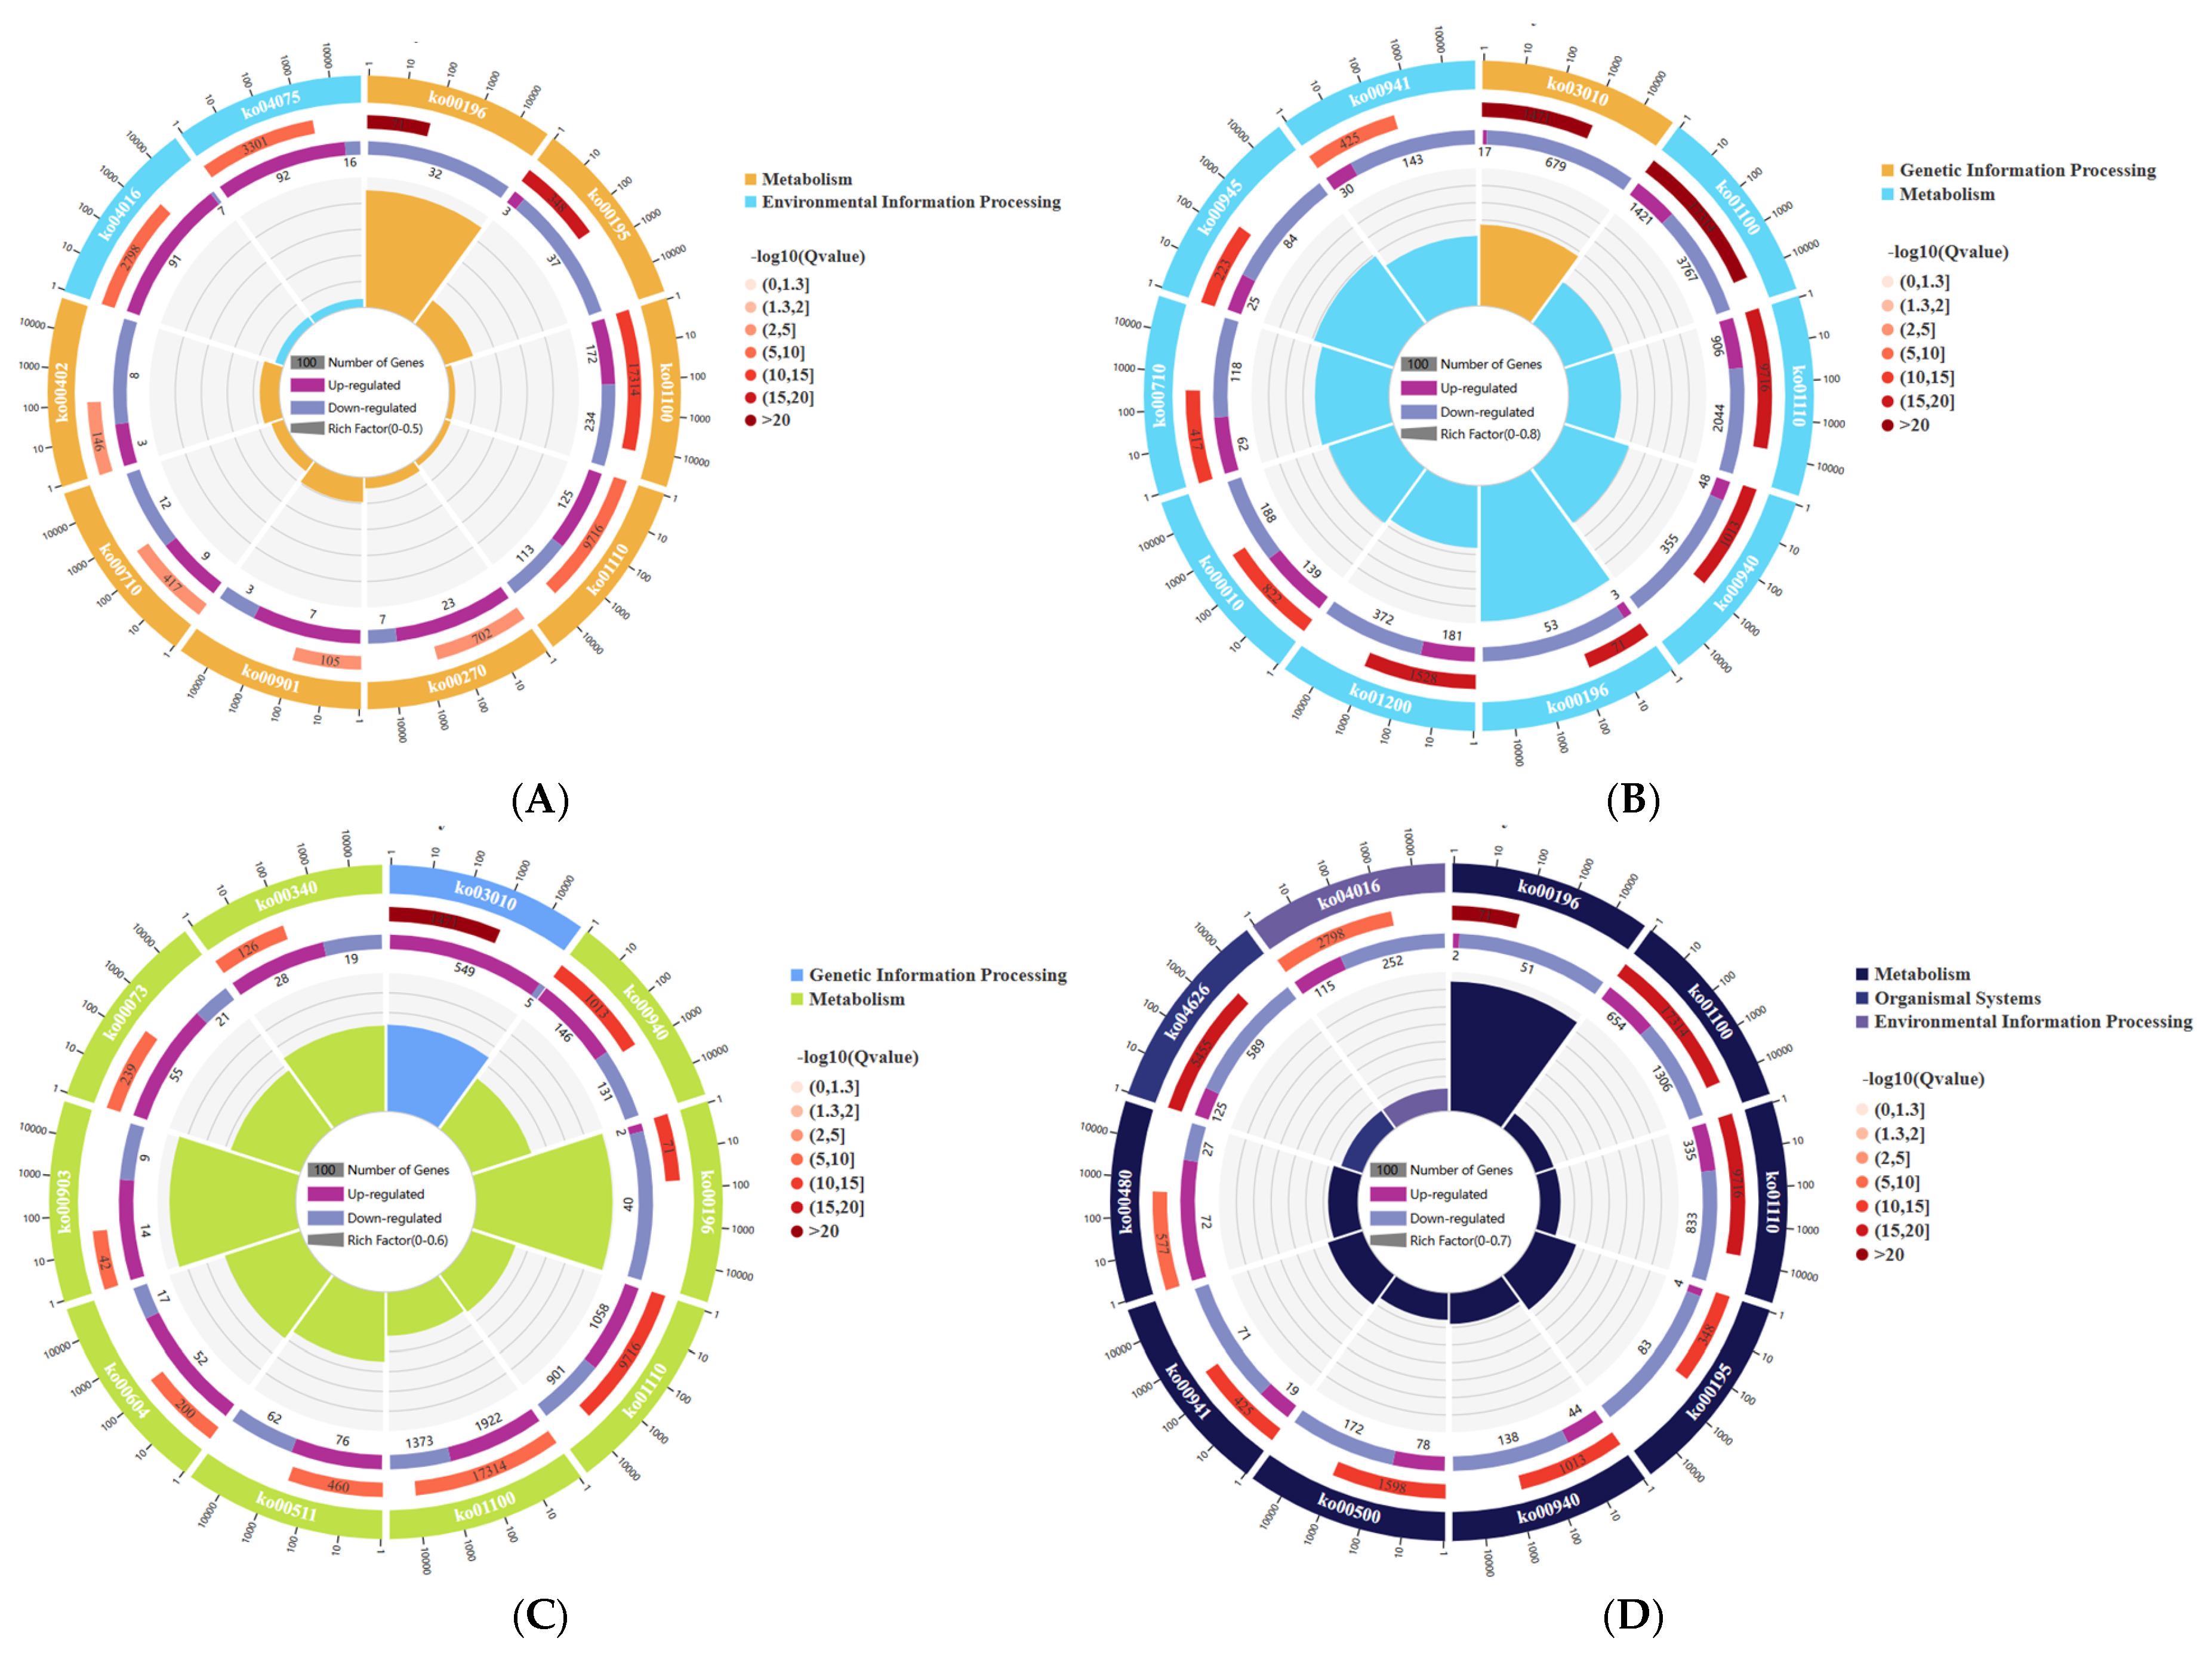
The transcripts of DEGs were mapped to the KEGG database and were enriched and classified. Through hypergeometric testing, the pathways that were significantly enriched in the DEGs compared to the entire genomic background were identified. The enrichment circle plot (Figure 5) can be used to describe multiple results, such as the significance of each pathway, the number of up- and down-regulated genes, and the gene ratio. The pathways of the 3 h W and W+Cy groups are concentrated in environmental information processing, metabolism, etc., and the pathways with relatively large differences are ko00196 and ko04075. The pathways of the 6 h W and W+Cy groups are concentrated in genetic information processing, metabolism, etc., and the pathways with relatively large differences are ko03010 and ko00196. The pathways of the 12 h W and W+Cy groups are concentrated in genetic information processing, metabolism, etc., and the pathways with relatively large differences are ko03010 and ko00196. The pathways of the 24 h W and W+Cy groups are concentrated in environmental information processing, metabolism, etc., and the pathways with relatively large differences are ko04016 and ko00196.
According to the pathway information of differentially expressed gene enrichment, a network diagram (Figure 6) was drawn using the interaction relationships between different pathways to assist in finding the core pathways. The core pathway at 3, 6, and 24 h is the metabolic pathway (ko01100), and the core pathways at 12 h are the biosynthesis of secondary metabolites (ko01110) and phenylpropanoid biosynthesis (ko00940). The metabolic pathway and the biosynthesis of secondary metabolites are relatively large pathways in the transcriptome. The pathways that are common and have a relatively large association at 3, 6, 12, and 24 h include starch and sucrose metabolism (ko00500), photosynthesis–antenna proteins (ko00196), carbon fixation in photosynthetic organisms (ko00710), etc. Therefore, the W and W+Cy groups of D. brandisii Kurz. bamboo shoots at 3, 6, 12, and 24 h show a large number of gene expressions at the transcriptome level and are enriched in the relevant pathways.
A correlation heatmap of transcriptomic and physiological data (Figure 7) was drawn based on the transcriptomic and physiological group data, showing the expression of genes related to the contents of cellulose, soluble sugar, and starch in the W and W+Cy groups at different time points (3 h, 6 h, 12 h, and 24 h). The heatmap visually displays the strength of the association between gene expression and physiological indicators through a color gradient.

3.3. Comprehensive Analysis of Sucrose and Starch Metabolism-Related Genes and Physiological Indices in Bamboo Shoots After Treatment with W and W+Cy

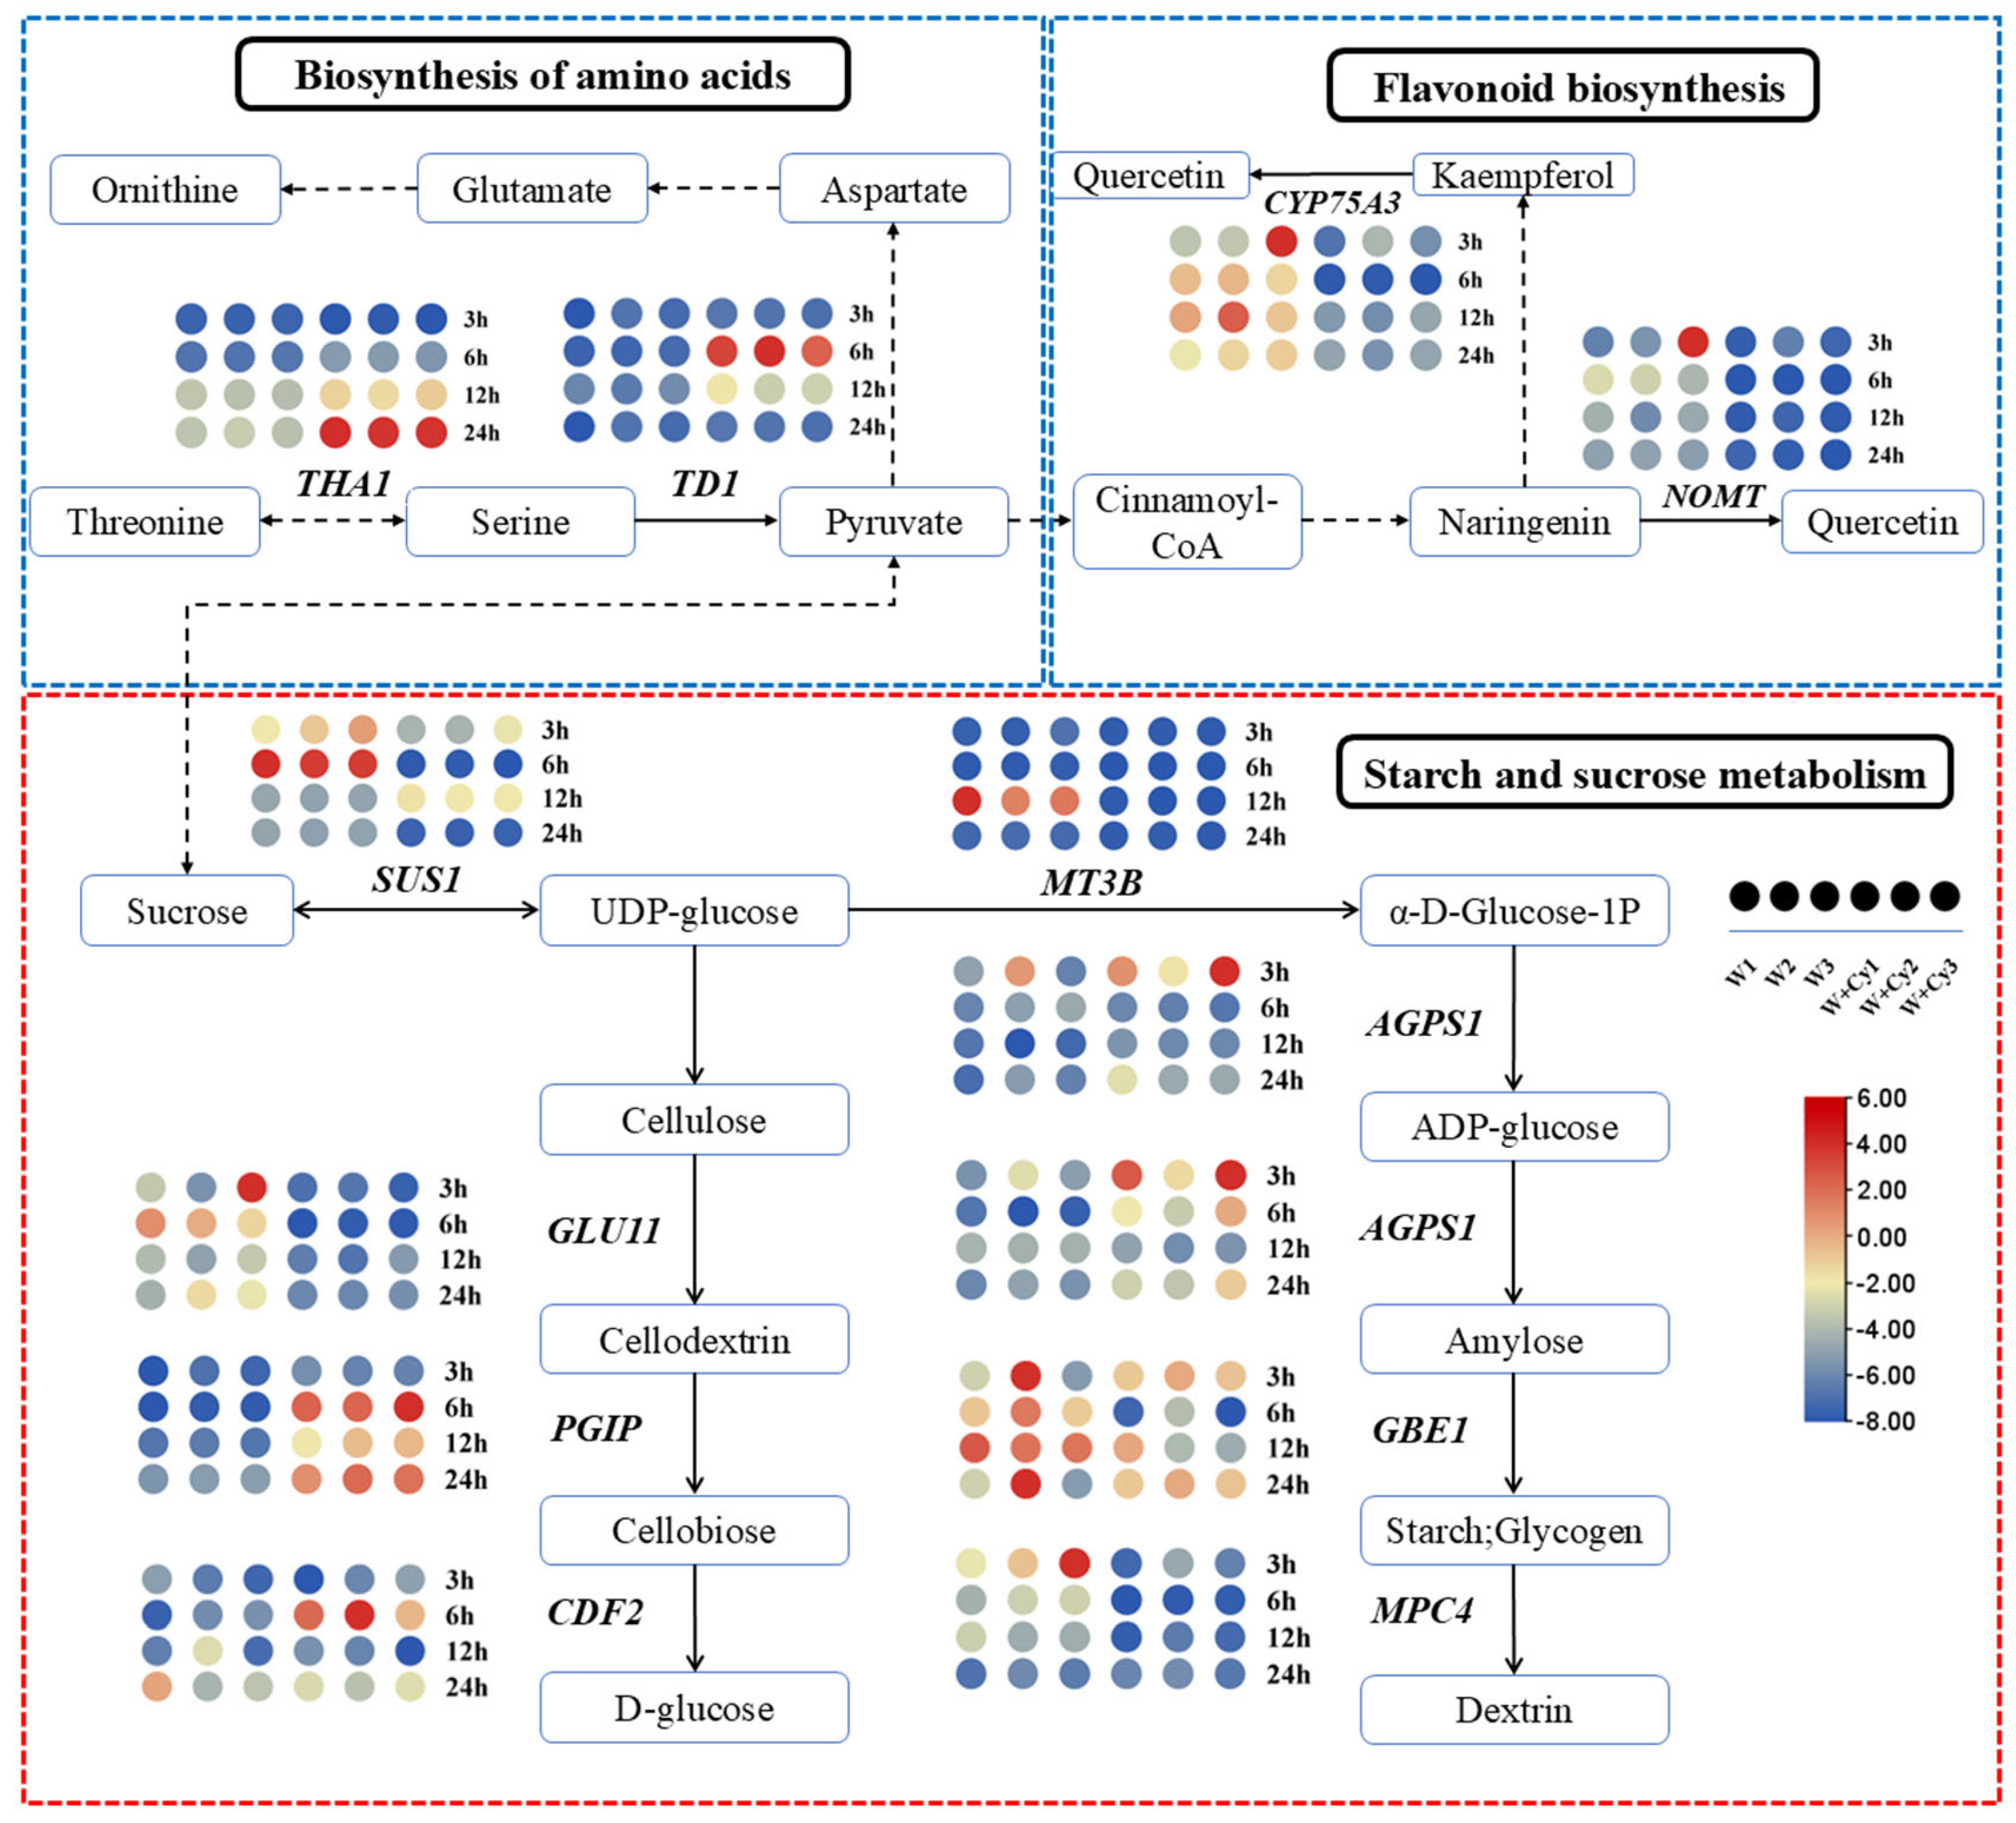
As can be seen from the previous analysis, there were differences in starch, soluble sugar, cellulose, and hemicellulose between the W and W+Cy groups at 3, 6, 12, and 24 h. By analyzing the expression of genes related to the sucrose and starch metabolic pathways (Figure 8) in the W and W+Cy groups, a large number of differentially expressed genes were found at different time points and nodes. We screened the gene with the largest fold-difference common to each node for analysis. There was a total of nine such differentially expressed genes, namely SUS1 (DhA05G012890), GLU11 (DhA17G008310), PGIP (DhB23G016680), CDF2 (DhA24G006540), MT3B (DhB15G011970), AGPS1 (DhA17G013170), AGPS1 (DhB17G013170), GBE1 (DhB08G015000), and MPC4 (DhA25G006100). SUS1 was significantly down-regulated at 3 and 6 h in the W+Cy group and significantly up-regulated at 3 h in the W group. GLU11 was significantly down-regulated at 6 h in the W+Cy group. PGIP was significantly up-regulated at 6 h in the W+Cy group and significantly down-regulated at 6 h in the W group. The expression of CDF2 in the W+Cy and W groups differed significantly at 6 h. The fold-difference in AGPS1 between the W+Cy and W groups was the largest at 3 h. The fold-difference in GBE1 between the W+Cy and W groups was the largest at 12 h. The fold-difference in MPC4 between the W+Cy and W groups was the largest at 3 h.

3.4. Analysis of Amino Acid and Phenol-Related Metabolic Pathways in Bamboo Shoots After Treatment with W and W+Cy

After insect feeding, differences in the amino acid contents between the W and W+Cy groups at 3, 6, 12, and 24 h were evident. By analyzing the expressions of genes related to the amino acid and flavonoid metabolic pathways (Figure 8) under the treatments of the W and W+Cy groups, a large number of DEGs were found at different time points and nodes. We screened the gene with the largest fold-change common to each node for analysis. There were four such genes, namely THA1, TD1, NOMT, and CYP75A3. THA1 was up-regulated at 24 h in the W+Cy group but was down-regulated at other time points in both the W and W+Cy groups. TD1 was up-regulated at 6 h in the W+Cy group but was down-regulated at other time points in both the W and W+Cy groups. NOMT was down-regulated at most time points in both the W and W+Cy groups. CYP75A3 was down-regulated at most time points in the W+Cy group.
Based on the above analysis, both mechanical damage and insect feeding had varying degrees of impact on the physiological indices of bamboo shoots. Insect feeding led to a decrease in the water content, as well as in the contents of soluble sugar, starch, cellulose, and hemicellulose in bamboo shoots, while increasing the contents of lignin, total phenols, proteins, and amino acids. The impact of insect feeding was more complex and significant, and there were also differences observed in the expression of related genes.

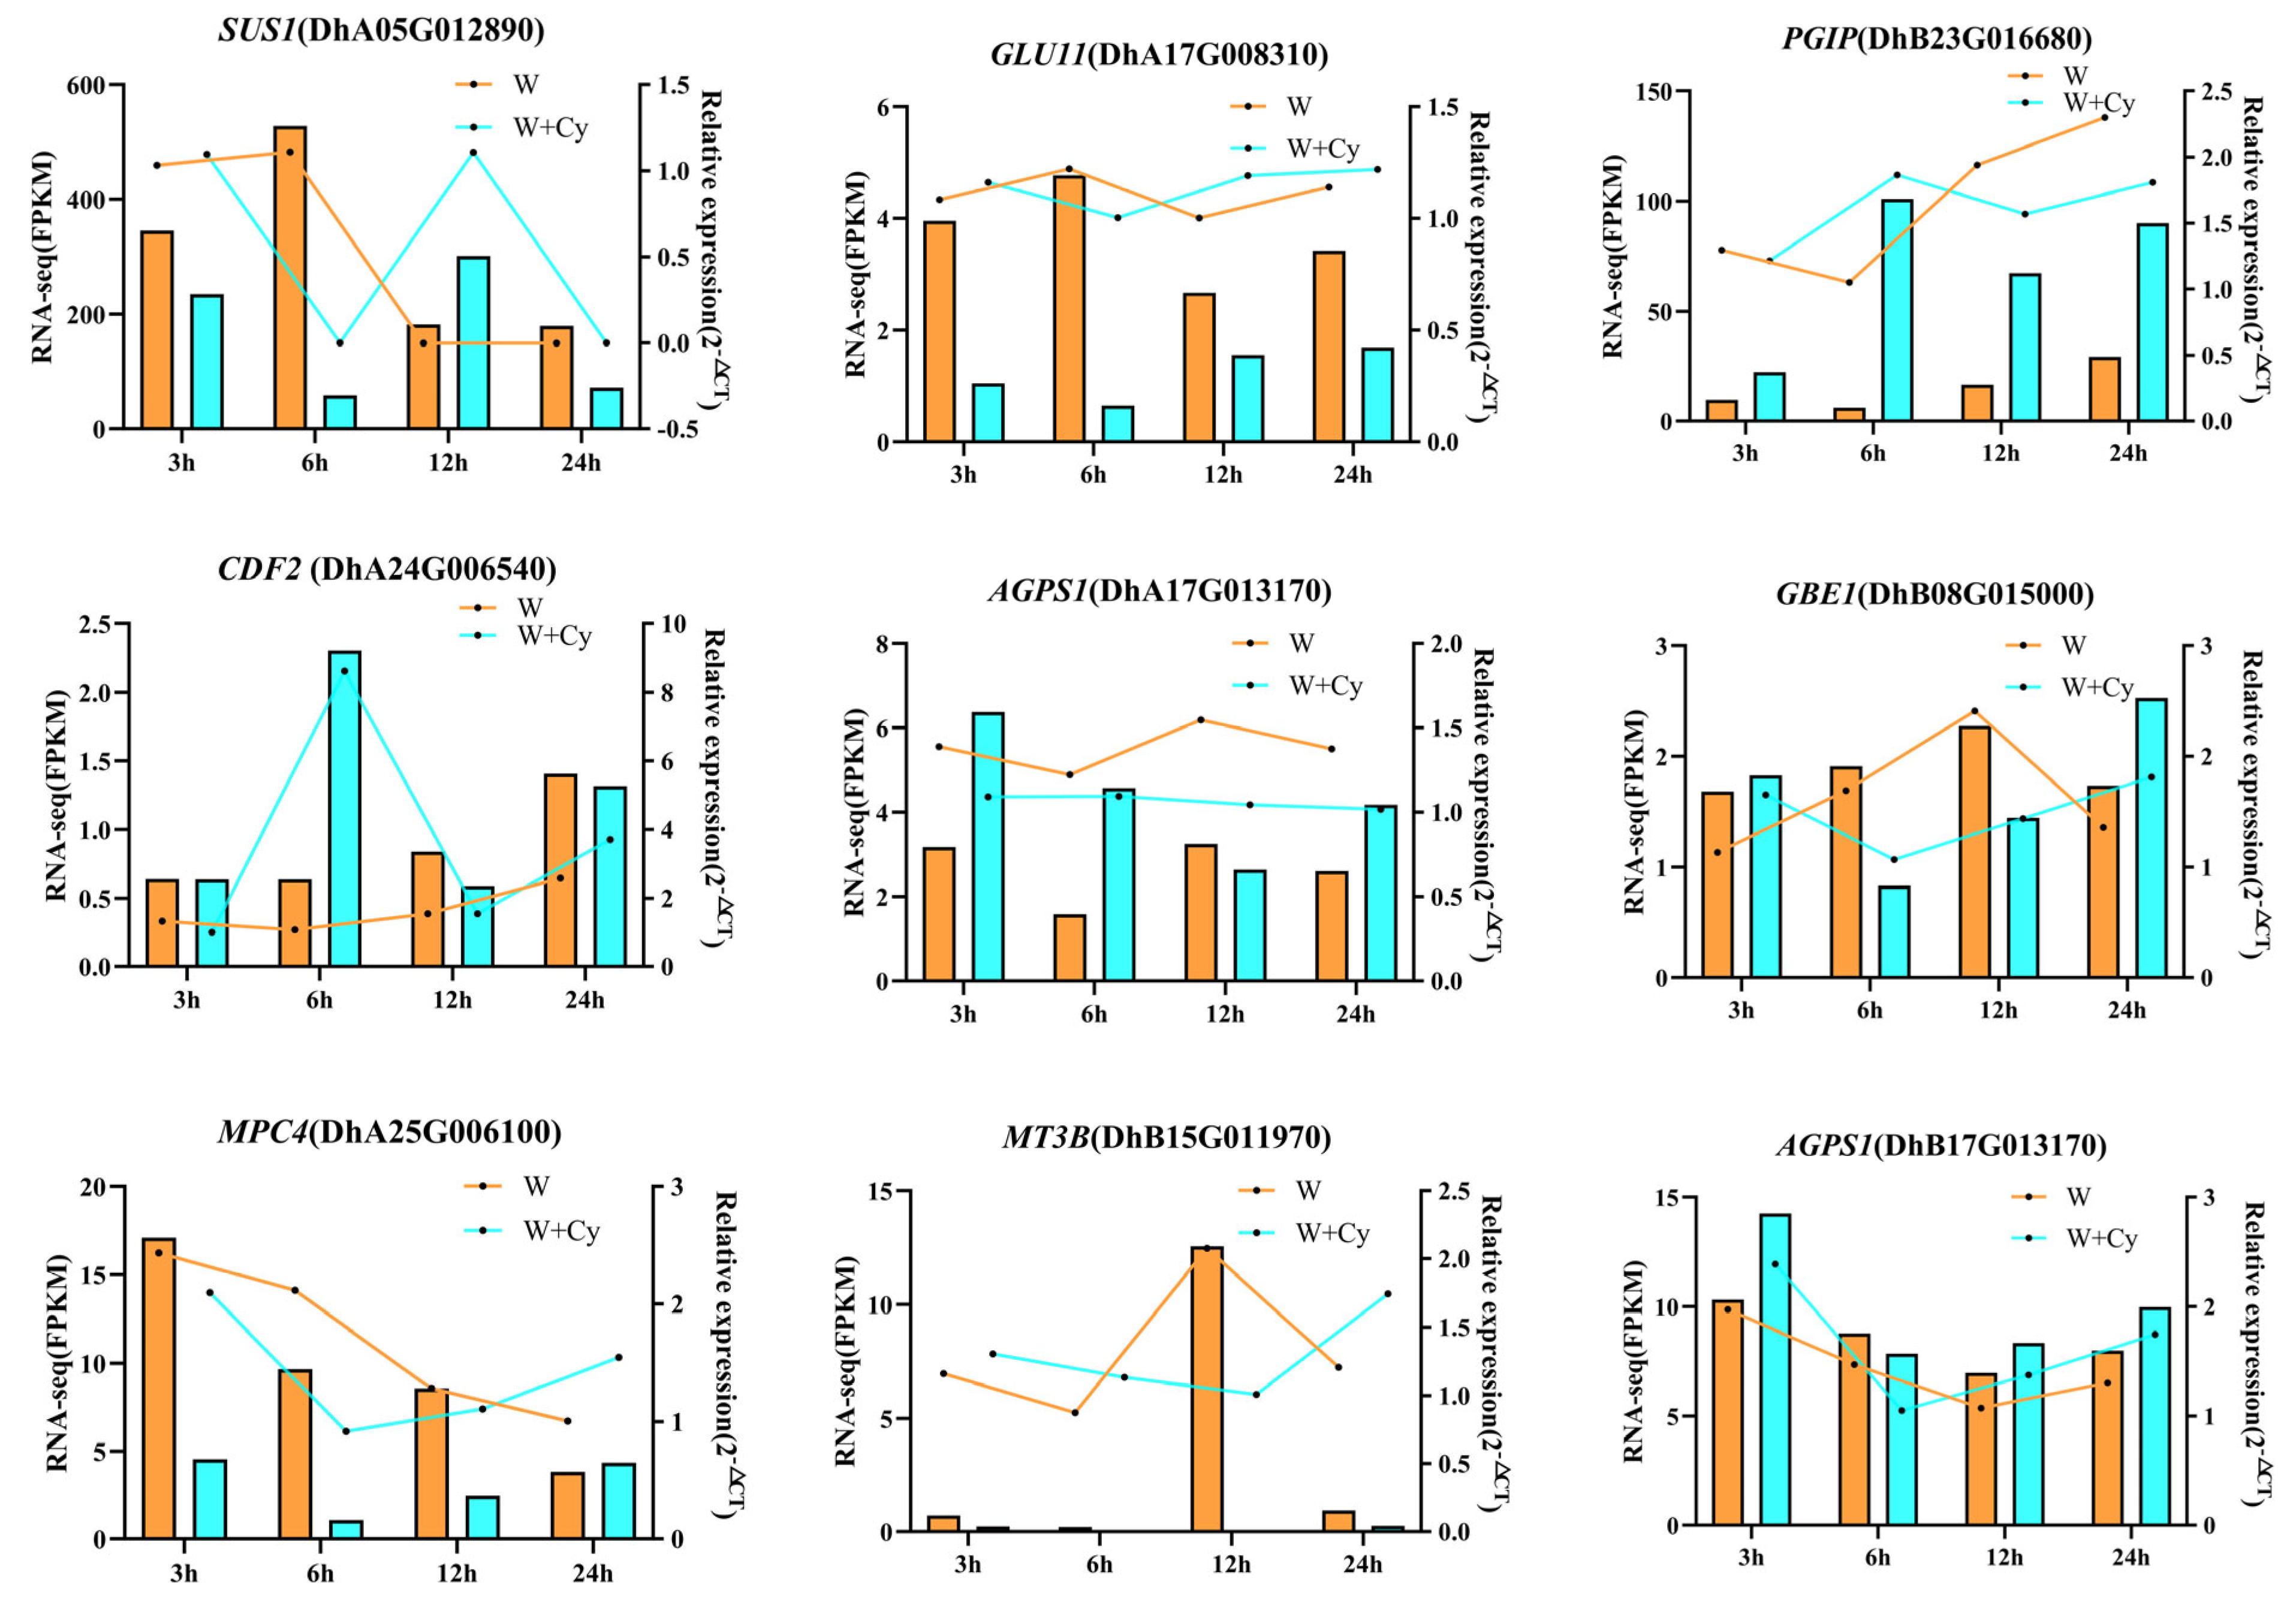
3.5. Validation of Real-Time Fluorescence Quantitative PCR for Differentially Expressed Genes (DEGs) from D. brandisii Bamboo Shoots

To validate the accuracy of the RNA-Seq data, nine DEGs were selected from the pathways of sucrose and starch metabolism, cellulose synthesis pathway degradation, and glycolysis and gluconeogenesis and were validated using real-time fluorescence quantitative PCR for SUS1, GLU11, PGIP, CDF2, MT3B, AGPS1, AGPS1, GBE1, and MPC4, respectively. The results of the RNA-Seq (FPKM) and the real-time fluorescence quantitative PCR in the multiplicity of 2−ΔCT values showed the same overall expression trend (Figure 9, Table S1), and these results validated the reproducibility and confidence of the RNA-Seq data.

4. Discussion

Previous studies have shown that plants will produce a series of defense responses after being damaged. Different inducing factors lead to different effects [29]. Research indicates that mechanical damage only brings about simple physical stimulation without the influence of other factors. In contrast, insect feeding stimulates a more complex process. It is not merely the mechanical damage caused by insect feeding but also the chemical stimulation triggered by the oral secretions of insects [30]. Carbohydrates are essential raw materials for the growth and development of both plants and insects. Insects obtain nutrients from plants through feeding to meet their own growth requirements. After being damaged, plants adjust their nutritional structure by changing the content of carbohydrates in their bodies to reach an optimal survival state [31]. This study found that different treatments had different induction effects on D. brandisii Kurz. bamboo shoots. The contents of starch, soluble sugar, cellulose, and hemicellulose changed over time. Both mechanical damage and pest infestation treatments could induce changes in sugar metabolism in D. brandisii bamboo shoots. Some of these responses were not immediate, and there was a certain lag effect. The effect of pest infestation treatment was more significant than that of mechanical damage.
Starch is usually regarded as a storage substance due to its immobility, while soluble sugars can be mobilized at any time in order to participate in various physiological and metabolic activities of plants [32]. Zhang et al. found that during various growth and development stages of Triticum aestivum L., the starch content in wheat under insect infestation generally showed a decreasing trend [33]. In this study, when the bamboo shoots were fed on by C. buqueti, although the starch content increased, it was significantly lower than that in the W group. The digestive tract of C. buqueti contains amylase, which may be the reason why the starch content in the W+Cy group is lower than that in the W group. The soluble sugar content of host plants affects the feeding behavior of phytophagous insects and is negatively correlated with the damage they cause [34]. Soluble sugar is an important substance in plant stress-resistance regulation [35]. Chen Wei et al. found that the soluble sugar content decreased in different Oryza sativa L. varieties when they were infested by pests [36]. When bamboo shoots are fed on by C. buqueti, the soluble sugar content decreases and is lower than that in the W group. The digestive tract of C. buqueti contains sucrase, which may be the reason for the decrease in the soluble sugar content of bamboo shoots.
SUS1 (DhA05G012890) is a sucrose synthase. The research findings of Slugina, et al. indicate that the reversible sucrose hydrolysis mediated by SUS1 is crucial for maintaining the balance between sucrose and its monomers [37]. PGIP (DhB23G016680) is a polygalacturonase-inhibiting protein. Hong, et al. found that in strawberry fruits, PGIP, as a key protein in plant defense responses, plays a crucial role in regulating cell wall strength and inhibiting the degradation of the cell wall by pathogens [38]. CDF2 (DhA24G006540) is a Circadian Dof Factor 2. Sun, et al. found that in Arabidopsis thaliana, CDF2 regulates a set of pri-miRNAs at the transcriptional and post-transcriptional levels in order to maintain an appropriate level of their mature miRNAs, thus controlling plant development [39]. Li Y.Q et al. found that the AGPS and BAM genes significantly improve the fruit quality of ‘Ganlv No.1’ (Actinidia eriantha Bentham) during fruit development through starch metabolism [40]. The expression of SUS1 was significantly down-regulated at 3 h and 6 h in the W+Cy group, while it was significantly up-regulated at 3 h in the W group. The expression of GLU11 was significantly down-regulated at 6 h in the W+Cy group. The expression of PGIP was significantly up-regulated at 6 h in the W+Cy group but was significantly down-regulated at 6 h in the W group. There was a large difference in the expression of CDF2 between the W+Cy and W groups at 6 h. The difference in AGPS1 between the W+Cy and W groups was the largest at 3 h. The difference in GBE1 between the W+Cy and W groups was the largest at 12 h. The difference in MPC4 between the W+Cy and W groups was the largest at 3 h.
The plant cell wall is mainly composed of cellulose, hemicellulose, lignin, and pectin, and the content and proportion of these components can directly affect the lignification degree of plant cells [41]. The lignin content in the W+Cy group increases and is higher than that in the W group. The increase in lignin content after insect feeding can enhance the mechanical strength of the cell wall of bamboo shoots, thereby hindering the feeding of pests. At the same time, it also restricts the spread of pathogenic bacteria and plays a protective role for bamboo shoots. Cellulose is the most widely distributed and abundant renewable resource in nature, and it is a primary metabolite produced by plant photosynthesis [42]. When bamboo shoots are fed on by C. buqueti, although the cellulose content increases, it is lower than that in the W group. The digestive tract of C. buqueti contains cellulase, which may be the reason why the cellulose content in the W+Cy group is lower than that in the W group. The most important biological role of hemicelluloses is their contribution to strengthening the cell wall via their interaction with cellulose and—in some walls—with lignin [43]. When bamboo shoots are fed on by C. buqueti, although the hemicellulose content in the W+Cy group increases, it is lower than that in the W group. The digestive tract of C. buqueti contains hemicellulase, which may be the reason for the lower hemicellulose content in the W+Cy group compared to the W group.
For instance, when comparing mulberry leaves infected with a disease with normal mulberry leaves, the total amino acid content of diseased mulberry leaves decreases extremely significantly. At the same time, when comparing mulberry leaves fed on by insects with normal mulberry leaves, the total amino acid content of the insect-fed mulberry leaves shows an extremely significant increasing trend [44]. After insects feed on bamboo shoots, the amino acid content of the bamboo shoots increases. Among them, amino acids such as threonine, pyruvate, and serine play an important role in the response of plants to insect feeding [45,46,47]. In this experiment, it was found that THA1 and TD1 play important roles in the pathways of threonine, pyruvate, and serine.
Sun et al. found that the soluble protein contents of different varieties of rhododendrons were different before and after insect feeding [48]. Similarly, when insects feed on bamboo shoots, the protein content of bamboo shoots increases, which may be related to the activation of insect-resistant enzyme proteins. Insect feeding can cause changes in the total phenol content in plants, which generally manifests as an increase in the total phenol content; this change is an important defense response of plants to insect feeding. Zhang Kuo and others found that after the ‘Beikang’ poplar was stimulated by mechanical damage, as well as being damaged by the boring of Anoplophora glabripennis, the total phenol contents in the bark and xylem increased [49]. In the early stage (3 h) of the insect feeding treatment, the total phenol content of bamboo shoots can be significantly increased, enhancing the defensive ability of bamboo shoots. However, in the later stage, the metabolic effect of bamboo shoots may keep the total phenol content at a normal level. NOMT and CYP75A3 play important regulatory roles in the metabolic pathway of flavonoid compounds.

5. Conclusions

Transcriptomic analysis revealed significant differences in the expression levels of sugar metabolism-related genes (SUS1, GLU11, PGIP, CDF2, MT3B, AGPS1, AGPS1, GBE1, and MPC4) between the insect feeding treatment group and the mechanical damage treatment group at different time points. Additionally, the expression levels of amino acid metabolism-related genes (THA1 and TD1) and flavonoid metabolism-related genes (NOMT and CYP75A3) differed between the insect feeding treatment group and the mechanical damage treatment group across time points. These key genes play a crucial role in the regulatory response of bamboo shoots to feeding by C. buqueti. Physiological studies showed that C. buqueti feeding on bamboo shoots caused changes in the content of water, soluble sugars, starch, cellulose, hemicellulose, lignin, amino acids, proteins, and total phenolics. Specifically, decreases in water content, soluble sugars, and starch reduced bamboo shoot quality, while increases in cellulose, hemicellulose, lignin, and total phenolics also negatively impacted quality. Elevated levels of stress-related amino acids and proteins may further contribute to quality degradation. The amylase, invertase, cellulase, and hemicellulase present in the digestive tract of C. buqueti are likely important factors influencing bamboo shoot quality. This phenomenon provides key insights for understanding insect feeding mechanisms, plant pest-resistance strategies, and nutrient cycling in ecosystems. This study provides critical insights into the interaction mechanism between bamboo shoots and C. buqueti, as well as the physiological and molecular responses of bamboo plants to insect damage. Integrating transcriptomic and physiological data, this study demonstrates that insect feeding has a more pronounced impact on reducing D. brandisii Kurz. bamboo shoot quality compared to mechanical damage, with insect feeding being a major driver of quality decline.

Supplementary Materials

The following supporting information can be downloaded at https://www.mdpi.com/article/10.3390/f16061020/s1, Table S1: Primers for internal reference genes and target genes.

Author Contributions

Conceptualization, S.Z. and J.L.; methodology, S.Z.,Y.M., B.J., Y.W. and H.W.; software, S.Z.; validation, Y.M., Y.W. and H.W.; formal analysis, J.L.; investigation, B.J.; resources, J.L.; data curation, S.Z.; writing—original draft preparation, S.Z.; writing—review and editing, J.L.; visualization, S.Z.; supervision, J.L.; project administration, J.L.; funding acquisition, J.L. All authors have read and agreed to the published version of the manuscript.

Funding

This research was funded by the Xingdian Talent Support Plan Project: XDYC-QNRC-2022-0229; Basic Research in Agriculture: 202401BD070001-110.

Data Availability Statement

The data are not publicly available due to privacy concerns. Requests for access to the data may be directed to the corresponding author at lijuan@swfu.edu.cn for consideration.

Conflicts of Interest

The authors declare no conflicts of interest.

References

  1. Yang, Q.; Duan, Z.B.; Wang, Z.L.; He, K.; Sun, Q.X.; Peng, Z. Bamboo resources, utilization and ex-situ conservation in Xishuangbanna, South-eastern China. J. For. Res. 2008, 19, 79–83. [Google Scholar] [CrossRef]
  2. Vorontsova, M.S.; Clark, L.G.; Dransfield, J.; Govaerts, R.; Baker, W.J. World Checklist of Bamboos and Rattans; INBAR: Beijing, China; Royal Botanic Gardens, Kew: Richmond, UK, 2016. [Google Scholar]
  3. Wang, Y.; Chen, J.; Wang, D.; Ye, F.; He, Y.; Hu, Z.; Zhao, G. A systematic review on the composition, storage, processing of bamboo shoots: Focusing the nutritional and functional benefits. J. Funct. Foods 2020, 71, 104–117. [Google Scholar] [CrossRef]
  4. Huang, M.; Fan, K.K.; Chu, W.Y.; Yue, X.H. Research progress on nutrient components in bamboo shoots and management technologies before and after harvest. World Bamboo Ratt. 2024, 22, 88–94+105. [Google Scholar]
  5. Liu, B.L.; Guo, Z.Y.; Chen, H.; Zhang, J.D.; Liu, W.Y.; Hui, C.M. A study of germplasm resources of Dendrocalamus brandisii and its conservation strategy in Yunnan, China. World Bamboo Ratt. 2013, 11, 22–26. [Google Scholar]
  6. Tao, H.; Kingston, K.; Xu, Z.; Hosseini Bai, S.; Guo, L.; Liu, G.L.; Hui, C.M.; Liu, W. Predicting potential suitable areas of Dendrocalamus brandisii under global climate change. Forests 2024, 15, 1301. [Google Scholar] [CrossRef]
  7. Zhang, J.S.; Hui, C.M. Research status and outlook of Dendrocalamus brandisii. Guangxi For. Sci. 2012, 41, 341–344+382. [Google Scholar]
  8. Wang, F.; Yang, M.; Chen, Z.M.; Yang, Y.; Yang, W.; Huang, Q. Effects of three growth regulators on the toxicity of Cyrtotrachelus buqueti and the activities of related enzymes. J. Sichuan Agric. Univ. 2022, 40, 775–781. [Google Scholar]
  9. Yang, Y.; Yang, W.; Yang, C.P.; Cai, Y.; Pu, Y.F.; Fu, Y.W.; He, Z.R. Mating behavior of Cyrtotrachelus buqueti (Coleoptera: Curculionidae). Acta Entomol. Sin. 2015, 58, 60–67. [Google Scholar]
  10. Yang, H.; Li, X.; Wang, F.; Fang, R.; Yang, W. Screening and verification of proteins interacting with CbuqPBP2 in Cyrtotrachelus buqueti. J. Northwest A F Univ. (Nat. Sci. Ed.) 2024, 52, 87–97. [Google Scholar]
  11. Liu, C.; Wan, D.H. Preliminary studies of digestive enzyme activities in larva of Cyrtotrachelus buqueti. Sichuan J. Zool. 2011, 30, 61–63. [Google Scholar]
  12. Wang, M.; Guan, B.Y.; Yin, F.L.; Liu, Y.F.; Liao, L.Y.; Pan, Z.T.; Shuai, L. Advances in Research on Physiological and Molecular Mechanisms of Mechanical Damage of Fruits and Vegetables. Food Res. Dev. 2022, 43, 205–211. [Google Scholar]
  13. Yan, S.L. Early Defense Signal in Arabidopsis thaliana Against Insect Herbivory. Ph.D. Thesis, Beijing Forestry University, Beijing, China, 2015. [Google Scholar]
  14. Zhang, J.H.; Tong, W.; Zheng, Y.T.; Zhu, Q.G.; Deng, X.J. Effect of Storage Temperature on Post-Harvest Physiology of Spring Moso Bamboo Shoots. World Bamboo Ratt. 2023, 21, 41–45. [Google Scholar]
  15. Hou, D.; Lu, H.; Zhao, Z.; Pei, J.; Yang, H.; Wu, A.; Yu, X.; Lin, X. Integrative transcriptomic and metabolomic data provide insights into gene networks associated with lignification in postharvest Lei bamboo shoots under low temperature. Food Chem. 2022, 368, 130822. [Google Scholar] [CrossRef] [PubMed]
  16. Wu, J.; Pan, H.L.; Du, Z.; Wang, S.; Shi, P.; Liu, X.; Xiao, W.; Li, M.H. Responses of Tissue Non-structural Carbohydrates and Leaf Nitrogen Contents to Altitude in Two Dwarf Bamboos in Wolong. Acta Ecol. Sin. 2010, 30, 610–618. [Google Scholar]
  17. Du, Y.; Lu, R.; Xia, J. Impacts of global environmental change drivers on non-structural carbohydrates in terrestrial plants. Funct. Ecol. 2020, 34, 1525–1536. [Google Scholar] [CrossRef]
  18. Trouvelot, S.; Héloir, M.C.; Poinssot, B.; Gauthier, A.; Paris, F.; Guillier, C.; Combier, M.; Trdá, L.; Daire, X.; Adrian, M. Carbohydrates in plant immunity and plant protection: Roles and potential application as foliar sprays. Front. Plant Sci. 2014, 5, 592. [Google Scholar] [CrossRef]
  19. Zeeman, S.C.; Kossmann, J.; Smith, A.M. Starch: Its metabolism, evolution, and biotechnological modification in plants. Annu. Rev. Plant Biol. 2010, 61, 209–234. [Google Scholar] [CrossRef]
  20. Li, B.; Zeng, Q.P.; Zeng, X.Y.; Li, H.Y.; Tan, L.; Zhou, X.Z.; Geng, Y.H.; Tong, L.; Ran, B.; Li, C.; et al. Taste quality and nutrient contents of shoots from seven bamboo species in Chongqing: Comparative study. World Bamboo Ratt. 2023, 21, 31–35. [Google Scholar]
  21. Peng, P.; She, D. Isolation, structural characterization, and potential applications of hemicelluloses from bamboo: A review. Carbohydr. Polym. 2014, 112, 701–720. [Google Scholar] [CrossRef]
  22. Wang, S.G.; Pu, X.L.; Ding, Y.L.; Wang, X.; Lin, S. Analysis on the nutrition in bamboo shoots of two types of Fargesia yunnanensis. J. Nanjing For. Univ. Nat. Sci. Ed. 2009, 33, 136–138. [Google Scholar]
  23. Zhang, P.; Fu, J.; Hu, L. Effects of alkali stress on growth, free amino acids and carbohydrates metabolism in Kentucky bluegrass (Poa pratensis). Ecotoxicology 2012, 21, 1911–1918. [Google Scholar] [CrossRef] [PubMed]
  24. Xu, Y.; Xiao, H.Y.; Zheng, N.J.; Zhang, Z.Y.; Qu, L.L. Progress on Responding of Free Amino Acid in Plants to Salt Stress. Environ. Sci. Technol. 2016, 39, 40–47. [Google Scholar]
  25. Chen, Z.A.; Geng, Y.Y.; Huang, S.; Lü, D.; Tang, J.; Wang, M.; Wang, D. Analysis and Comprehensive Evaluation of Nutritional Quality of Bamboo Shoots from Different Cultivars. Sci. Technol. Food Ind. 2023, 44, 262–268. [Google Scholar]
  26. Li, N.; Li, H.L.; Chen, Z.H.; Feng, J.Y.; Guo, T.S.; Guo, H.Y.; Zhang, X.L.; Yan, Y.; He, C.Z.; Zong, D. Transcriptome and metabolome based mechanisms revealing the accumulation and transformation of sugars and fats in Pinus armandii seed kernels during the harvesting period. J. Agric. Food Chem. 2024, 72, 21533–21547. [Google Scholar] [CrossRef]
  27. Pei, J.L.; Li, P.C.; Wang, Q.; Wang, S.G. Comparison of Bamboo Shoot Nutrients of Dendrocalamus brandisii among Different Provenances. J. Northwest For. Univ. 2018, 33, 156–161. [Google Scholar]
  28. Wu, X.; Huang, J.T.; Zhang, L.J. Optimization of Analytical Conditions for the Determination of Polysaccharide Content in Hazelnut by Phenol-Sulfuric Acid Method. J. Agric. Sci. Yanbian Univ. 2017, 39, 44–49. [Google Scholar]
  29. Martinez-Medina, A.; Flors, V.; Heil, M.; Mauch-Mani, B.; Pieterse, C.M.J.; Pozo, M.J.; Ton, J.; van Dam, N.M.; Conrath, U. Recognizing plant defense priming. Trends Plant Sci. 2016, 21, 818–822. [Google Scholar] [CrossRef]
  30. Reymond, P.; Weber, H.; Damond, M.; Farmer, E.E. Differential gene expression in response to mechanical wounding and insect feeding in Arabidopsis. Plant Cell 2000, 12, 707–719. [Google Scholar] [CrossRef]
  31. Gao, J.M.; Gao, S.H.; Gao, B.J. Effects of insect feeding and mechanical damages on metabolites in leaves of grape. Acta Agric. Boreali-Occident. Sin. 2019, 28, 1543–1551. [Google Scholar]
  32. Lastdrager, J.; Hanson, J.; Smeekens, S. Sugar signals and the control of plant growth and development. J. Exp. Bot. 2014, 65, 799–807. [Google Scholar] [CrossRef]
  33. Zhang, Y.R.; Bao, J.; Fu, J.; Yue, G.D. Effect of different insect state of Rhyzopertha dominica decay on starch content and pasting properties of wheat flour. Cereal Feed. Ind. 2016, 2, 14–18. [Google Scholar]
  34. Ma, X.Q.; Zhao, H.Y.; Deng, X.; Fan, H.; Wang, Q. The temporal variations of nutrients in the roots of Picea koraiensis seeding after simulating insect feeding. J. Northeast. For. Univ. 2013, 41, 24–25+29. [Google Scholar]
  35. Yang, M.; Xiao, G.L.; Zheng, Y.Q.; Chen, B.; Ren, J.H.; Huang, Y.; Wang, Y. Physiological responses of potato to potato tuber moth feeding infestation. J. South. Agric. 2020, 51, 844–852. [Google Scholar]
  36. Chen, W.; Zhou, Q.; Li, X.; He, G.F. Physiological responses of different rice cultivars under herbivore stress. Acta Ecol. Sin. 2006, 26(7), 2161–2166. [Google Scholar]
  37. Lampugnani, E.R.; Khan, G.A.; Somssich, M.; Persson, S. Building a plant cell wall at a glance. J. Cell Sci. 2018, 131, jcs207373. [Google Scholar] [CrossRef]
  38. Ornaghi, H.L.; Ornaghi, F.G.; de Carvalho Benini, K.C.; Bianchi, O. A comprehensive kinetic simulation of different types of plant fibers: Autocatalytic degradation mechanism. Cellulose 2019, 26, 7145–7157. [Google Scholar] [CrossRef]
  39. Scheller, H.V.; Ulvskov, P. Hemicelluloses. Annu. Rev. Plant Biol. 2010, 61, 263–289. [Google Scholar] [CrossRef]
  40. Su, S.Y.; Zhang, Z.Y.; Hu, C.M.; Liu, B.B.; Liu, J.F.; Wang, H.L.; Kou, J.; Wu, J.M. Effects of disease and insect pests on nutrient composition of mulberry leaves and economic characters of silkworm. J. Zhejiang Agric. Sci. 2024, 65, 2733–2737. [Google Scholar]
  41. Gonzales-Vigil, E.; Bianchetti, C.M.; Phillips, G.N.; Howe, G.A. Adaptive evolution of threonine deaminase in plant defense against insect herbivores. Proc. Natl. Acad. Sci. USA 2011, 108, 5897–5902. [Google Scholar] [CrossRef]
  42. Lin, K.; Yue, L.; Yuan, L.; Kang, K.; Zhang, Y.; Pang, R.; Zhang, W. Alanine metabolism mediates energy allocation of the brown planthopper to adapt to resistant rice. J. Adv. Res. 2024, 67, 25–41. [Google Scholar] [CrossRef]
  43. Smigocki, A.S.; Snezana, I.; Li, H.; Savić, J. Pest protection conferred by a Beta vulgaris serine proteinase inhibitor gene. PLoS ONE 2013, 8, e57303. [Google Scholar] [CrossRef] [PubMed]
  44. Tao, C.B.; Hu, G.W.; Zhou, R.X.; Teng, X.L.; Xiao, Z.; Zhao, H. Evaluation of Insect Responses of Different Rhododendron Species to Stephanitis pyriodes Scott Stress. North. Hortic. 2024, 19, 62–72. [Google Scholar]
  45. Zhang, K.; Wei, J.R.; Li, Z.; Yang, B.J.; Wang, J.X.; Su, Z. Defensive responses of Populus deltoides cl. Beikang to mechanical injury and Anoplophora glabripennis infection. Chin. J. Appl. Ecol. 2021, 32, 4139–4146. [Google Scholar]
  46. Slugina, A.M.; Shchennikova, V.A.; Kochieva, Z.E. Differences in the sucrose synthase gene SUS1 expression pattern between Solanum lycopersicum and wild tomato species. Theor. Exp. Plant Physiol. 2019, 31, 455–462. [Google Scholar] [CrossRef]
  47. Hong, P.J.; Zhang, Z.B.; Zhou, Y.Z.; Lu, X.Q.; Sadeghnezhad, E.; Pang, Q.Q.; Tao, Z.; Cheng, Y.X.; Wang, B.; Jia, H.F. Polygalacturonase inhibiting protein enhances cell wall strength of strawberry fruit for resistance to Botrytis cinerea infection. Sci. Hortic. 2024, 327, 112850. [Google Scholar] [CrossRef]
  48. Sun, Z.F.; Guo, T.T.; Liu, Y.; Liu, Q.; Fang, Y. The roles of Arabidopsis CDF2 in transcriptional and posttranscriptional regulation of primary microRNAs. PLoS Genet. 2015, 11, e1005598. [Google Scholar]
  49. Li, Y.Q.; Gao, H.; Jia, D.F.; Wang, H.L.; Zheng, K.X.; Xu, X.B. AGPS and BAM genes dramatically improve ‘Ganlv 1′ (Actinidia eriantha) fruit quality through starch metabolism during fruit development. Sci. Hortic. 2024, 329, 113004. [Google Scholar] [CrossRef]
Figure 1. Changes in physiological indices of bamboo shoots after mechanical damage treatment and insect feeding treatment. (A) water content; (B) starch content; (C) soluble sugar content; (D) cellulose content; (E) hemicellulose content; (F) lignin content; (G) total phenol content; (H) amino acid content; (I) protein content. W: mechanical damage treatment; W+Cy: insect feeding treatment. Lowercase letters represent differences within the W group, and uppercase letters represent differences within the W+Cy group. and * and ** represent differences between groups. * indicates p < 0.05 (significant difference), and ** indicates p < 0.01 (extremely significant difference).
Forests 16 01020 g001
Figure 2. (A) PCA plot; (B) cluster dendrogram; (C) statistical chart of differentially expressed genes.
Forests 16 01020 g002
Figure 3. Volcano plots. Based on the significantly differentially expressed genes in each comparison group, we performed a volcano plot analysis. The volcano plot can intuitively display the situation of differentially expressed genes between comparison groups. In the graph, the genes closer to both ends have a greater degree of difference (nodiff: no difference). (A) Volcano Plot of DEGs Between the W3h and W+Cy3h Groups; (B) Volcano Plot of DEGs Between the W6h and W+Cy6h Groups; (C) Volcano Plot of DEGs Between the W12h and W+Cy12h Groups; (D) Volcano Plot of DEGs Between the W24h and W+Cy24h Groups.
Forests 16 01020 g003
Figure 4. Classified secondary bar chart, map the transcripts of differentially expressed genes to the GO terms included in molecular function (MF), cellular component (CC), and biological process (BP) of the GO database, perform enrichment classification on the differentially expressed genes, and use the hypergeometric test to identify GO terms that are significantly enriched in the differentially expressed genes compared to the entire genome background. Yellow represents up-regulated genes in the comparison group, and blue represents down-regulated genes. (A) 3h GO Enrichment Bar Graph for DEGs in Biological Process, Molecular Function, and Cellular Component Ontologies; (B) 6h GO Enrichment Bar Graph for DEGs in Biological Process, Molecular Function, and Cellular Component Ontologies; (C) 12h GO Enrichment Bar Graph for DEGs in Biological Process, Molecular Function, and Cellular Component Ontologies; (D) 24h GO Enrichment Bar Graph for DEGs in Biological Process, Molecular Function, and Cellular Component Ontologies.
Forests 16 01020 g004aForests 16 01020 g004b
Figure 5. KEGG enrichment circle plots. First circle: top 20 enriched pathways with an external coordinate scale, indicating the number of differentially expressed genes. Different colors represent distinct A classes. Second circle: bar plots showing the number of genes in each pathway from the background of differentially expressed genes and their corresponding Q-values. Longer bars indicate larger gene counts, while redder colors signify smaller Q-values. Third circle: stacked bar plots displaying the proportions of up-regulated (dark purple) and down-regulated (light purple) differentially expressed genes. Numerical values are shown below. Fourth circle: rich factor values for each pathway (calculated as the number of differentially expressed genes in the pathway divided by the total number of genes in the pathway) with background gridlines at 0.1 intervals. (A) 3h KEGG Pathway Enrichment Circular Chart of DEGs in W vs W+Cy; (B) 6h KEGG Pathway Enrichment Circular Chart of DEGs in W vs W+Cy; (C) 12h KEGG Pathway Enrichment Circular Chart of DEGs in W vs W+Cy; (D) 24h KEGG Pathway Enrichment Circular Chart of DEGs in W vs W+Cy.
Forests 16 01020 g005
Figure 6. Network diagram. Based on the pathway enrichment information of differentially expressed genes, a network diagram was constructed using the interaction relationships between different pathways to facilitate the identification of core pathways. Each dot represents a pathway, and the lines connecting the dots indicate associations between two pathways. The larger the dot, the greater the number of differentially expressed genes enriched in that pathway. (A) At 3 h, the pathway interaction network diagram of the W and W+Cy groups; (B) At 6 h, the pathway interaction network diagram of the W and W+Cy groups; (C) At 12 h, the pathway interaction network diagram of the W and W+Cy groups; (D) At 24 h, the pathway interaction network diagram of the W and W+Cy groups.
Forests 16 01020 g006
Figure 7. Cluster heatmaps. The association strengths between key gene expression and physiological indices (cellulose, soluble sugar, and starch) at different time points (3 h, 6 h, 12 h, and 24 h) under two treatment groups (W and W+Cy).
Forests 16 01020 g007
Figure 8. Metabolic pathway diagram. Based on the KEGG pathway enrichment results, the starch and sucrose metabolism pathway is highlighted within the red dashed box, while the amino acid metabolism pathway (left) and flavonoid metabolism pathway (right) are enclosed within blue dashed boxes. The dots represent the fold-changes in differentially expressed genes. Solid lines represent direct synthesis, while dashed lines indicate that multiple synthetic steps are skipped.
Forests 16 01020 g008
Figure 9. qRT-PCR results verifying nine genes. SUS1—sucrose synthase; GLU11—hypothetical protein E2562-036697; PGIP—polygalacturonase inhibitor-like; CDF2—Dof protein; AGPS1—hypothetical protein GQ55-2G208400; GBE1—hypothetical protein E2562-028826; MPC4—hypothetical protein E2562-000990; MT3B—metallothionein-like protein; AGPS1—hypothetical protein GQ55-2G208400.
Forests 16 01020 g009
Disclaimer/Publisher’s Note: The statements, opinions and data contained in all publications are solely those of the individual author(s) and contributor(s) and not of MDPI and/or the editor(s). MDPI and/or the editor(s) disclaim responsibility for any injury to people or property resulting from any ideas, methods, instructions or products referred to in the content.

