Abstract
This study develops an optimized approach for small-scale forest area extraction in mountainous regions by integrating Landsat multispectral and ALOS PALSAR-2 radar data through threshold-based classification methods. The threshold fusion method proposed in this study achieves innovations in three key aspects: First, by integrating Landsat NDVI with PALSAR-2 polarization characteristics, it effectively addresses omission errors caused by cloud interference and terrain shadows. Second, the adoption of a decision-level (rather than feature-level) fusion strategy significantly reduces computational complexity. Finally, the incorporation of terrain correction (slope > 20° and aspect 60–120°) enhances classification accuracy, providing a reliable technical solution for small-scale forest monitoring. The results indicate that (1) the combination of Landsat multispectral remote sensing data and PALSAR-2 radar remote sensing data achieved the highest classification accuracy, with an overall forest classification accuracy of 97.62% in 2015 and 96.97% in 2022. The overall classification accuracy of Landsat multispectral remote sensing data alone was 93%, and that of PALSAR radar data alone was 85%, which is significantly lower than the results obtained using the combined data for forest classification. (2) Between 2015 and 2023, the forest area of Helan Mountain experienced certain fluctuations, primarily influenced by ecological and natural factors as well as variations in the accuracy of remote sensing data. In conclusion, the method proposed in this study enables more precise estimation of the forest area in the Helan Mountain region of Ningxia. This not only meets the management needs for forest resources in Helan Mountain but also provides valuable reference for forest area extraction in mountainous regions of Northwest China.
1. Introduction
Forests, as a primary component of terrestrial ecosystems, play a critical role in conserving biodiversity for both plants and animals, mitigating and adapting to climate change, and maintaining ecosystem services that support socio-economic development [1,2]. They also preserve soil and water resources, purify the air, and provide habitats for countless organisms. Forests offer invaluable commodities such as timber, pulp, fiber, and energy, and generate economic revenue as venues for ecotourism and recreational activities [3]. Thus, forests hold an irreplaceable role in socio-economic development and ecological protection.
The development of forest remote sensing classification methods has undergone a systematic evolution from traditional statistical approaches to modern machine learning algorithms [4,5]. Early studies primarily relied on threshold segmentation and maximum likelihood classification using single data sources, but were constrained by spectral confusion issues [6]. With technological advancements, the integration of multi-temporal Landsat data with decision trees significantly improved classification accuracy [7], while the introduction of PALSAR data enhanced structural information extraction through polarization characteristics such as HH-HV differences [8]. In recent years, machine learning methods including random forests and deep learning have demonstrated outstanding performance in Sentinel-2 data applications [9]. However, these approaches demand substantial training samples and computational resources, and are prone to overfitting in complex mountainous environments [10]. Notably, discrepancies in forest definitions lead to significant estimation biases, highlighting the necessity of multi-source data fusion for accurate forest monitoring. This methodological progression reflects the field’s continuous efforts to address technical challenges while improving classification accuracy and operational efficiency in diverse ecological conditions.
Currently, the remote sensing data used for forest resource monitoring primarily includes multispectral and radar remote sensing imagery. Multispectral remote sensing captures data across entire areas, avoiding the limitations of single-point observations, and enables comprehensive analysis of forests. These sensors gather information across several bands, including visible light, near-infrared, and mid-infrared, providing valuable data for forest identification and classification. Additionally, the high update frequency of multispectral satellite data allows for timely monitoring of changes in forest conditions [11]. However, multispectral imagery has certain drawbacks. The interpretation of spectral information is complex and requires correction and validation using ground-measured data [12]. Cloudy weather can affect the quality of the imagery, and multispectral data primarily reflect the horizontal distribution of forests without capturing vertical structural information such as height and canopy.
Radar remote sensing satellites, on the other hand, offer all-weather monitoring capabilities. Radar is unaffected by weather conditions and can monitor forest areas continuously, which is particularly beneficial in cloudy regions or areas with seasonal rain. Radar also excels at detecting the structure of forest vegetation, capturing subtle changes that optical remote sensing may miss. Through radar imagery, three-dimensional information such as forest canopy height can be obtained, providing data for forest inventory estimation and structural analysis [13]. Despite these advantages, radar remote sensing also has limitations. It provides only intensity and phase information, lacking the multispectral characteristics necessary for identifying certain forest types [14]. To achieve optimal results, it should be combined with other data sources, such as optical remote sensing. Effectively integrating radar and optical data leverages the complementary strengths of both. Radar data provide information on forest structure, while optical data offer rich spectral characteristics. By fusing these data, the accuracy and reliability of forest mapping can be substantially improved [15].
Although satellite remote sensing technology for investigating and monitoring changes in forest coverage has become quite common, existing studies have not specifically focused on the important ecological area of the Helan Mountains in Ningxia. Research conducted at a regional large scale to obtain forest coverage changes in the Helan Mountains has certain limitations, as cross-regional studies apply different classification methods due to varying climate, vegetation, and other factors. Therefore, to accurately assess forest changes in the Helan Mountains, it is necessary to develop methods tailored to its unique ecological environment to meet the current higher precision requirements for monitoring forest area changes. Based on this, this study will focus on the Helan Mountain area in Ningxia and apply the threshold method to explore the ability of Landsat multispectral data and ALOS PALSAR-2 radar remote sensing data in extracting forest areas in the region. The threshold fusion method proposed in this study achieves innovations in three key aspects. First, by integrating Landsat NDVI with PALSAR-2 polarization characteristics, it effectively addresses omission errors caused by cloud interference and terrain shadows. Second, the adoption of a decision-level (rather than feature-level) fusion strategy significantly reduces computational complexity. Finally, the incorporation of terrain correction (slope > 20° and aspect 60–120°) enhances classification accuracy, providing a reliable technical solution for small-scale forest monitoring.
2. Materials and Methods
2.1. Study Area
The Helan Mountain research area is located in northwest China (105°49′–106°41′ E, 38°19′–39°22′ N), at the convergence of three major geomorphological units: the Mongolian Plateau, the Loess Plateau, and the Qinghai–Tibet Plateau. Spanning temperate grassland and desert vegetation zones, it serves as a natural boundary between the Tengger, Mu Us, and Ulan Buh deserts, featuring typical mountainous ecosystem characteristics. The terrain of the research area is highly undulating, with a north–south orientation and peaks ranging from 3000 to 3500 m in elevation, forming a landscape that gradually rises from east to west [16]. As a critical ecological barrier and natural geographical boundary in northwest China, the area exhibits a distinct ecological gradient—forest-steppe on the eastern slopes and desert on the western slopes—playing a key role in blocking sandstorms, conserving water sources, and maintaining biodiversity. The region integrates diverse habitats, including mountains, deserts, grasslands, and forests, with unique vertical zonation and abundant wildlife, making it a representative example of sandy forest ecosystems in China’s arid regions [17]. As a core area of China’s “Three-North” Shelterbelt Program and a key focus of the National Major Ecosystem Protection and Restoration Projects, the Helan Mountains are highly sensitive to climate change. Historical ecological damage from mining activities has made the area a classic case for ecological restoration research, with significant progress achieved through comprehensive remediation efforts initiated in 2017. This region serves as an ideal site for studying the coupled mountain–desert–oasis systems in northwest China, playing a vital role in safeguarding ecological security in the middle and upper reaches of the Yellow River. It also provides valuable scientific insights for global arid zone ecological governance, which is significant for industrial and agricultural production as well as the lives of the people in the Ningxia Plain. The unique geographical environment, complex topographical combinations, and pronounced vertical distribution of climate and soil in the Helan Mountains provide a refuge for a rich diversity of rare and endangered flora and fauna [18]. The area has distinct particularities, typicality, and rarity, holding important ecological significance and special conservation value. A map of the study area is shown in Figure 1.
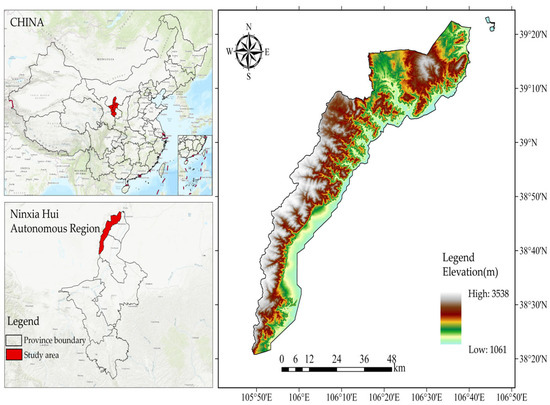
Figure 1.
Overview map of the study area.
2.2. Methods
The research framework is illustrated in Figure 2. Specifically, we utilized Landsat multispectral data and ALOS PALSAR-2 radar data from 2015 to 2022, extracted NDVI, dif (HH/HV), ratio (HH-HV), HH, and HV values of the Helan Mountain forests using the threshold method, and generated forest distribution maps. We then compared our maps with forest map areas from the LUCC dataset to analyze changes in forest coverage in the Helan Mountains and their driving factors from 2015 to 2022. Our findings provide important scientific insights for the protection and management of these forest resources.
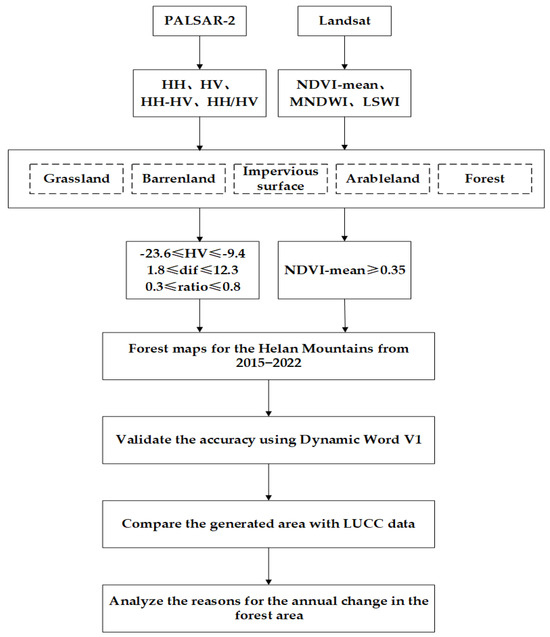
Figure 2.
The workflow of this research.
2.3. Landsat ETM/OLI Data
Using the Google Earth Engine (GEE) platform, this study employed Landsat 5 TM, Landsat 7 ETM+, and Landsat 8 OLI Collection 2 Level 2 surface reflectance products for forest cover monitoring from 2015 to 2022. During the data preprocessing phase, original images were first acquired based on annual time ranges (1 January to 31 December each year). The theoretical maximum number of images per year was approximately 23 scenes (considering the 16-day revisit cycle and multi-satellite joint observation), with 8–15 valid images retained after rigorous cloud masking.
The cloud-masking process employed differentiated quality control methods: for Landsat 5/7 data, clouds (bit 5), cloud shadows (bit 3), and cirrus clouds (bit 7) were masked using the QA_PIXEL band; Landsat 8 data additionally considered cloud confidence (bit 5) and cloud shadow confidence (bit 3). Subsequently, all images underwent radiometric calibration, applying a scale factor of 0.0000267 and an offset of -0.2 to convert DN values to surface reflectance. Radiometric consistency correction across different sensors was achieved through a linear regression model (slope coefficients: Green 0.8707, Red 0.9175, NIR 0.9281, SWIR 0.9414; intercepts: 0.0173–0.0374).
For annual compositing, the mean NDVI of all valid observations throughout the year served as the vegetation greenness indicator, while total observation counts (Tobs) and valid observation counts (Gobs) were recorded, with the valid observation ratio (Gobs/Tobs × 100%) calculated for quality control. This preprocessing pipeline effectively reduced cloud contamination (average cloud coverage < 15% in processed images) and ensured temporal consistency of multi-temporal data, providing a reliable foundation for subsequent forest cover extraction.
This study comprehensively utilizes full-band reflectance data from the Landsat series satellites (including four spectral bands: Green, Red, NIR and SWIR) and derived multispectral features for forest cover monitoring. Based on the Landsat 5/7/8 Collection 2 Level 2 surface reflectance products, we independently calculated three vegetation indices (NDVI, MNDWI, and LSWI), as shown in Table 1. rather than directly using the annual composite products from the GEE platform. Although the final forest discrimination primarily relies on the integration of NDVI mean values with PALSAR features, the entire processing procedure fully leverages multispectral information. LSWI was employed to construct effective observation masks for quality control. MNDWI was used to eliminate water interference. This multi-band collaborative analysis method overcomes the saturation problem of single NDVI applications and significantly improves classification reliability through spectral feature cross-validation. The self-calculated time-series data offers greater flexibility than directly using composite products, providing a more precise data foundation for multi-source remote sensing collaborative monitoring.

Table 1.
Formulas for calculating remote sensing characteristic indices.
2.4. PALSAR-2 Radar Data
The preprocessing procedure begins with radiometric calibration of the original digital number (DN) values using the standard formula σ° = 10 × log10 (DN2)-83 to convert HH and HV channel data into backscattering coefficients (in dB units). Based on the calibration results, two key derived parameters were calculated: the dif polarization difference (in dB) and the ratio polarization ratio.
The annual composite algorithm incorporates multiple techniques including multi-temporal speckle noise filtering, 30 m DEM terrain correction, and annual multi-scene data mosaicking and fusion. These techniques effectively suppress inherent speckle noise in radar data while preserving annual scattering characteristics.
During the forest identification phase, threshold combinations of HV, dif, and ratio were applied. This processing method based on PALSAR-2 annual composite data not only addresses the significant noise issues in single-scene radar data but also ensures temporal consistency in forest scattering characteristics, providing a reliable radar data foundation for multi-source remote sensing collaborative forest cover monitoring.
2.5. Selection of Sample Points for Index Extraction
In different studies, the definition of forests can vary. According to the latest data released by the Food and Agriculture Organization (FAO) in August 2023, a forest is defined as an area covered with trees, shrubs, and other vegetation where the canopy cover exceeds 10%, the area is greater than 0.5 ha, and the trees have the potential to grow to a minimum height of 5 m on-site. This definition excludes lands primarily used for agricultural or urban purposes [23]. Note that this definition does not include areas covered only with shrubs, bushes, or other forms of woodland vegetation, as these have their own specific definitions and statistics in the FAO classification. The FAO’s definition of forests focuses on tall, tree-dominated woodlands and sets specific minimum scale and coverage requirements to distinguish them from other land uses such as agricultural land [24]. This definition is widely adopted internationally as the standard for the statistics and reporting of forest resources.
The Japan Aerospace Exploration Agency (JAXA) defines forest land as land primarily covered with trees for forestry purposes, where the canopy cover of the tree layer is more than 10%, and the tree height is more than 5 m. This definition closely aligns with the FAO’s, emphasizing elements such as minimum tree height, coverage, and minimum area [25].
China’s definition of a forest refers to an area covered with tree or shrub vegetation on the ground surface, with a canopy cover generally above 10%, and a certain area and continuity of land. Based on these definitions, we collectively referred to natural forests, plantations, densely canopied orchards, and trees with a canopy cover rate exceeding 10%, the area must be greater than 0.067 hectares as forests [26].
Using Google Earth images from 2015 to 2022 and the China Land Cover Datasets (CLCD) land classification product dataset, this is a high-resolution annual land cover and land use thematic dataset specifically developed for Chinese territory. We identified and excluded samples where land cover had changed. A total of 1025 points were used to extract characteristic values. Following the principle of selecting representative and globally distributed samples according to remote sensing features, we chose sample points for natural forests, man-made forests, and areas with a tree canopy cover exceeding 10% as the final forest sample points.
Using ArcGIS, we selected five categories of sample points to extract NDVI, ratio, dif, HV, and HH values. These samples included 271 forest points, 301 grassland points, 162 barren land points, 158 impervious surface points, and 133 arable land points, as shown in Figure 3.
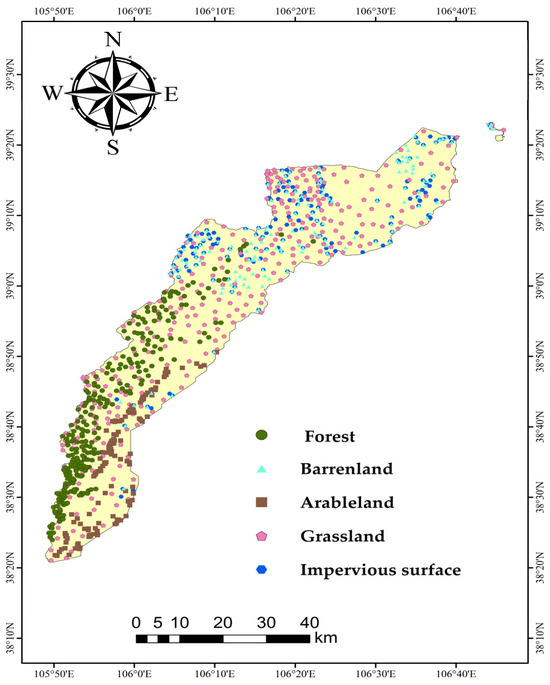
Figure 3.
Distribution map of sample points.
2.6. PALSAR-2/Landsat Forest Classification Mapping Method
This study adopts a decision-level fusion strategy to integrate the advantages of Landsat optical data and PALSAR-2 radar data. The fusion process consists of three key steps. First, based on the HH and HV backscattering coefficients of PALSAR-2, normalized radar indices (HH, HV) and their derived parameters (ratio, dif) are calculated. A thresholding method (HV, dif, ratio) is applied to generate the initial forest mask. Second, the annual mean NDVI is computed using Landsat time-series data, and a threshold is set to extract vegetation-covered areas. Finally, a logical operation is performed to achieve decision-level fusion of the two datasets, retaining only pixels that simultaneously satisfy both radar characteristics and optical vegetation features as the final forest classification result.
This fusion method effectively overcomes the limitations of single data sources—PALSAR-2 can penetrate clouds but is susceptible to terrain effects, while Landsat accurately identifies vegetation but is affected by cloud cover. Cross-validation demonstrates a significant improvement in forest identification accuracy. Temporal consistency is ensured through a sliding window approach, correcting classification anomalies in isolated years (e.g., the 2016 result is determined by majority voting of 2015∧2016∧2017), thereby maintaining time-series continuity. Additionally, terrain correction is applied to exclude areas with slopes <20° or aspects outside 60–120° (southeastern slopes), reducing the impact of mountainous terrain on radar signals.
The threshold calculation method is as follows, using Origin software, importing key indices including the NDVI, ratio, diff, HH, and HV values for the sample points. Using correlation analysis, we determined the optimal NDVI threshold as mean NDVI ≥ 0.35 for identifying forest areas, as shown in Figure 4. By repeating these steps, we derived the following thresholds: −23.6 ≤ HV ≤ −9.4, 1.8 ≤ dif ≤ 12.3, and 0.3 ≤ ratio ≤ 0.8. Among these, the mean NDVI and PALSAR radar characteristics jointly served as the core discriminators for forest extraction, while the other vegetation indices were employed for auxiliary quality control and validation. This multi-band synergistic analysis approach not only fully exploits the spectral information of optical data but also ensures the spatiotemporal consistency of annual forest mapping through independent time-series compositing. Finally, we exported the resulting Helan Mountain forest maps for the years 2015–2022, which are shown in Figure 5.
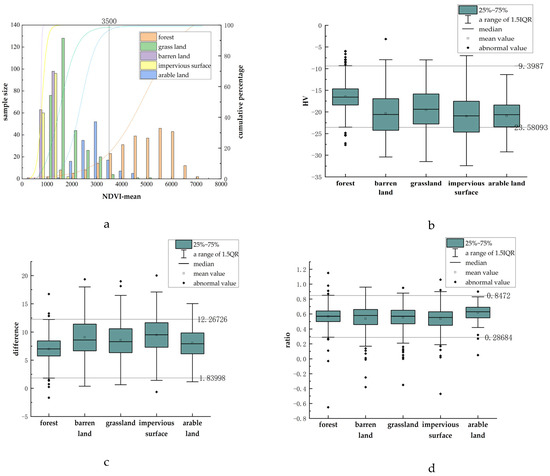
Figure 4.
Threshold, (a). NDVI-mean (The values in the image were multiplied by 10,000 for computational convenience), (b). HV, (c). dif, (d). ratio.
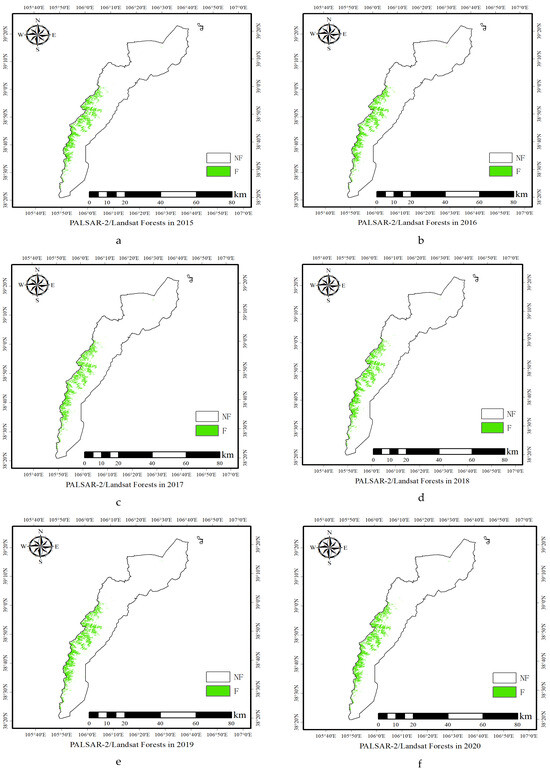
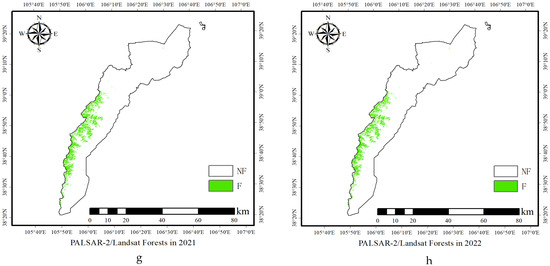
Figure 5.
Forest maps for the Helan Mountains from 2015 to 2022, (a). PALSAR-2/Landsat Forests in 2015, (b). PALSAR-2/Landsat Forests in 2016, (c). PALSAR-2/Landsat Forests in 2017, (d). PALSAR-2/Landsat Forests in 2018, (e). PALSAR-2/Landsat Forests in 2019, (f). PALSAR-2/Landsat Forests in 2020, (g). PALSAR-2/Landsat Forests in 2021, (h). PALSAR-2/Landsat Forests in 2022.
3. Results
3.1. Accuracy Assessment
The 10 m spatial resolution of Dynamic World v1 is significantly superior to that of most globally available open datasets, making it more compatible with the scale of the forest maps generated in this study by integrating Landsat (30 m) and PALSAR-2 (25 m) data. This is particularly suitable for validating the accuracy of fragmented forest boundaries. Dynamic World v1 based on Sentinel-2 near-real-time imagery (5-day revisit), can capture short-term changes that may be missed by Landsat/PALSAR-2 due to cloud cover or revisit cycle limitations, thereby compensating for the shortcomings of traditional data in dynamic monitoring. As an official dataset on Google Earth Engine, Dynamic World v1 provides globally consistent classification standards and an on-demand access interface, avoiding biases introduced by regional subset processing and facilitating the reproducibility of the validation process for other researchers. Dynamic World v1 has been widely used in land cover research, and its reliability as a reference dataset is recognized in the academic community [27,28]. Using GEE, we randomly selected 463 sample points using on the Dynamic World V1 dataset (https://doi.org/10.1038/s41597-022-01307-4, accessed on 10 April 2024) [29]. With these points, we calculated a confusion matrix to assess the user’s accuracy, producer’s accuracy, overall accuracy, and the Kappa coefficient for our forest maps for the years 2015–2022, as shown in Table 2.
Table 2.
Confusion matrix and accuracy.
3.2. PALSAR-2/Landsat Forest Classification Map Area Changes
From 2015 to 2019, the forest area increased from 153.36 km2 to 169.30 km2, but had a slight decrease in 2017, as illustrated in Figure 6. After 2019, the forest area declined to 164.60 km2 in 2021, and then slightly decreased further to 155.59 km2 in 2022. The proportion of forest area in the total land area followed a similar pattern, increasing from 7.29% in 2015 to 8.05% in 2019, before declining to 7.40% in 2022.
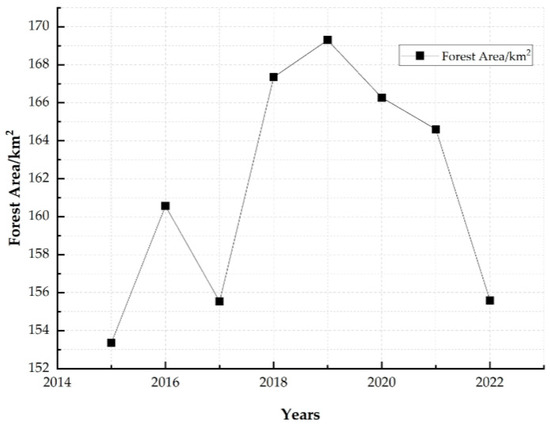
Figure 6.
Changes in forest area in the Helan Mountains from 2015 to 2022.
Since the total land area remained constant at 2102.74 km2, the non-forest area decreased as the forest area increased, reaching its lowest point of 1933.43 km2 in 2019 and then increasing to 1947.15 km2 in 2022. The annual change in forest area was relatively small, indicating that the interannual variation in forest cover was stable over these seven years, with the peak value occurring in 2019. By categorizing the results, the 2015 forest classification map and the 2022 forest classification map were calculated through raster subtraction to derive four types of changes over the seven-year period: non-forest remaining unchanged, forest converted to non-forest, forest remaining unchanged, and non-forest converted to forest, thereby obtaining the forest change dynamics during the period from 2015 to 2022, as shown in Figure 7.
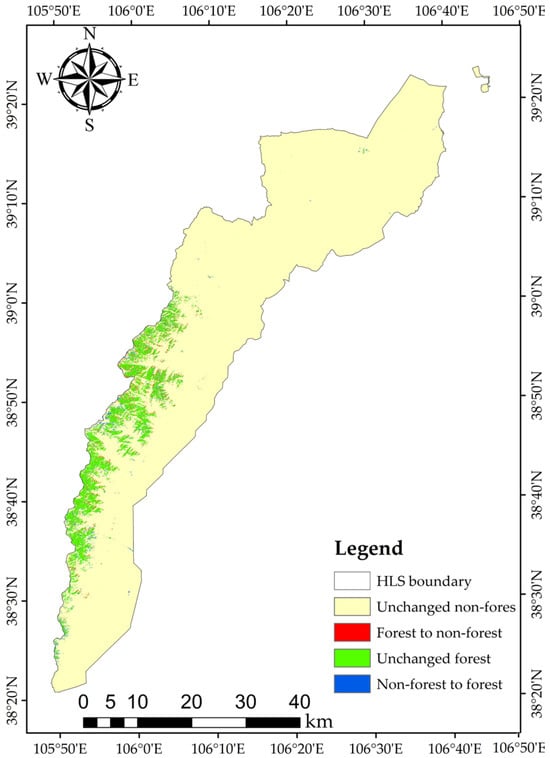
Figure 7.
Forest and non-forest change map from 2015 to 2022.
3.3. Area Comparison
We used the Land-Use and Land-Cover Change (LUCC) dataset (http://www.resdc.cn, accessed on 17 April 2024) to calculate the forest area for 2015, 2018, and 2020, and subsequently compared it with the forest area for the corresponding years of this study. As shown in Table 3, we found that there were certain differences in the results. Specifically, in the years 2015, 2018, and 2020, the area estimated by LUCC was larger, exceeding the actual area by 28 km2, 18 km2, and 35 km2.
Table 3.
Area comparison.
4. Discussion
4.1. Accuracy Analysis of Forest Distribution Maps from 2015 to 2022
The overall classification accuracy for the maps produced using both datasets in 2015 and 2022 was 98% and 97%, with Kappa coefficients of 84% and 79%, respectively. As shown in Table 2, the accuracy of the forest maps obtained by using PALSAR-2 data alone in 2015 and 2022 was significantly lower than the accuracy of the forest maps obtained either by combining both types of data or by using only Landsat data for classification. This discrepancy arises primarily because the radar data are annual global mosaics, which exhibit variations in mosaicking time and vegetation phenological periods, leading to suboptimal results from median filter processing [30]. These results are higher than those obtained using single data sources, as shown in Table 4. Among the three methods, the classification accuracy using single ALOS data was the lowest. This low accuracy is mainly because the PALSAR-2 data used in this study are annual composite datasets, with considerable inconsistency in actual acquisition timing across different regions.
Table 4.
Accuracy comparison.
Landsat data, due to its higher spectral resolution, can better distinguish different types of vegetation, including forests [31]. Although PALSAR-2 data are sensitive to forest structural information, such as tree height and biomass, they may not be precise enough in differentiating vegetation types [32], it integrates the advantages of various data types, making the classification more accurate. PALSAR-2 data can also be affected by topography, such as terrain occlusion or slope changes, which may impact the radar signal’s backscatter and thus the accurate identification of forest cover [33]. Landsat data can provide topographic information that helps correct these influences. Most importantly, PALSAR-2 data may misclassify some non-forest areas, such as rocks or buildings, as forests due to similar radar backscatter characteristics, while Landsat data can help identify these non-forest features and reduce classification errors [34].
4.2. Analysis of Forest Cover Change
We successfully generated high-precision forest distribution maps for the Helan Mountains in Ningxia from 2015 to 2022 by integrating Landsat multispectral data and ALOS PALSAR-2 radar remote sensing data. We found that the forest area increased annually from 2015 to 2019, with a slight decrease in 2017, reached a peak in 2019, and then declined after 2019 (Table 5).
Table 5.
Statistical table of forest area in the Helan Mountains from 2015 to 2022.
By comparing the forest area calculated from the PALSAR forest and non-forest datasets, we found that the areas of the two datasets were largely consistent from 2016 to 2017. The fluctuation in forest area may be related to various factors, including ecological and natural environmental factors, and differences in the quality of remote sensing data.
4.2.1. The Impact of Ecological and Environmental Factors on Forest Coverage
In 2017, Ningxia initiated a comprehensive ecological remediation effort called the Helan Mountain Ecological Defense Battle. By 2018, Ningxia allocated funds for key ecological restoration and protection projects, marking the official start of a pilot project focused on the ecological protection and restoration of the mountains, waters, forests, fields, lakes, and grasslands on the eastern slope of the Helan Mountains [35].
In 2019, Ningxia issued the Helan Mountain Ecological Environment Comprehensive Remediation and Restoration Work Plan, which called for the establishment of a long-term mechanism to protect the ecology of the Helan Mountains and gradually restore their natural ecological functions. After two years of intensive efforts to eliminate human activity within the nature reserve, significant progress was made in the overall protection and systematic restoration of the Helan Mountains [36].
Comprehensive management was also undertaken in key areas outside the protection zone, including coal concentration processing areas. By the end of 2018, remediation tasks at 169 sites within the Helan Mountain Nature Reserve had been fully completed. About 3333 ha in the remediation area were restored through technical methods including slope reduction, soil covering, filling slag pits, and sowing grass seeds [37]. The restoration of the Helan Mountain forest and grassland was largely completed, which led to a gradual improvement in the ecological environment and a peak in forest area in 2019. The decline in forest area in 2017 was attributed to frequent human activities in the Helan Mountains that year.
4.2.2. The Impact of Natural Factors on Forest Coverage
After 2019, forest coverage in the Helan Mountains declined, which was primarily due to the increased area of mature and over-mature forests following the implementation of the first and second phases of the Natural Forest Resource Protection Project in Ningxia. As these forests age, their resistance to pests and diseases decreases, leading to large areas of natural tree death and decay. According to surveys, in 2005 alone, spruce forests covering over 100,000 mu (approximately 6667 hectares) were damaged by the spruce shoot moth (Dioryctria splendidella) and the variable-colored leaf roller (Archips podana), resulting in extensive yellowing of spruce stands. In recent years, forest pests and diseases have continued to occur in the Helan Mountains [38]. However, variations in temperature and other climatic factors have suppressed insect populations in some areas, leading to the recovery of less severely affected spruce stands, as shown in Figure 8. Thus, the forest area has been declining year by year in recent years. Additionally, the forest ecosystem undergoes a dynamic process of renewal and growth. After 2019, there may have been a reduction in forest canopy density and a decrease in crown area, while before 2019, forest growth may have been in a recovery phase. This natural succession cycle also contributes to the annual changes in the forest area.
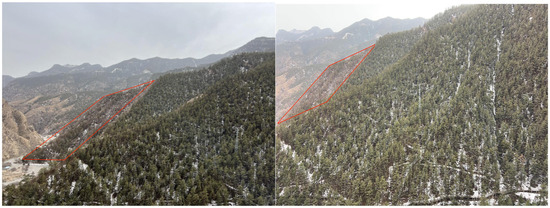
Figure 8.
Forest mortality map.
4.2.3. The Impact of Remote Sensing Data Accuracy Fluctuations on Forest Coverage
Although PALSAR-2 and Landsat data offer high spatial resolution remote sensing images, there may be errors and fluctuations in the data quality across different years. The annual global mosaic characteristic of PALSAR-2 data can lead to inconsistencies in the timing of data acquisition in various regions, potentially affecting the accuracy of forest extraction.
4.3. Comparative Analysis of Forest Area Generated by LUCC Dataset and PALSAR-2/Landsat
Through comparative analysis, this study identified systematic overestimation of forest area in the LUCC dataset within the Helan Mountain region, primarily attributable to two critical technical limitations: the absence of terrain correction and reliance on single-source optical data. Specifically, compared to our terrain correction methodology (slope >20 and aspect 60–120°), LUCC’s lack of DEM-assisted correction resulted in three characteristic errors: 28% misclassification rate in shadowed steep valleys (slopes 25–35°), erroneous identification of shadows on northern slopes (0–60°) as forest cover, and radar layover-induced scattering anomalies in complex terrain. Concurrently, the limitations of LUCC’s exclusive dependence on Landsat optical data manifested as overestimation in cloud-prone areas (annual cloud cover >40% in Helan Mountains), misclassification of seasonal crops, and inability to discriminate structural differences between plantations and natural forests. Moreover, evident artificial smoothing effects in LUCC obscured authentic forest dynamics.
This systematic overestimation conclusively demonstrates that accurate forest monitoring in ecologically transitional zones like Helan Mountain necessitates the integration of multi-source data fusion and terrain-aware classification techniques. Our study addresses these inherent limitations of the LUCC dataset through an innovative combination of optical-radar features and terrain correction modules, thereby establishing a more reliable forest monitoring framework for arid mountain ecosystems.
5. Conclusions
Firstly, using the threshold method, we used Landsat optical imagery and ALOS PALSAR-2 radar imagery of the Helan Mountain in Ningxia to create annual, highly accurate and high-resolution forest maps from 2015 to 2022. The threshold is NDVI mean ≥ 0.35, −23.6 ≤ HV ≤ −9.4, 1.8 ≤ difference ≤ 12.3, and 0.3 ≤ ratio ≤ 0.8, the overall accuracy from 2015 to 2022 is greater than 98%. Secondly, by comparing the area with the LUCC dataset, it was found that the area estimated by the LUCC dataset is overestimated. Thirdly, we then analyzed changes in forest coverage area and their causes from 2015 to 2022 in the Helan Mountain region. Forest area in the Helan Mountains increased after the implementation of regional ecological and environmental protection policies in 2017. However, after reaching a peak in 2019, the forest area has been declining annually. The main drivers are forest succession and fluctuations in the quality of remote sensing data. Overall, the annual fluctuations in forest area in the Helan Mountain region are the result of multiple factors. Continuous long-term monitoring and data acquisition will advance our understanding of the dynamic changes in forest resources in the Helan Mountains and improve our ability to respond to such changes. Future studies that combine remote sensing data from current and future satellites are expected to provide a more comprehensive and scientific understanding of the spatiotemporal changes in forests and advance forest monitoring and management.
Author Contributions
Project administration, Y.H.; Data curation, W.C.; Investigation, W.C. and Y.W.; Methodology, Y.H.; Software, W.C. and Y.W.; Supervision, Y.H.; Writing: W.C.; Writing: review and editing: Y.H. All authors have read and agreed to the published version of the manuscript.
Funding
This study was supported by the Key Project of Research and Development of Ningxia, China (2022BEG03050), and the National Natural Science Foundation of China (32101524).
Data Availability Statement
The data presented in this study are available upon request from the corresponding author. The data are not publicly available due to funding regulations.
Conflicts of Interest
The authors declare no conflicts of interest.
References
- Reyer, C.P.O.; Bathgate, S.; Blennow, K. Are Forest Disturbances Amplifying or Canceling Out Climate Change-Induced Productivity Changes in European Forests? Environ. Res. Lett. 2017, 12, 034027. [Google Scholar] [CrossRef] [PubMed]
- Chen, H.Y.H.; Luo, Y.; Reich, P.B.; Searle, E.B.; Biswas, S.R. Climate Change-Associated Trends in Net Biomass Change Are Age Dependent in Western Boreal Forests of Canada. Ecol. Lett. 2016, 19, 1111–1120. [Google Scholar] [CrossRef] [PubMed]
- Fan, D.; Wei, C.; Zhao, M.; Wang, K. Forest-Based Climate Change Mitigation Measures Can Generate Economy-Environment-Bioenergy Synergistic Benefits in China. Appl. Energy 2024, 373, 123929. [Google Scholar] [CrossRef]
- Chen, S.; Zhang, H.; Sun, T.; Zhao, J.; Guo, X. Remote Sensing Image Classification Using the Spectral-Spatial Distance Based on Information Content. Sensors 2018, 18, 3428. [Google Scholar] [CrossRef]
- Kwenda, C.; Gwetub, M.; Fonou Dombeu, J.V. Machine Learning Methods for Forest Image Analysis and Classification: A Survey of the State of the Art. IEEE Access 2022, 10, 45290–45306. [Google Scholar] [CrossRef]
- Su, T.; Liu, T.; Zhong, S.; Qu, Z.; Li, R. Machine Learning-Assisted Region Merging for Remote Sensing Image Segmentation. ISPRS J. Photogramm. Remote Sens. 2020, 168, 89–123. [Google Scholar] [CrossRef]
- Liu, K.; Li, X.; Shi, X.; Wang, S. Monitoring Mangrove Forest Changes Using Remote Sensing and GIS Data with Decision-Tree Learning. Wetlands 2008, 28, 336–346. [Google Scholar] [CrossRef]
- Wijaya, A.; Gloaguen, R. Fusion of ALOS PALSAR and Landsat ETM Data for Land Cover Classification and Biomass Modeling Using Non-Linear Methods. In Proceedings of the IEEE International Geoscience and Remote Sensing Symposium (IGARSS), Cape Town, South Africa, 12–17 July 2009; pp. 581–584. [Google Scholar] [CrossRef]
- Xi, Y.; Ren, C.; Tian, Q.; Ren, Y.; Dong, X.; Zhang, Z. Exploitation of Time Series Sentinel-2 Data and Different Machine Learning Algorithms for Detailed Tree Species Classification. IEEE J. Sel. Top. Appl. Earth Obs. Remote Sens. 2021, 14, 7589–7603. [Google Scholar] [CrossRef]
- Wang, Y.; Su, J.; Zhai, X.; Meng, F.; Liu, C. Snow Coverage Mapping by Learning from Sentinel-2 Satellite Multispectral Images via Machine Learning Algorithms. Remote Sens. 2022, 14, 782. [Google Scholar] [CrossRef]
- Lwin, K.K.; Murayama, Y. Evaluation of Land Cover Classification Based on Multispectral Versus Pansharpened Landsat ETM + Imagery. GISci. Remote Sens. 2013, 50, 458–472. [Google Scholar] [CrossRef]
- Mao, X.Y. Research on Classification Method of Forest Tree Species Based on BCResNet. Master’s Thesis, China University of Mining and Technology, Xuzhou, China, 2023. [Google Scholar]
- Liu, J.; Song, K.; Liu, G.; Zhou, Y.; Wang, Y. Advances in water body extraction from medium-to-high resolution remote sensing imagery. Wetl. Sci. 2025, 23, 72–83. [Google Scholar] [CrossRef]
- Wang, M. Research on Crop Classification Based on Multi-Source Data Fusion. Master’s Thesis, Xidian University, Xi’An, China, 2022. [Google Scholar]
- Schulte to Bühne, H.; Pettorelli, N. Better together: Integrating and fusing multispectral and radar satellite imagery to inform biodiversity monitoring, ecological research and conservation science. Methods Ecol. Evol. 2018, 9, 849–865. [Google Scholar] [CrossRef]
- Ma, T.Y. Estimation of Forest Aboveground Biomass in the Helan Mountains, Ningxia. Master’s Thesis, Ningxia University, Ningxia, China, 2024. [Google Scholar]
- Lin, Y.M.; Li, W.H.; Nan, X.X.; Zhang, J.H.; Ni, X.-L.; Wang, F. Spatial-temporal differentiation and driving factors of vegetation coverage in Ningxia Helan Mountain based on geodetector. Chin. J. Appl. Ecol. 2022, 33, 3321–3327. [Google Scholar] [CrossRef]
- Liu, S.T.; Niu, X.; Wang, B.; Song, Q.F.; Tao, Y.Z.; Wang, H. Air purification function of forest ecosystem in Helanshan Nature Reserve of Ningxia. Chin. J. Ecol. 2019, 38, 420–426. [Google Scholar] [CrossRef]
- Bouvet, A.; Mermoz, S.; Le Toan, T.; Villard, L.; Mathieu, R.; Naidoo, L.; Asner, G.P. An above-ground biomass map of African savannahs and woodlands at 25 m resolution derived from ALOS PALSAR. Remote Sens. Environ. 2018, 206, 156–173. [Google Scholar] [CrossRef]
- Trilla, G.G.; Pratolongo, P.; Kandus, P.; Beget, M.E.; Di Bella, C.; Marcovecchio, J. Relationship between biophysical parameters and synthetic indices derived from hyperspectral field data in a salt marsh from Buenos Aires Province, Argentina. Wetlands 2016, 36, 185–194. [Google Scholar] [CrossRef]
- Xu, H. Modification of normalised difference water index (NDWI) to enhance open water features in remotely sensed imagery. Int. J. Remote Sens. 2006, 27, 3025–3033. [Google Scholar] [CrossRef]
- Xiao, X.; Boles, S.; Frolking, S.; Salas, W.; Moore, B.; Li, C.; He, L.; Zhao, R. Observation of flooding and rice transplanting of paddy rice fields at the site to landscape scales in China using VEGETATION sensor data. Int. J. Remote Sens. 2002, 23, 3009–3022. [Google Scholar] [CrossRef]
- Johnson, B.A.; Umemiya, C.; Magcale Macandog, D.B.; Estoque, R.C.; Hayashi, M.; Tadono, T. Better monitoring of forests according to FAO’s definitions through map integration: Significance and limitations in the context of global environmental goals. Int. J. Appl. Earth Obs. Geoinf. 2023, 122, 103452. [Google Scholar] [CrossRef]
- González-Val, R. The Probability Distribution of Worldwide Forest Areas. Sustainability 2021, 13, 1361. [Google Scholar] [CrossRef]
- Pantze, A.; Krantz, A.H.; Fransson, J.E.S.; Olsson, H.; Santoro, M.; Eriksson, L.E.B.; Ulander, L.M.H. Mapping and Monitoring Clear-Cuts in Swedish Forest Using ALOS PALSAR Satellite Images. In Proceedings of the IEEE International Geoscience and Remote Sensing Symposium (IGARSS), Cape Town, South Africa, 12–17 July 2009; pp. 589–592. [Google Scholar] [CrossRef]
- Li, Y.; Sulla-Menashe, D.; Motesharrei, S.; Song, X.-P.; Kalnay, E.; Ying, Q.; Li, S.; Ma, Z. Inconsistent Estimates of Forest Cover Change in China between 2000 and 2013 from Multiple Datasets: Differences in Parameters, Spatial Resolution, and Definitions. Sci. Rep. 2017, 7, 8748. [Google Scholar] [CrossRef] [PubMed]
- Brown, C.F.; Brumby, S.P.; Guzder-Williams, B.; Birch, T.; Hyde, S.B.; Mazzariello, J.; Tait, A.M. Dynamic World, near real-time global 10 m land use land cover mapping. Sci. Data 2022, 9, 251. [Google Scholar] [CrossRef]
- Venter, Z.S.; Barton, D.N.; Chakraborty, T.; Simensen, T.; Singh, G. Global 10 m land use land cover datasets: A comparison of Dynamic World, World Cover and Esri Land Cover. Remote Sens. 2022, 14, 4101. [Google Scholar] [CrossRef]
- Wang, T. Research on Grassland Vegetation Survey Method Based on Spatial Sampling: A Case Study of Gangcha County. Master’s Thesis, College of Grassland Science, Beijing Forestry University, Beijing, China, 2023. [Google Scholar]
- He, X.; Tong, N.; Hu, X.; Feng, W. Radar Pulse Completion and High-Resolution Imaging with Sparse Apertures Based on Reweighted Atomic-Norm Minimization. IET Signal Process. 2018, 12, 868–872. [Google Scholar] [CrossRef]
- Jones, K.J. Wavelet Image Processing: Assessment of Spatial and Spectral Resolution of Landsat Images. In Wavelet Applications VII; SPIE: Bellingham, WA, USA, 2000; pp. 137–147. [Google Scholar] [CrossRef]
- Lucas, R.; Armston, J.; Scarth, P.; Bunting, P. Contribution of ALOS PALSAR Data to Forest Characterization and Monitoring in Australia. In Proceedings of the IEEE International Geoscience and Remote Sensing Symposium (IGARSS), Milan, Italy, 26–31 July 2015; pp. 2630–2633. [Google Scholar] [CrossRef]
- Ogushi, F.; Shinohara, T.; Matsuoka, M. Surface Displacement Due to the 2014 North Nagano, Japan Earthquake Estimated from Differential Interferometry Technique with ALOS-2 PALSAR-2 Data. In Proceedings of the IEEE International Geoscience and Remote Sensing Symposium (IGARSS), Milan, Italy, 26–31 July 2015; pp. 3532–3535. [Google Scholar] [CrossRef]
- Yonezawa, C. Paddy Rice Field Extraction Using ALOS-2 PALSAR-2 Full Polarimetric Data with Agricultural Parcel Vector Data. In Proceedings of the IEEE International Geoscience and Remote Sensing Symposium (IGARSS), Valencia, Spain, 22–27 July 2018; pp. 5296–5299. [Google Scholar] [CrossRef]
- Chen, F.Y. Research on the Wetland Ecological Product Evaluation and Value Realization of the Economic Zone Along the Yellow River in Ningxia. Ph.D. Thesis, School of Economics and Management, Beijing Forestry University, Beijing, China, 2024. [Google Scholar]
- Shen, A.; She, J.; Shi, Y.; Wu, T.; Liang, Y.; Dong, J.; Ma, Y. Changes in Vegetation Coverage of Desert Grasslands in the Eastern Foothills of Helan Mountains in 2001–2020. J. Desert Res. 2024, 44, 308–320. [Google Scholar]
- Wang, H. Problems and Countermeasures in the Construction of Three-North Shelterbelt Project in Shizuishan City. Xiandai Hortic. 2025, 48, 204–206. [Google Scholar] [CrossRef]
- Wang, J.F. Dangerous Forest Pests Species and Prevention Strategies in Ningxia Helan Mountain National Nature Reserve. In Proceedings of the Annual Conference of the Chinese Society for Environmental Sciences, Wuhan, China, 1–5 November 2009; pp. 678–680. [Google Scholar]
Disclaimer/Publisher’s Note: The statements, opinions and data contained in all publications are solely those of the individual author(s) and contributor(s) and not of MDPI and/or the editor(s). MDPI and/or the editor(s) disclaim responsibility for any injury to people or property resulting from any ideas, methods, instructions or products referred to in the content. |
© 2025 by the authors. Licensee MDPI, Basel, Switzerland. This article is an open access article distributed under the terms and conditions of the Creative Commons Attribution (CC BY) license (https://creativecommons.org/licenses/by/4.0/).