Article

Effects of Different Vegetation Types on Soil Quality in Golden Huacha (Camellia petelotii) National Nature Reserve

1
Laboratory of Ecology of Rare and Endangered Species and Environmental Protection, Ministry of Education, Guangxi Normal University, Guilin 541004, China
2
Anhui Ecological and Environment Monitoring Center, Hefei 230071, China
3
Liaoning Non-Ferrous Geological Exploration and Research Institute Co., Ltd., Shenyang 110866, China
4
College of Forestry, Shenyang Agricultural University, Shenyang 110866, China
5
State-Owned Xinbin Manchu Autonomous County Douling Forest Farm, Fushun 110013, China
6
Research Station of Liaohe-River Plain Forest Ecosystem, Chinese Forest Ecosystem Research Network (CFERN), Shenyang Agricultural University, Tieling 112000, China
7
Guangxi Fangcheng Golden Camellias National Nature Reserve, Fangchenggang 538021, China
*
Author to whom correspondence should be addressed.
These authors contributed equally to this work.
Forests 2025, 16(5), 865; https://doi.org/10.3390/f16050865
Submission received: 15 April 2025 / Revised: 18 May 2025 / Accepted: 19 May 2025 / Published: 21 May 2025

Abstract

:
Natural and planted forests differentially regulate soil quality through vegetation–soil interactions. The effects of four types of planting covers on soil nutrients, enzyme activities, and microbial communities in the Guangxi Camellia nitidissima National Nature Reserve were studied, revealing the multi-dimensional influences of natural (broadleaf, shrubland) and planted forests (bamboo, pine) on soil quality. Surface soils (0–10 cm depth) were characterized for physicochemical properties (pH, TC, TN, NO3-N, AP), enzyme activities (α-amylase, urease, phosphatase, β-glucosidase), and microbial composition (using 16S rRNA and ITS region sequencing). Mantel tests and PLS–PM modeling were employed to investigate interactions among vegetation, soil variables, and microbes. Natural forests exhibited higher pH, nitrate nitrogen, and enzymatic activities (urease, phosphatase, β-glucosidase) alongside enhanced carbon–nitrogen accumulation and reduced acidification. Planted forests showed elevated available phosphorus and nutrient supply but lower organic matter retention. Microbial communities displayed higher similarity within natural forests, with fungal composition strongly linked to total carbon/nitrogen (p < 0.05). Vegetation type positively influenced bacterial diversity but negatively affected fungal communities. Natural forests maintained critical soil–microbe–plant interactions supporting ecosystem resilience through carbon–nitrogen cycling, while planted forests fostered divergent microbial functionality despite short-term nutrient benefits. These findings underscore natural forests’ unique role in preserving ecological stability and reveal fundamental limitations of artificial systems in mimicking microbially-mediated biogeochemical processes. Conservation policy should prioritize the protection of natural forests while simultaneously integrating microbial community management with vegetation restoration efforts to enhance long-term ecosystem functionality and nutrient cycling efficiency.

1. Introduction

Within the framework of global ecological conservation, nature reserves represent critical strongholds for preserving biodiversity and sustaining ecosystem stability. These protected areas host two dominant forest vegetation types—natural forests and plantations—which engage in species-specific interactions with soil systems, profoundly modulating soil physicochemical parameters (e.g., organic matter distribution, aggregate stability), structural heterogeneity, and functional capacities (nutrient cycling, carbon sequestration). As evidenced by Paquette and Messier [1], this vegetation–soil nexus exhibits multilayered interdependencies that critically regulate ecosystem service delivery and landscape-scale resilience. Notably, the natural forests within protected areas serve as exclusive refugia for legally protected flora, sustaining the survival and reproductive success of rare species while functioning as living archives of natural evolutionary processes and genetic reservoirs [2]. Its ecological value is inestimable, and it plays a mainstay role in maintaining the integrity and stability of the regional ecosystem. In contrast, an artificial forest is a forest community built by humans based on wood production and ecological restoration, which plays a positive role in carbon fixation, oxygen release, water, and soil conservation [3].
Soil quality, a multi-dimensional indicator of ecosystem health and forestry productivity, encompasses soil physicochemical properties, enzyme activities, and microbial communities [4]. It sustains plant growth, regulates nutrient cycling, and maintains environmental stability. However, soil degradation caused by land-use changes, intensive agriculture, and deforestation has raised global concerns [5]. Evaluating soil quality under different site conditions is crucial for understanding land management impacts and promoting sustainable soil use [6]. Soil properties like texture, organic matter, and nutrient availability affect fertility and structure, while enzyme activities act as catalytic drivers of organic matter decomposition pathways [7]. Concurrently, microbial communities, essential for carbon sequestration, nitrogen fixation, and pollutant degradation, further determine soil functionality [8]. Collectively, soil quality serves as a diagnostic tool for evaluating site conditions, providing a mechanistic understanding of land use impacts, pedogenic health, and ecosystem service provisioning [7].
Soil microorganisms are fundamental to ecosystem function and play a key role in nutrient cycling, decomposition of organic matter, and formation of soil structure [9]. Soil microbial community diversity is a key indicator of soil health and directly affects plant productivity and ecosystem resilience [10]. Changes in land use and vegetation types can significantly alter soil microbial diversity, which, in turn, affects the composition and functional potential of these communities [11]. Studies have shown that different land use patterns have an impact on soil microbial diversity. For example, the transformation from forests to pastures can significantly change the structure and diversity of soil bacterial communities [12,13]. In addition, agricultural management measures such as planting systems, crop types, and tillage methods also significantly affect the biomass and diversity of soil microorganisms [14]. These studies suggest that changes in land use patterns not only affect the community structure of soil microorganisms but also affect the decomposition of soil organic matter and nutrient cycling, thus affecting soil health and ecosystem function.
Soil microbial communities exhibit intricate interactions with soil nutrient properties and enzyme activities, which significantly influence nutrient cycling, plant growth, and the overall health and functionality of soil ecosystems [15]. Soil microbial communities play a key role in maintaining soil health through dynamic interactions with soil nutrient properties and enzyme activity. These interactions are central to nutrient cycling, decomposition of organic matter, and stability of soil structure [16]. For example, soil enzymes such as glucosidase and phosphatase are derived from living microorganisms and stable organic matter complexes, which accelerate the depolymerization of organic substrates and release nutrients available to plants [17]. A study has highlighted that microbial diversity is positively correlated with soil enzyme activity, increasing nutrient mineralization kinetics [18]. Soil enzymes are biological indicators reflecting current microbial activities and historical microbial contributions. While dehydrogenase activity is closely associated with living microbial biomass, hydrolases such as beta-glucosidase typically persist in a stable soil substrate, reflecting microbial activity that accumulates over time [19]. Environmental factors, such as soil pH and organic carbon content, further orchestrate these interactions, creating a feedback loop through which microbial processes reconfigure soil properties, which, in turn, shape community composition [20]. Understanding these complex relationships is critical to developing sustainable soil management strategies that optimize nutrient use efficiency and maintain ecosystem resilience.
This study conducts a systematic investigation in the Golden Huacha (Camellia petelotii) National Nature Reserve, a karst landscape in Guangxi, China, to delineate the multi-dimensional impacts of natural and planted forests on soil quality, particularly their differential regulatory mechanisms on soil nutrient cycling, enzymatic activities, and microbial functional communities. Globally, protected area management prioritizes vegetation restoration but often overlooks the critical role of soil–microbe interactions in driving ecosystem resilience. In karst landscapes, where natural forests serve as core habitats for rare species like Camellia petelotii, the stability of soil microenvironments directly underpins regional biodiversity conservation. By comparing soil ecological characteristics across four vegetation types, this study is the first to elucidate the irreplaceability of natural forests in mitigating soil acidification, enhancing carbon–nitrogen sequestration, and maintaining microbial functional integrity. Simultaneously, it reveals the trade-off between short-term nutrient supply and microbial functional simplification in planted forests. These findings not only provide a scientific foundation for the precision management of karst reserves but also advocate for integrating soil microbial function regulation into ecological restoration frameworks. This approach aims to achieve a synergistic optimization of “vegetation–soil–microbe” systems, ensuring long-term conservation strategies that balance rapid recovery with enduring ecological stability. The primary objectives of this research are as follows: (1) to quantitatively compare the effects of four distinct vegetation types (broadleaf forest, shrubland, bamboo forest, and pine forest) on key soil physicochemical properties and enzyme activities; (2) to elucidate the divergence in microbial community composition and functional potential between natural and planted forests; (3) to identify the critical linkages among vegetation characteristics, soil nutrient dynamics, and microbial-mediated processes; and (4) to evaluate the ecological trade-offs between short-term nutrient supply in plantations and long-term functional stability in natural forests.

2. Materials and Methods

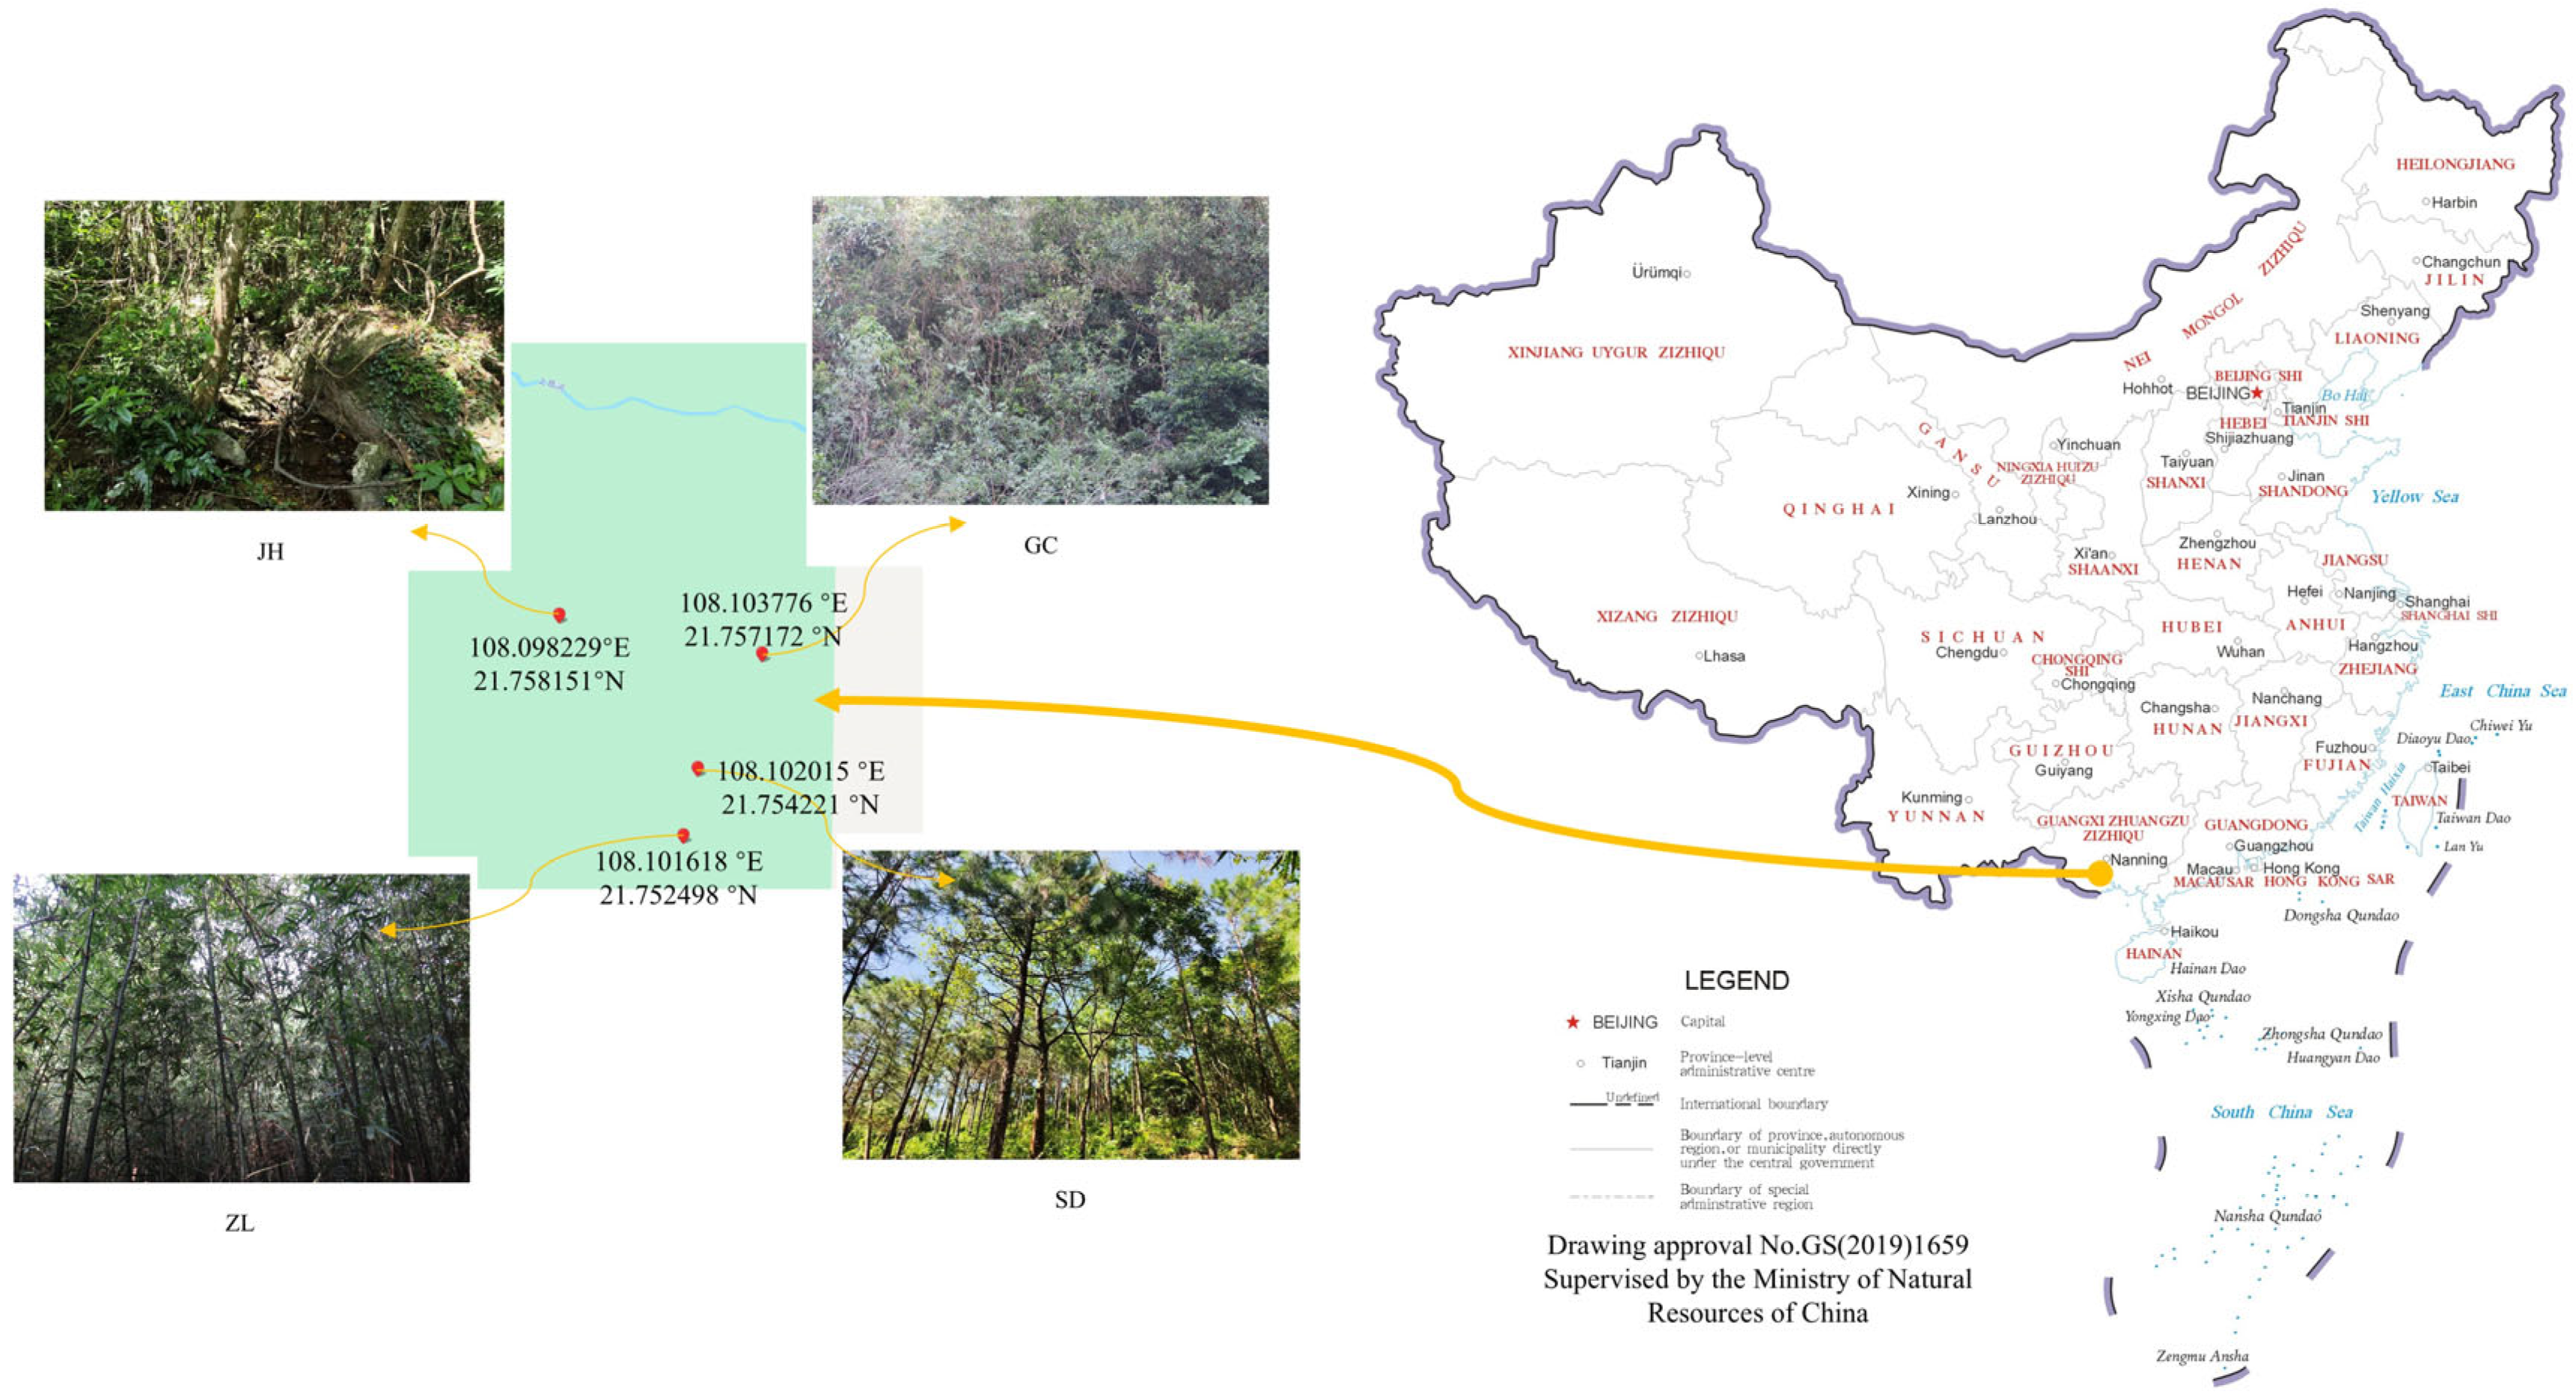
2.1. Site Information

This research was conducted in the Golden Huacha National Nature Reserve, located in Fangcheng, Guangxi, China (108°2′33″–108°12′52″ E, 21°43′34″–21°49′39″ N). This region experiences a tropical monsoon climate characterized by distinct seasonal variations, including short winters and long summers, with pronounced monsoon patterns and a consistently warm and humid environment. This area benefits from intense solar radiation, abundant sunlight, substantial thermal resources, minimal frost occurrence, and an extended frost-free period. According to the WRB classification, the soil type is latosol. For this study, four distinct vegetation communities were selected as experimental sites: broadleaf forest in the Camellia petelotii habitat (JH), shrubland (GC), bamboo forest (ZL), and moist pine forest (SD) (Figure 1).

2.2. Soil Sampling

Soil sampling was conducted in October 2024, using a stratified random sampling strategy to collect surface soil specimens (0–10 cm depth) from four representative vegetation types: JH, GC, ZL, and SD. The position of the quadrat was determined by the random sampling method. The sampling protocol involved establishing four replicate quadrats (10 m × 10 m) at each location, maintaining an inter-quadrat distance of roughly 25 m. At each quadrat, eight soil cores were extracted using a stainless-steel soil auger following an S-shaped sampling transect, then aseptically homogenized to form a composite sample representing the 10 cm soil profile. This procedure yielded four biologically independent composite samples per vegetation type (n = 16 total). All samples were carefully packaged in sealable plastic bags with labels and transported to the laboratory facility under refrigerated conditions. Prior to analysis, foreign materials, including rock fragments and organic debris, are removed by screening (2 mm screen). A portion of the solution was prepared in a 2 mL cryogenic vial and stored at −80 °C to maintain microbial integrity until subsequent molecular analysis. The second part was dried for the determination of physical and chemical properties, and the third part was stored in the refrigerator at 4 °C for the determination of enzyme activity.

2.3. Soil Chemical Properties and Enzyme Activity Determination

Soil pH was determined using a calibrated potentiometer with a soil-to-water ratio of 2.5:1 (w/v). Total carbon (TC) and total nitrogen (TN) concentrations were quantified through combustion analysis using an Elementar Vario EL III elemental analyzer (Elementar Analysensysteme GmbH, Langenselbold, Germany). For phosphorus analysis, total phosphorus (TP) content was measured employing the molybdenum antimony anti-colorimetric method following acid digestion, while available phosphorus (AP) was extracted using 0.5 M NaHCO3 solution (pH 8.5) and subsequently determined by the molybdenum antimony anti-colorimetric method [21]. Ammonium nitrogen (NH4+-N) and nitrate nitrogen (NO3-N) concentrations were quantitatively determined using a continuous flow analyzer (Skalar SAN++ System, Breda, The Netherlands) following standard colorimetric procedures. The activities of four key soil enzymes were determined using spectrophotometric methods: α-amylase activity was measured through starch hydrolysis and subsequent iodine–starch complex formation; urease activity was assessed by quantifying ammonium release from urea hydrolysis using indophenol blue colorimetry; phosphatase activity was determined based on p-nitrophenol release from p-nitrophenyl phosphate substrate, and β-glucosidase activity was evaluated using p-nitrophenyl-β-D-glucopyranoside as substrate with subsequent p-nitrophenol quantification.

2.4. DNA Extraction and High-Throughput Sequencing

Genomic DNA was isolated from soil samples using the OMGA Soil DNA Kit (M5635-02, Omega Bio-Tek, Norcross, GA, USA). DNA concentration and purity were assessed through dual quantification methods: spectrophotometric analysis using a NanoDrop NC2000 instrument (Thermo Fisher Scientific, Waltham, MA, USA) and electrophoretic separation on 1.2% agarose gels. For bacterial community analysis, the V3–V4 hypervariable regions of 16S rRNA genes were amplified with universal primers 338F (5′-ACTCCTACGGGAGGCAGCA-3′) and 806R (5′-GGACTACHVGGGTWTCTAAT-3′) [22]. Fungal communities were characterized by targeting the ITS region using primer pair ITS5 (5′-GGAAGTAAAAGTCGTAACAAGG-3′) and ITS2 (5′-GCTGCGTTCTTCATCGATGC-3′) [23]. PCR amplification was performed in 25 μL reaction volumes containing 5 μL of 5× reaction buffer, 5 μL of 5× GC buffer, 2 μL of dNTP mixture (2.5 mM), 1 μL each of forward and reverse primers (10 μM), 2 μL of DNA template, 8.75 μL of ddH2O, and 0.25 μL of Q5 DNA polymerase. Thermal cycling conditions consisted of an initial denaturation at 98 °C for 2 min, followed by 25 cycles of denaturation at 98 °C for 15 s, annealing at 55 °C for 30 s, and extension at 72 °C for 30 s, with a final extension at 72 °C for 5 min and holding at 10 °C. PCR products were purified using Vazyme VAHTSTM DNA Clean Beads (Vazyme, Nanjing, China) and quantified with the Quant-iT PicoGreen dsDNA Assay Kit (Invitrogen, Carlsbad, CA, USA). Equimolar concentrations of purified amplicons were pooled and subjected to 250 bp paired-end sequencing on the Illumina NovaSeq platform using NovaSeq 6000 SP Reagent Kit (500 cycles) at Shanghai Personal Biotechnology Co., Ltd. (Shanghai, China). The raw reads were deposited in the NCBI SRA database with accession number PRJNA1248155.

2.5. Sequence and Data Analysis

Microbial community analysis was conducted using QIIME 2 (version 2019.4), with protocol adaptations based on the official documentation (https://docs.qiime2.org/2019.4/tutorials/, accessed on 14 April 2025). The analytical pipeline was initiated by demultiplexing raw sequencing reads through the demux plugin, followed by primer sequence removal using the cutadapt plugin. Subsequent quality control processing involved sequence filtering, noise reduction, read merging, and chimera elimination implemented via the DADA2 plugin, generating non-singleton amplicon sequence variants (ASVs). For phylogenetic analysis, ASVs were aligned using MAFFT, and phylogenetic reconstruction was performed with FastTree2. Microbial diversity assessment included calculation of α-diversity indices (Chao1 richness estimator, Shannon diversity index, and Pielou’s evenness measure) and β-diversity analysis based on Bray-Curtis dissimilarity metrics, executed through the diversity plugin. Taxonomic classification of ASVs was performed using the sklearn-based naïve Bayes classifier within the feature-classifier plugin, with reference to the SILVA 132 database for bacterial taxonomy and UNITE version 8.0 database for fungal identification. Sequence data analyses were mainly performed using QIIME2 (2019.4) and R packages (v3.2.0). Statistical significance was determined using one-way analysis of variance (ANOVA) implemented in SPSS version 26.0 (IBM Corp., Armonk, NY, USA), with post hoc multiple comparisons performed using the Student–Newman–Keuls (S–N–K) method to identify specific group differences. Pearson correlation analysis was adopted to compare the correlations among different indicators. Furthermore, the mantel is carried out through “linkET” and “ggplot2” of R v 4.3.0. Partial least squares path modeling is analyzed with the help of the “plspm” package of R v 4.3.0. [21,22,23,24].

3. Results

3.1. Soil Chemical Properties

Significant differences (p < 0.05) were observed in soil total carbon (TC), total nitrogen (TN), nitrate nitrogen (NO3–N), and total phosphorus (TP) among different samples, whereas no significant differences (p > 0.05) were detected in pH, ammonium nitrogen (NH4+–N), or available phosphorus (AP) (Table 1). All four soils were acidic, with JH exhibiting the highest pH (5.76) and ZL the lowest (5.17). The TC and TN contents in the GC soil were significantly higher than those in the other three soils, yet its NH4+-N content was the lowest. Notably, JH displayed the highest NO3–N concentration among all samples. Both TP and AP contents followed the order: ZL > GC > SD > JH. Based on the Pearson correlation coefficient, TC was significantly negatively correlated with TN (r = −0.97, p < 0.001; Figure 2).

3.2. Soil Enzyme Activity

Highly significant variations (p < 0.01) were detected in the activities of amylase, urease, phosphatase, and glucosidase across different sampling sites (Table 2). ZL exhibited the highest amylase activity (18.74 mg/g), significantly surpassing the other three sites. Urease and phosphatase activities followed the order JH > ZL > SD > GC. While JH displayed the highest glucosidase content, the remaining sites showed a distinct hierarchy: SD > ZL > GC. Notably, no significant differences (p > 0.05) were observed between JH and ZL in the activities of urease, phosphatase, or glucosidase, with the exception of amylase. The activities of urease and phosphatase were significantly positively correlated (r = 1.000, p < 0.001), and the activity of phosphatase was significantly positively correlated with that of glucosidase (r = 0.582, p < 0.05; Figure 2).
Amylase activity showed no significant correlations with soil chemical properties (p > 0.05; Figure 2). TN exhibited significant negative correlations with urease (r = −0.544, p < 0.05), phosphatase (r = −0.544, p < 0.05), and glucosidase (r = −0.549, p < 0.05). Additionally, glucosidase demonstrated a significant negative correlation with soil TP content (r = −0.646, p < 0.05).

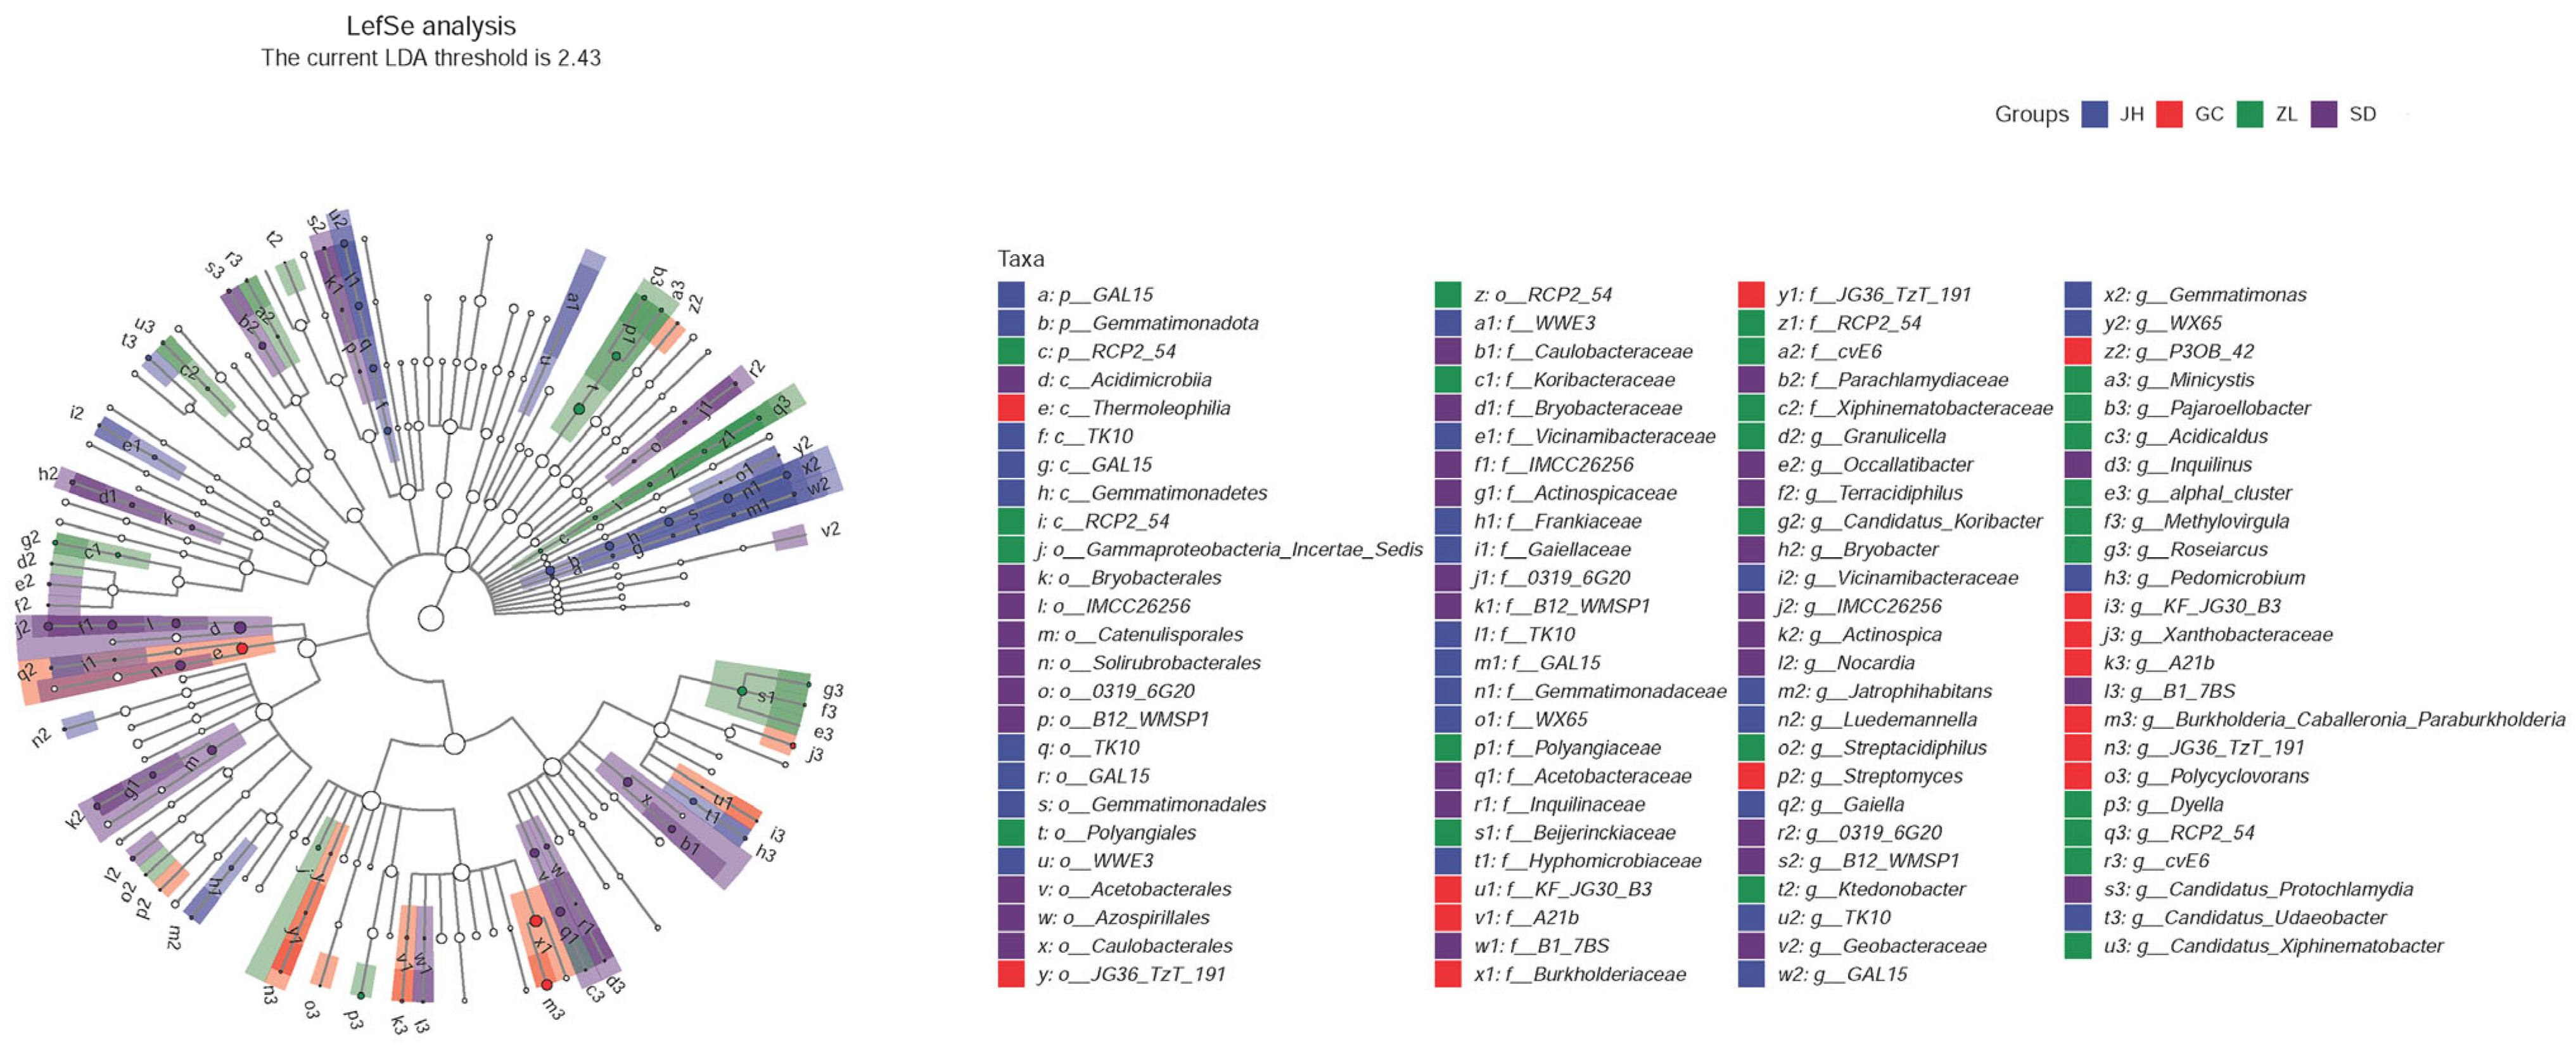
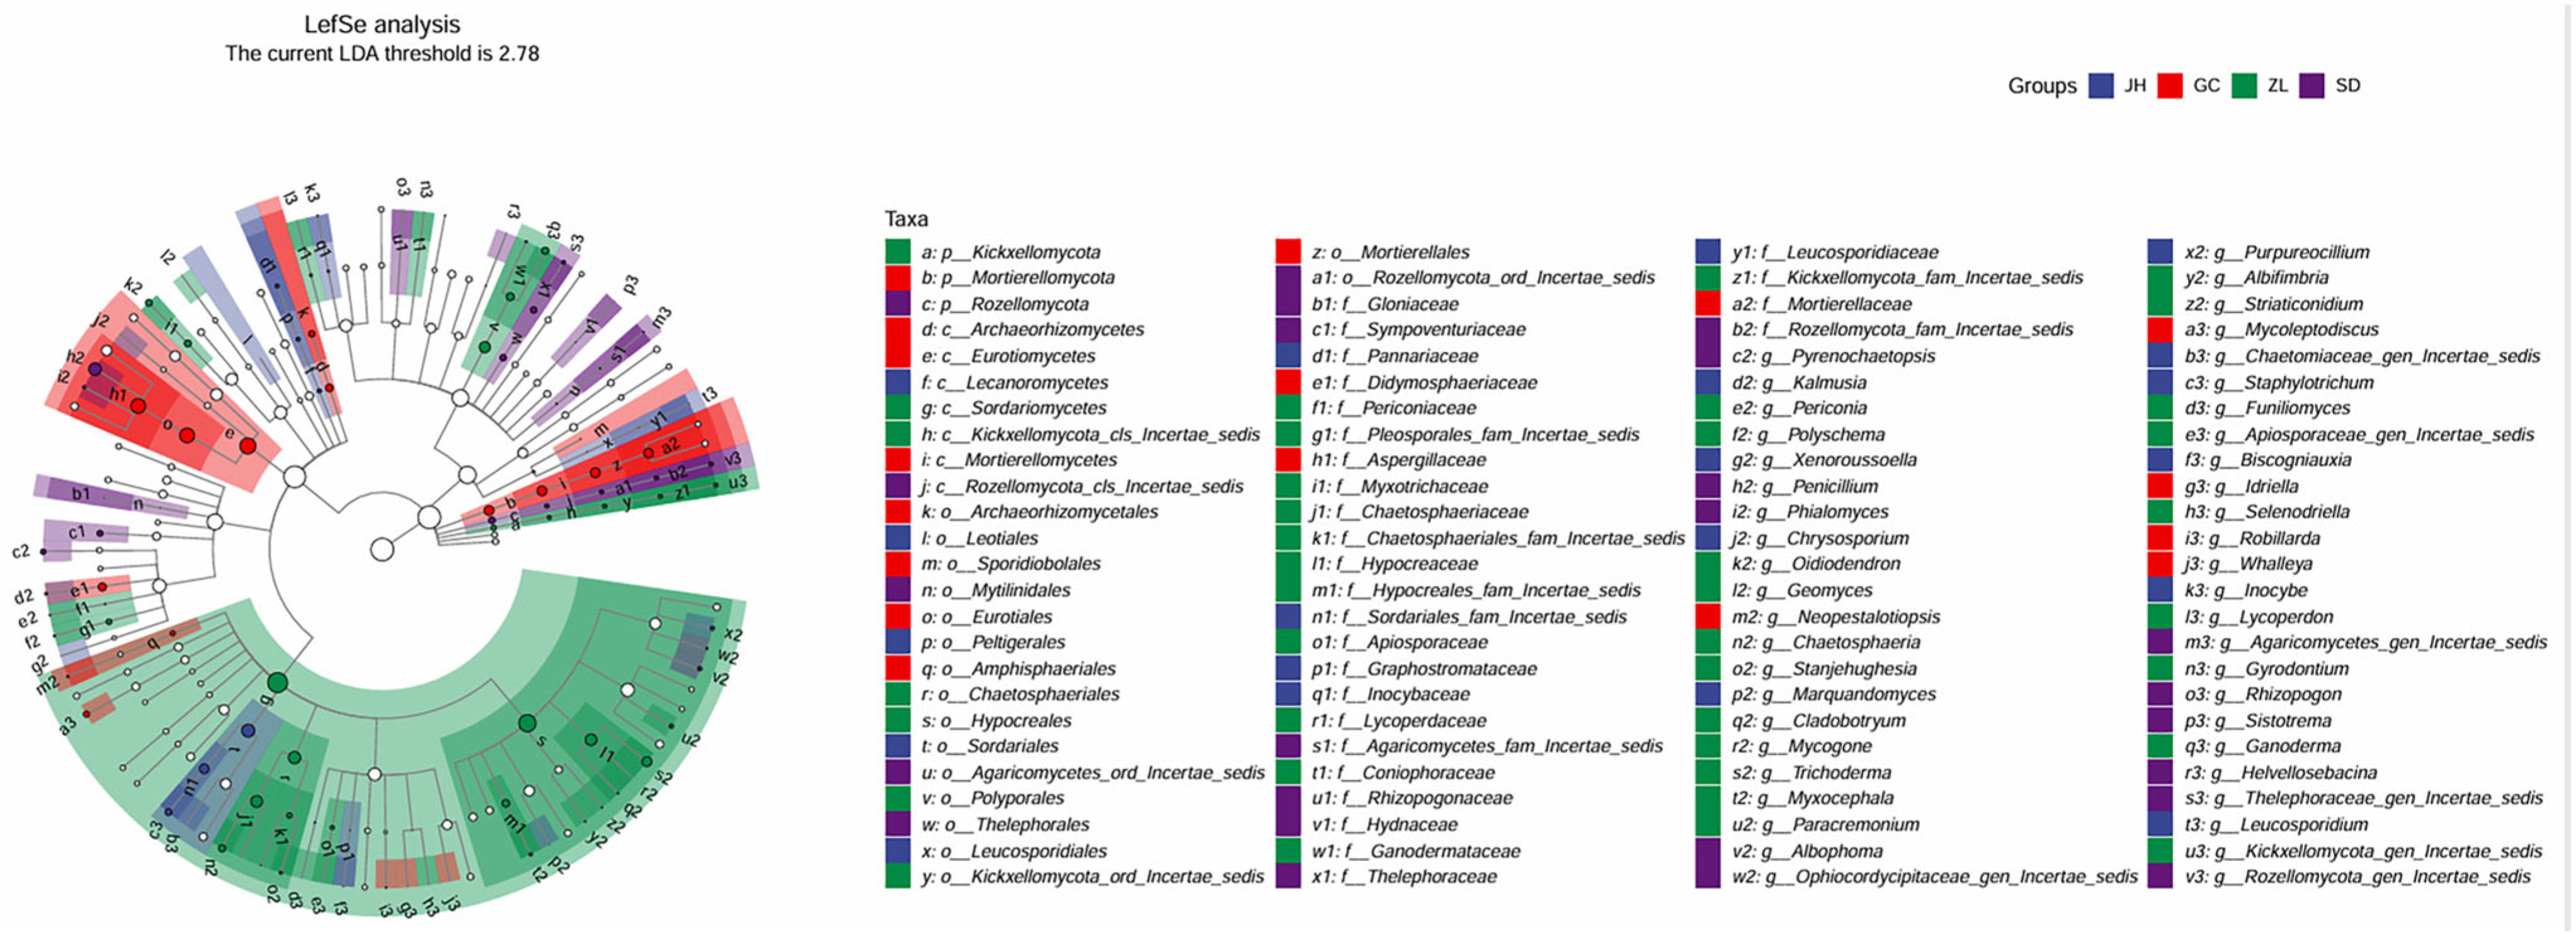
3.3. Soil Microorganism

Microbial community analysis revealed adequate sequencing depth, as indicated by the plateauing rarefaction curves (Figure S1), confirming the robustness of downstream microbiome profiles. In bacterial communities, the numbers of amplicon sequence variants (ASVs) were 12,595 (JH), 12,531 (GC), 10,823 (ZL), and 12,669 (SD), with 884 ASVs shared among all four samples (Figure 3A). Fungal communities exhibited analogous yet strikingly reduced diversity patterns, recording 2145 (JH), 2600 (GC), 2111 (ZL), and 2051 (SD), and only 63 shared ASVs across all samples (Figure 3B).
In the bacterial community, a bar chart was constructed to illustrate the top 10 bacterial phyla ranked by relative abundance (Figure S2A). Proteobacteria, Acidobacteriota, and Actinobacteriota emerged as the preponderant phyla across all sampling plots. Specifically, Proteobacteria exhibited the highest relative abundance within the GC sample, attaining a value of 34.97%. Acidobacteriota demonstrated peak relative abundance in the ZL sample, registering at 26.39%. Actinobacteriota reached its maximum relative abundance in the JH sample, amounting to 17.96%. Regarding the bacterial genera, all of the top 10 genera in terms of relative abundance exhibited values exceeding 1% (Figure S2B). Acidothermus displayed the highest relative abundance in the JH sample, measuring 6.06%. In the ZL sample, Subgroup_2 and Acidibacter manifested the highest relative abundances, with values of 9.00% and 5.28%, respectively.
Shifting the perspective to the fungal community, Ascomycota and Basidiomycota were identified as the dominant phyla among the four samples (Figure S2C). The cumulative relative abundances of these two phyla spanned from 83.35% to 93.16%. In the SD sample, Basidiomycota exhibited the highest relative abundance, reaching 49.89%. Conversely, Ascomycota had the highest relative abundance in the remaining three samples, all of which surpassed 50%. At the genus level, Saitozyma and Aspergillus demonstrated the highest relative abundances in the GC sample, with values of 29.64% and 13.30%, respectively (Figure S2D). Staphylotrichum registered the highest relative abundance in the JH sample, amounting to 11.33%. Notably, Inocybe was detected solely in the JH sample, and its relative abundance was remarkably high, at 10.61%.
The Chao1 estimator (Chao1), Pielou’s Evenness index (Pielou_e), and Shannon diversity index (Shannon) can, respectively, indicate the richness, evenness, and diversity of the microbial community [25,26,27]. In the bacterial community, SD had the highest values for Chao1, Pielou_e, and Shannon, while ZL had the lowest. In the fungal community, SD had the lowest values, with GC having the highest Chao1, and ZL having the highest Pielou_e and Shannon (Figure 4).
In the bacterial community, the first two axes altogether explained 83.5% of the community differences. The projection distances of JH, SD, and ZL along the PCo1 axis are relatively far, indicating significant community differences. The projection distances of SD, ZL, and GC on the PCo1 axis are relatively close, indicating that their communities are more similar (Figure 5A). In the fungal community, the first two axes altogether explained 80.8% of the community differences. The projection distances of ZL and JH on the PCo1 axis are the farthest, indicating that their community differences are the greatest. The projection distances of GC and SD on the PCo1 axis are the closest, indicating that their communities are relatively similar (Figure 5B).
According to the inter-group difference analysis, in the bacterial community, only the difference between the GC and SD groups was not significant (p > 0.05; Table 3). Based on the LefSe analysis, when LDA was equal to 2.43, it was found that the relative abundances of 136 microorganisms showed significant differences among the four groups (p < 0.05). Among them, the number of microorganisms showing significant differences in GC was the fewest, with only 19, and that in ZL was the highest, with 35. At the phylum level, only the abundances of GAL15, Gemmatimonadota, and RCP2_54 differed among groups. Among them, GAL15 and Gemmatimonadota had the highest relative abundances in JH, and RCP2_54 had the highest relative abundance in ZL (Figure 6).
In the fungal community, the differences between each pair of samples were significant (p < 0.05; Table 3). According to the LefSe analysis, when LDA was equal to 2.78, it was found that the relative abundances of 238 microorganisms showed significant differences among the four groups (p < 0.05). Among them, the number of microorganisms showing significant differences in GC was the fewest, with 49, and that in ZL was the highest, with 84. At the phylum level, only the abundances of Kickxellomycota, Mortierellomycota, and Rozellomycota differed among groups. Kickxellomycota had the highest relative abundance in ZL; Mortierellomycota had the highest relative abundance in GC, and Rozellomycota had the highest relative abundance in SD (Figure 7).

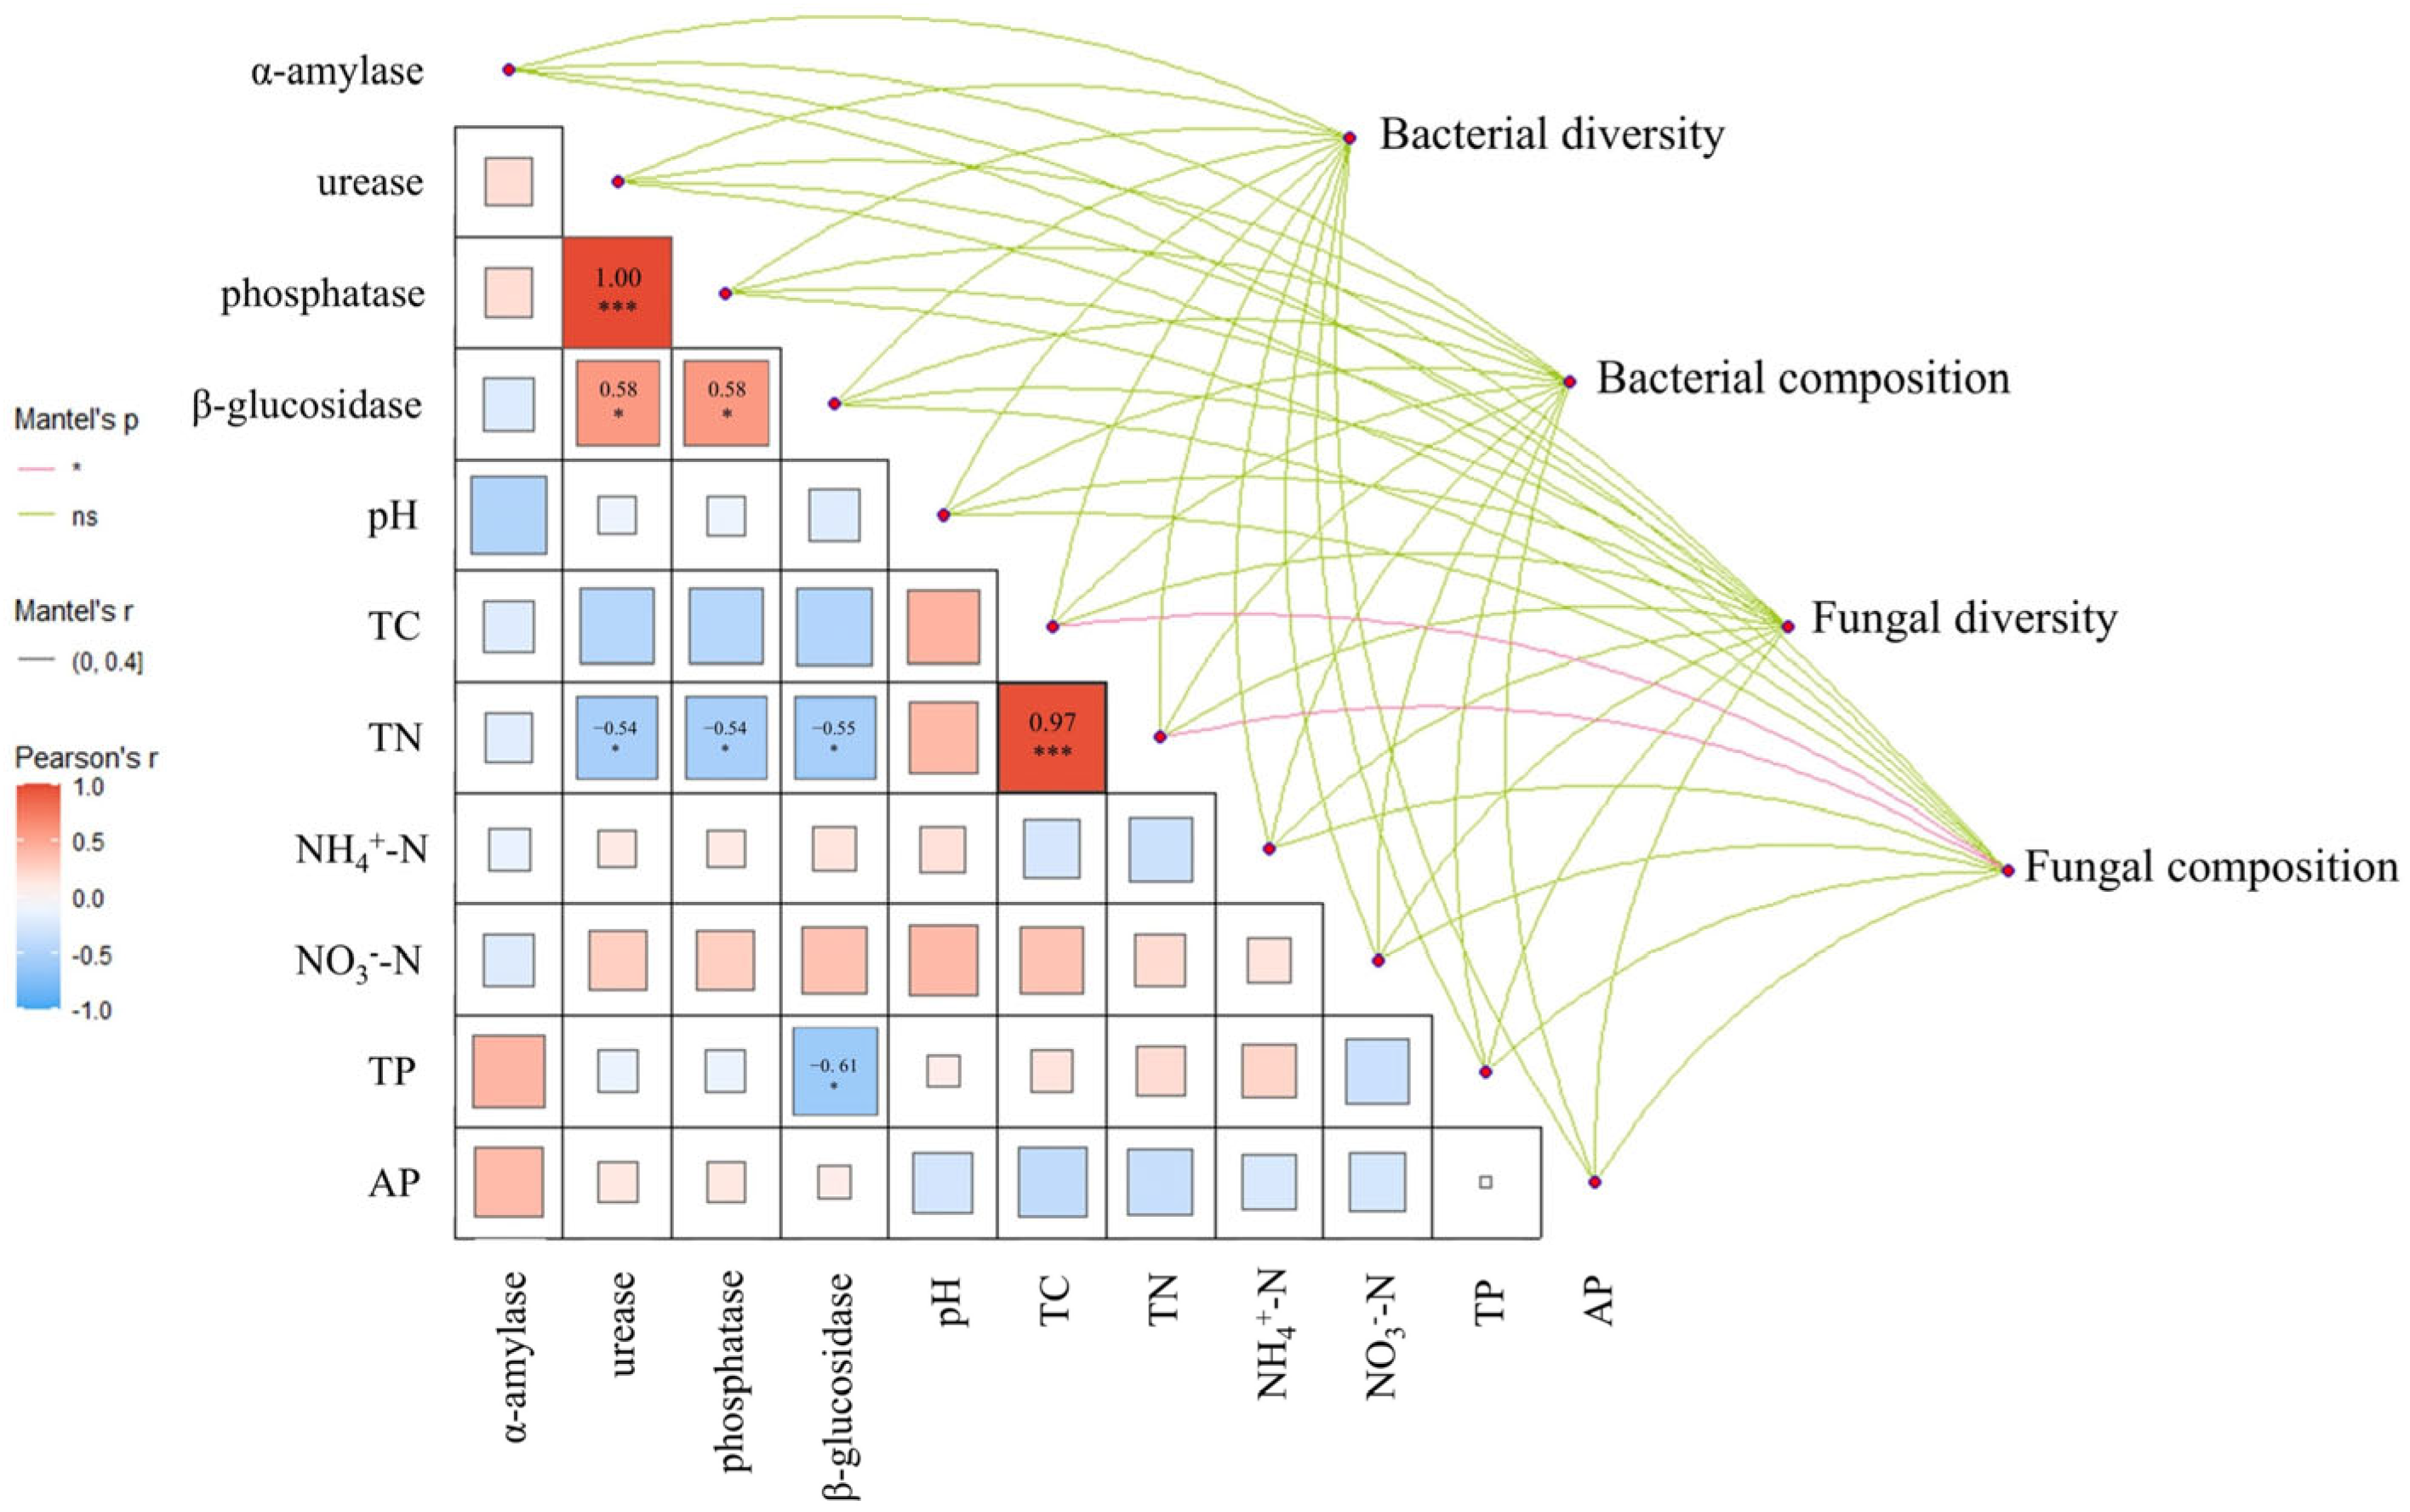
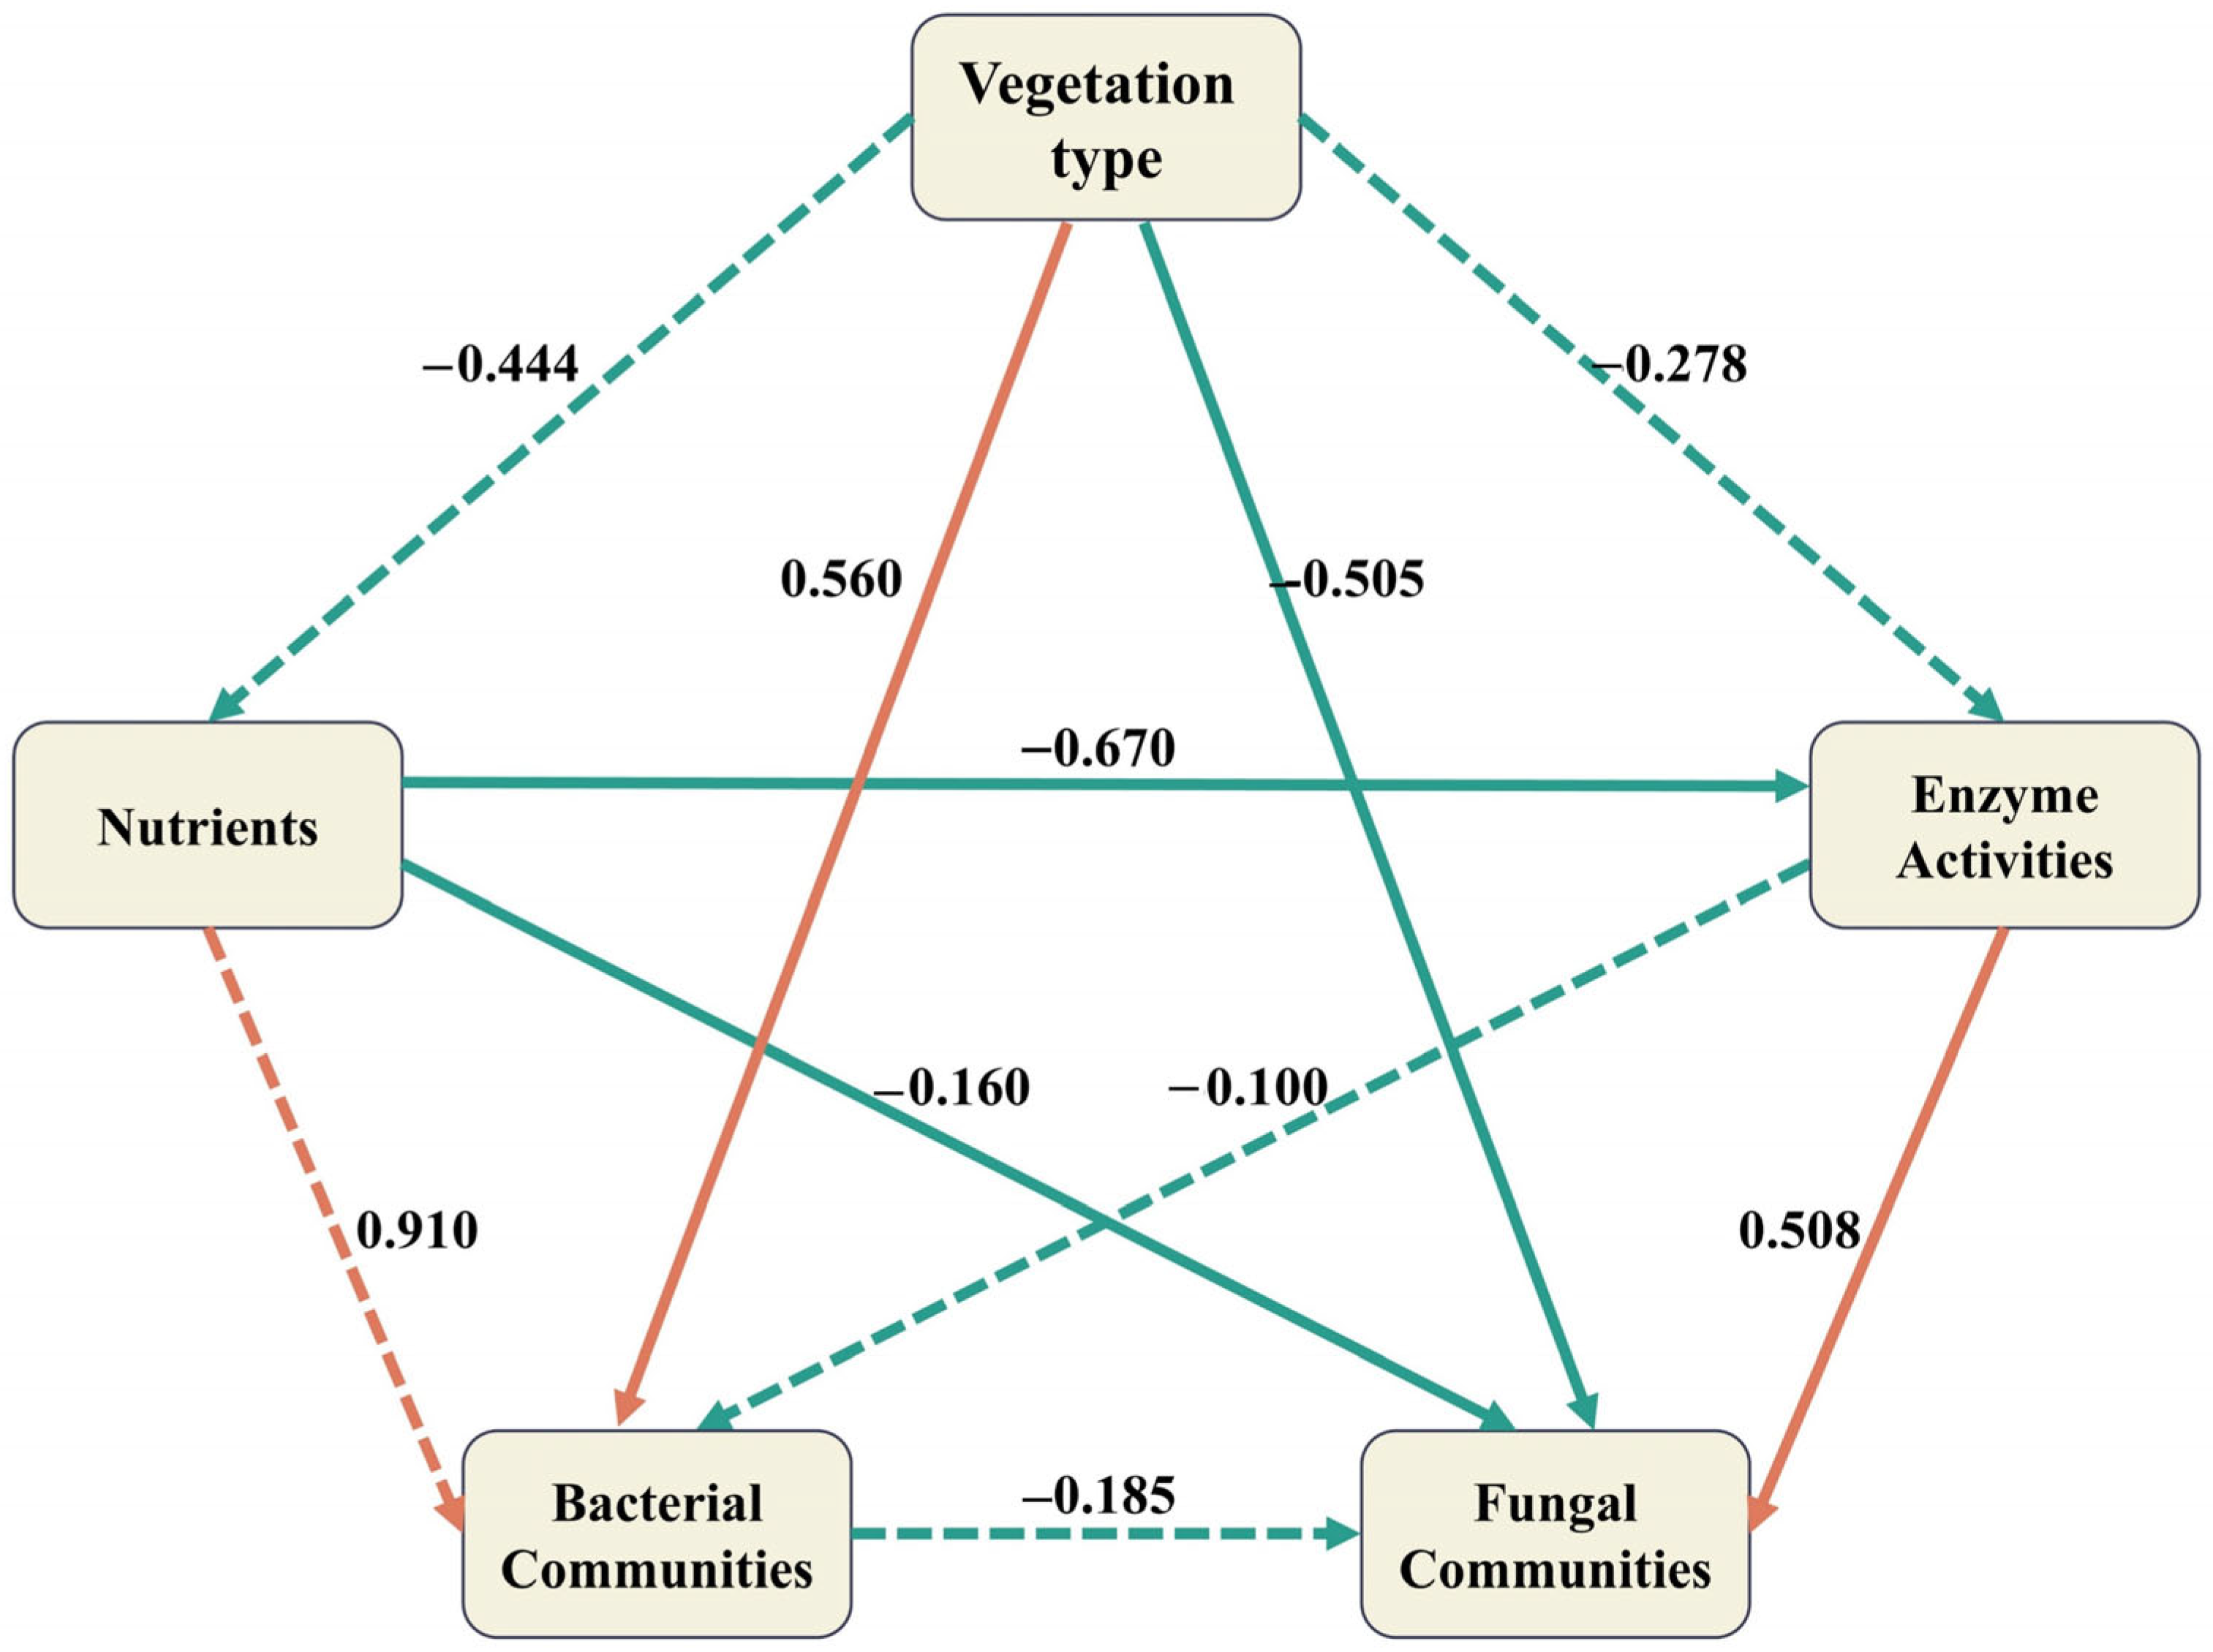
3.4. Correlation Analysis

Mantel analysis was conducted to explore the relationships among microbial community composition and diversity, soil nutrients, and enzyme activities (Figure 2). However, only TC and TN were significantly correlated with the fungal community composition (p < 0.05). Neither of the measured soil physicochemical properties nor the enzyme activity indices showed significant correlations with the microbial (both bacterial and fungal) diversity (p > 0.05).
Partial least squares path modeling was performed on soil quality under different vegetation types, including nutrients, enzyme activities, and microbial communities (Figure 8). Vegetation type (path coefficient = 0.560) and nutrients (path coefficient = 0.910) exhibited positive responses to the soil bacterial community. Soil enzyme activity showed a positive response to the soil fungal community (path coefficient = 0.508), while other responses were negative (path coefficient < 0). Vegetation type had a significantly positive response to the soil bacterial community (p < 0.05). The soil fungal community was significantly negatively regulated by soil nutrients and vegetation type (p < 0.05). Enzyme activity was significantly negatively regulated by nutrient content and showed a significantly positive response to the soil fungal community.

4. Discussion

4.1. Differences in Soil Chemical Properties

Soil pH analysis revealed acidic conditions across all four ecosystems (pH 5.4–5.8), potentially attributable to regional climatic conditions and parent material characteristics [28]. Although JH and GC exhibited slightly higher pH values compared to ZL and SD, statistical analysis (F-value and p-value) in this study indicated no significant influence of vegetation type on soil acidity. This finding contrasts with previous studies demonstrating vegetation-dependent pH variations [29,30]. Planting Camellia petelotii can improve the local soil acidification situation, indicating its value in protection and utilization.
GC soils demonstrated the maximum TC and TN stocks, a phenomenon attributable to the dense shrub canopy cover and substantial litter input fluxes [31]. This is consistent with the results of another study, which suggest that ecosystems with high vegetation coverage generally possess higher soil organic carbon and total nitrogen contents [32]. JH soils ranked second in TC and TN content, potentially reflecting high biomass production and rapid litter decomposition rates characteristic of broadleaf forests [33]. Notably, ZL and SD exhibited relatively lower TC and TN levels, consistent with their specific vegetation characteristics and growth environments [34], supporting previous findings of vegetation-dependent soil organic matter dynamics [35].
The differences in the content of NH4+-N among different samples might mirror the unique litter decomposition rates and nitrogen contents of the vegetation. It is possible that in ZL, the decomposition occurs more rapidly, leading to a greater release of NH4+-N [36]. Moreover, the variations in the composition and quantity of root exudates among different vegetation types are likely to have diverse impacts on microbial activity and the transformation processes of NH4+-N [34]. In contrast, the concentration of NO3-N changed significantly (p < 0.05). The level in JH was notably higher than that in other locations, which might indicate an enhancement of the ammonification and nitrification processes in the broad-leaved forest ecosystem [37]. GC had relatively high contents of TC, TN, and TP, suggesting a substantial release of phosphorus during the decomposition of organic matter [38]. This finding corroborates the previous observations that soil organic matter is positively correlated with phosphorus content [39]. However, there were no significant differences in the content of AP (p < 0.05). Although some studies have reported vegetation-dependent changes in AP [40], other studies have shown no significant differences [39], indicating that regional soil characteristics and climatic conditions may mediate the impact of vegetation on phosphorus availability.

4.2. Differences in Soil Enzyme Activities

The activities of urease, phosphatase, and glucosidase in JH, where Camellia petelotii is the dominant vegetation, are the highest. This may reflect the complex interactions between the characteristics of the broad-leaved forest and the dynamics of soil microorganisms. Because of the higher biodiversity in JH, the large input of litter provides various carbon sources and nutrients, which, in turn, stimulate the activities of these enzymes [41,42]. Notably, ZL demonstrated exceptional α-amylase activity, which is significantly higher than that at other sites. This disproportionate enhancement can be attributed to the unique rhizodeposition compounds (e.g., phenolic acids) and phytolith-rich litter inputs characteristic of bamboo ecosystems. Since the root exudates in ZL may contain more substances that stimulate starch degradation, the large amount of litter input provides an enhanced carbon source for the microbial community, thus increasing the amylase activity [43]. The strong correlation between the activities of urease and phosphatase indicates a close coupling relationship in the nitrogen and phosphorus cycles in this area. The fact that both urease and glucosidase are involved in the carbon and nitrogen cycles may also be the reason for their significant positive correlation. This correlation is consistent with the research findings of Li et al. [44]. Nitrogen can induce soil acidification, which, in turn, inhibits the growth of microorganisms and subsequent enzyme production [45]. This may explain the significant negative correlation between TN and the activities of the three enzymes. Phosphorus mediates changes in the structure and function of microbial cells, thereby reducing the activity of glucosidase [29].

4.3. Differences in Soil Microbial Communities

Similar to the findings of most studies, in this research, there were significant differences in the compositions of the bacterial and fungal communities, which can be attributed to the differences in the ecological niches, lifestyles, and resource utilization strategies of bacteria and fungi [46]. The diversity of the bacterial community is generally higher than that of the fungal community, which is related to the fast reproduction rate, short life cycle, and strong adaptability of bacteria [43]. Our investigation of the composition and structure of the bacterial community in different environments has provided crucial insights into the functionality and health of ecosystems. Through the analysis at the phylum level, Proteobacteria, Acidobacteriota, and Actinobacteriota were identified as the dominant taxa at all sampling sites, which is consistent with the established patterns observed in various ecosystems [47,48]. Proteobacteria possess a wide range of metabolic capabilities and have a strong potential for nutrient cycling and organic matter decomposition [49]. Acidobacteriota play an established ecological role in nutrient-limited acidic environments, where they make significant contributions to carbon and nutrient cycling processes [49,50]. The relative abundance of Actinobacteriota in JH was the highest (17.96%), which is consistent with their recognized functions in organic matter decomposition and the production of bioactive compounds [50]. This substantial presence highlights the ecological complexity and functional diversity within the soil ecosystem of JH. In addition, the abundance of Acidothermus increased in JH (6.06%). It is a genus well-known for its thermophilic characteristics and the ability to degrade cellulose [51]. Therefore, the natural forest with Camellia petelotii as the main vegetation has an impact on the composition of the soil bacterial community compared to the other forest stands.
The analysis of the fungal community composition has provided valuable insights into the ecosystem functions and health under different environmental conditions. Ascomycota and Basidiomycota are the predominant fungal taxonomic groups, which is consistent with previous reports on their dominance in various ecosystems [52,53]. Basidiomycota has a higher abundance in coniferous forests, while Ascomycota is more abundant in broad-leaved forests and bamboo forests. This may be because Basidiomycota is a key group of fungi for decomposing the litter in coniferous forests that is rich in lignin and tannic acid. In contrast, the litter in broad-leaved forests contains more easily decomposable cellulose and hemicellulose, which is more favorable for rapid decomposers such as Ascomycota [54]. At the genus level, JH exhibits a unique fungal composition, in which Staphylotrichum is the most abundant genus (11.33%). It is well-known for its association with soil and its ability to decompose organic matter [55,56]. A particularly remarkable finding is that Inocybe is only present at the JH site (with a relative abundance of 10.61%). As a genus typically associated with forest soils and forming mycorrhizal associations with trees, its presence indicates a potential contribution to plant growth promotion and nutrient acquisition in this environment [57].
Mantel analysis revealed that only total carbon (TC) and total nitrogen (TN) were significantly correlated with the composition of the fungal community (p < 0.05). This finding is consistent with previous research results, indicating that soil organic carbon and nitrogen are key driving factors for the structure of the fungal community, as they play crucial roles in nutrient cycling and energy supply [55]. In particular, saprophytic fungi are highly dependent on the decomposition of organic matter, and this process is directly influenced by the levels of TC and TN [56]. In contrast, the relationships between enzyme activities, total phosphorus, and microbial diversity were not significant. This might be attributed to the complexity of the soil microbial community and the influence of multiple factors. There exists a significant correlation between enzyme activities and soil nutrient contents, which may also obscure the direct correlation with microbial composition [58].
The partial least squares path modeling showed that the positive responses of the soil bacterial community to vegetation type and nutrients were consistent with previous studies, indicating that favorable site conditions and abundant nutrient supply promote the growth and reproduction of bacteria [59]. Soil enzyme activity exhibited a positive response to the soil fungal community, probably due to the crucial role of fungi in soil nutrient cycling. Fungi secrete enzymes to decompose organic matter, thus facilitating nutrient release and cycling [60]. Notably, vegetation type had a significantly positive impact on the bacterial community but a significantly negative impact on the fungal community. This phenomenon may be related to the differences in the ecological niches and resource utilization strategies of bacteria and fungi in the soil [61]. Zhang et al. [62] found that different ecological restoration types, such as natural succession sites and plantation forests, had significant impacts on bacterial and fungal communities. This suggests that site conditions play a vital role in shaping the structure and function of the soil microbial community. Soil nutrients showed a significantly negative response to the fungal community and enzyme activity, while enzyme activity showed a significantly positive response to the soil fungal community. This is because soil enzyme activity may vary depending on soil nutrients and plant species [63].

5. Conclusions

Our study demonstrates that natural broadleaf and shrubland ecosystems in the Golden Huacha Reserve exhibit superior capacity in sustaining soil health and ecosystem resilience. These systems mitigate soil acidification, promote long-term carbon and nitrogen sequestration, and sustain specialized microbial communities, driving nutrient cycling through organic matter decomposition. In contrast, planted forests (bamboo and pine), while increasing short-term nutrient availability, host divergent microbial assemblages that fail to replicate the functional complexity of natural ecosystems. These findings highlight the irreplaceable ecological value of natural forests in maintaining soil–microbe–plant interactions essential for long-term biodiversity conservation. To safeguard protected areas, we advocate integrating natural forest preservation with targeted microbial management in restoration practices, ensuring both nutrient efficiency and ecological stability in karst landscapes.

Supplementary Materials

The following supporting information can be downloaded at https://www.mdpi.com/article/10.3390/f16050865/s1, Figure S1: Rarefaction curves of bacterial (A) and fungal (B) communities. Among them, the horizontal axis represents the leveling depth, and the vertical axis represents the median value of the Chao1 index calculated 10 times, and the box plot. JH: broadleaf forest, GC shrubland, ZL: bamboo forest, SD: moist pine forest; Figure S2: Bacteria (A) and fungi (B) in the top 10 relative abundances at phyla level and bacteria (C) and fungi (D) in the top 10 relative abundances at genus level. JH: broadleaf forest, GC: shrubland, ZL: bamboo forest, SD: moist pine forest.

Author Contributions

Conceptualization, Y.J. and S.X.; methodology, S.W.; software, W.G.; validation, J.Q.; formal analysis, W.Z.; investigation, N.L.; resources, Y.J.; data curation, S.W.; writing—original draft preparation, Y.J.; writing—review and editing, S.X.; visualization, W.Z.; supervision, S.W.; project administration, N.L.; funding acquisition, N.L. All authors have read and agreed to the published version of the manuscript.

Funding

This research was funded by the Key Laboratory of Ecology of Rare and Endangered Species and Environmental Protection (Guangxi Normal University), Ministry of Education, China (ERESEP2023K01), and the National Natural Science Foundation of China (Grant No.32271843), the National Key Research and Development Program of China [grant number 2021YFD2201205].

Data Availability Statement

The data presented in this study are available on request from the corresponding author. The data are not publicly available due to the policy of the institute.

Acknowledgments

The authors have reviewed and edited the output and take full responsibility for the content of this publication.

Conflicts of Interest

Author Weiwei Gu was employed by the company Liaoning Non-Ferrous Geological Exploration and Research Institute Co., Ltd. The remaining authors declare that the research was conducted in the absence of any commercial or financial relationships that could be construed as a potential conflict of interest.

References

  1. Paquette, A.; Messier, C. The Role of Plantations in Managing the World’s Forests in the Anthropocene. Front. Ecol. Environ. 2010, 8, 27–34. [Google Scholar] [CrossRef]
  2. Dai, L.; Li, S.; Zhou, W.; Qi, L.; Zhou, L.; Wei, Y.; Li, J.; Shao, G.; Yu, D. Opportunities and Challenges for the Protection and Ecological Functions Promotion of Natural Forests in China. For. Ecol. Manag. 2018, 410, 187–192. [Google Scholar] [CrossRef]
  3. Aerts, R.; Honnay, O. Forest Restoration, Biodiversity and Ecosystem Functioning. BMC Ecol. 2011, 11, 29. [Google Scholar] [CrossRef] [PubMed]
  4. Phillips, H.R.P.; Bach, E.M.; Bartz, M.L.C.; Bennett, J.M.; Beugnon, R.; Briones, M.J.I.; Brown, G.G.; Ferlian, O.; Gongalsky, K.B.; Guerra, C.A.; et al. Global Data on Earthworm Abundance, Biomass, Diversity and Corresponding Environmental Properties. Sci. Data 2021, 8, 136. [Google Scholar] [CrossRef]
  5. Zhang, Y.; Cao, C.; Han, X.; Jiang, S. Soil Nutrient and Microbiological Property Recoveries via Native Shrub and Semi-Shrub Plantations on Moving Sand Dunes in Northeast China. Ecol. Eng. 2013, 53, 1–5. [Google Scholar] [CrossRef]
  6. Bai, X.; Tang, J.; Wang, W.; Ma, J.; Shi, J.; Ren, W. Organic Amendment Effects on Cropland Soil Organic Carbon and Its Implications: A Global Synthesis. CATENA 2023, 231, 107343. [Google Scholar] [CrossRef]
  7. Ouyang, Y.; Reeve, J.R.; Norton, J.M. Soil Enzyme Activities and Abundance of Microbial Functional Genes Involved in Nitrogen Transformations in an Organic Farming System. Biol. Fertil. Soils 2018, 54, 437–450. [Google Scholar] [CrossRef]
  8. Fan, S.; Sun, H.; Yang, J.; Qin, J.; Shen, D.; Chen, Y. Variations in Soil Enzyme Activities and Microbial Communities along an Altitudinal Gradient on the Eastern Qinghai–Tibetan Plateau. Forests 2021, 12, 681. [Google Scholar] [CrossRef]
  9. Bardgett, R.D.; van der Putten, W.H. Belowground Biodiversity and Ecosystem Functioning. Nature 2014, 515, 505–511. [Google Scholar] [CrossRef]
  10. Pedrinho, A.; Mendes, L.W.; de Araujo Pereira, A.P.; Araujo, A.S.F.; Vaishnav, A.; Karpouzas, D.G.; Singh, B.K. Soil Microbial Diversity Plays an Important Role in Resisting and Restoring Degraded Ecosystems. Plant Soil 2024, 500, 325–349. [Google Scholar] [CrossRef]
  11. Geisen, S.; Briones, M.J.I.; Gan, H.; Behan-Pelletier, V.M.; Friman, V.-P.; de Groot, G.A.; Hannula, S.E.; Lindo, Z.; Philippot, L.; Tiunov, A.V.; et al. A Methodological Framework to Embrace Soil Biodiversity. Soil Biol. Biochem. 2019, 136, 107536. [Google Scholar] [CrossRef]
  12. da Costa, D.P.; Araujo, A.S.F.; de Araujo Pereira, A.P.; Mendes, L.W.; da França, R.F.; da Silva, T.d.G.E.; de Oliveira, J.B.; Araujo, J.S.; Duda, G.P.; Menezes, R.S.C.; et al. Forest-to-Pasture Conversion Modifies the Soil Bacterial Community in Brazilian Dry Forest Caatinga. Sci. Total Environ. 2022, 810, 151943. [Google Scholar] [CrossRef] [PubMed]
  13. Qu, X.; Li, X.; Bardgett, R.D.; Kuzyakov, Y.; Revillini, D.; Sonne, C.; Xia, C.; Ruan, H.; Liu, Y.; Cao, F.; et al. Deforestation Impacts Soil Biodiversity and Ecosystem Services Worldwide. Proc. Natl. Acad. Sci. USA 2024, 121, e2318475121. [Google Scholar] [CrossRef]
  14. Kennedy, A.C.; Smith, K.L. Soil Microbial Diversity and the Sustainability of Agricultural Soils. Plant Soil 1995, 170, 75–86. [Google Scholar] [CrossRef]
  15. Philippot, L.; Chenu, C.; Kappler, A.; Rillig, M.C.; Fierer, N. The Interplay between Microbial Communities and Soil Properties. Nat. Rev. Microbiol. 2024, 22, 226–239. [Google Scholar] [CrossRef]
  16. Bowles, T.M.; Acosta-Martínez, V.; Calderón, F.; Jackson, L.E. Soil Enzyme Activities, Microbial Communities, and Carbon and Nitrogen Availability in Organic Agroecosystems across an Intensively-Managed Agricultural Landscape. Soil Biol. Biochem. 2014, 68, 252–262. [Google Scholar] [CrossRef]
  17. Nannipieri, P.; Ascher, J.; Ceccherini, M.T.; Landi, L.; Pietramellara, G.; Renella, G. Microbial Diversity and Soil Functions. Eur. J. Soil Sci. 2017, 68, 12–26. [Google Scholar] [CrossRef]
  18. Burns, R.G.; DeForest, J.L.; Marxsen, J.; Sinsabaugh, R.L.; Stromberger, M.E.; Wallenstein, M.D.; Weintraub, M.N.; Zoppini, A. Soil Enzymes in a Changing Environment: Current Knowledge and Future Directions. Soil Biol. Biochem. 2013, 58, 216–234. [Google Scholar] [CrossRef]
  19. Dick, R.P. Soil Enzyme Activities as Indicators of Soil Quality; Doran, J.W., Coleman, D.C., Bezdicek, D.F., Stewart, B.A., Eds.; Soil Science Society of America and American Society of Agronomy: Madison, WI, USA, 2015; pp. 107–124. [Google Scholar]
  20. Fierer, N.; Jackson, R.B. The Diversity and Biogeography of Soil Bacterial Communities. Proc. Natl. Acad. Sci. USA 2006, 103, 626–631. [Google Scholar] [CrossRef]
  21. Liu, J.; Zhang, W.; Teng, C.; Pang, Z.; Peng, Y.; Qiu, J.; Lei, J.; Su, X.; Zhu, W.; Ding, C. Intercropping Changed the Soil Microbial Community Composition but No Significant Effect on Alpha Diversity. Front. Microbiol. 2024, 15, 1370996. [Google Scholar] [CrossRef]
  22. Liu, J.; Ding, C.; Teng, C.; Zhang, W.; Su, X.; Zhu, W. Impacts of Litter Microbial Community on Litter Decomposition in the Absence of Soil Microorganisms. Appl. Environ. Microbiol. 2024, 90, e0023924. [Google Scholar] [CrossRef] [PubMed]
  23. Yin, X.; Zhang, W.; Li, D.; Wang, R.; Cong, X.; Pang, Z.; Peng, Y.; Ge, Y.; Zhu, W.; Ding, C. Factors Influencing the Change of Phyllosphere Microbial Community of Three Populus Spp. in the Same Habitat. Forests 2024, 15, 1453. [Google Scholar] [CrossRef]
  24. Liu, J.; Zhao, W.; Huo, Y.; Cong, X.; Tian, Y.; Liu, Y.; Zhu, W.; Su, X.; Zhang, W.; Ding, C. Arbuscular Mycorrhizal Fungi Communities Vary between Poplar Species in the Same Habitat. Rhizosphere 2024, 29, 100827. [Google Scholar] [CrossRef]
  25. Shannon, C.E. A Mathematical Theory of Communication. Bell Syst. Tech. J. 1948, 27, 379–423. [Google Scholar] [CrossRef]
  26. Pielou, E.C. The Measurement of Diversity in Different Types of Biological Collections. J. Theor. Biol. 1966, 13, 131–144. [Google Scholar] [CrossRef]
  27. Chao, A. Nonparametric Estimation of the Number of Classes in a Population. Scand. J. Statist. 1984, 11, 265–270. [Google Scholar]
  28. Mao, X.; Van Zwieten, L.; Zhang, M.; Qiu, Z.; Yao, Y.; Wang, H. Soil Parent Material Controls Organic Matter Stocks and Retention Patterns in Subtropical China. J. Soils Sediments 2020, 20, 2426–2438. [Google Scholar] [CrossRef]
  29. Chen, Y.; Wei, T.; Sha, G.; Zhu, Q.; Liu, Z.; Ren, K.; Yang, C. Soil Enzyme Activities of Typical Plant Communities after Vegetation Restoration on the Loess Plateau, China. Appl. Soil Ecol. 2022, 170, 104292. [Google Scholar] [CrossRef]
  30. Li, H.; Meng, Z.; Ren, X.; Han, Y. Variations in the Physicochemical Properties of Soil, Enzyme Activities, and the Characteristics of Bacterial Communities within Algal Biocrusts and Subsoils across Different Plant Communities. Glob. Ecol. Conserv. 2025, 58, e03455. [Google Scholar] [CrossRef]
  31. Bondeau, A.; Smith, P.C.; Zaehle, S.; Schaphoff, S.; Lucht, W.; Cramer, W.; Gerten, D.; Lotze-Campen, H.; Müller, C.; Reichstein, M.; et al. Modelling the Role of Agriculture for the 20th Century Global Terrestrial Carbon Balance. Glob. Change Biol. 2007, 13, 679–706. [Google Scholar] [CrossRef]
  32. Johnson, D.W.; Curtis, P.S. Effects of Forest Management on Soil C and N Storage: Meta Analysis. For. Ecol. Manag. 2001, 140, 227–238. [Google Scholar] [CrossRef]
  33. Xu, C.; Lin, T.-C.; Yang, Z.; Liu, X.; Xiong, D.; Chen, S.; Wu, F.; Yang, Y. Forest Conversion Effects on Soil Organic Carbon Are Regulated by Soil Aggregate Stability and Not by Recalcitrance: Evidence from a Reforestation Experiment. CATENA 2022, 219, 106613. [Google Scholar] [CrossRef]
  34. Wu, Y.T.; Gutknecht, J.; Nadrowski, K.; Geißler, C.; Kühn, P.; Scholten, T.; Both, S.; Erfmeier, A.; Böhnke, M.; Bruelheide, H.; et al. Relationships Between Soil Microorganisms, Plant Communities, and Soil Characteristics in Chinese Subtropical Forests. Ecosystems 2012, 15, 624–636. [Google Scholar] [CrossRef]
  35. Hooper, D.U.; Vitousek, P.M. Effects of Plant Composition and Diversity on Nutrient Cycling. Ecol. Monogr. 1998, 68, 121–149. [Google Scholar] [CrossRef]
  36. Yang, Y.; Guo, J.; Chen, G.; Yin, Y.; Gao, R.; Lin, C. Effects of Forest Conversion on Soil Labile Organic Carbon Fractions and Aggregate Stability in Subtropical China. Plant Soil 2009, 323, 153–162. [Google Scholar] [CrossRef]
  37. Wang, L.; Chen, Y.; Zhou, Y.; Zheng, H.; Xu, Z.; Tan, B.; You, C.; Zhang, L.; Li, H.; Guo, L.; et al. Litter Chemical Traits Strongly Drove the Carbon Fractions Loss during Decomposition across an Alpine Treeline Ecotone. Sci. Total Environ. 2021, 753, 142287. [Google Scholar] [CrossRef]
  38. Carneiro, L.M.; do Rosário Zucchi, M.; de Jesus, T.B.; da Silva Júnior, J.B.; Hadlich, G.M. δ13C, δ15N and TOC/TN as Indicators of the Origin of Organic Matter in Sediment Samples from the Estuary of a Tropical River. Mar. Pollut. Bull. 2021, 172, 112857. [Google Scholar] [CrossRef]
  39. Zhao, Q.; Classen, A.T.; Wang, W.-W.; Zhao, X.-R.; Mao, B.; Zeng, D.-H. Asymmetric Effects of Litter Removal and Litter Addition on the Structure and Function of Soil Microbial Communities in a Managed Pine Forest. Plant Soil 2017, 414, 81–93. [Google Scholar] [CrossRef]
  40. Xie, X.; Pu, L.; Wang, Q.; Zhu, M.; Xu, Y.; Zhang, M. Response of Soil Physicochemical Properties and Enzyme Activities to Long-Term Reclamation of Coastal Saline Soil, Eastern China. Sci. Total Environ. 2017, 607–608, 1419–1427. [Google Scholar] [CrossRef]
  41. Fei, Y.; Huang, S.; Zhang, H.; Tong, Y.; Wen, D.; Xia, X.; Wang, H.; Luo, Y.; Barceló, D. Response of Soil Enzyme Activities and Bacterial Communities to the Accumulation of Microplastics in an Acid Cropped Soil. Sci. Total Environ. 2020, 707, 135634. [Google Scholar] [CrossRef]
  42. Barbero, F.M.; Dominchin, M.F.; Verdenelli, R.A.; Frasier, I.; Restovich, S.B.; Campilongo Mancilla, E.J.; Mlewski, E.C.; Labuckas, D.; Vargas Gil, S.; Meriles, J.M. Impact of Land Use Changes on Soil Chemical Properties, Enzyme Activities and Microbial Communities in Two Contrasting Localities of the Argentinian Pampas. Appl. Soil Ecol. 2025, 206, 105836. [Google Scholar] [CrossRef]
  43. Guo, J.; Wu, Y.; Wu, X.; Ren, Z.; Wang, G. Soil Bacterial Community Composition and Diversity Response to Land Conversion Is Depth-Dependent. Glob. Ecol. Conserv. 2021, 32, e01923. [Google Scholar] [CrossRef]
  44. Li, W.; Li, J.; Ahmad Bhat, S.; Wei, Y.; Deng, Z.; Li, F. Elimination of Antibiotic Resistance Genes from Excess Activated Sludge Added for Effective Treatment of Fruit and Vegetable Waste in a Novel Vermireactor. Bioresour. Technol. 2021, 325, 124695. [Google Scholar] [CrossRef]
  45. Ma, W.; Li, J.; Gao, Y.; Xing, F.; Sun, S.; Zhang, T.; Zhu, X.; Chen, C.; Li, Z. Responses of Soil Extracellular Enzyme Activities and Microbial Community Properties to Interaction between Nitrogen Addition and Increased Precipitation in a Semi-Arid Grassland Ecosystem. Sci. Total Environ. 2020, 703, 134691. [Google Scholar] [CrossRef] [PubMed]
  46. Liu, X.; Ju, X.; Zhang, Y.; He, C.; Kopsch, J.; Fusuo, Z. Nitrogen Deposition in Agroecosystems in the Beijing Area. Agric. Ecosyst. Environ. 2006, 113, 370–377. [Google Scholar] [CrossRef]
  47. Fierer, N.; Bradford, M.A.; Jackson, R.B. Toward an Ecological Classification of Soil Bacteria. Ecology 2007, 88, 1354–1364. [Google Scholar] [CrossRef]
  48. Lauber, C.L.; Hamady, M.; Knight, R.; Fierer, N. Pyrosequencing-Based Assessment of Soil pH as a Predictor of Soil Bacterial Community Structure at the Continental Scale. Appl. Environ. Microbiol. 2009, 75, 5111–5120. [Google Scholar] [CrossRef]
  49. Delgado-Baquerizo, M.; Maestre, F.T.; Reich, P.B.; Jeffries, T.C.; Gaitan, J.J.; Encinar, D.; Berdugo, M.; Campbell, C.D.; Singh, B.K. Microbial Diversity Drives Multifunctionality in Terrestrial Ecosystems. Nat. Commun. 2016, 7, 10541. [Google Scholar] [CrossRef]
  50. Barka, E.A.; Vatsa, P.; Sanchez, L.; Gaveau-Vaillant, N.; Jacquard, C.; Meier-Kolthoff, J.P.; Klenk, H.-P.; Clément, C.; Ouhdouch, Y.; van Wezel, G.P. Taxonomy, Physiology, and Natural Products of Actinobacteria. Microbiol. Mol. Biol. Rev. 2016, 80, 1–43. [Google Scholar] [CrossRef]
  51. Lindenmuth, B.E.; McDonald, K.A. Production and Characterization of Acidothermus cellulolyticus Endoglucanase in Pichia pastoris. Protein Expr. Purif. 2011, 77, 153–158. [Google Scholar] [CrossRef]
  52. Tedersoo, L.; Bahram, M.; Põlme, S.; Kõljalg, U.; Yorou, N.S.; Wijesundera, R.; Ruiz, L.V.; Vasco-Palacios, A.M.; Thu, P.Q.; Suija, A.; et al. Global Diversity and Geography of Soil Fungi. Science 2014, 346, 1256688. [Google Scholar] [CrossRef] [PubMed]
  53. Häkkinen, L.; Pessi, I.S.; Salonen, A.-R.; Uhlgren, O.; Soinne, H.; Hultman, J.; Heinonsalo, J. Fungal Communities in Boreal Soils Are Influenced by Land Use, Agricultural Soil Management, and Depth. FEMS Microbiol. Ecol. 2025, 101, fiaf002. [Google Scholar] [CrossRef] [PubMed]
  54. Liu, J.; Wei, Y.; Yin, Y.; Zhu, K.; Liu, Y.; Ding, H.; Lei, J.; Zhu, W.; Zhou, Y. Effects of Mixed Decomposition of Pinus Sylvestris Var. Mongolica and Morus Alba Litter on Microbial Diversity. Microorganisms 2022, 10, 1117. [Google Scholar] [CrossRef]
  55. Su, F.; Hao, M.; Wei, X. Soil Organic C and N Dynamics as Affected by 31 Years Cropping Systems and Fertilization in Highland Agroecosystems. Agric. Ecosyst. Environ. 2022, 326, 107769. [Google Scholar] [CrossRef]
  56. Baldrian, P.; Kolařík, M.; Štursová, M.; Kopecký, J.; Valášková, V.; Větrovský, T.; Žifčáková, L.; Šnajdr, J.; Rídl, J.; Vlček, Č.; et al. Active and Total Microbial Communities in Forest Soil Are Largely Different and Highly Stratified during Decomposition. ISME J. 2012, 6, 248–258. [Google Scholar] [CrossRef] [PubMed]
  57. Chen, X.; Yu, W.-J.; Bau, T.; Matheny, P.B.; Horak, E.; Liu, Y.; Qin, L.-W.; Tang, L.-P.; Ge, Y.-P.; Liu, T.-Z.; et al. Contributions to the Inocybe Umbratica-Paludinella (Agaricales) Group in China: Taxonomy, Species Diversity, and Molecular Phylogeny. J. Fungi 2024, 10, 893. [Google Scholar] [CrossRef]
  58. Fierer, N.; McCain, C.M.; Meir, P.; Zimmermann, M.; Rapp, J.M.; Silman, M.R.; Knight, R. Microbes Do Not Follow the Elevational Diversity Patterns of Plants and Animals. Ecology 2011, 92, 797–804. [Google Scholar] [CrossRef]
  59. Deltedesco, E.; Keiblinger, K.M.; Piepho, H.-P.; Antonielli, L.; Pötsch, E.M.; Zechmeister-Boltenstern, S.; Gorfer, M. Soil Microbial Community Structure and Function Mainly Respond to Indirect Effects in a Multifactorial Climate Manipulation Experiment. Soil Biol. Biochem. 2020, 142, 107704. [Google Scholar] [CrossRef]
  60. Burke, D.J.; Weintraub, M.N.; Hewins, C.R.; Kalisz, S. Relationship between Soil Enzyme Activities, Nutrient Cycling and Soil Fungal Communities in a Northern Hardwood Forest. Soil Biol. Biochem. 2011, 43, 795–803. [Google Scholar] [CrossRef]
  61. Danielson, R.E.; Mcginnis, M.L.; Holub, S.M.; Myrold, D.D. Soil Fungal and Prokaryotic Community Structure Exhibits Differential Short-Term Responses to Timber Harvest in the Pacific Northwest. Pedosphere 2020, 30, 109–125. [Google Scholar] [CrossRef]
  62. Zhang, B.; Qin, S.; Guan, X.; Jiang, K.; Jiang, M.; Liu, F. Distribution of Antibiotic Resistance Genes in Karst River and Its Ecological Risk. Water Res. 2021, 203, 117507. [Google Scholar] [CrossRef] [PubMed]
  63. Yang, Y.; Fang, H.; Cheng, S.; Xu, L.; Lu, M.; Guo, Y.; Li, Y.; Zhou, Y. Soil Enzyme Activity Regulates the Response of Soil C Fluxes to N Fertilization in a Temperate Cultivated Grassland. Atmosphere 2022, 13, 777. [Google Scholar] [CrossRef]
Figure 1. Picture of the sample sites. JH: broadleaf forest, GC: shrubland, ZL: bamboo forest, SD: moist pine forest.
Forests 16 00865 g001
Figure 2. Mantel analysis of soil nutrients, enzyme activity, and microbial community composition and diversity. TC: total carbon, TN: total nitrogen, TP: total phosphorus, NH4+-N: ammonium nitrogen, NO3-N: nitrate nitrogen; AP: Available phosphorus; * indicates p < 0.05, *** indicates p < 0.001.
Forests 16 00865 g002
Figure 3. Venn diagram of bacterial (A) and fungal (B) communities. JH: broadleaf forest, GC: shrubland, ZL: bamboo forest, SD: moist pine forest.
Forests 16 00865 g003
Figure 4. Alpha diversity boxplot of bacterial (A) and fungal (B) communities. JH: broadleaf forest, GC: shrubland, ZL: bamboo forest, SD: moist pine forest.
Forests 16 00865 g004
Figure 5. Principal coordinates analysis (PCoA) scores of bacterial (A) and fungal (B) communities. JH: broadleaf forest, GC: shrubland, ZL: bamboo forest, SD: moist pine forest.
Forests 16 00865 g005
Figure 6. LefSe of bacterial community. JH: broadleaf forest, GC: shrubland, ZL: bamboo forest, SD: moist pine forest.
Forests 16 00865 g006
Figure 7. LefSe in fungal community. JH: broadleaf forest, GC: shrubland, ZL: bamboo forest, SD: moist pine forest.
Forests 16 00865 g007
Figure 8. Partial least squares path modeling analysis of soil nutrients, enzyme activity, and microbial community composition and diversity in different site modes. The numbers represent the path coefficients. Orange indicates a positive path coefficient, and green indicates a negative one. A solid line indicates p < 0.05, while a dashed line indicates p > 0.05.
Forests 16 00865 g008
Table 1. Soil chemical property.
pHTC
(g/kg)
TN
(g/kg)
NH4+-N (mg/kg)NO3-N
(mg/kg)
TP
(g/kg)
AP
(mg/kg)
ZL5.17 ± 0.16 A28.29 ± 3.52 B2.17 ± 0.07 B7.06 ± 0.65 A14.61 ± 1.04 B0.18 ± 0.03 A22.73 ± 3.60 A
JH5.76 ± 0.19 A39.76 ± 3.64 AB3.13 ± 0.18 B6.31 ± 0.36 A23.69 ± 4.96 A0.05 ± 0.02 B18.42 ± 2.97 A
SD5.45 ± 0.24 A26.74 ± 2.51 B2.22 ± 0.26 B6.94 ± 0.95 A10.68 ± 0.69 B0.08 ± 0.03 AB19.38 ± 3.80 A
GC5.56 ± 0.39 A52.97 ± 6.81 A4.69 ± 0.70 A5.78 ± 0.67 A13.54 ± 1.11 B0.17 ± 0.02 A19.86 ± 3.10 A
F-value0.907.569.230.744.615.570.30
p-value0.470.0040.0020.550.020.010.82
Different capital letters indicate that there is a significant difference in this indicator (p < 0.05). JH: broadleaf forest, GC: shrubland, ZL: bamboo forest, SD: moist pine forest; TC: total carbon, TN: total nitrogen, NH4+-N: ammonium nitrogen, NO3-N: nitrate nitrogen; TP: total phosphorus; AP: Available phosphorus.
Table 2. Soil enzyme activity.
α-Amylase (mg/g)Urease (mg/g)Phosphatase (mg/g)β-Glucosidase (mg/g)
ZL18.74 ± 1.8 A86.03 ± 4.94 A84.14 ± 4.84 A228.53 ± 11.46 A
JH10.54 ± 0.75 B86.65 ± 10.07 A84.74 ± 9.87 A280.31 ± 7.39 A
SD9.4 ± 0.86 B38.65 ± 4.24 B37.72 ± 4.16 B244.41 ± 9.91 A
GC13.67 ± 1.69 B7.67 ± 0.93 C7.4 ± 0.89 C176.09 ± 29.43 B
F-value9.43141.19541.1736.521
p-value0.0021.35 × 10−61.36 × 10−60.007
Different capital letters indicate that there is a significant difference in this indicator (p < 0.05). JH: broadleaf forest, GC: shrubland, ZL: bamboo forest, SD: moist pine forest.
Table 3. Differences between groups.
Group 1Group 2PermutationsPseudo-Fp-Valueq-Value
Bacterial
community
all-9993.1826130.001-
JHGC9992.5765140.030.042
JHZL9995.5655390.0350.042
JHSD9994.4308990.0290.042
GCZL9992.5633850.0240.042
GCSD9991.6307880.0830.083
ZLSD9993.24430.0230.042
Fungal
community
all-9992.5086560.001-
JHGC9991.8508860.0200.034
JHZL9993.6467260.0290.034
JHSD9992.7449550.0320.034
GCZL9992.4337560.0300.034
GCSD9991.6539280.0230.034
ZLSD9993.057050.0340.034
JH: broadleaf forest, GC: shrubland, ZL: bamboo forest, SD: moist pine forest.
Disclaimer/Publisher’s Note: The statements, opinions and data contained in all publications are solely those of the individual author(s) and contributor(s) and not of MDPI and/or the editor(s). MDPI and/or the editor(s) disclaim responsibility for any injury to people or property resulting from any ideas, methods, instructions or products referred to in the content.

