Article

SF-UNet: An Adaptive Cross-Level Residual Cascade for Forest Hyperspectral Image Classification Algorithm by Fusing SpectralFormer and U-Net

1
School of Information, Yunnan University of Finance and Economics, Kunming 650221, China
2
Yunnan Key Laboratory of Service Computing, Kunming 650221, China
3
School of Automation, Guangxi University of Science and Technology, Liuzhou 545006, China
4
School of Civil Engineering and Architecture, Guangxi University of Science and Technology, Liuzhou 545006, China
*
Authors to whom correspondence should be addressed.
Forests 2025, 16(5), 858; https://doi.org/10.3390/f16050858
Submission received: 25 April 2025 / Revised: 16 May 2025 / Accepted: 19 May 2025 / Published: 20 May 2025

Abstract

:
Traditional deep learning algorithms struggle to effectively utilize local spectral info in forest HS images and adequately capture subtle feature differences, often causing model confusion and misclassification. To tackle these issues, we present SF-UNet, a novel pixel-level classification network for forest HS images. It integrates the strengths of SpectralFormer and U-Net. First, the HGSE module generates semicomponent spectral nesting, strengthening local info element connections via spectral embedding. Next, the CAM within SpectralFormer serves as an auxiliary U-Net encoder. This allows cross-level jump connections and cascading through interlayer soft residuals, enhancing feature representation via cross-regional adaptive learning. Finally, the U-Net decoder is used for pixel-level classification. Experiments on forest Sentinel-2 data show that SF-UNet outperforms mainstream frameworks. While Vision Transformer has an 88.29% classification accuracy, SF-UNet achieves 95.28%, a significant 6.99% improvement. Moreover, SF-UNet excels in land cover change analysis using multi-temporal Sentinel-2 images. It can accurately capture subtle land use changes and maintain classification consistency across seasons and years. These results highlight SF-UNet’s effectiveness in forest remote sensing image classification and its potential application value in deep learning-based forest HS remote sensing image classification research.

1. Introduction

Forests, the Earth’s green treasures, are vital for ecological balance and human survival. They are complex ecosystems with diverse plant species, varying densities, and rich topographical features. The multi-layered structure of forests creates intricate spectral and spatial information patterns. Sunlight interacting with forest canopies produces unique spectral signatures that vary with tree species, health, and growth stages. Understorey vegetation, influenced by canopy density and light penetration, adds another layer to spectral information. The topography of forested areas further complicates spectral characteristics, with slope, aspect, and elevation causing spectral reflectance variations. These inherent forest features make accurate classification and analysis challenging but essential.
In the realm of forestry research, the integration of advanced remote sensing technologies has ushered in a new era of forest classification and monitoring. Accurate assessment of forest resources is crucial for sustainable management, biodiversity conservation, and ecosystem service evaluation. Traditional classification methods like Support Vector Machines (SVMs) and Random Forests (RFs) have contributed significantly to forest classification but often struggle with the high dimensionality and complex spectral–spatial information in forest hyperspectral images. Deep learning approaches, including convolutional neural networks (CNN) and U-Net, have shown greater capability in handling such complexity. However, they still face limitations in capturing long-range dependencies and fine-grained details critical for distinguishing subtle features among forest components. Semantic segmentation has emerged as a pivotal technique in computational vision, addressing pixel-level classification tasks through deep neural architectures. It has found significant implementation in forestry remote sensing systems, with operational deployments spanning applications like precision forestry resource auditing, multi-temporal canopy vitality assessment, and ecosystem biodiversity preservation.
As spatial resolution thresholds in earth observation systems progressively break through technical barriers, modern forestry research confronts massive streams of radiometrically calibrated canopy images. This paradigm shift demands innovative approaches for hierarchical feature abstraction, particularly in developing trainable architectures that transform raw spectral signatures into quantifiable ecological indicators for computational forestry applications. Semantic segmentation [1] has emerged as a pivotal technique in computational vision, fundamentally addressing pixel-level classification tasks through deep neural architectures. This methodology has found significant implementation in forestry remote sensing systems, with operational deployments now spanning critical applications including precision forestry resource auditing, multi-temporal canopy vitality assessment, and ecosystem biodiversity preservation [2,3,4,5].
Multispectral remote sensing [6] refers to the synchronized photographic remote sensing of different bands of the electromagnetic spectrum using a multispectral photography system or a multispectral scanning system, so as to obtain the image data of vegetation and other features in different bands. Multispectral remote sensing can not only discriminate features based on morphological and structural differences in the images, but also categorize features based on differences in spectral characteristics, thus expanding the information content of remote sensing data.
The advent of deep convolutional architectures has witnessed transformative breakthroughs in feature extraction capabilities since 2017, with CNN variants achieving unprecedented performance milestones in hierarchical representation learning. This architectural evolution, fueled by parallel computing breakthroughs and novel regularization paradigms, continues to redefine state-of-the-art benchmarks across multimodal data processing domains [7], providing powerful technical support for semantic segmentation. Following this, researchers have proposed many innovative approaches. Among them, the encoder–decoder paradigm, demonstrating architectural superiority in semantic segmentation frameworks [8], has evolved into the dominant framework through its hierarchical feature abstraction mechanism. This dual-path architecture employs convolutional hierarchies for multiscale feature extraction, while synchronously implementing resolution restoration through cross-stage feature fusion that strategically combines contextual abstractions with granular textural details during upsampling operations. For example, U-Net [9] utilizes the decoder to learn the spatial correlation of the encoder process through skip connections.
However, the special characteristics of features [10,11,12,13] (e.g., small scale, high similarity, and mutual occlusion) pose new challenges to semantic segmentation of remote sensing images. CNNs commonly employ feature downsampling strategies during the feature extraction phase to optimize computational efficiency; however, this approach often compromises the preservation of fine-grained details. Furthermore, the challenge arises when distinct semantic categories exhibit comparable spectral, dimensional, and material characteristics, which poses significant challenges for accurate discrimination. The occlusion problem [14] also often leads to semantic ambiguity (SEM). Therefore, to address these challenges, more global contextual information and fine-grained spatial features are needed to be used as cues for semantic reasoning.
CNN has certain advantages in processing spatial location information, but due to its localization, it is more difficult to directly model global semantic interactions and contextual information. In order to solve this problem, existing methods adopt the attention mechanism [15]. For example, DANet [16] employs parallel channel attention and location attention to construct long-range dependencies. Contemporary methodologies employing multiscale feature fusion frameworks [17] typically aggregate localized CNN-derived patterns through hierarchical feature aggregation mechanisms, rather than explicitly modeling global contextual interdependencies. This architectural limitation becomes particularly pronounced when processing ecologically complex remote sensing scenes, where inadequate contextual modeling compromises holistic scene comprehension amidst intricate background textures and overlapping spectral signatures.
Recently, the Transformer [18] model has achieved success in global relationship modeling and opened up new research ideas in this field. Transformer is widely used as a popular sequence prediction model in the field of natural language processing. Similar to CNN-based models, studies have shown that multiscale feature representation is equally effective for Vision Transformer (ViT).
Pioneering works including TransUNet [19] and TransFuse [20] have critically identified performance limitations in pure Transformer-based segmentation frameworks, primarily stemming from their inherent bias towards global context modeling at the expense of spatial acuity. To reconcile this dichotomy, hybrid computational paradigms integrating CNN–Transformer synergies have emerged [21,22]. TransUNet innovates through cascaded encoder architecture where convolutional feature hierarchies precede Transformer-based context aggregation, whereas TransFuse implements parallel modality fusion with coordinated multi-branch processing. Notably, the latter employs iterative feature upsampling within its Transformer decoder pathway, leveraging learned interpolation kernels for spatial resolution recovery while preserving attention-driven feature correlations. Based on this structure, researchers constructed SpectralFormer [23] and demonstrated great potential in remote sensing image segmentation tasks.
Inspired by previous notable research [24], this paper addresses the aforementioned challenges by introducing a novel network framework suitable for pixel-level classification of forest hyperspectral images, dubbed SF-UNet. Leveraging SpectralFormer to augment U-Net, the framework synergizes the strengths of both architectures. Initially, the HGSE module is employed to generate semiset spectral nesting, enhancing local information connectivity. Subsequently, integrating the CAM module’s SpectralFormer as an auxiliary encoder within the U-Net structure enables cross-level jump connections, facilitating the cascading of soft residuals between layers through cross-region adaptive learning, thereby enhancing feature representation. Ultimately, the U-Net decoder is employed to yield classification outcomes, ensuring high-performance hyperspectral image classification tasks at the pixel level for forest applications.
The main contributions of this paper can be summarized as follows:
  • To overcome the inherent constraints of conventional deep learning architectures in geospatial imagery analysis—where sub-optimal exploitation of spectral–textural correlations and insufficient discriminative capacity for endmember variability frequently induce cross-category confusion—we devise an innovative hybrid architecture. This architectural innovation synergistically integrates U-Net’s hierarchical feature abstraction with SpectralFormer’s spectral attention mechanisms, establishing a spectrally-aware classification framework optimized for hyperspectral datacubes.
  • To design a novel HGSE method to generate semiset spectral nesting, thereby enhancing connectivity among local information, and develop the HCAF method for effectively fusing semi-sequential features, enabling adaptive cross-layer feature fusion from intricate details.
  • Incorporate a CAM module into SpectralFormer to enable the capture of cross-channel information while attenuating irrelevant channel data. This enhancement not only aids in pinpointing and identifying targets of interest more accurately but also contributes to overall model performance improvement.

2. Data and Algorithms

2.1. Forest Multispectral Data

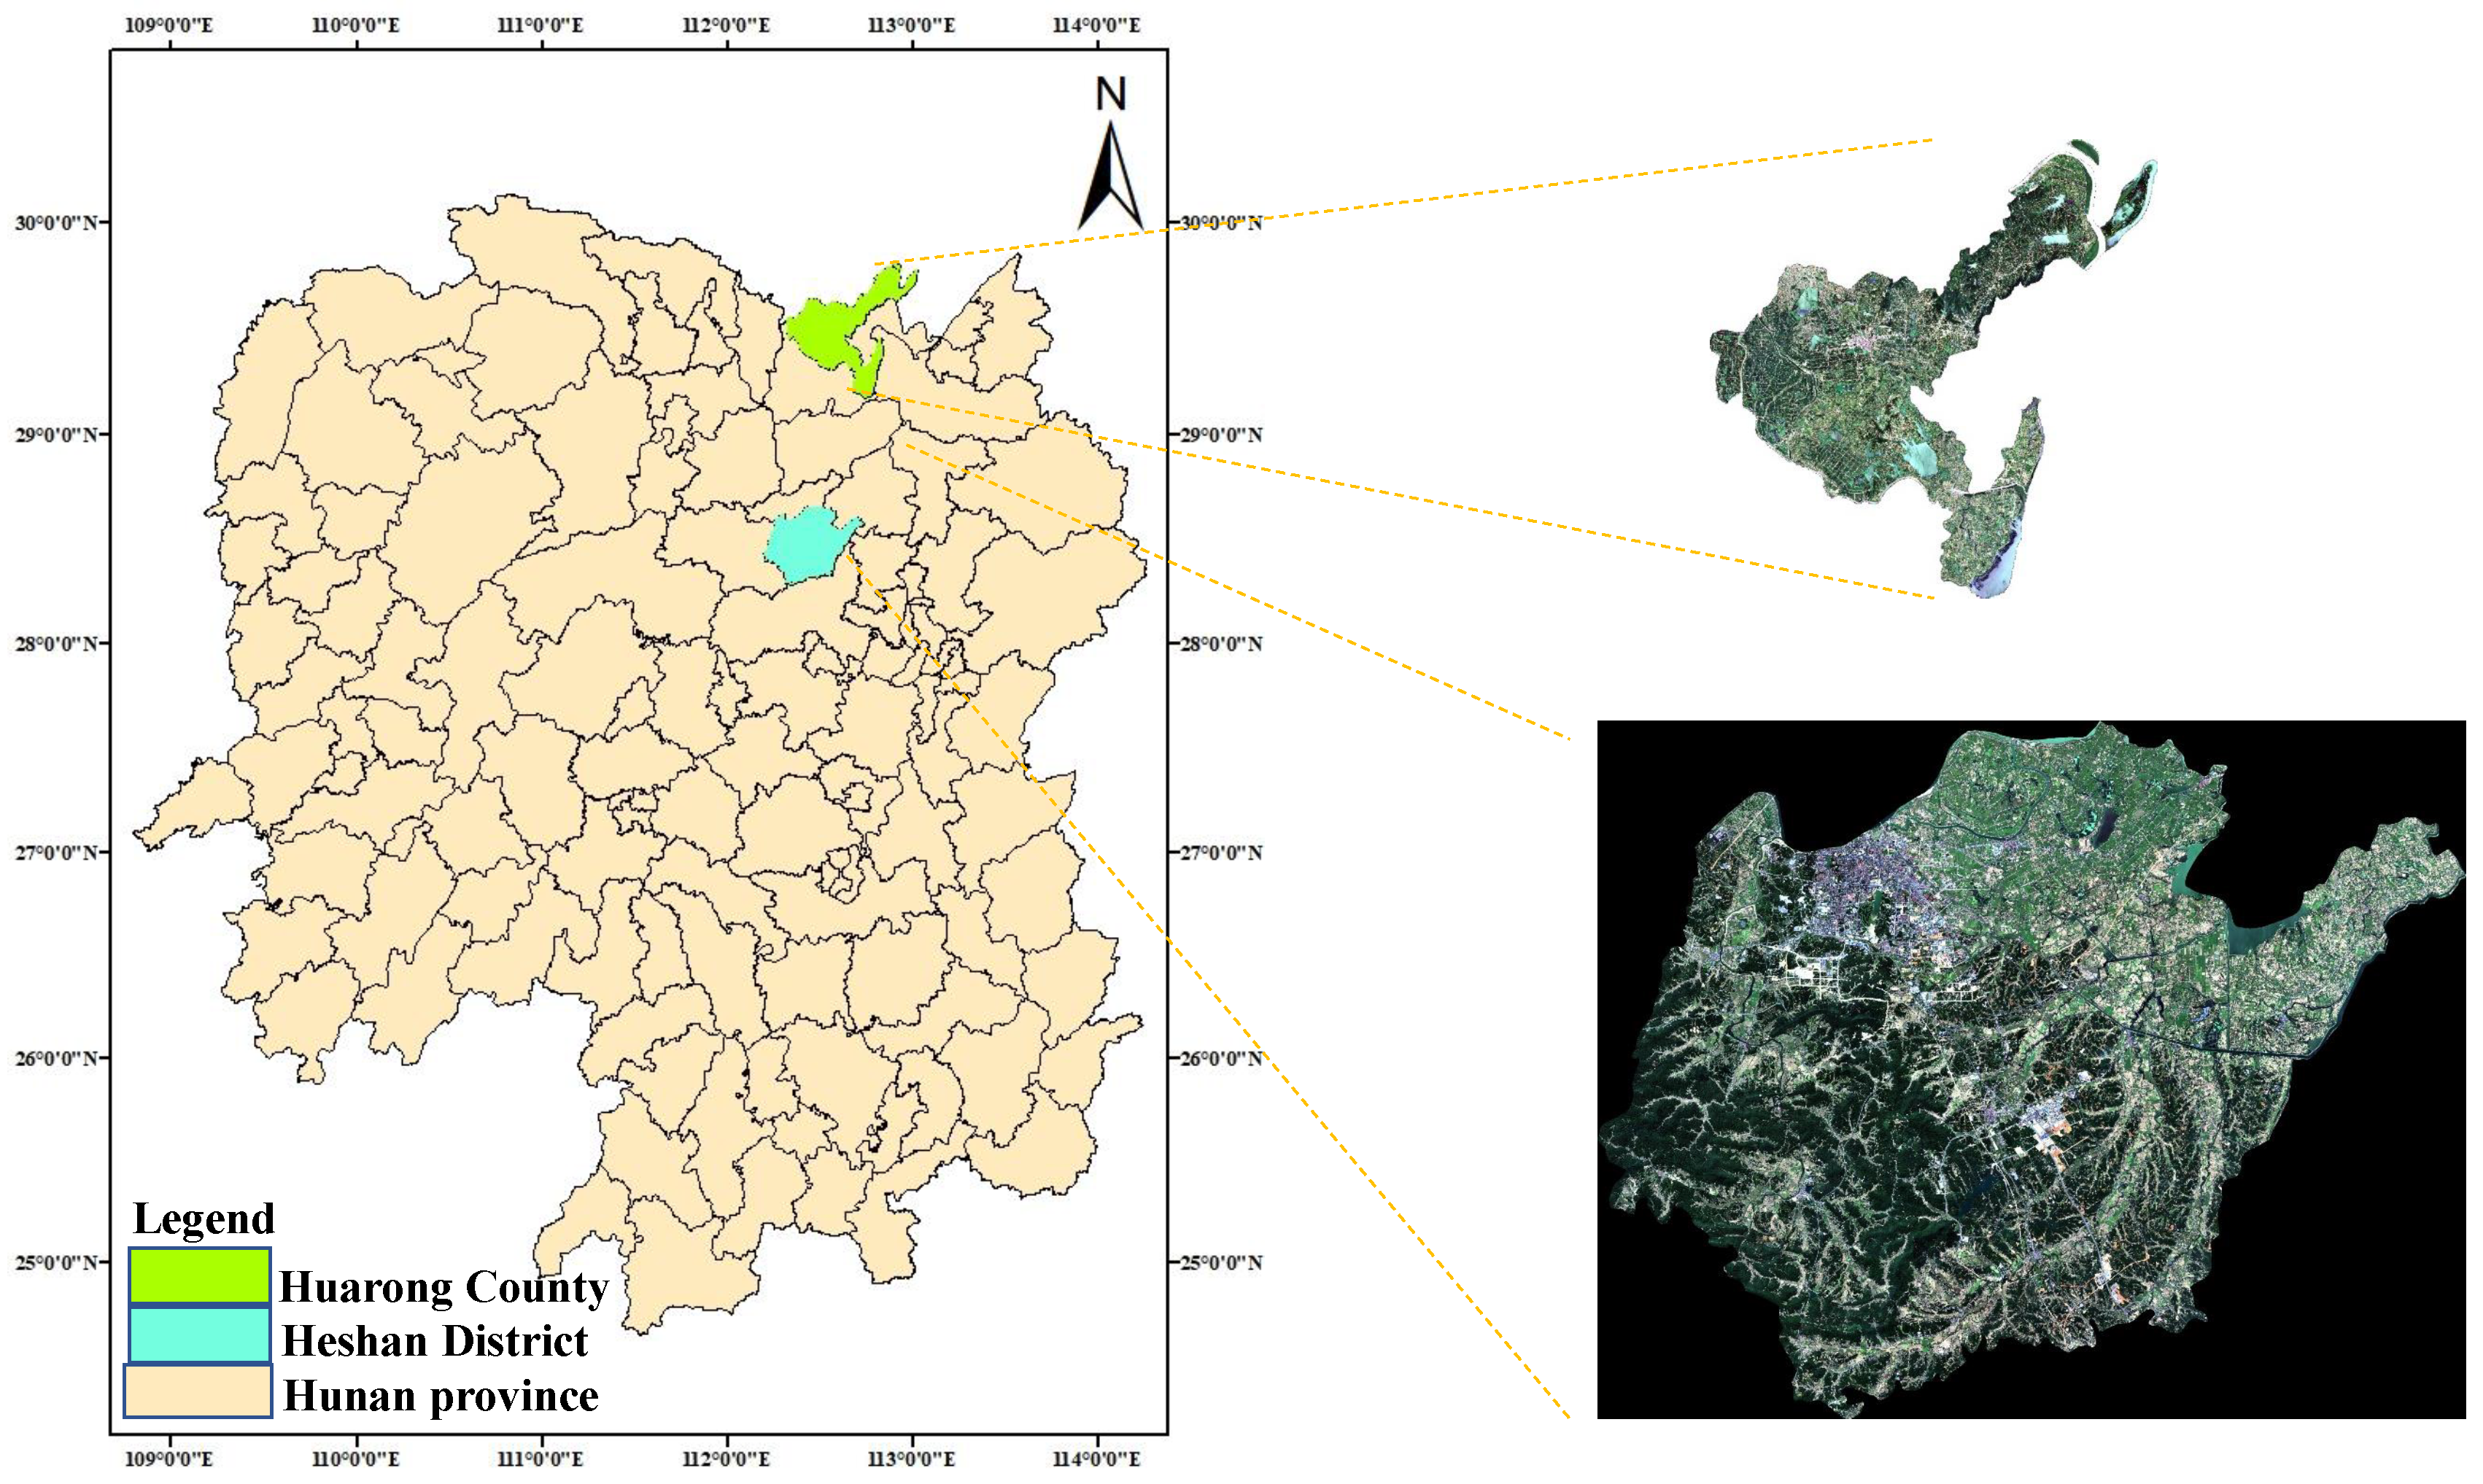
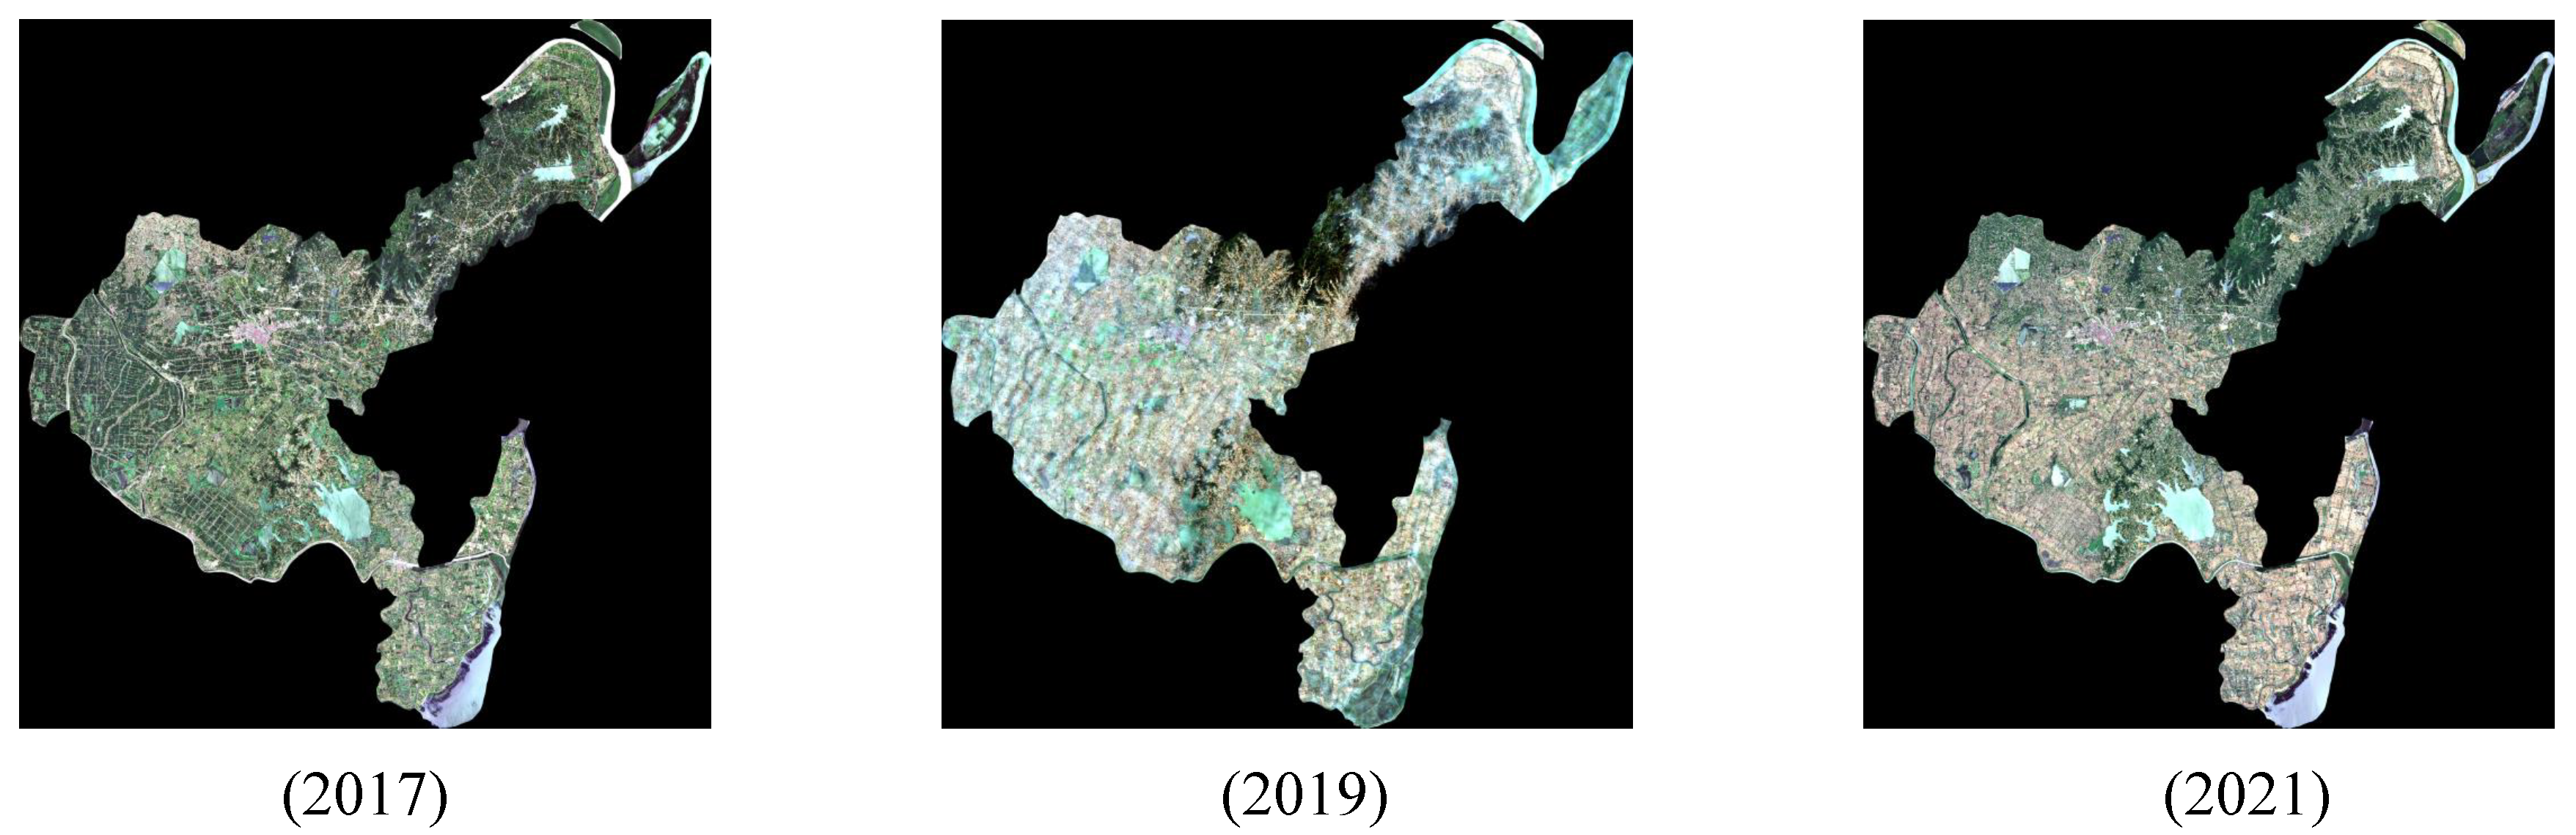
Heshan District, situated in Hunan Province, China, represents a typical mountainous region characterized by diverse terrain. The landscape predominantly comprises hills and mountains, resulting in intricate and varied topography. Factors such as topography, geomorphology, vegetation cover, and land use significantly influence the classification of forest features in this area. For instance, densely vegetated slopes contrast with rocky, barren areas in mountainous terrain, while river valleys exhibit distinct features such as water bodies, vegetation along riverbanks, human settlements, and other elements. Therefore, accurately and efficiently categorizing local features through remote sensing holds paramount importance in this context. The study area shown in Figure 1.
The experimental framework employs Level 1C Sentinel-2 multispectral data (Mission ID: S2MSI1C) acquired on 6 June 2021 (UTC 10:30:21), characterized by 10 m spatial resolution across 13 spectral channels spanning VNIR-SWIR regions. Our systematic preprocessing pipeline implemented radiometrically calibrated multispectral data conversion through Sen2Cor processor (v2.11), generating Level 2A Bottom-of-Atmosphere (BOA) reflectance products via sequential atmospheric correction (including cirrus scattering compensation), terrain illumination normalization, and adjacency effect mitigation. Subsequently, employing SNAP 10.0 software, we uniformly resampled the resolution of various bands to 10 m, facilitating subsequent operations and generating band files in img format for ease of processing.
Following preprocessing, we conducted band synthesis using ENVI 5.6 software. During synthesis, we selected the 13 bands with an original resolution of 10 m. After band synthesis using ENVI software, we obtained a TIFF-format image containing comprehensive information.
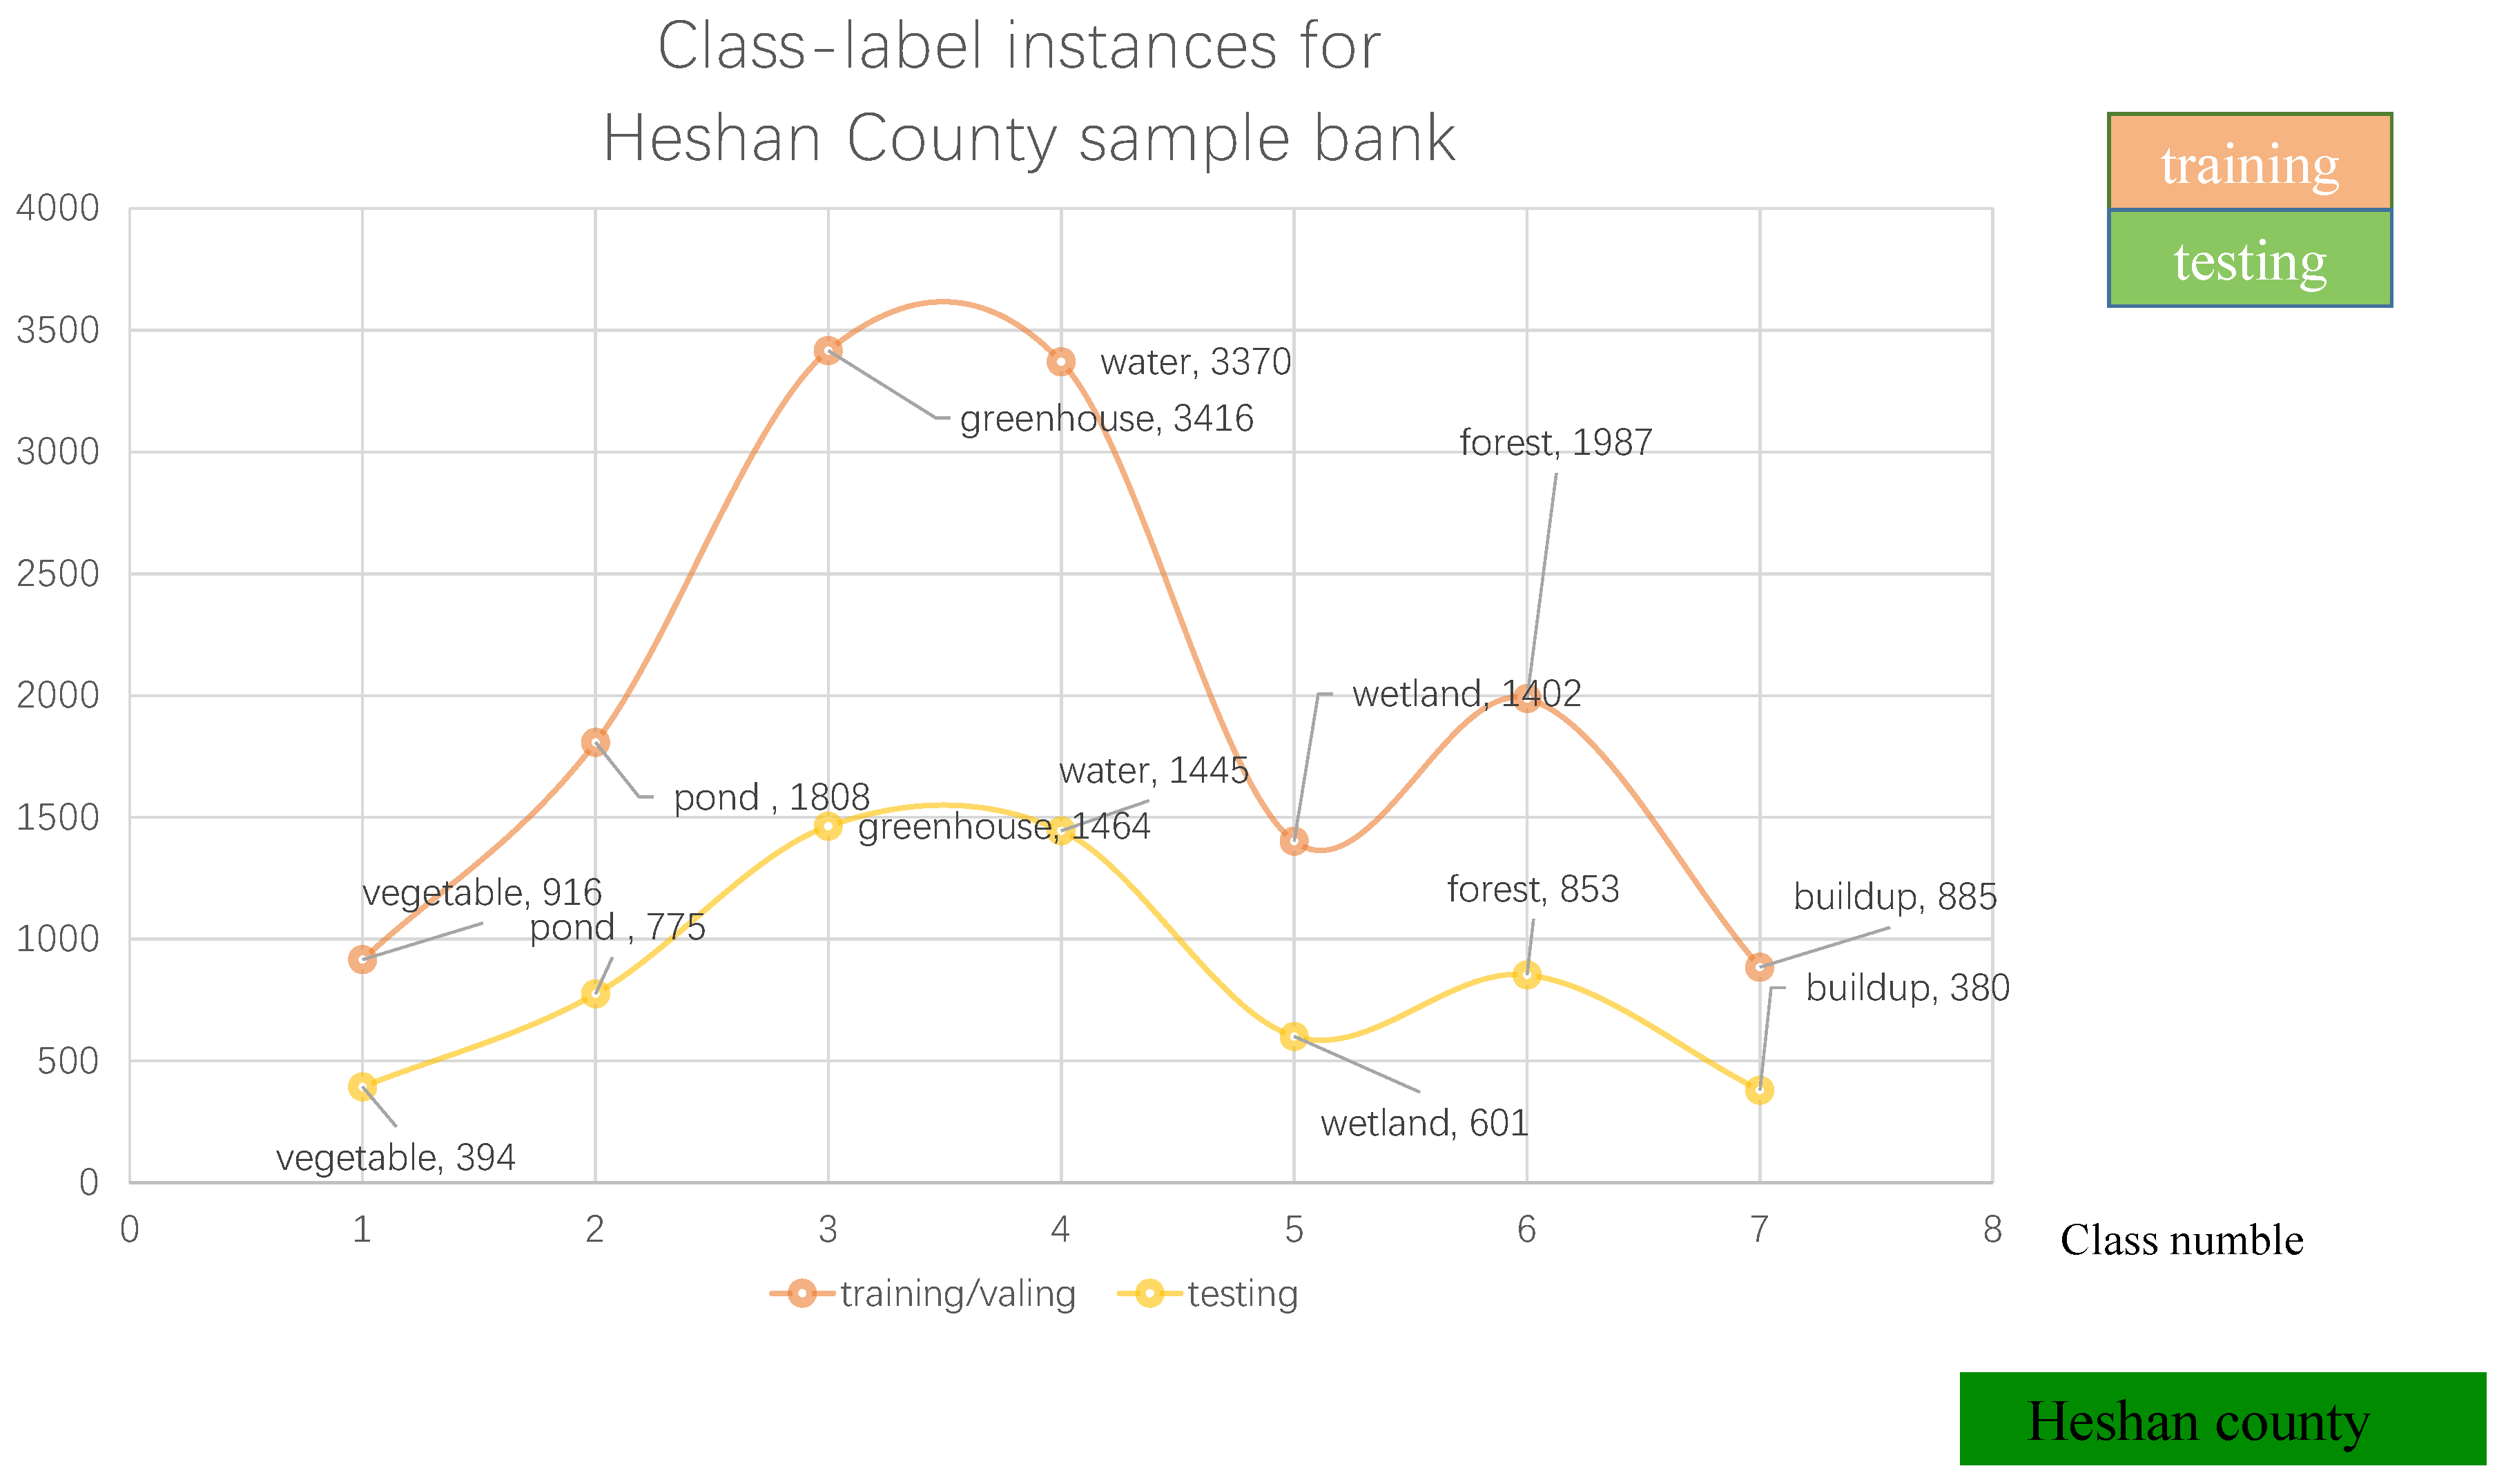
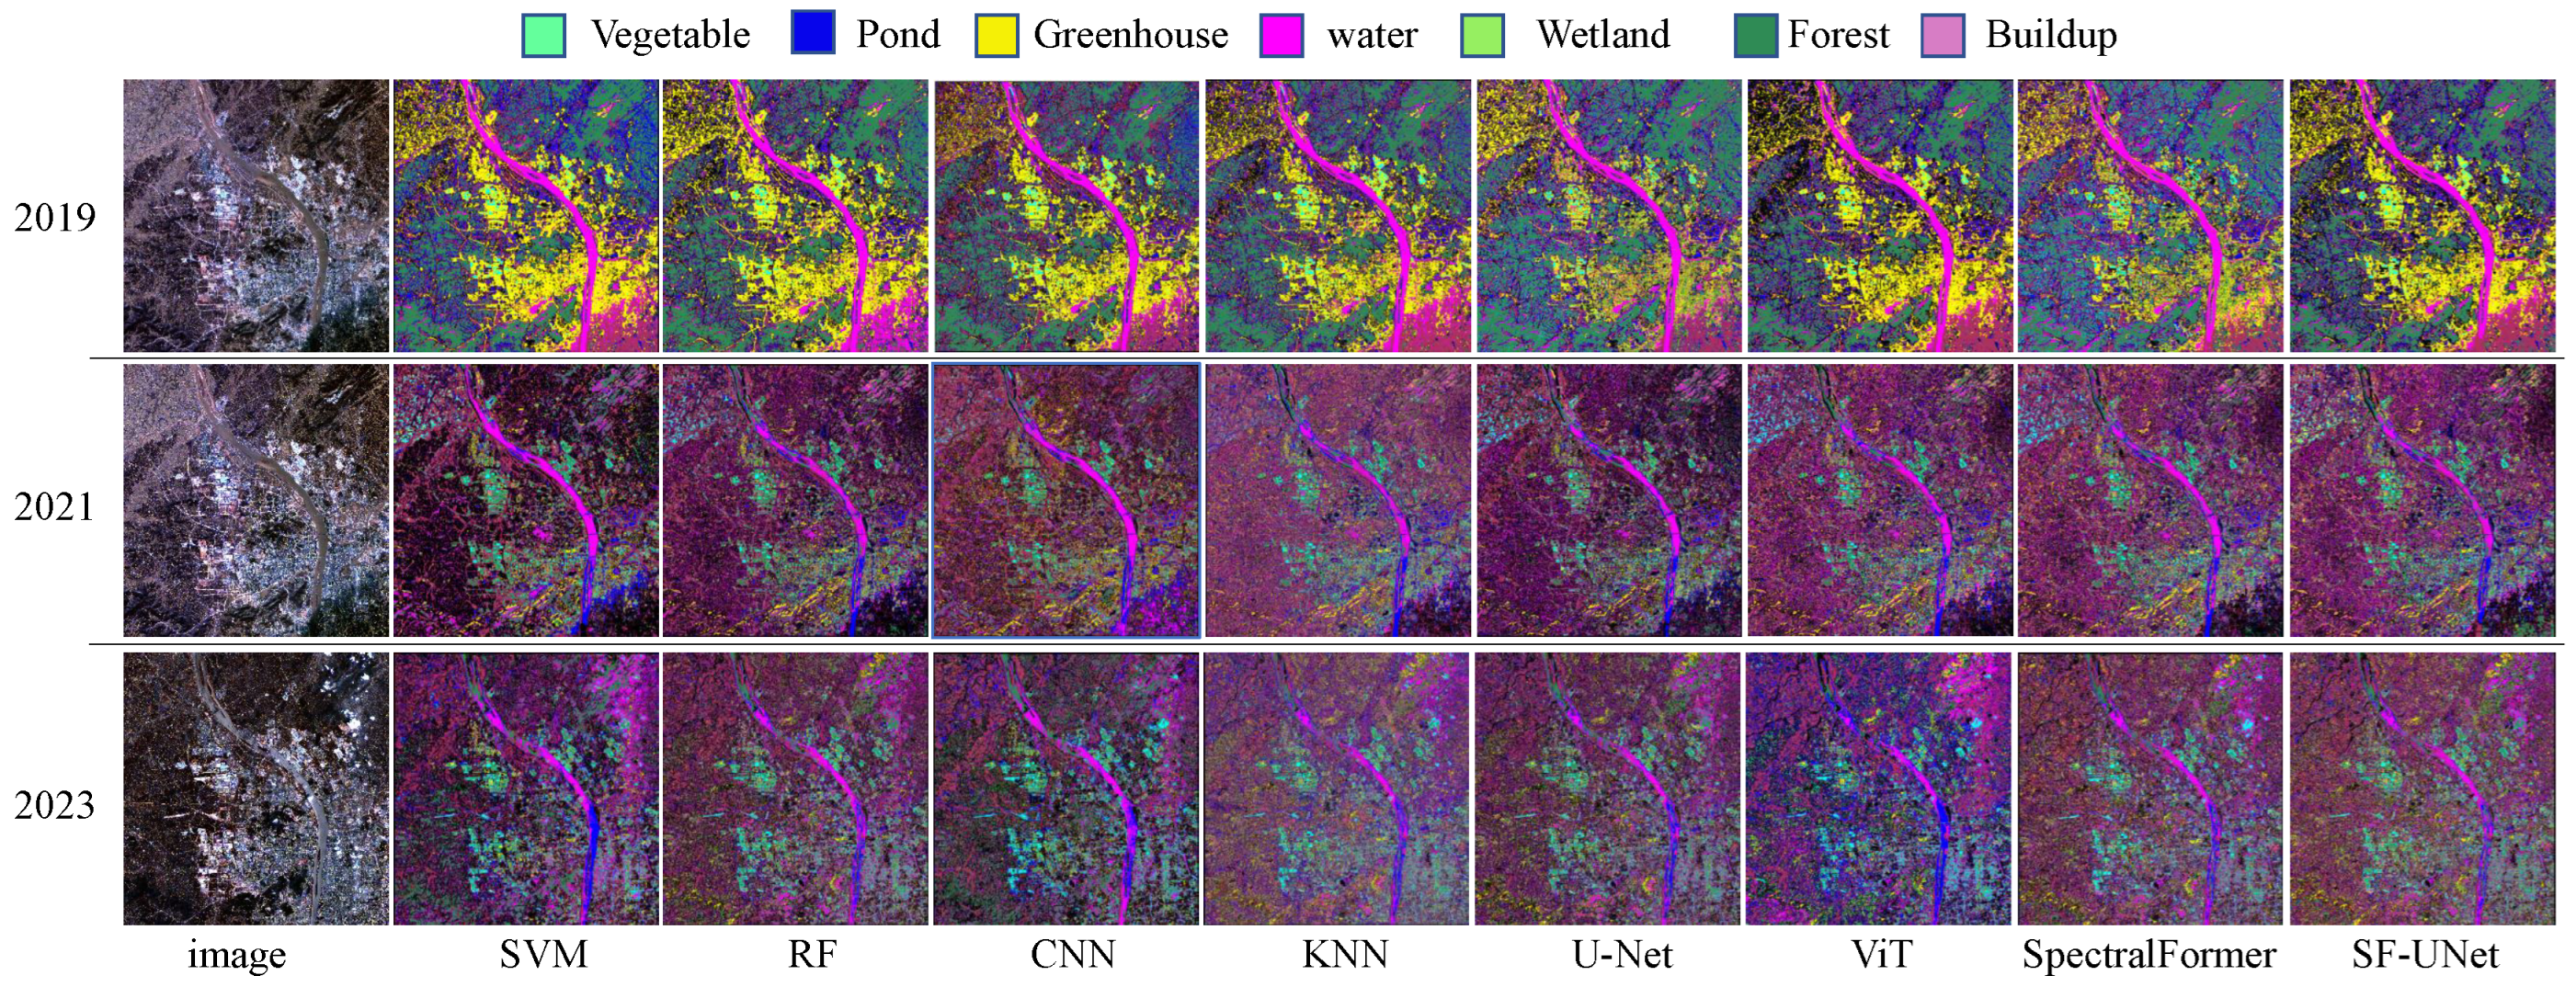
Lastly, leveraging both field-collected data and existing knowledge, we employed ENVI software to delineate regions of interest (ROIs) with the most diverse feature classes on the synthesized image, thus establishing a sample library dataset, as illustrated in Figure 2. This sample library serves as crucial support for our subsequent classification and accuracy validation endeavors. The horizontal axis of Figure 2 represents different types of land features, such as vegetables, forest, greenhouses, etc. The vertical axis represents the number of samples for each category. The numbers next to the category names represent the number of training and testing samples for each category.
As a typical area of the transition zone between Dongting Lake plain and hills, Huarong County’s forest resources have the dual characteristics of ecological barrier and economic function, providing unique advantages for the study of forest land use change. The subtropical evergreen broad-leaved forest and artificial forest in the county are interlaced and significantly affected by the hydrological fluctuations of the Yangtze River and the policy of returning farmland to forests. The forest coverage presents a gradient pattern of “wetland protective forest hilly economic forest plain farmland forest network”, which can clearly reflect the synergistic effect of natural conditions and human activities. Especially since the implementation of the Dongting Lake ecological restoration project in 2000, the forest wetland restoration area along the lake has formed a sharp contrast with the inland fast-growing economic forest expansion area, providing a natural experimental field for forest spatial reorganization driven by quantitative policies. In addition, as an important poplar industry base in the middle reaches of the Yangtze River, Huarong has fully recorded the transformation process of its commercial forest and ecological forest management mode. Through multi-temporal remote sensing monitoring, the evolution trajectory of forest quality and function can be accurately captured, which is of typical significance for studying the potential of forest carbon sinks and land use conflicts in subtropical regions. Table 1 shows the sample data for the third phase of Huarong County.

2.2. Forest Hyperspectral Data Sources

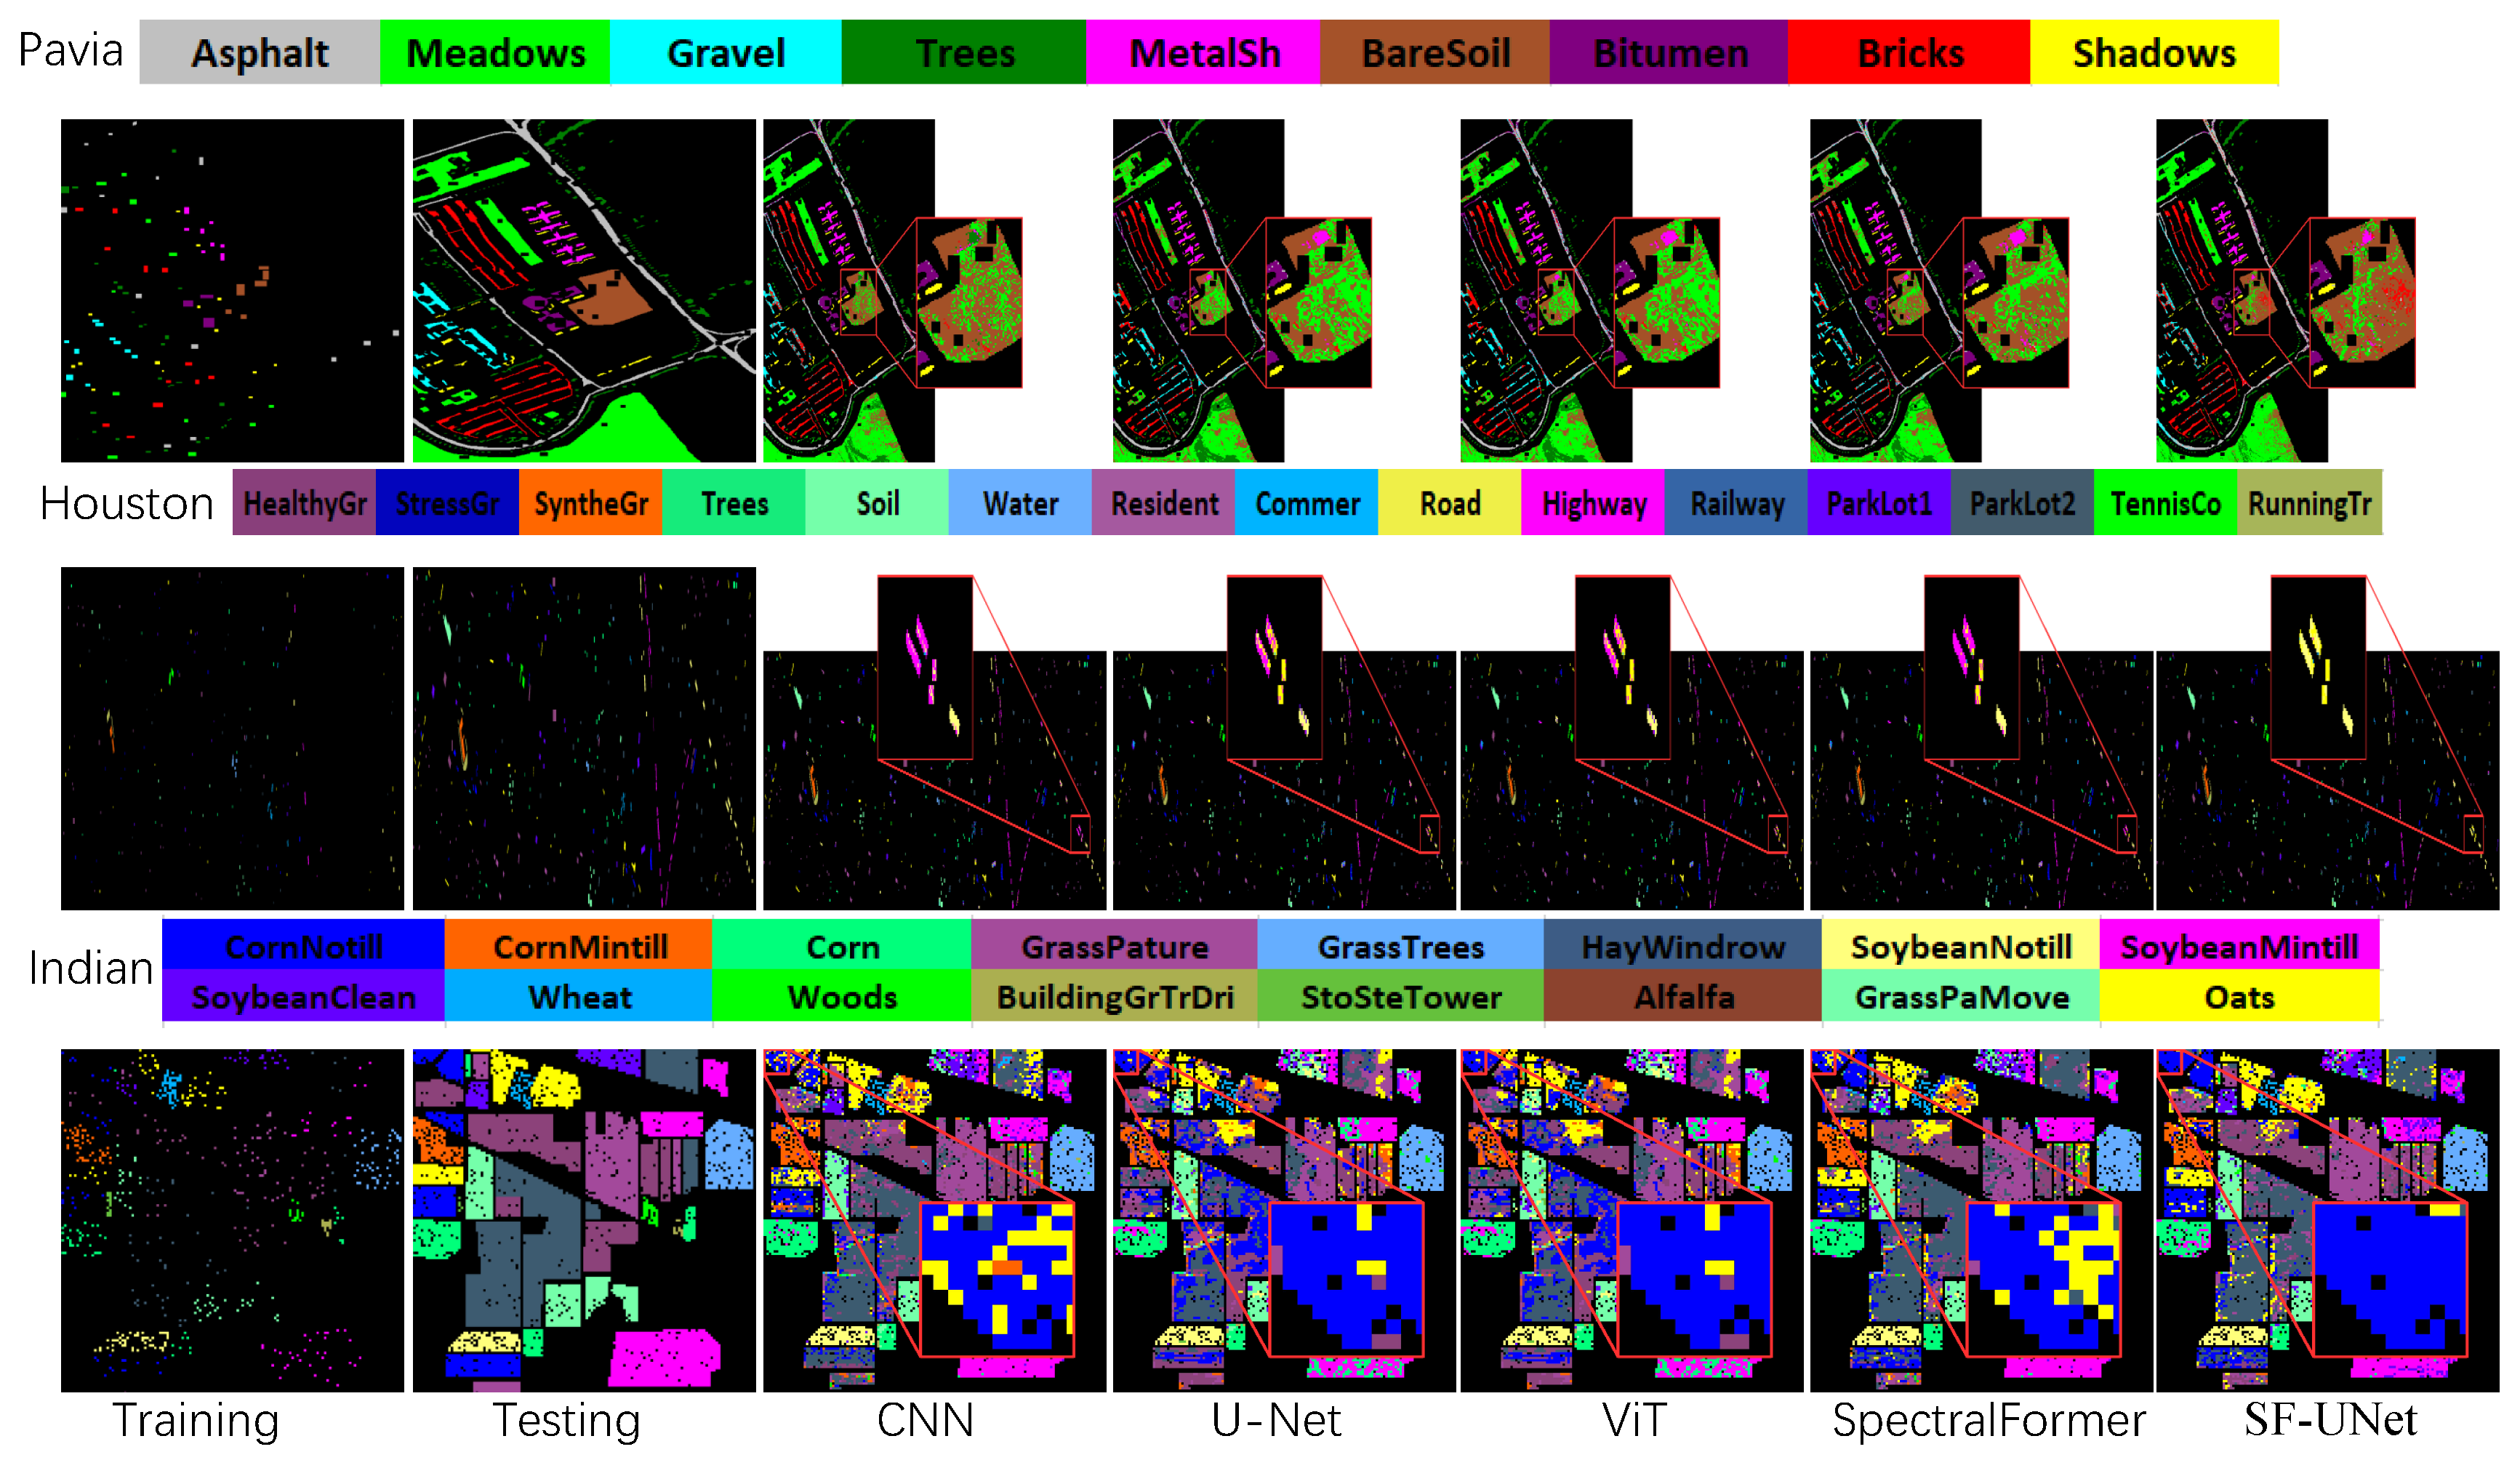
To rigorously validate the ecological generalization potential of our proposed framework across heterogeneous forest landscapes, we establish a multi-scenario evaluation protocol using three benchmark hyperspectral datasets (comprising the Houston, Indian Pines, and Pavia University datasets) representing distinct forest ecosystem configurations. This experimental design specifically addresses two critical dimensions: (1) classification efficacy across multi-source satellite products, and (2) cross-domain generalization capability for arboreal species discrimination, with comprehensive spectral–spatial characterization metrics detailed in subsequent sections.
This dataset was acquired using the ITRES CASI-1500 imaging spectrometer (manufactured by ITRES Research Inc., Calgary, AB, Canada), deployed through the NSF-sponsored airborne observation facility at the University of Houston. The CASI-1500 system provides a spectral sampling interval of 4.8 nm, capturing the visible to near-infrared (VNIR) spectrum (364–1046 nm) across 144 spectral channels. The georeferenced scene (dimensions: 349 × 1905 pixels; GSD: 2.5 m) captures complex urban–forest interfaces surrounding the university campus, with radiometrically calibrated surface reflectance values stored in 16-bit signed integer format.
The dataset exhibits three core scientific attributes: (1) high-fidelity spectral preservation (SNR > 40 dB) with sub-pixel spatial detail retention, validated through in situ spectrometer measurements; (2) radiometric–geometric dual precision verification (RMSE < 0.5 reflectance unit) confirming its physical consistency with ground-truth signatures; (3) embedded multiscale geospatial metadata (projection: UTM Zone 15N) supporting cross-domain applications in urban ecology and biomass estimation. As quantitatively characterized in Table 2, the stratified sampling protocol maintains spectral class distributions while implementing robust training–test partitions with spatial independence constraints.
Indian Pines Hyperspectral Dataset: This dataset was acquired in 1992 via the Airborne Visual Infrared Imaging Spectrometer (AVIRIS) to capture detailed hyperspectral measurements of the Indian Pines region in northwest Indiana, USA. The georeferenced scene encompasses a spatial extent of 145 × 145 pixels with a ground sampling distance (GSD) of 20 m. The spectral coverage spans the VNIR to SWIR domains (400–2500 nm), originally comprising 220 contiguous spectral channels. Notably, rigorous spectral noise filtering was implemented to exclude the 104th to 108th, 150th to 163rd, and 220th bands, which exhibited degraded signal quality. The curated dataset retains 200 high-fidelity spectral bands for subsequent analysis. As presented in Table 3, the dataset’s stratified sampling strategy ensures balanced representation across 16 distinct land cover classes.
Pavia University Hyperspectral Dataset: Captured via the ROSIS-03 The manufacturer of the imaging spectrometer is the German Aerospace Center, headquartered in Oberpfaffenhofen, Germany (Reflective Optics System Imaging Spectrometer) airborne platform during the 2003 Italian imaging campaign, this dataset provides high-resolution urban land cover characterization with a spatial resolution of 1.3 m (GSD). The datacube spans 610 × 340 pixels in spatial dimensions and 115 spectral channels across the VNIR spectral regime (430–860 nm, spectral sampling interval: 4.2 nm). Through a systematic band selection protocol, 12 spectral bands exhibiting atmospheric absorption features or sensor-induced artifacts were eliminated, retaining 103 radiometrically calibrated surface reflectance bands (12-bit radiometric resolution) for optimized spectral discriminability. The curated spectral subset demonstrates an enhanced signal-to-clutter ratio validated through in situ validation campaigns. As detailed in Table 4, the dataset implements a stratified spatial partitioning strategy with per-class spectral purity criteria to maintain ecological representativeness across nine urban land use categories.

2.3. SF-UNet

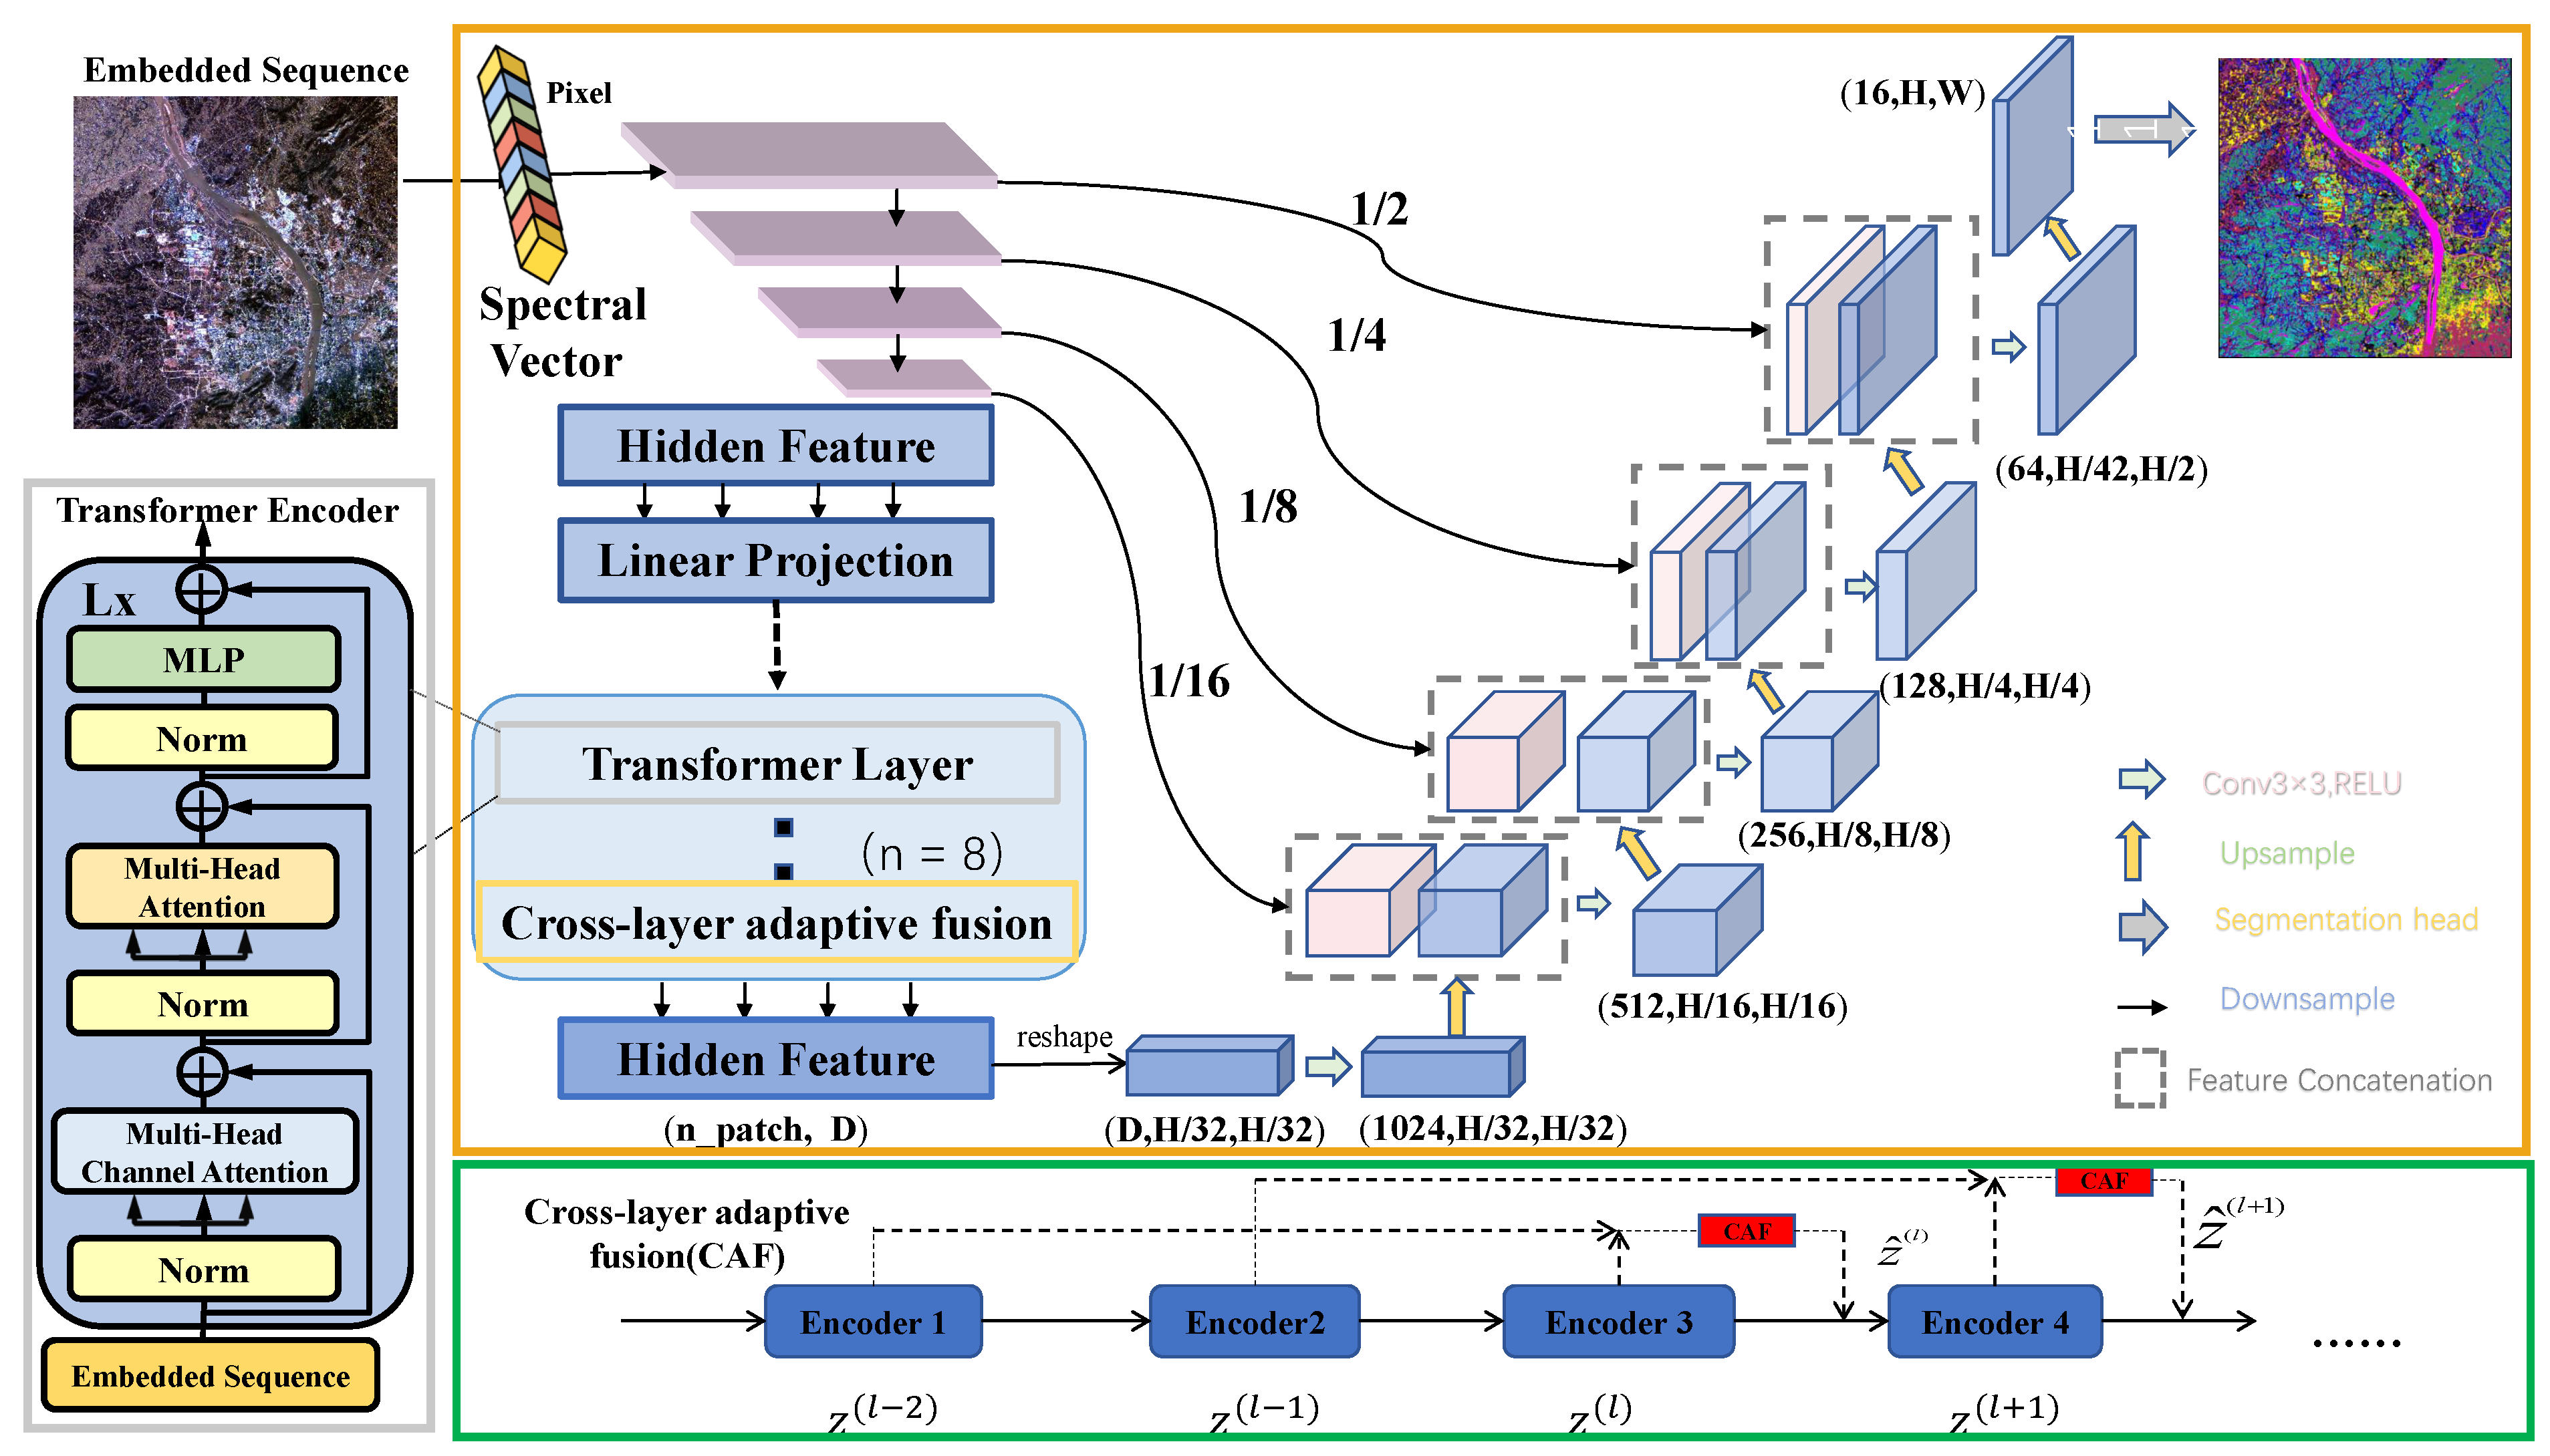
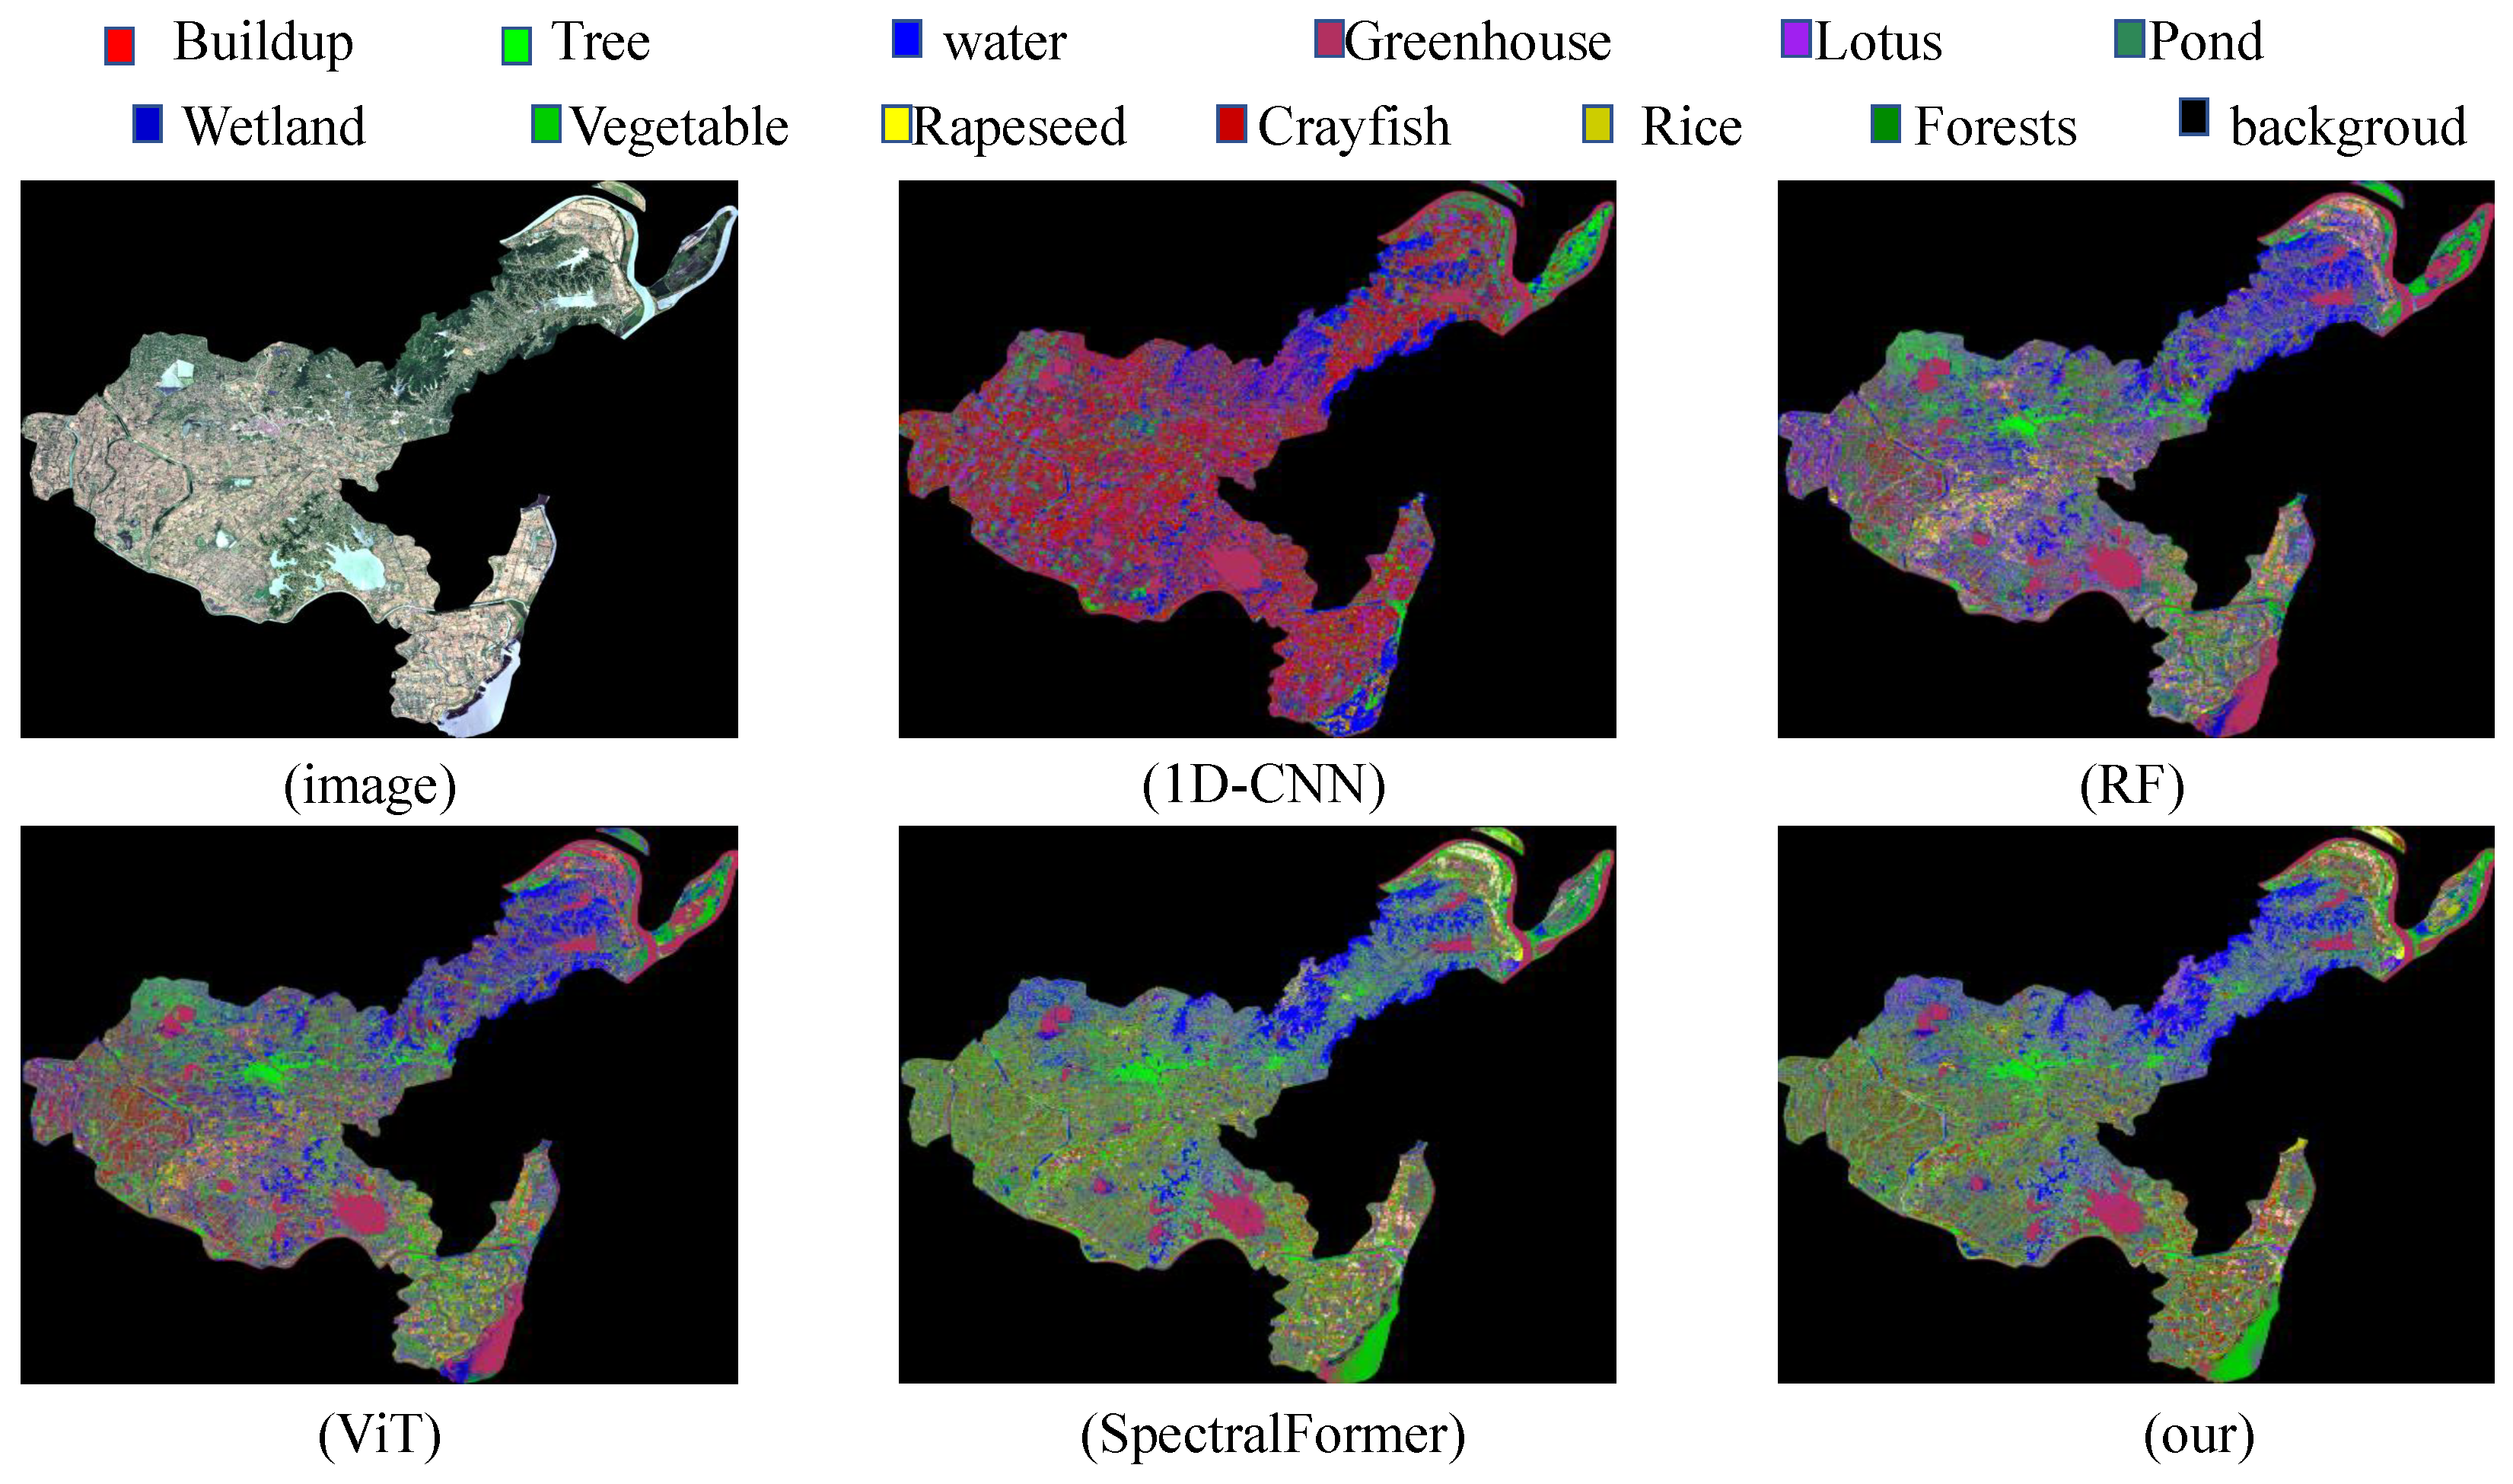
This paper addresses the limitations of traditional deep learning methods in effectively utilizing local spectral features and fail to effectively capture nuanced differences among features—leading to model confusion and misclassification in object class categories—we propose a novel pixel-by-pixel classification network for multispectral and hyperspectral images: SF-UNet, as depicted in Figure 3. This network integrates SpectralFormer, U-Net, CAM, HGSE, and HCAF components. The first step involves utilizing the HGSE module to process a sequence of spectral pixels, creating a semigroup spectral nesting that enhances the connection between local information. The second step employs the CAM module’s SpectralFormer as an auxiliary encoder within the U-Net encoder structure, boosting the model’s feature representation capabilities through cross-level jump connections and cascading, which fuse soft residuals between layers via cross-regional adaptive learning. Finally, the U-Net decoder is used to achieve pixel-level classification results in detail.

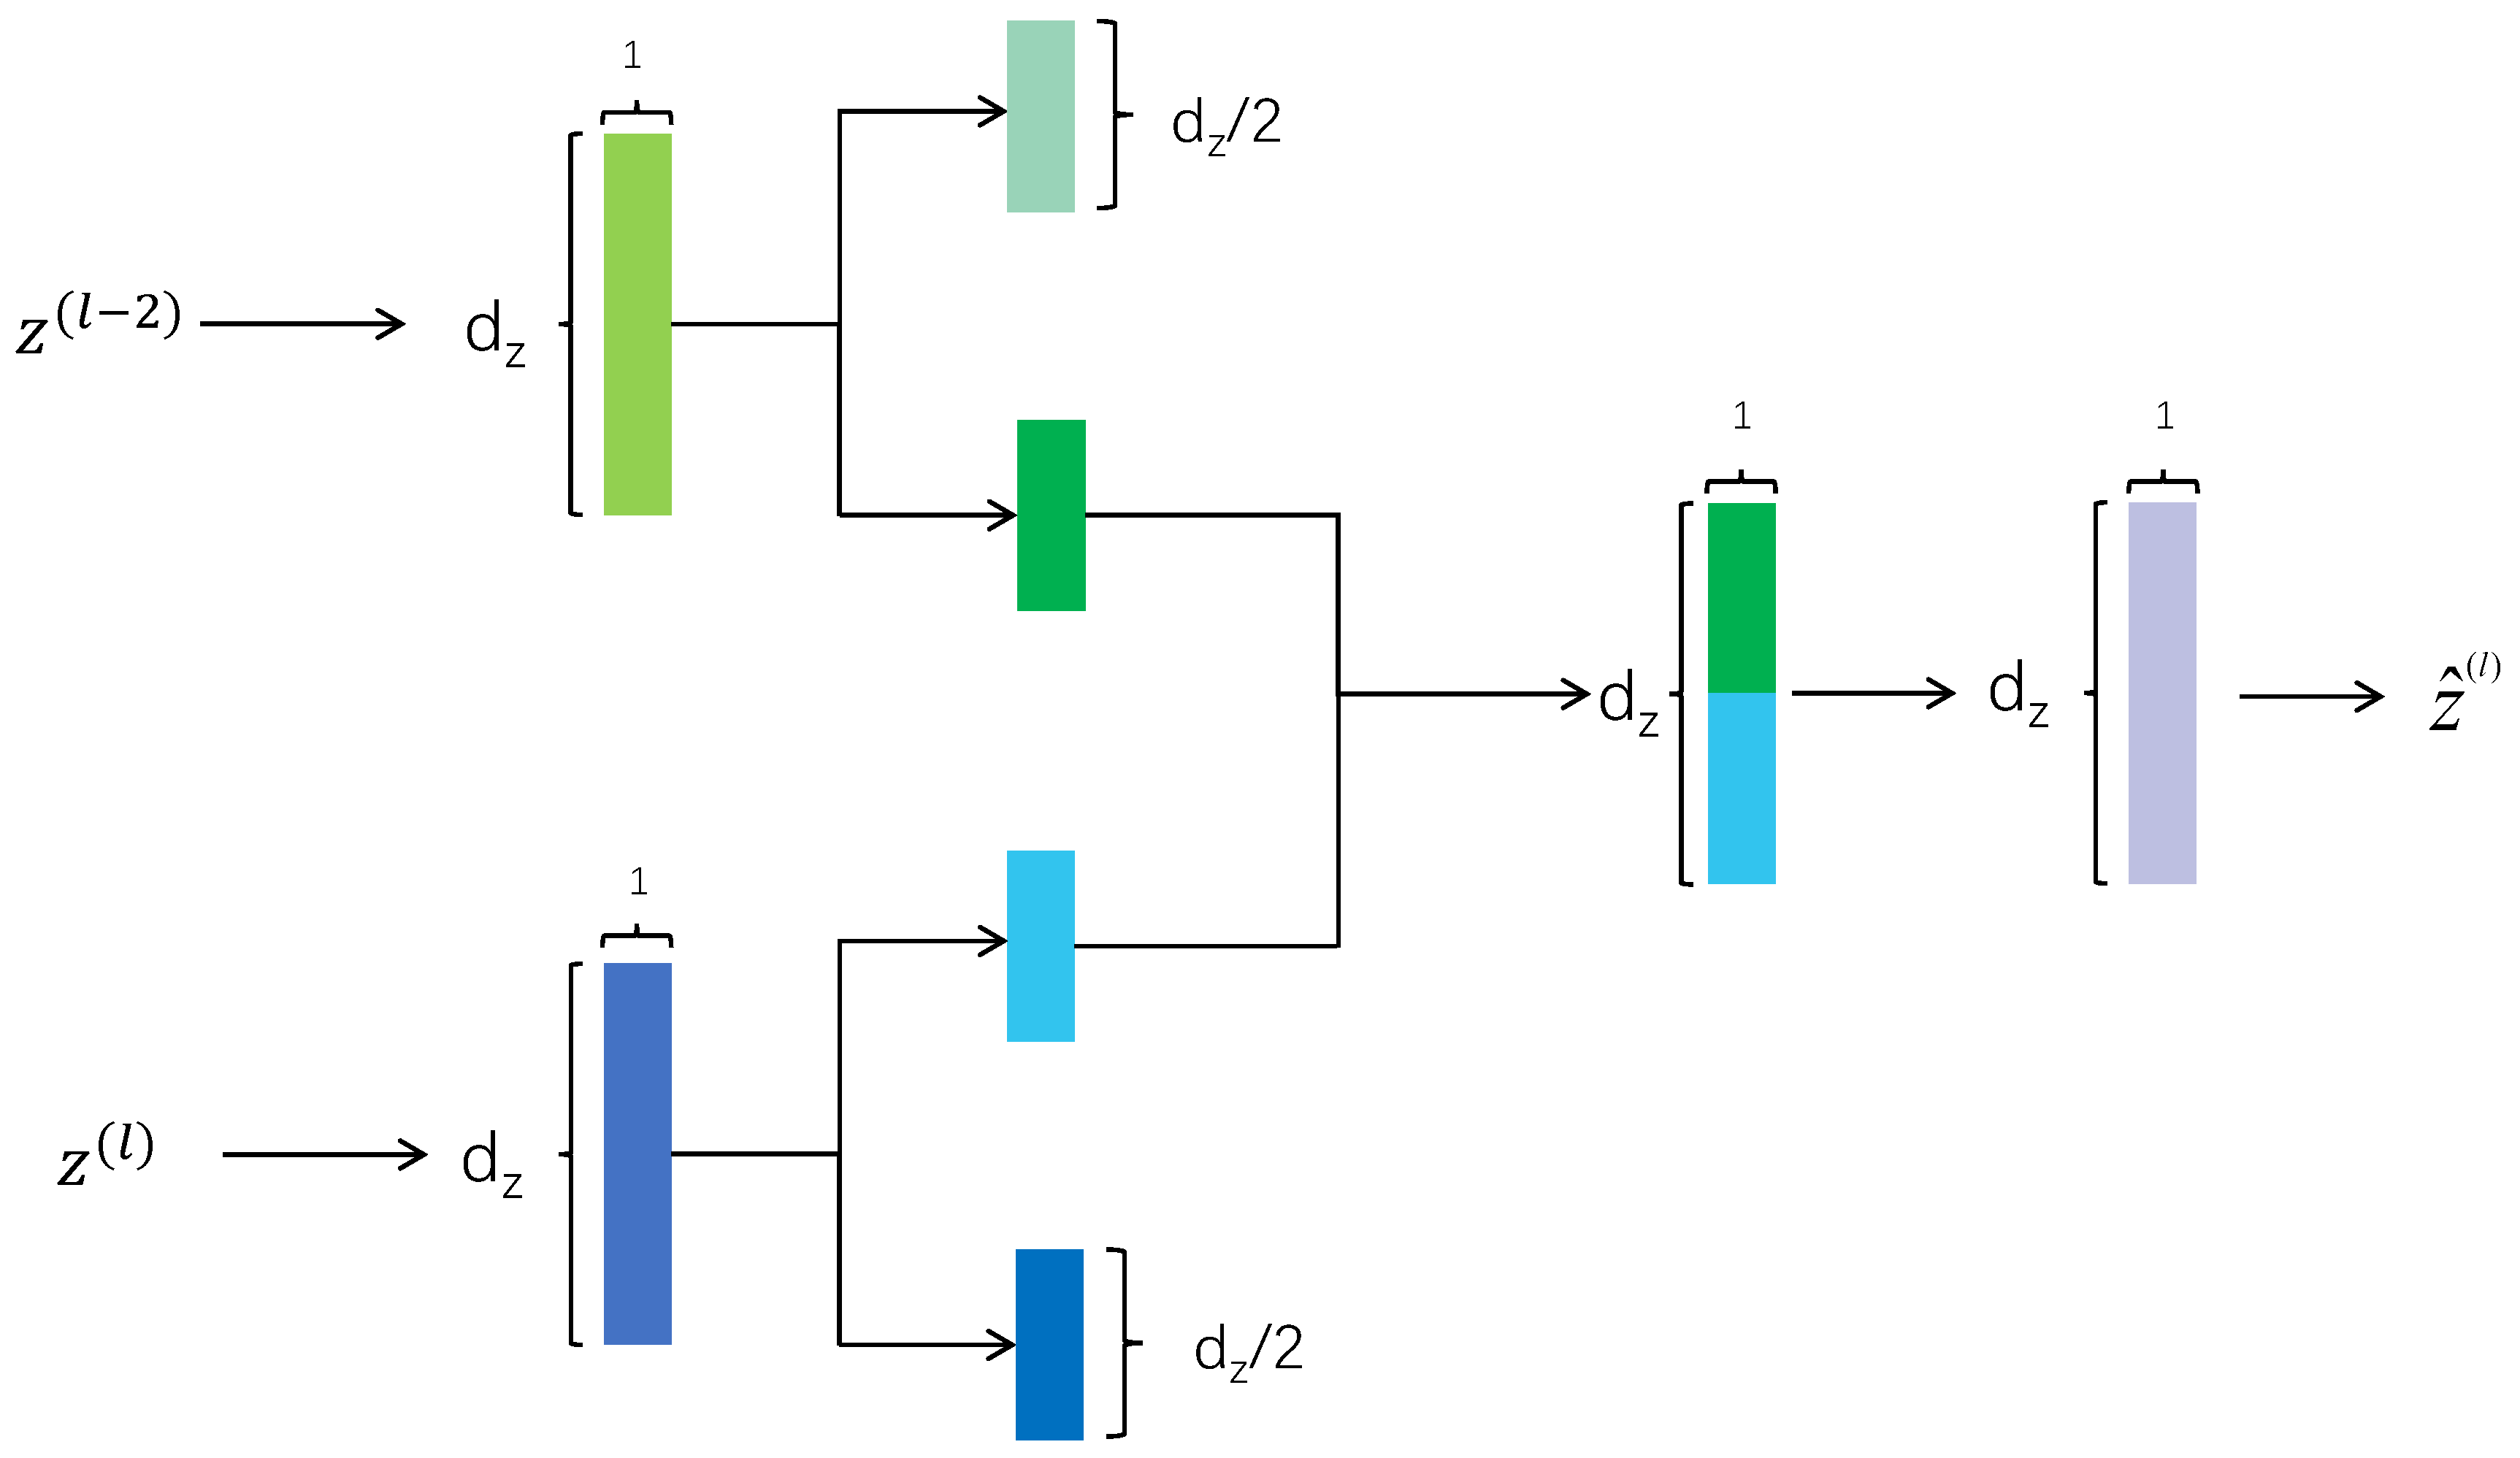
2.3.1. Half-Groupwise Spectral Embedding for Forest Data

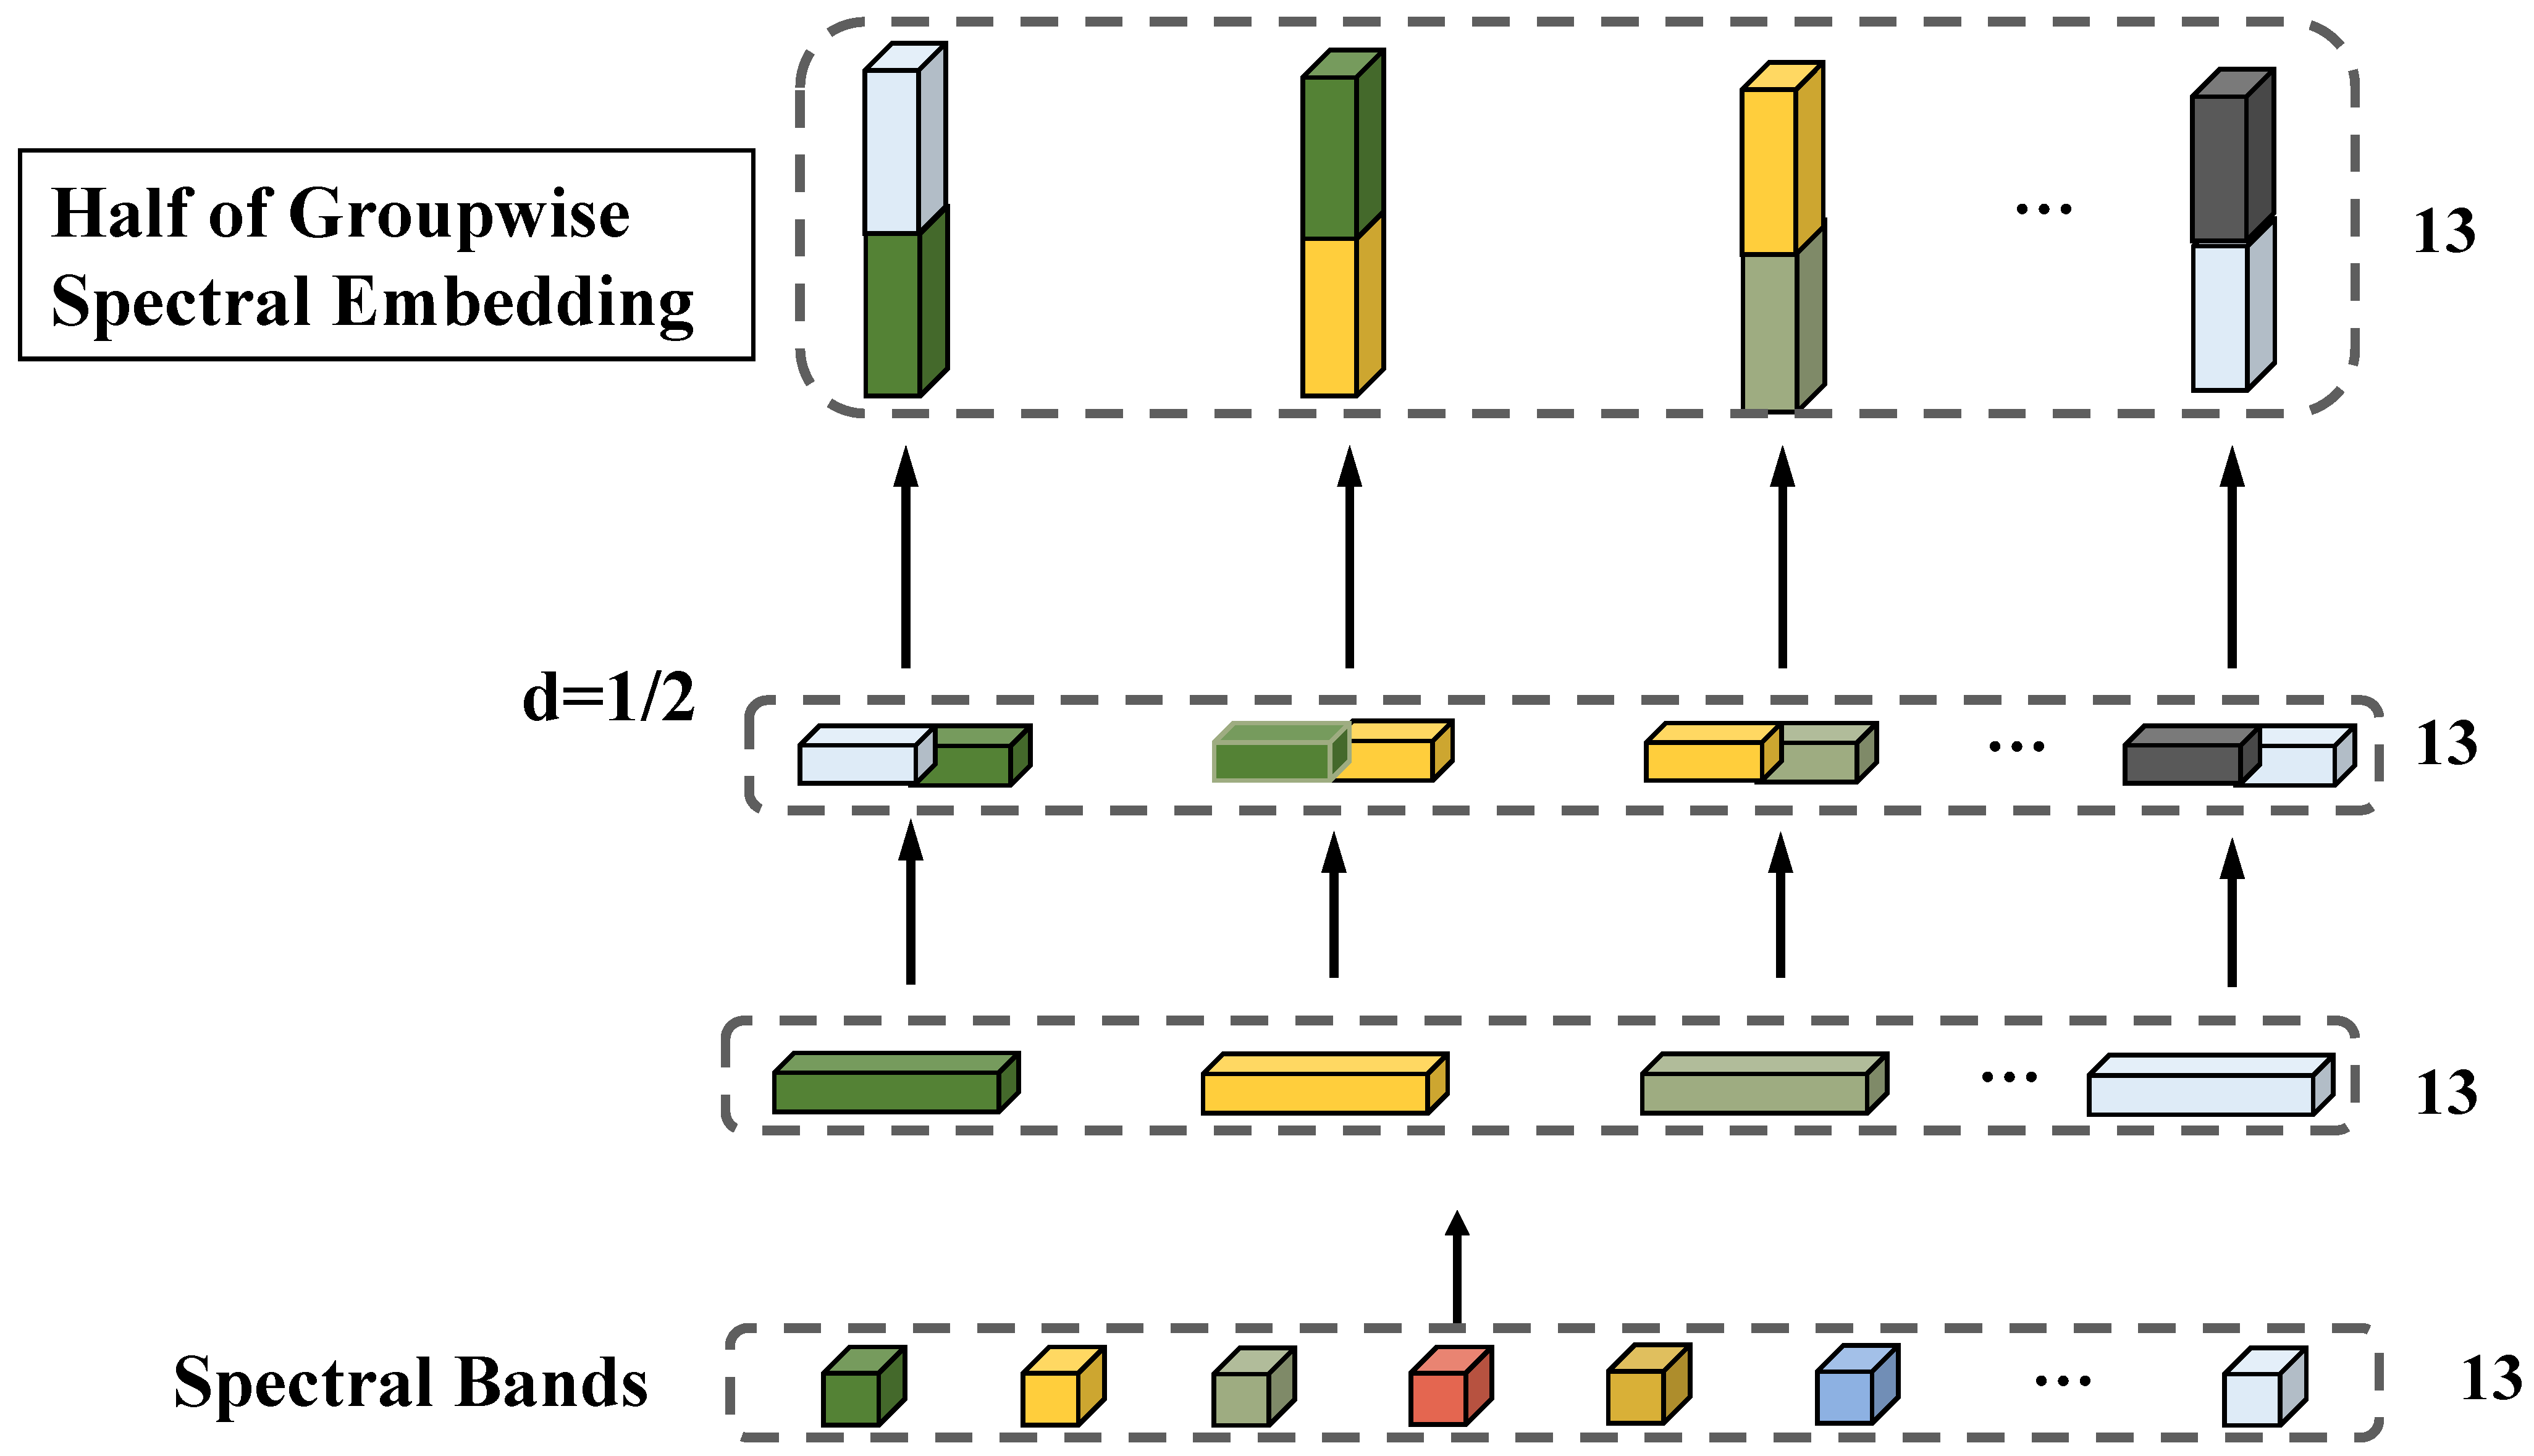
To enhance our ability to analyze the correlation between adjacent bands in forest hyperspectral images, we introduce the GSE module into our framework. Since different bands exhibit distinct spectral information due to varying absorption properties across wavelengths, capturing localized spectral feature changes becomes pivotal for accurate classification of forest features. Despite the limited number of bands in the multispectral Sentinel-2 image, which typically consists of only 13 bands, there remains a significant need to analyze band correlations.
When expressing an input feature as a 1D-pixel sequence, it is represented by Equation (1):
A = w x
where w denotes the linear transformation, equivalently used for all bands of the spectral band, and A collects the output features.
A ˙ = WX
Here, X denotes the linear transformation variable, W corresponds to localized spectral signatures, and n indicates adjacent spectral channels. As illustrated in Figure 4, the 1D-pixel sequence is partitioned into four 1 × 1 sub-sequences through Half-Group Spectral Embedding, where interleaved fusion of partial sub-sequences optimizes discriminative feature analysis while preserving spectral coherence.

2.3.2. Cross-Layer Adaptive Fusion (HCAF) for Forest Feature Integration

In deep neural networks, the skip connection (SC) mechanism has been demonstrated as an effective strategy for enhancing information transfer between layers and mitigating information loss during the learning process. In recent years, SCs have achieved notable success in image recognition and segmentation tasks, with short SCs utilized in ResNet and long SCs in U-Net architectures. However, it is worth noting that short SCs have limited information “memorization” capabilities, while long SCs often struggle with insufficient fusion when bridging the substantial gap between high- and low-level features.
To address this challenge, SpectralFormer introduces a mid-range SC, termed adaptive learning cross-layer feature fusion (CAF). We extract half of the features for representation and fuse them, as depicted in Figure 5. This approach facilitates improved fusion of high- and low-level features with significant gaps.
It is important to acknowledge the substantial semantic gap between low-level features and deep-level features extracted from shallow and deep layers using conventional methods. This disparity can result in insufficient fusion and potential information loss, particularly when employing relatively long skip connections (SCs), such as those spanning two, three, or more encoders. However, with the HCAF module, effective fusion of high- and low-level features with significant gaps can be achieved, irrespective of network depth.

2.3.3. Channel Attention Module (CAM) for Forest Feature Enhancement

The architecture integrates SpectralFormer with a U-Net backbone in a dual-branch encoder framework, where the Transformer branch incorporates fixed positional embeddings to encode token-level spatial coordinates. A parallel attention mechanism, embodied through multi-head channel attention, systematically models cross-region dependencies across all spatial positions rather than localized interactions. This attention module employs dual-path processing: maximum-pooled and average-pooled feature representations are independently derived from the input, enabling synergistic integration of complementary statistical perspectives for enhanced discriminative power. Subsequently, both outputs undergo the same MLP network within the activation function to yield the final output shown in Figure 6.
Channel attention is an attention mechanism in neural networks that enhances the interaction and information transfer between different channels in a feature map, thereby improving model performance. Channel attention mechanisms enhance feature representation by adaptively recalibrating channel-wise feature responses. This process involves two key operations: compression and excitation. During compression, global spatial information from feature maps is aggregated, typically through operations such as global average or max pooling, to generate channel-wise statistics. These statistics capture the importance of each channel within the feature space. The subsequent excitation phase employs a learnable gating mechanism—often implemented via fully connected layers and non-linear activations—to dynamically recalibrate channel weights. By emphasizing informative channels while suppressing redundant ones, this mechanism enables the network to focus on discriminative features critical for downstream tasks. The architecture’s simplicity stems from its lightweight computational footprint, as the compression–excitation workflow introduces minimal parameters. Despite its straightforward implementation, the mechanism exhibits strong robustness across diverse datasets and tasks, owing to its ability to generalize spatial–channel relationships. Furthermore, its modular design allows seamless integration into existing convolutional neural networks (CNNs), enhancing feature refinement without altering core structural components. The effectiveness of this approach is mathematically formalized in Equations (3)–(5), which detail the transformation of input features into recalibrated outputs through learnable scaling factors. By prioritizing channel interdependencies, the mechanism inherently complements spatial attention paradigms, offering a holistic framework for feature optimization in complex vision tasks.
z = 1 c i = 1 c x i
w = σ W 2 R e L U W 1 z
γ = w x
The input tensor x has dimensions (N, C, H, W), where N represents the batch size. c denotes the number of channels, and H and W correspond to the spatial height and width, respectively. A channel-wise descriptor z is derived by applying global average pooling to x, the average value over the channel dimensions. W 1 and W 2 are vectors denoting the learnable weight matrices; R e L U activation is applied between these transformations to introduce non-linearity. The resulting channel-wise attention weights σ are normalized via a Sigmoid function. γ is the output tensor. ⊙ selectively amplifies or suppresses channels based on their learned importance.
The channel attention framework employs a dual-layer dense architecture coupled with a non-linear gating mechanism (Sigmoid) to establish data-driven channel-wise significance. This configuration allows the network to dynamically prioritize discriminative feature channels through learned inter-channel dependencies, where the Sigmoid-activated output normalizes attention weights between 0 and 1 for adaptive feature refinement.In this way, the model is able to weightedly average the signals from the useful channels to strengthen them and attenuate the information from the useless channels, thus improving the overall model performance.

2.4. Evaluation Metrics

The model’s effectiveness is quantitatively assessed through three key metrics: overall accuracy (OA) measuring total classification correctness, average accuracy (AA) reflecting mean class-wise performance, and the kappa coefficient evaluating classification consistency beyond random chance. This comprehensive evaluation framework ensures rigorous assessment of both global and class-specific predictive capabilities. These three evaluation metrics are based on the confusion matrix, which contains four terms: tp, fp, tn, and fn. The quantitative evaluation formula is calculated as follows.
(1) OA: The metric calculates classification precision by dividing correctly predicted instances by total prediction attempts.
O v e r a l l A c c u r a c y = T p + T n T p + F p + T n + F n
where T p denotes the positive categories that were classified accurately, F p denotes the negative categories that were misclassified as positive, T 2 n denotes the negative categories that were classified accurately, and F n denotes the positive categories that were misclassified as negative.
(2) AA: The ratio of true positive predictions to all positive predictions.
A v e r a g e A c c u r a c y = 1 w T p + T n T p + F p + T n + F n
where w represents the total category count.
(3) Kappa coefficient: A statistical metric quantifying inter-rater agreement beyond chance.
K a p p a = P 1 P 2 1 P 2
where P 1 represents the observed agreement rate between predicted and actual classifications, computed as the proportion of correctly classified samples in the confusion matrix; P 2 denotes the expected probability of random agreement, derived from the product of marginal distributions.

2.5. Parameter Settings

The proposed model was implemented using Python 3.7 with PyTorch 1.12.1 as the deep learning framework. During training, we employed the Adam optimization algorithm with a mini-batch size of 32 samples per iteration. The training process was set to terminate after completing 300 epochs or reaching convergence, whichever occurred first. The initial learning rate was set to 5 × 10⁻⁴, with a decay factor of 0.9 applied every 30 iterations. All implementation code was executed on a system comprising Windows 11, an AMD Ryzen 9 5900HX processor (AMD, Santa Clara, CA, USA), and an NVIDIA GeForce RTX 3060 Laptop GPU (Nvidia, Santa Clara, CA, USA).

3. Results

To demonstrate model efficacy, we conducted comparative experiments between SF-UNet and six representative approaches: traditional machine learning methods (SVM, RF), deep learning architectures (CNN, U-Net), and Transformer-based models (VIT, SpectralFormer).

3.1. Ablation Experiments

The ablation experiments conducted on the study area dataset demonstrate the effectiveness of different network architectures for remote sensing image classification. As shown in Table 5, the U-Net model achieves an overall accuracy (OA) of 80.06%, confirming its strong baseline performance for this task. The transformer-based SpectralFormer model significantly outperforms this result with an OA of 90.08%, representing a substantial 10.02% improvement in classification accuracy. These comparative results highlight the progressive performance gains achieved by different architectural approaches, with the transformer model showing particular promise for remote sensing applications. The OA of U-Net+SpectralFormer reaches 92.32%, which is quite a good improvement, proving the effectiveness of the U-Net+SpectralFormer scheme. The OA of Transformer’s self-attention module plus the CAM module is also improved. The OA of the HGSE module inserted increases by 0.63%, which shows that on the remotely sensed spectral data, the HGSE also has a quite good effect. When the cross-level adaptive effect is added, which means all the modules are tested together, the accuracy of SF-UNet is 95.28%, and the OA is improved by 5.20% compared to SpectralFormer. This shows that our method can obtain remote sensing image semantic segmentation pixel-level classification results well.
The arrow symbols next to these indicators indicate that the higher the indicator value, the better. The arrow symbol does not indicate the sorting direction, but is used to emphasize that the higher the values of these indicators, the better the classification performance of the model. Due to the fact that the values in the table are not always strictly ordered, arrow symbols are mainly used to indicate the directionality of indicators, that is, an increase in value represents an improvement in performance, rather than for sorting. For downward arrows, the smaller the better, as is the case throughout the entire text.

3.2. Multi-Method Comparison

3.2.1. Performance Evaluation of Multispectral Image Classification

Table 6 presents the quantitative classification results for the study area dataset, including OA, AA, kappa, and per-class accuracy. CNN demonstrates the poorest performance across all metrics, with particularly low accuracy for ponds (30.45%), likely due to limited spectral bands hindering feature learning. Traditional classifiers show moderate results: KNN (81.04% OA) and RF (85.69% OA) outperform SVM (64.96% OA). The deep learning-based spectral sequence classifiers (U-Net, ViT, SpectralFormer, SF-UNet) exhibit superior and comparable performance, confirming the effectiveness of deep learning for sequence data processing. Among these, SpectralFormer achieves 90.08% OA, second only to SF-UNet, while excelling in pond classification. SF-UNet outperforms all comparative models in OA, AA, and kappa, demonstrating particular strengths in water, forest, and vegetable classification.
This research employs Sentinel-2 satellite imagery from 2019, 2021, and 2023 obtained through ESA’s Copernicus Open Access Hub to analyze land cover changes in Heshan District of Yiyang City, Hunan Province. The satellite data underwent comprehensive preprocessing including radiometric calibration and atmospheric correction before further analysis. Field-collected samples were processed using ENVI software to generate region of interest (ROI) annotations, with corresponding coordinate data exported to text files for subsequent analysis. The dataset was systematically divided into training (70%) and testing (30%) subsets to evaluate the performance of various classification approaches.
The investigation specifically targets forests and greenhouses as critical land use indicators within Heshan District, recognizing their importance for understanding regional ecological patterns and agricultural development. Comparative analysis reveals the superior performance of the SF-UNet algorithm across all three temporal datasets, as evidenced by the quantitative results presented in Table 7 and Table 8. This demonstrated effectiveness establishes SF-UNet as a reliable method for tracking land use transformations in the study area. The findings provide valuable insights into the spatial and temporal dynamics of key land cover types, particularly regarding forest distribution and agricultural land utilization patterns in this rapidly developing region.
Comparative analysis of classification methods applied to Heshan District’s 2019–2023 datasets demonstrates SF-UNet’s consistent outperformance in qualitative assessment metrics. The model achieves significantly better results than alternative approaches when processing multi-temporal Sentinel-2 imagery of this Hunan Province region. This performance advantage holds true across all three annual datasets, confirming SF-UNet’s robustness for land cover classification tasks in the study area. The model’s superior capability particularly manifests in accurately identifying subtle land use changes and maintaining classification consistency over time. These findings suggest SF-UNet’s potential for reliable long-term environmental monitoring applications in similar geographic contexts. As depicted in Figure 7, the classification maps of the study area generated by different algorithms during the dataset’s three phases are annotated based on a priori knowledge and outdoor sampling data within the designated square box, predominantly encompassing pond, greenhouse, and buildup categories. Greenhouse and buildup features exhibit a concentrated distribution, posing a challenge due to their notably similar characteristics, leading to potential misclassifications across all models. Notably, SF-UNet demonstrates fewer misclassifications for buildup features, distinguishing itself in this regard. The focus of this study includes pond distribution, primarily along riverbanks, with CNN notably misclassifying ponds as water more frequently. While RF, U-Net, ViT, SpectralFormer, and SF-UNet exhibit similar performance in forest classification, SF-UNet excels in capturing finer details. With the exception of CNN, the remaining models excel in feature classification.
The experimental results demonstrate SF-UNet’s consistent superiority over competing methods in both key focus areas and agricultural regions throughout the 2019–2023 study period. This performance advantage establishes the model as particularly suitable for analyzing land use dynamics in Heshan District’s complex landscape. The algorithm maintains robust classification accuracy when handling diverse land cover types across different seasons and years, showing remarkable stability in agricultural monitoring applications. These characteristics make SF-UNet especially valuable for tracking subtle land use transitions and supporting sustainable development planning in this rapidly changing region of Hunan Province. The model’s temporal consistency and spatial adaptability provide researchers and policymakers with reliable data for understanding long-term environmental changes in Yiyang City’s agricultural ecosystems.

3.2.2. Performance Evaluation of Hyperspectral Image Classification

This study evaluates the proposed model’s classification performance across three hyperspectral datasets (Houston, Indian Pines, and Pavia University) using Table 9. The comparative analysis examines the model’s accuracy and generalization capability for land cover classification on diverse satellite imagery. Benchmark tests against state-of-the-art methods demonstrate the proposed approach’s effectiveness in processing multiple hyperspectral data products.
Table 6 presents quantitative classification results for multiple models across three hyperspectral datasets. The bold values indicate each category’s best-performing method. Analysis reveals that ViT consistently yields the lowest accuracy metrics among all models. Figure 7 visually compares classification outcomes from different approaches on the Houston, Indian Pines, and Pavia University datasets.
The experimental results demonstrate clear performance differences between traditional and deep learning approaches for hyperspectral image classification. Traditional classifiers including RF, KNN and SVM show consistently moderate performance across all three datasets, with their OA, AA and kappa metrics ranking in the mid-to-lower range compared to other methods. In contrast, deep learning models exhibit significantly stronger classification capabilities. Both RNN and SpectralFormer achieve notably superior results, while the proposed SF-UNet algorithm demonstrates particular excellence in extracting spatiotemporal features from spectral data. Importantly, SF-UNet maintains robust classification accuracy even when dealing with categories containing limited training samples. The model’s training process and convergence behavior are visualized through the accuracy and loss curves presented in Figure 8, which track its performance across all four experimental datasets. These comprehensive results validate SF-UNet’s effectiveness for hyperspectral image analysis tasks.

3.3. Analysis of Land Use Change in the Study Area

Because Huarong County has forest parks and excellent land use classification features, we conducted a land use change analysis in Huarong County. Figure 9 shows the classification results of different algorithms in Huarong County in 2021.
Therefore, this algorithm is used to dynamically monitor the land cover classification of Huarong County, Yueyang City, Hunan Province, in recent years. The spatial distribution of land use in 2017, 2019, and 2021 is shown in Figure 10.
Table 10 shows that the land use pattern in the study area exhibits significant dynamic evolution characteristics. In the third phase of remote sensing monitoring, forest planting areas dominate and fluctuate the most significantly, followed by rapeseed planting areas. The land for rice and rapeseed has remained relatively stable in recent years, but the expansion of ponds and greenhouses has led to an increase in the scale of related industries. From 2017 to 2021, construction land continued to expand, which is in line with the acceleration of China’s urbanization process, and secondary cities have also shown a trend of the emergence of high-rise buildings. Although the increase in building density has had a temporary impact on forest coverage, the implementation of ecological restoration projects has led to a rebound in tree coverage in recent years. As a regional characteristic industry, crayfish farming relies on local resource advantages to maintain stable growth. It is worth noting that the growth rate of rapeseed and forest planting area has been significant in recent years, and the overall data indicators reflect that the land use in this region conforms to the basic laws of ecological and economic coordinated development.
The main features of the vegetation landscape in Huarong County are forests and ponds, which are key indicators for ecological monitoring. Our research specifically focuses on these two types of land cover as the main observation units, as they effectively reflect regional agricultural activities and environmental changes. The spatial distribution map is shown in Figure 11. The use of standardized color coding to distinguish various land features, forests, and pond clusters has received special attention. Through systematic analysis of these key areas, we can gain a better understanding of land use dynamics and transformation mechanisms, which can contribute to more effective resource management and ecological planning. This focused approach not only enhances agricultural productivity assessment, but also supports sustainable development goals by providing data-driven insights for environmental protection strategies in the region.
Analysis of Table 9 reveals notable fluctuations in land use patterns across Huarong County during the three-year study period. The observed variations in feature categories may reflect broader socioeconomic impacts, particularly the potential effects of pandemic-related economic disruptions on local aquaculture operations. The data suggests that these external factors significantly influenced land use decisions, leading to measurable changes in agricultural land allocation and utilization patterns. This temporal analysis provides valuable insights into how regional economic shocks can manifest in land cover transformations, particularly affecting water-based agricultural activities that dominate the district’s landscape. The findings underscore the complex interplay between public health crises, economic conditions, and environmental management practices in this agriculturally significant region. We mainly studied the dynamic changes of forests and ponds in the research area. Figure 12 shows the dynamic changes of forests and ponds in Huarong County over the past three years.
In Figure 11 and Figure 12, we observe that forests play an important role in land cover changes in the Huarong County area. In recent years, the forest area has experienced a certain degree of fluctuation. Specifically, the continuous increase in forest area responds to the national policy of afforestation, air purification, and environmental protection.

4. Discussion

The SF-UNet model has shown remarkable potential in the classification of forest hyperspectral images. Forest ecosystems are intricate, with diverse vegetation types, varying forest densities, and complex terrain conditions. These factors pose significant challenges for accurate classification. Traditional methods like SVM and RF, while effective in certain scenarios, often struggle with the high dimensionality and complex spectral–spatial information present in forest hyperspectral images. Deep learning approaches, including CNN and U-Net, have demonstrated greater capability in handling such complexity. However, they still face limitations in capturing long-range dependencies and fine-grained details critical for distinguishing subtle features among forest components.
SF-UNet addresses these challenges through its innovative architecture that combines the strengths of SpectralFormer and U-Net. The HGSE module within SF-UNet enhances the connectivity of local spectral information. This is particularly beneficial for identifying different forest species and distinguishing between healthy and stressed vegetation, as these often exhibit subtle differences in spectral signatures. The integration of the CAM module allows SF-UNet to effectively capture cross-channel information while suppressing irrelevant data. This is crucial for enhancing the model’s ability to accurately pinpoint and identify specific forest features such as understorey vegetation and forest edges. The cross-layer adaptive fusion mechanism further strengthens the model’s capacity to integrate multiscale features. In the context of forest monitoring, this capability is essential for tracking deforestation, reforestation efforts, and forest health changes over time. By combining these techniques, SF-UNet provides more detailed and accurate classification results. This advancement is highly significant for forest resource management and conservation efforts. However, despite its advantages, the SF-UNet method also has several limitations and disadvantages that need to be considered. The integration of multiple advanced modules increases the computational complexity of the model, leading to longer training times and higher hardware requirements. This may limit its accessibility for users with limited computational resources. Additionally, the performance of SF-UNet heavily depends on the quality and quantity of the training data. In cases where training data is limited or imbalanced, the model may not generalize well to new datasets. There is also a risk of overfitting, especially when trained on small datasets.
Future work should focus on optimizing the model to reduce computational complexity and improve its generalization ability. This could involve exploring more efficient architectural designs, implementing advanced regularization techniques, and developing strategies for better utilization of limited training data. Furthermore, the study could be extended by evaluating the model’s performance on a wider range of hyperspectral datasets and comparing it with other state-of-the-art methods in more detail. This would provide a more comprehensive understanding of the model’s strengths and weaknesses and its potential for practical applications in forest monitoring and management.
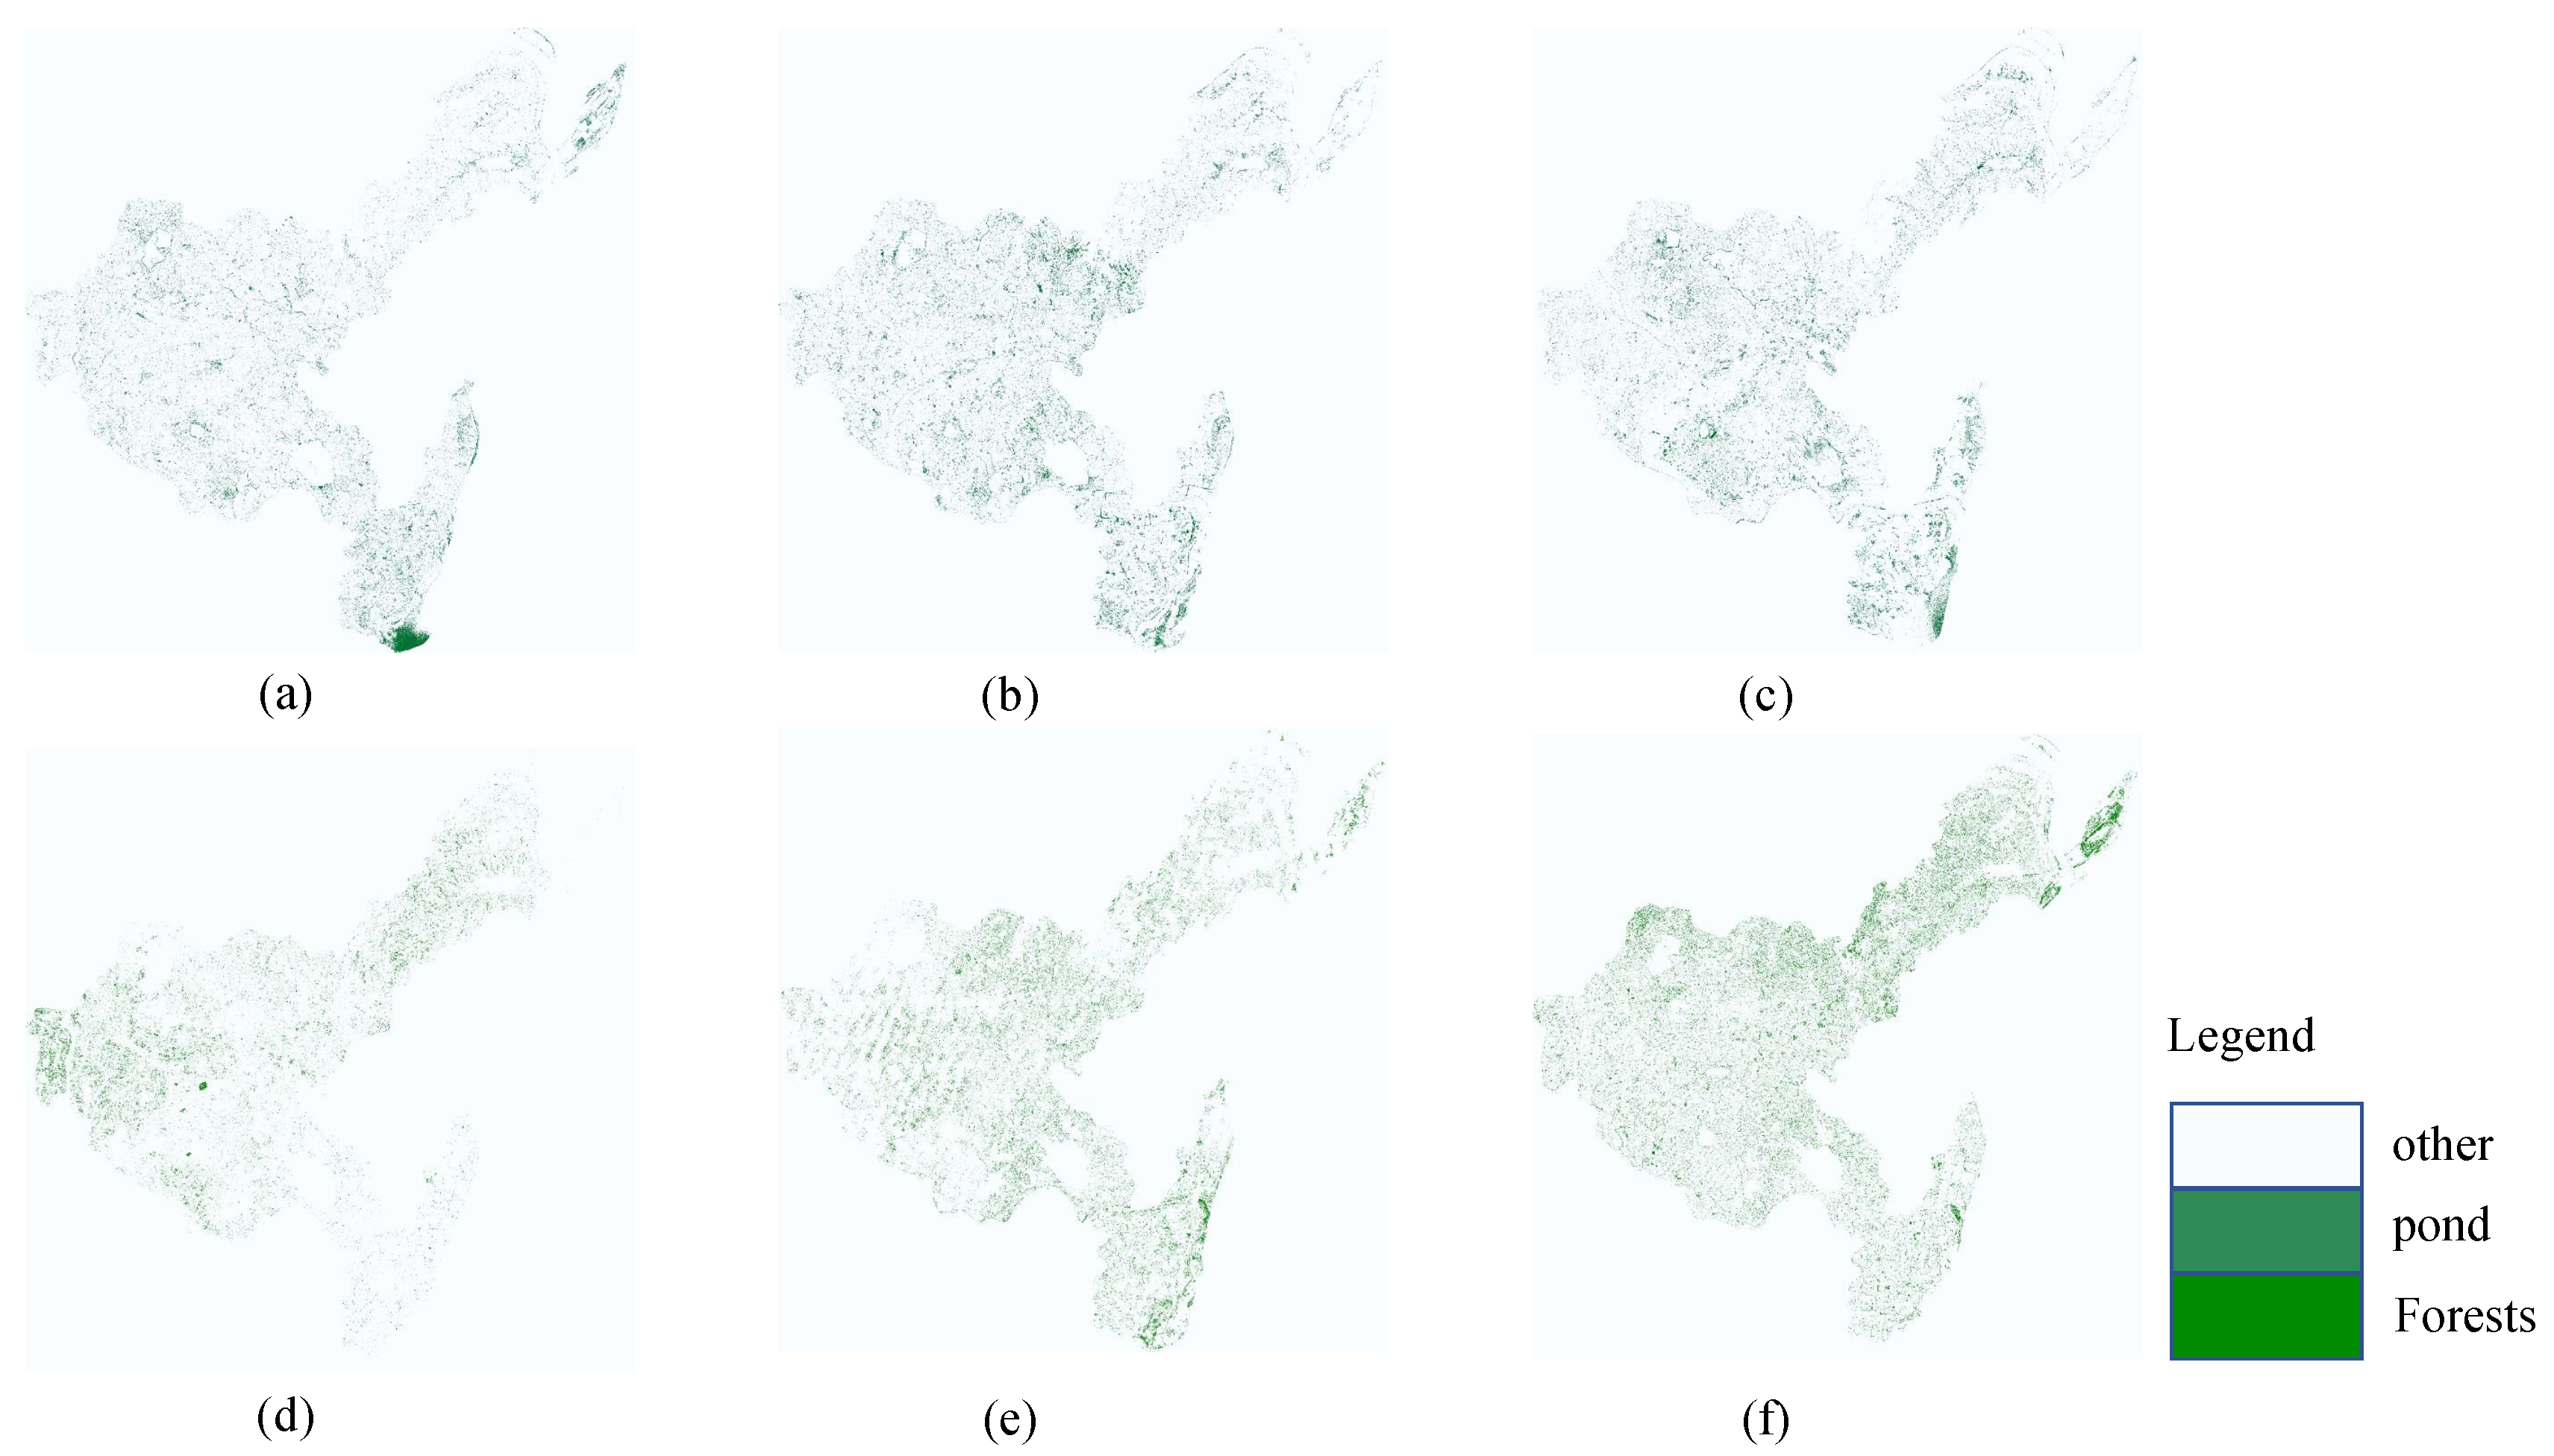
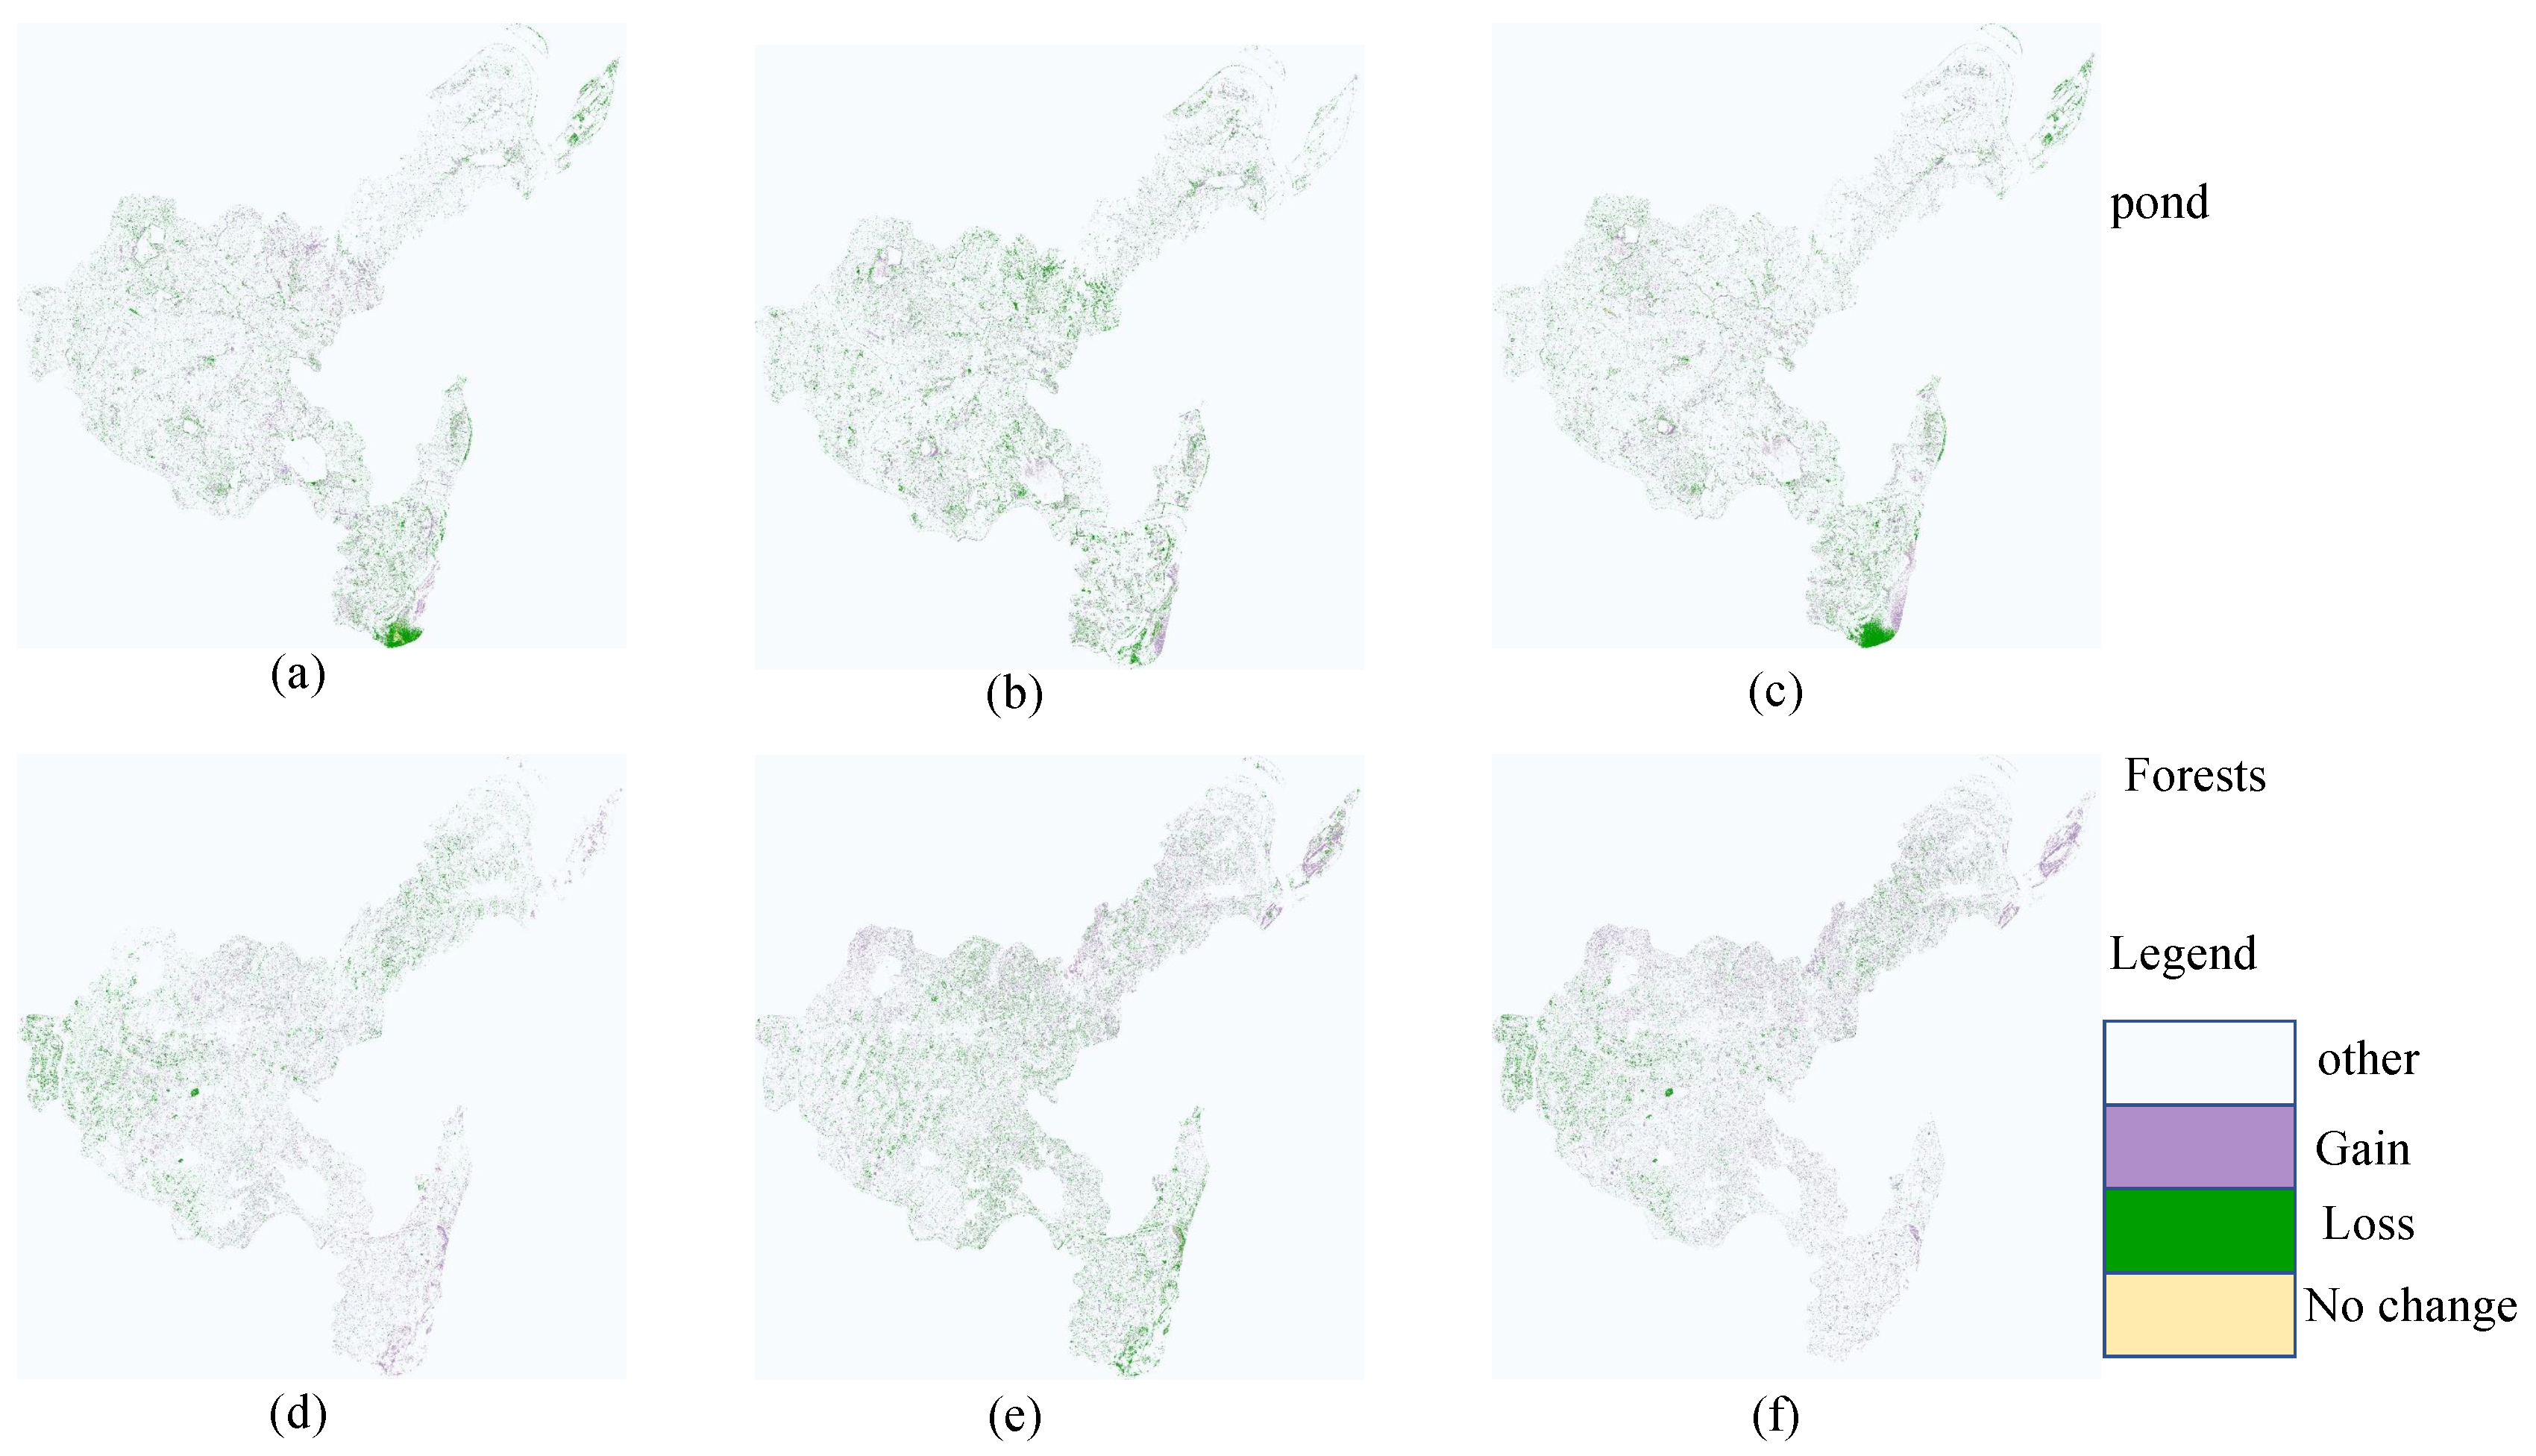
In the analysis of land cover changes in the Heshan area, the trend of forest changes has a significant impact on the ecosystem. As an important ecological resource, an increase or decrease in forest area directly affects multiple aspects such as biodiversity, soil and water conservation, and carbon sequestration capacity. This study shows that forest area experienced significant dynamic changes during the research period, which may be closely related to economic activities, policy changes, and natural factors within the region. The decrease in forest area in 2021 may be related to economic demand and land use policies at the time, while the rebound in 2023 may reflect the initial effectiveness of ecological restoration measures. In addition, the health status and species composition of forests can also affect their spectral characteristics, thereby affecting classification results. The high-precision performance of the SF UNet model in forest classification enables it to effectively monitor changes in forest cover and provide scientific basis for sustainable management of forest resources.

5. Conclusions

The classification of forest hyperspectral images is of great significance for forest resource inventory, forest health monitoring, and biodiversity conservation. Traditional deep learning algorithms often fail to fully leverage the local spectral features of forest hyperspectral images, leading to inadequate characterization of subtle differences among features and subsequent confusion in object class categorization. To address these challenges, this paper proposes a novel approach that integrates global and local contexts to enhance semantic segmentation within the framework of U-Net augmented with SpectralFormer for forest hyperspectral images. Experimental validation using Sentinel-2 data from the selected forest study area demonstrates the efficacy of our approach. Our algorithm, SF-UNet, achieves a classification accuracy of 95.28%, surpassing the mainstream Vision Transformer framework by 6.99%. This significant improvement underscores the advantages of SF-UNet in accurately classifying forest hyperspectral images. SF-UNet also performs exceptionally well across various dataset periods within the forest study area and in hyperspectral forest datasets. Its ability to effectively distinguish between different forest types, detect early signs of forest diseases, and monitor logging activities makes it a powerful tool for forest resource managers and conservationists. Future studies will prioritize refining the SF-UNet architecture specifically for forestry applications. Key research directions include streamlining the model’s computational framework to enhance operational efficiency without compromising its classification accuracy. This optimization process will particularly focus on developing more efficient feature extraction mechanisms while preserving the model’s proven effectiveness in vegetation monitoring. The improved version aims to achieve better processing speed and lower hardware requirements, making it more practical for large-scale forest monitoring applications. These enhancements could significantly benefit environmental researchers and forestry management professionals by providing a more accessible yet powerful tool for analyzing complex forest ecosystems. The development will maintain the model’s core strengths in temporal consistency and spatial recognition while addressing current limitations in computational resource demands. This will make the model more accessible and practical for widespread use in forest monitoring. Additionally, exploring lightweight encoders could enhance computational efficiency without compromising accuracy. This is particularly important for large-scale forest surveys where processing speed and resource utilization are critical concerns. Furthermore, we aim to extend the application of SF-UNet to other forest-related tasks such as carbon sequestration estimation and habitat suitability analysis. By doing so, we hope to contribute to the sustainable management and conservation of forest ecosystems.

Author Contributions

Resources, H.Y., X.X., X.F., Q.L. and H.L.; conceptualization, H.Y., X.X., X.L., X.F., Q.L. and H.L.; methodology, H.Y., X.X., X.L., X.F., Q.L. and H.L.; software, H.Y., X.X., X.L., X.F., Q.L. and H.L.; validation, H.Y., X.X., X.L., X.F., Q.L. and H.L.; formal analysis, H.Y., X.X., X.L., X.F., Q.L. and H.L.; investigation, X.X., X.L., X.F., Q.L. and H.L.; data curation, H.Y., X.X., X.L., X.F., Q.L. and H.L.; writing—original draft preparation, H.Y., X.X., X.L., X.F., Q.L. and H.L.; writing—review and editing, H.Y., X.X., X.L., X.F., Q.L. and H.L. All authors have read and agreed to the published version of the manuscript.

Funding

The National Natural Science 441 Foundation of China: 62161051. Guangxi Key Research and Development Program: 2023AB38108. 442 Supported by the Foundation of Yunnan Key Laboratory of Service Computing: YNSC23119. Supported by the Yunnan Provincial Basic Research Program (Grant No. 202501AT070452). Yunnan Provincial Department of Education Science Research Fund Project (2023J0678). Yunnan University of Finance and Economics Science Research Fund Project (2024D43).

Data Availability Statement

The required data sources are presented in this article. The original contributions presented in this study are included in the article. Further inquiries can be directed to the corresponding author.

Conflicts of Interest

The authors declare no conflict of interest.

Abbreviations

The following abbreviations are used in this manuscript:
SFSpectralFormer
IIIntelligent interpretation
CNNConvolutional neural network
SEMSemantic ambiguity
ViTVision Transformer
CAFCross-layer adaptive fusion
HGSEHalf of groupwise spectral embedding
HCAFHalf cross-layer adaptive fusion
SCSkip connection
CAMChannel attention module
RFRandom Forest

References

  1. Mo, Y.; Wu, Y.; Yang, X.; Liu, F.; Liao, Y. Review the state-of-the-art technologies of semantic segmentation based on deep learning. Neurocomputing. 2022, 493, 626–646. [Google Scholar] [CrossRef]
  2. Hoalst-Pullen, N.; Patterson, M.W. Applications and trends of remote sensing in professional urban planning. Geogr. Compass 2011, 5, 249–261. [Google Scholar] [CrossRef]
  3. Im, J.; Park, H.; Takeuchi, W. Advances in remote sensing-based disaster monitoring and assessment. Remote Sens. 2019, 11, 2181. [Google Scholar] [CrossRef]
  4. Weiss, M.; Jacob, F.; Duveiller, G. Remote sensing for agricultural applications: A meta-review. Remote Sens. Environ. 2020, 236, 111402. [Google Scholar] [CrossRef]
  5. Khanal, S.; Kc, K.; Fulton, J.P.; Shearer, S.; Ozkan, E. Remote sensing in agriculture—accomplishments, limitations, and opportunities. Remote Sens. 2020, 12, 3783. [Google Scholar] [CrossRef]
  6. Landgrebe, D.A. Signal Theory Methods in Multispectral Remote Sensing; John Wiley & Sons: Hoboken, NJ, USA, 2003; Volume 24. [Google Scholar]
  7. Gu, J.; Wang, Z.; Kuen, J.; Ma, L.; Shahroudy, A.; Shuai, B.; Liu, T.; Wang, X.; Wang, G.; Cai, J.; et al. Recent advances in convolutional neural networks. Pattern Recognit. 2018, 77, 354–377. [Google Scholar] [CrossRef]
  8. Badrinarayanan, V.; Kendall, A.; Cipolla, R. Segnet: A deep convolutional encoder-decoder architecture for image segmentation. IEEE Trans. Pattern Anal. Mach. Intell. 2017, 39, 2481–2495. [Google Scholar] [CrossRef] [PubMed]
  9. Ronneberger, O.; Fischer, P.; Brox, T. U-net: Convolutional networks for biomedical image segmentation. In Proceedings of the Medical Image Computing and Computer-Assisted Intervention–MICCAI 2015: 18th International Conference, Munich, Germany, 5–9 October 2015; proceedings, part III 18. Springer: Berlin/Heidelberg, Germany, 2015; pp. 234–241. [Google Scholar]
  10. Chong, Y.; Chen, X.; Pan, S. Context union edge network for semantic segmentation of small-scale objects in very high resolution remote sensing images. IEEE Geosci. Remote Sens. Lett. 2020, 19, 6000305. [Google Scholar] [CrossRef]
  11. Yuan, X.; Shi, J.; Gu, L. A review of deep learning methods for semantic segmentation of remote sensing imagery. Expert Syst. Appl. 2021, 169, 114417. [Google Scholar] [CrossRef]
  12. Li, Y.; Ouyang, S.; Zhang, Y. Combining deep learning and ontology reasoning for remote sensing image semantic segmentation. Knowl. Based Syst. 2022, 243, 108469. [Google Scholar] [CrossRef]
  13. Kemker, R.; Salvaggio, C.; Kanan, C. Algorithms for semantic segmentation of multispectral remote sensing imagery using deep learning. ISPRS J. Photogramm. Remote Sens. 2018, 145, 60–77. [Google Scholar] [CrossRef]
  14. Chen, Z.; Ting, D.; Newbury, R.; Chen, C. Semantic segmentation for partially occluded apple trees based on deep learning. Comput. Electron. Agric. 2021, 181, 105952. [Google Scholar] [CrossRef]
  15. Wang, Z.; Wang, J.; Yang, K.; Wang, L.; Su, F.; Chen, X. Semantic segmentation of high-resolution remote sensing images based on a class feature attention mechanism fused with Deeplabv3+. Comput. Geosci. 2022, 158, 104969. [Google Scholar] [CrossRef]
  16. Xue, H.; Liu, C.; Wan, F.; Jiao, J.; Ji, X.; Ye, Q. Danet: Divergent activation for weakly supervised object localization. In Proceedings of the IEEE/CVF International Conference on Computer Vision, Seoul, Republic of Korea, 27 October–2 November 2019; pp. 6589–6598. [Google Scholar]
  17. Shang, R.; Zhang, J.; Jiao, L.; Li, Y.; Marturi, N.; Stolkin, R. Multi-scale adaptive feature fusion network for semantic segmentation in remote sensing images. Remote Sens. 2020, 12, 872. [Google Scholar] [CrossRef]
  18. Han, K.; Wang, Y.; Chen, H.; Chen, X.; Guo, J.; Liu, Z.; Tang, Y.; Xiao, A.; Xu, C.; Xu, Y.; et al. A survey on vision transformer. IEEE Trans. Pattern Anal. Mach. Intell. 2022, 45, 87–110. [Google Scholar] [CrossRef]
  19. Chen, J.; Lu, Y.; Yu, Q.; Luo, X.; Adeli, E.; Wang, Y.; Lu, L.; Yuille, A.L.; Zhou, Y. Transunet: Transformers make strong encoders for medical image segmentation. arXiv 2021, arXiv:2102.04306. [Google Scholar]
  20. Zhang, Y.; Liu, H.; Hu, Q. Transfuse: Fusing transformers and cnns for medical image segmentation. In Proceedings of the Medical Image Computing and Computer Assisted Intervention–MICCAI 2021: 24th International Conference, Strasbourg, France, 27 September–1 October 2021; Proceedings, Part I 24. Springer: Berlin/Heidelberg, Germany, 2021; pp. 14–24. [Google Scholar]
  21. Fan, X.; Li, X.; Yan, C.; Fan, J.; Yu, L.; Wang, N.; Chen, L. MARC-Net: Terrain classification in parallel network architectures containing multiple attention mechanisms and multi-scale residual cascades. Forests 2023, 14, 1060. [Google Scholar] [CrossRef]
  22. Fan, X.; Li, X.; Yan, C.; Fan, J.; Chen, L.; Wang, N. Converging Channel Attention Mechanisms with Multilayer Perceptron Parallel Networks for Land Cover Classification. Remote Sens. 2023, 15, 3924. [Google Scholar] [CrossRef]
  23. Hong, D.; Han, Z.; Yao, J.; Gao, L.; Zhang, B.; Plaza, A.; Chanussot, J. SpectralFormer: Rethinking hyperspectral image classification with transformers. IEEE Trans. Geosci. Remote Sens. 2021, 60, 5518615. [Google Scholar] [CrossRef]
  24. Valjarević, A.; Djekić, T.; Stevanović, V.; Ivanović, R.; Jandziković, B. GIS numerical and remote sensing analyses of forest changes in the Toplica region for the period of 1953–2013. Appl. Geogr. 2018, 92, 131–139. [Google Scholar] [CrossRef]
Figure 1. Location of the study area and Sentinel-2 remote sensing image.
Forests 16 00858 g001
Figure 2. Sample division of research area.
Forests 16 00858 g002
Figure 3. Schematic representation of the SF-UNet architecture for multi-hyperspectral image classification tasks.
Forests 16 00858 g003
Figure 4. Half-groupwise spectral embedding schematic.
Forests 16 00858 g004
Figure 5. Adaptive learning cross-layer feature fusion module HCAF.
Forests 16 00858 g005
Figure 6. Channel attention module.
Forests 16 00858 g006
Figure 7. Sentinel-2 image research area has been classified using different algorithms for three years.
Forests 16 00858 g007
Figure 8. Different algorithms for hyperspectral classification results.
Forests 16 00858 g008
Figure 9. Classification results of different algorithms in Huarong County in 2021.
Forests 16 00858 g009
Figure 10. Spatial distribution of objects in Sentinel-2 imaging study area over the past three years.
Forests 16 00858 g010
Figure 11. Spatial feature distribution of forests and greenhouses in Huarong County for three years. (a) 2017; (b) 2019; (c) 2021; (d) 2017; (e) 2019; (f) 2021.
Forests 16 00858 g011
Figure 12. Three-year dynamics of forests and ponds in Huarong County (a) 2017–2019; (b) 2019–2021; (c) 2017–2021; (d) 2017–2019; (e) 2019–2021; (f) 2017–2021.
Forests 16 00858 g012
Table 1. Sample data for Phase III of Huarong County.
201720192021
Training Testing Training Testing Training Testing
Building10832711489373873219
Tree104726216574151107277
Water46401161477611953160790
Greenhouse162040514723691035259
Lotus132533214463621000251
Pond674169869218825207
Wetland85221422945741386347
Vegetable477120660166743186
Rapeseed50012514043511925482
Crayfish116129115263821537385
Rice546137708178746187
Forests432109777195812320
Background\\\\\\
Table 2. Training and test sets for different categories in the Houston dataset.
Category NameTraining SampleTesting Sample
1Healthy Grass1981053
2Stressed Grass1901064
3Synthetic Grass192505
4Tree1881056
5Soil1861056
6Water182143
7Residential1961072
8Commercial1911053
9Road1931059
10Highway1911036
11Railway1811054
12Parking Lot11921041
13Parking Lot2184285
14Tennis Court181247
15Running Track187473
Total283212,197
Table 3. Training and test sets for different categories in the Indian Pines dataset.
Category NameTraining SampleTesting Sample
1Corn Notill501384
2Corn Mintill50784
3Corn50184
4Grass Pasture50447
5Grass Trees50697
6Hay Windrowed50439
7Soybean Notill50918
8Soybean Mintill502418
9Soybean Clean50564
10Wheat50162
11Woods501244
12Buildings Grass Trees Drives50330
13Stones Steel Towers5045
14Alfalfa1539
15Grass Pasture Mowed1511
16Oats155
Total6959671
Table 4. Pavia University dataset.
Category NameTraining SampleTesting Sample
1Asphalt5486304
2Meadows54018,146
3Gravel3921815
4Trees5242912
5Metal Sheets2651113
6Bare Soil5324572
7Bitumen375981
8Bricks5143364
9Shadows231795
Total392140,002
Table 5. Ablation experimental results of SF-UNet dataset (the best results are marked in red, and sub-optimal results are marked in blue).
Different MethodsDifferent ModuleMetricTime (s) ↓
U-Net SF CAM HGSE HCAF OA (%) ↑ AA (%) ↑ Kappa ↑
U-net××××80.0680.190.76456471.62
SpectralFormer××××90.0890.320.88276544.49
SF-UNet×××92.3291.970.90127377.02
SF-UNet××93.7793.190.92887904.60
SF-UNet×94.4094.230.93388096.95
SF-UNet95.2893.960.94317264.00
Table 6. Classification results of different algorithms in the research area in 2021.
Class No.Different Methods
SVM RF CNN KNN U-Net ViT SpectralFormer Our
Vegetable61.6784.4051.2585.3184.8289.7790.7694.83
Pond45.4675.3030.4576.6875.7989.2390.18 86.76
Greenhouse82.6188.7961.7589.1882.0496.6196.3999.42
Water62.1383.3150.8379.1878.1487.9191.1898.48
Wetland63.4387.2952.5682.2381.2485.1287.4689.39
Forest66.9292.0160.2684.6180.1984.7088.2696.44
Buildup65.8282.8758.0470.6779.0788.0787.9592.38
OA (%) ↑64.9685.6953.7381.0480.0688.2990.0895.28
AA (%) ↑64.0184.8652.1781.1380.1988.7890.3293.96
Kappa ↑0.58430.83060.45000.77630.76450.86180.88270.9431
Table 7. Classification results of different algorithms in Heshan District in 2019.
Class No. Different Methods
SVM RF CNN KNN U-Net ViT SpectralFormer Our
Vegetable61.1884.8950.1786.1575.1683.8992.6596.13
Pond45.1873.7228.5676.8247.7586.6790.3896.37
Greenhouse81.0888.0472.7688.0473.0695.1096.8899.53
Water62.1383.0954.1080.8473.6085.8991.0793.45
Wetland63.6686.4954.8482.2768.5783.8587.7395.10
Forest66.7390.0757.9684.6773.4185.4787.1695.40
Buildup67.3383.2350.0570.5569.3382.0289.8496.13
OA (%) ↑64.9284.9954.0681.2869.8385.9990.4295.82
AA (%) ↑63.9084.2352.6481.3468.7086.1390.8296.02
Kappa ↑0.58380.82240.45440.77920.64200.83440.88690.9506
Table 8. Classification results of different algorithms in Heshan District in 2023.
Class No. Different Methods
SVM RF CNN KNN U-Net ViT SpectralFormer Our
Vegetable52.5870.1237.5282.1680.0278.6185.4892.35
Pond26.1373.0213.5972.6969.2582.0487.5294.89
Greenhouse76.7489.2871.5788.0983.8894.0494.6697.73
Water54.6678.0551.7480.7376.0483.2885.1489.39
Wetland54.2480.1945.2276.3678.7289.6591.9894.51
Forest68.0377.1259.0980.6480.6679.2984.1590.65
Buildup57.5477.8449.0569.8275.9283.8886.694.35
OA (%) ↑57.8578.449.6378.7178.1284.3287.6493.04
AA (%) ↑55.7177.9546.8378.6577.7984.487.9493.41
Kappa ↑0.499974.490.39980.74920.74150.81490.85420.9178
Table 9. Classification results of different algorithms on hyperspectral datasets.
EvaluationMethods
SVM KNN RF CNN RNN ViT SF Our
HoustonOA (%) ↑73.6379.4277.5984.1578.0775.8277.3186.69
AA (%) ↑74.4280.7680.4185.5380.1978.1579.5683.19
Kappa ↑0.71410.77690.76250.82800.76250.73830.75410.8505
IndianOA (%) ↑55.3260.5669.6671.7453.2750.6475.3877.54
AA (%) ↑49.0871.4076.7778.0353.1056.1281.2075.19
Kappa ↑0.49160.55640.65760.67870.46730.44860.71920.7281
PaviaOA (%) ↑71.9770.8369.2881.9378.3568.8374.9583.37
AA (%) ↑76.6579.9280.0186.2184.0577.6983.3081.31
Kappa ↑0.63200.63230.61960.76280.72230.60180.67970.8000
Table 10. Three-year data sample of Huarong County.
ClassArea (km2)Area Change Rate (%)
2017 2019 2021 2017–2019 2019–2021 2017–2021
Buildup114.9272124.5547182.15988.3846.2558.50
Tree125.1143105.608976.3699−15.59−27.69−38.96
Water157.331797.8937132.7025−37.7835.56−15.65
Greenhouse45.424871.692316.188757.83−77.42−64.36
Lotus56.438232.170224.1319−43.00−24.99−57.24
Pond55.405499.061284.547478.79−14.6552.60
Wetland137.4385135.4457133.4817−1.45−1.45−2.88
Vegetable105.0842138.7900120.009432.08−13.5314.20
Rapeseed139.8075293.9893262.4486110.28−10.7387.72
Crayfish179.1558226.0001365.096426.1561.55103.79
Rice57.9711115.722155.128999.62−52.36−4.90
Forests51.8459132.2657201.6582155.1152.46288.95
Background\\\\\\
Disclaimer/Publisher’s Note: The statements, opinions and data contained in all publications are solely those of the individual author(s) and contributor(s) and not of MDPI and/or the editor(s). MDPI and/or the editor(s) disclaim responsibility for any injury to people or property resulting from any ideas, methods, instructions or products referred to in the content.

