Article

The Effect of Selected Operation Factors on Cutter Deflection Angles, Instantaneous Speeds, and Accelerations While Cutting Wood with a Petrol Chainsaw

by
Adam Maciak
* and
Magda Kubuśka-Orłowska
Department of Biosystems Engineering, Warsaw University of Life Sciences (SGGW), 02-787 Warszawa, Poland
*
Author to whom correspondence should be addressed.
Forests 2025, 16(5), 859; https://doi.org/10.3390/f16050859
Submission received: 26 March 2025 / Revised: 7 May 2025 / Accepted: 16 May 2025 / Published: 21 May 2025
(This article belongs to the Section Wood Science and Forest Products)

Abstract

:
The aim of this study was to determine the influence of initial chain tension, feed force, and wood hardness on the variability of the cutter’s deflection angle during petrol chainsaw operation. Cutting wood with a chainsaw is a complex process that has not been fully elucidated to date. During operation, the position of cutters with respect to the workpiece may vary. The situation is additionally complicated by the fact that chainsaws are powered by one-cylinder gasoline engines characterized by highly variable instantaneous rotational speeds. The experiments involved two types of wood (pine and oak), two initial tension values (tight vs. slack chain), and two feed forces (20 N and 80 N). The cutting process was recorded with a high-speed camera at 12,000 fps to determine cutter deflection angles, instantaneous speeds, and accelerations for all the aforementioned cases. It was found that at the lower feed force the cutter deflection differed depending on the initial chain tension, and a greater cutter deflection angle was observed in pine wood processing. It was also found that speed and acceleration in the Y axis were much lower than in the X axis. Additionally, the rear part of the cutter revealed greater speed variation in the X axis.

1. Introduction

Despite the increased use of high-performance multi-machine systems in forestry [1], portable gasoline-powered chainsaws continue to be widely applied in timber harvesting and pre-processing around the world. This is mostly due to economic reasons and terrain conditions that prevent access by vehicles [2,3,4,5]. On the other hand, chainsaw use involves certain risks and hazards [2,6] and puts a substantial physical strain on the operator [7,8,9,10], who is exposed to excessive noise and vibration levels [11,12]. Also, the resulting sawdust, the amount of which largely depends on cutter (tooth) geometry, is detrimental to human health [13,14].
While modern felling methods are gradually gaining in popularity [11], only the Scandinavian countries can boast a more than 90% share of high-performance machines in total harvesting operations [15].
Wood cutting is a very complex process that has not been fully elucidated to date. The chainsaw is a unique tool in that the cutting chain exhibits a more complicated structure compared to other multi-blade implements. Since the chain is not rigid, during operation individual cutters may change their position with respect to the workpiece, especially in the case of portable gasoline-powered chainsaws [16].
A major breakthrough in the perception of the process of wood cutting with chainsaws occurred in 2001 when Górski discovered that, contrary to what had been thought, it was not continuous [17]. Indeed, discontinuities in cutting have a direct bearing on the cutting rate [18]. Over the years, a number of cutting models and theories have been developed, with the first proposals published as early as 1870 by Time [19]. A comprehensive mathematical model describing the cutting process was formulated by Górski in 1995 [20] to analyze the effects of the basic factors on cutting performance and energy-efficiency. Importantly, Górski [17] found that the model is true for a kerf height of more than 40 mm. The last model built on the assumption of continuous cutting was published in 2001 by Maciak to estimate the effects of the geometric parameters of cutters on the chainsaw cutting rate [21]. Linear regression models were also fitted to the experimental data, trends were identified, and optimal cutting conditions were investigated [22].
The discontinuous nature of cutting (intermittent cutting) implies that the cutters transiently lose contact with the workpiece, which also has implications for the cutting rate per cross-sectional unit of area [18]. The wood cutting process was first recorded with a high-speed camera by To, Doii, and Yokoyama in1967 who reported that the cutter deflection angle increased with decreasing chain tension [23]. However, since the camera used at the time was analog (with photographic film), a more detailed analysis of the acquired images was impossible.
In 2013, in a study employing a high-speed digital camera [18], Maciak found that the cutters dynamically changed their angle with respect to the workpiece and in some cases they transiently lost contact with the guide bar raceway. He observed that the cutter deflection angle depended on the initial chain tension and the applied feed force, that is, it diminished with decreasing feed force and increasing chain tension. Nevertheless, according to Maciak [18] those phenomena were not thoroughly elucidated.
The initial chain tension and feed force significantly affect the cutting rate per unit of cross-section [17,18]. Insufficient chain tensioning or low feed forces lead to inferior cutting performance. The difference in hardness between wood species may additionally affect the behavior of cutters in the kerf. Thus, the research hypothesis is that changes in wood hardness, initial chain tension, and applied feed force influence that behavior. Previous studies have shown that changing the initial tension and the applied feed force significantly affects the cutting efficiency [16]. Understanding how these factors affect the freedom of link deflection would help explain why feed force and initial tension significantly affect the change in cutting efficiency.
Thus, the objective of the study was to determine the effect of initial chain tension, feed force, and wood hardness on the behavior of chainsaw cutters, with a focus on variability of cutter deflection angle, instantaneous speed, and acceleration in the kerf.

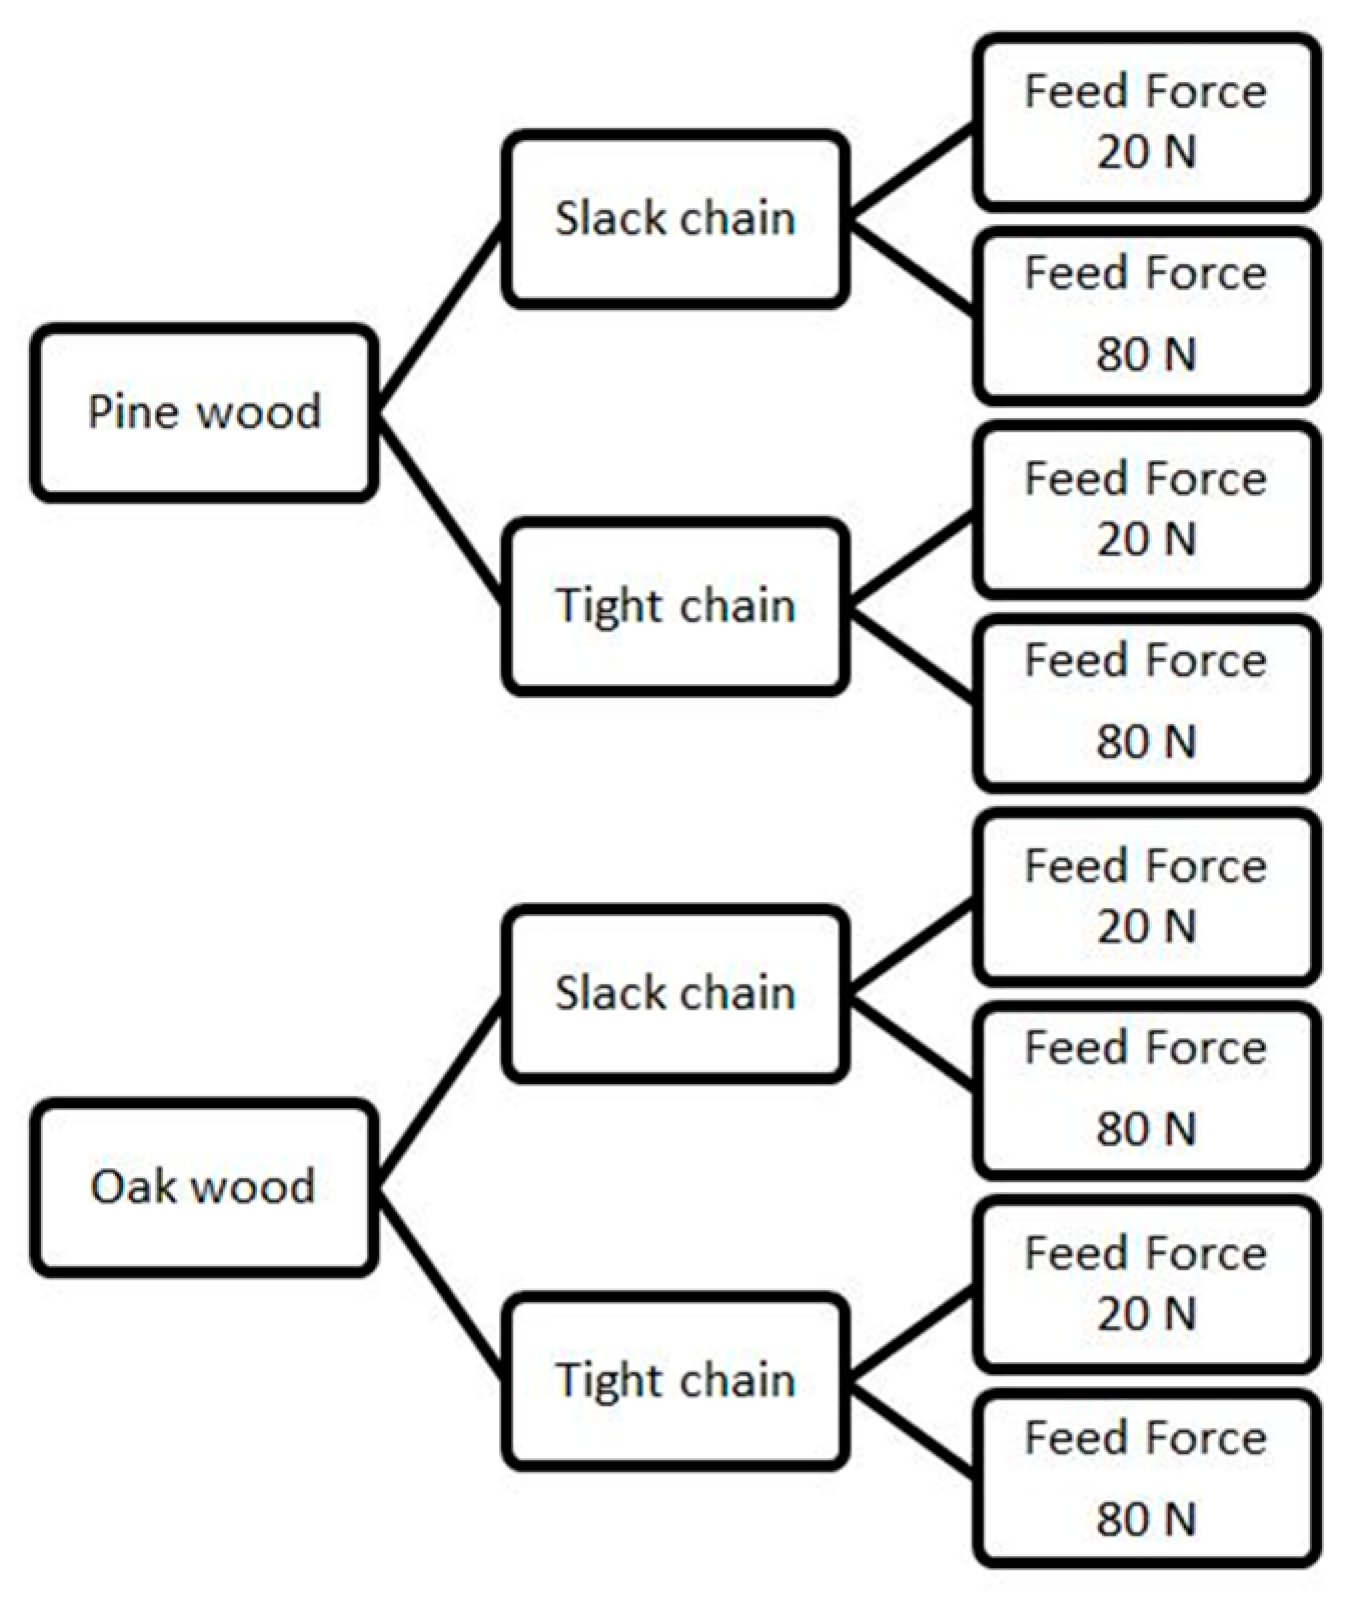
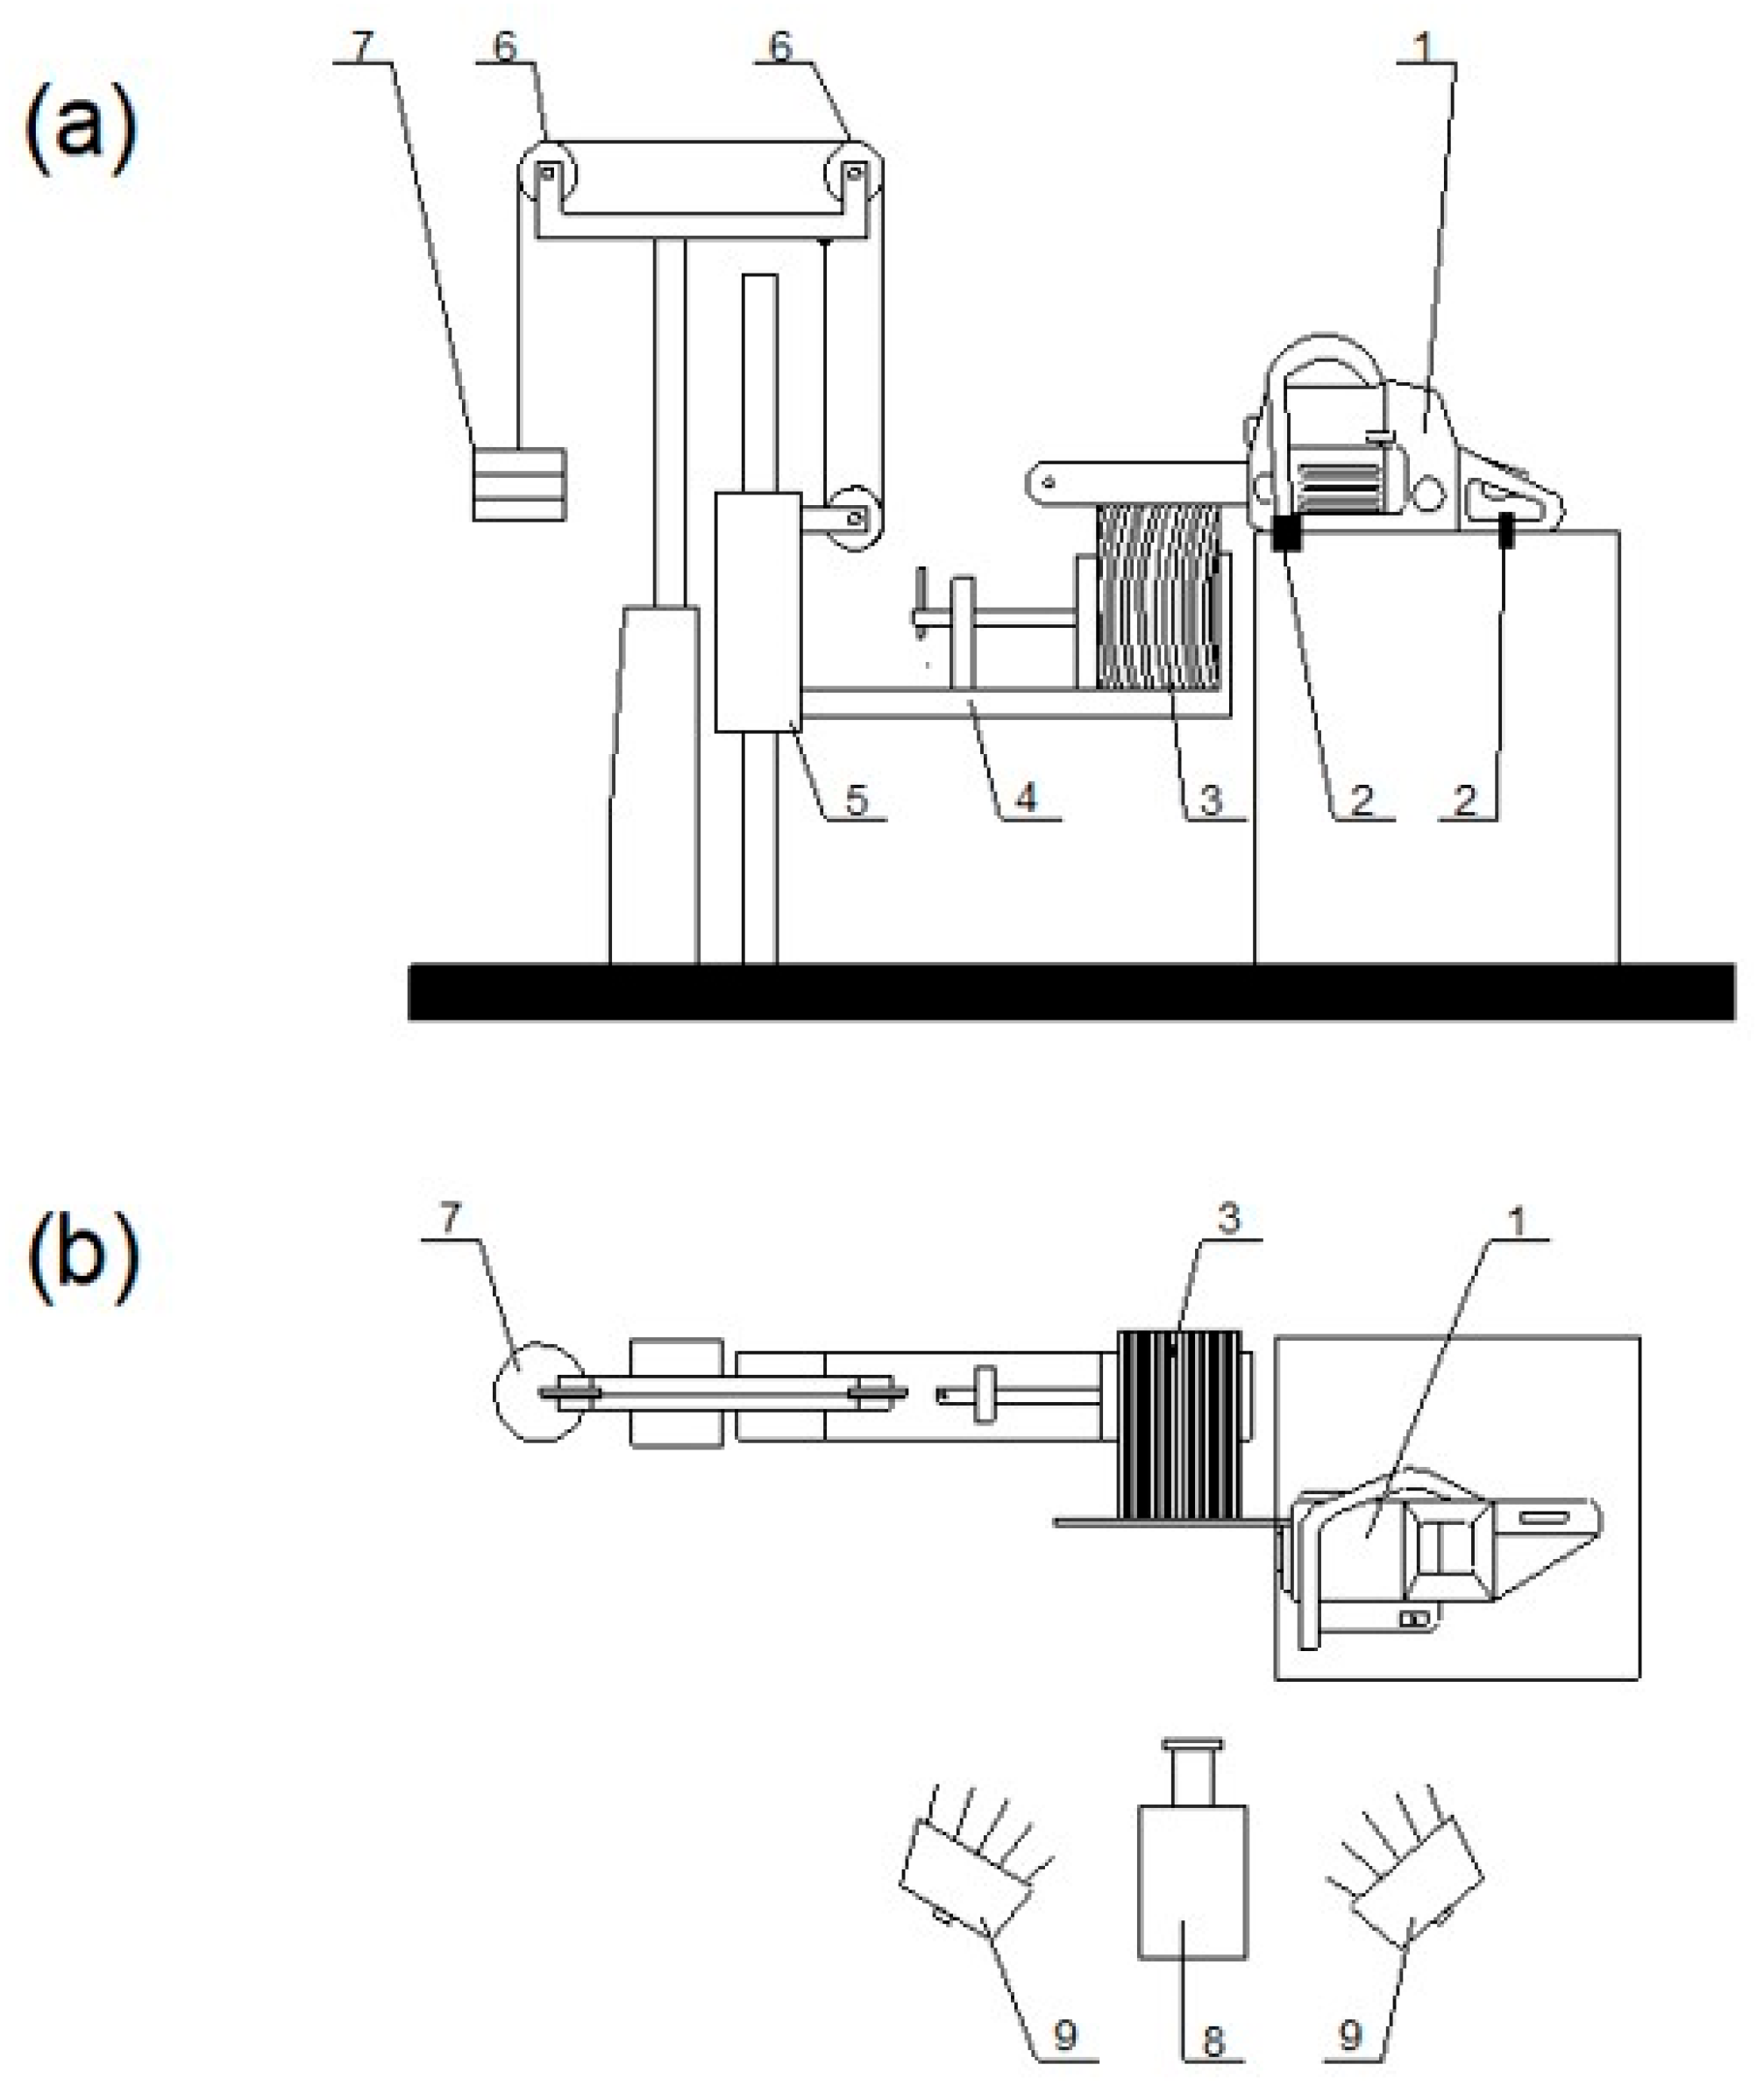
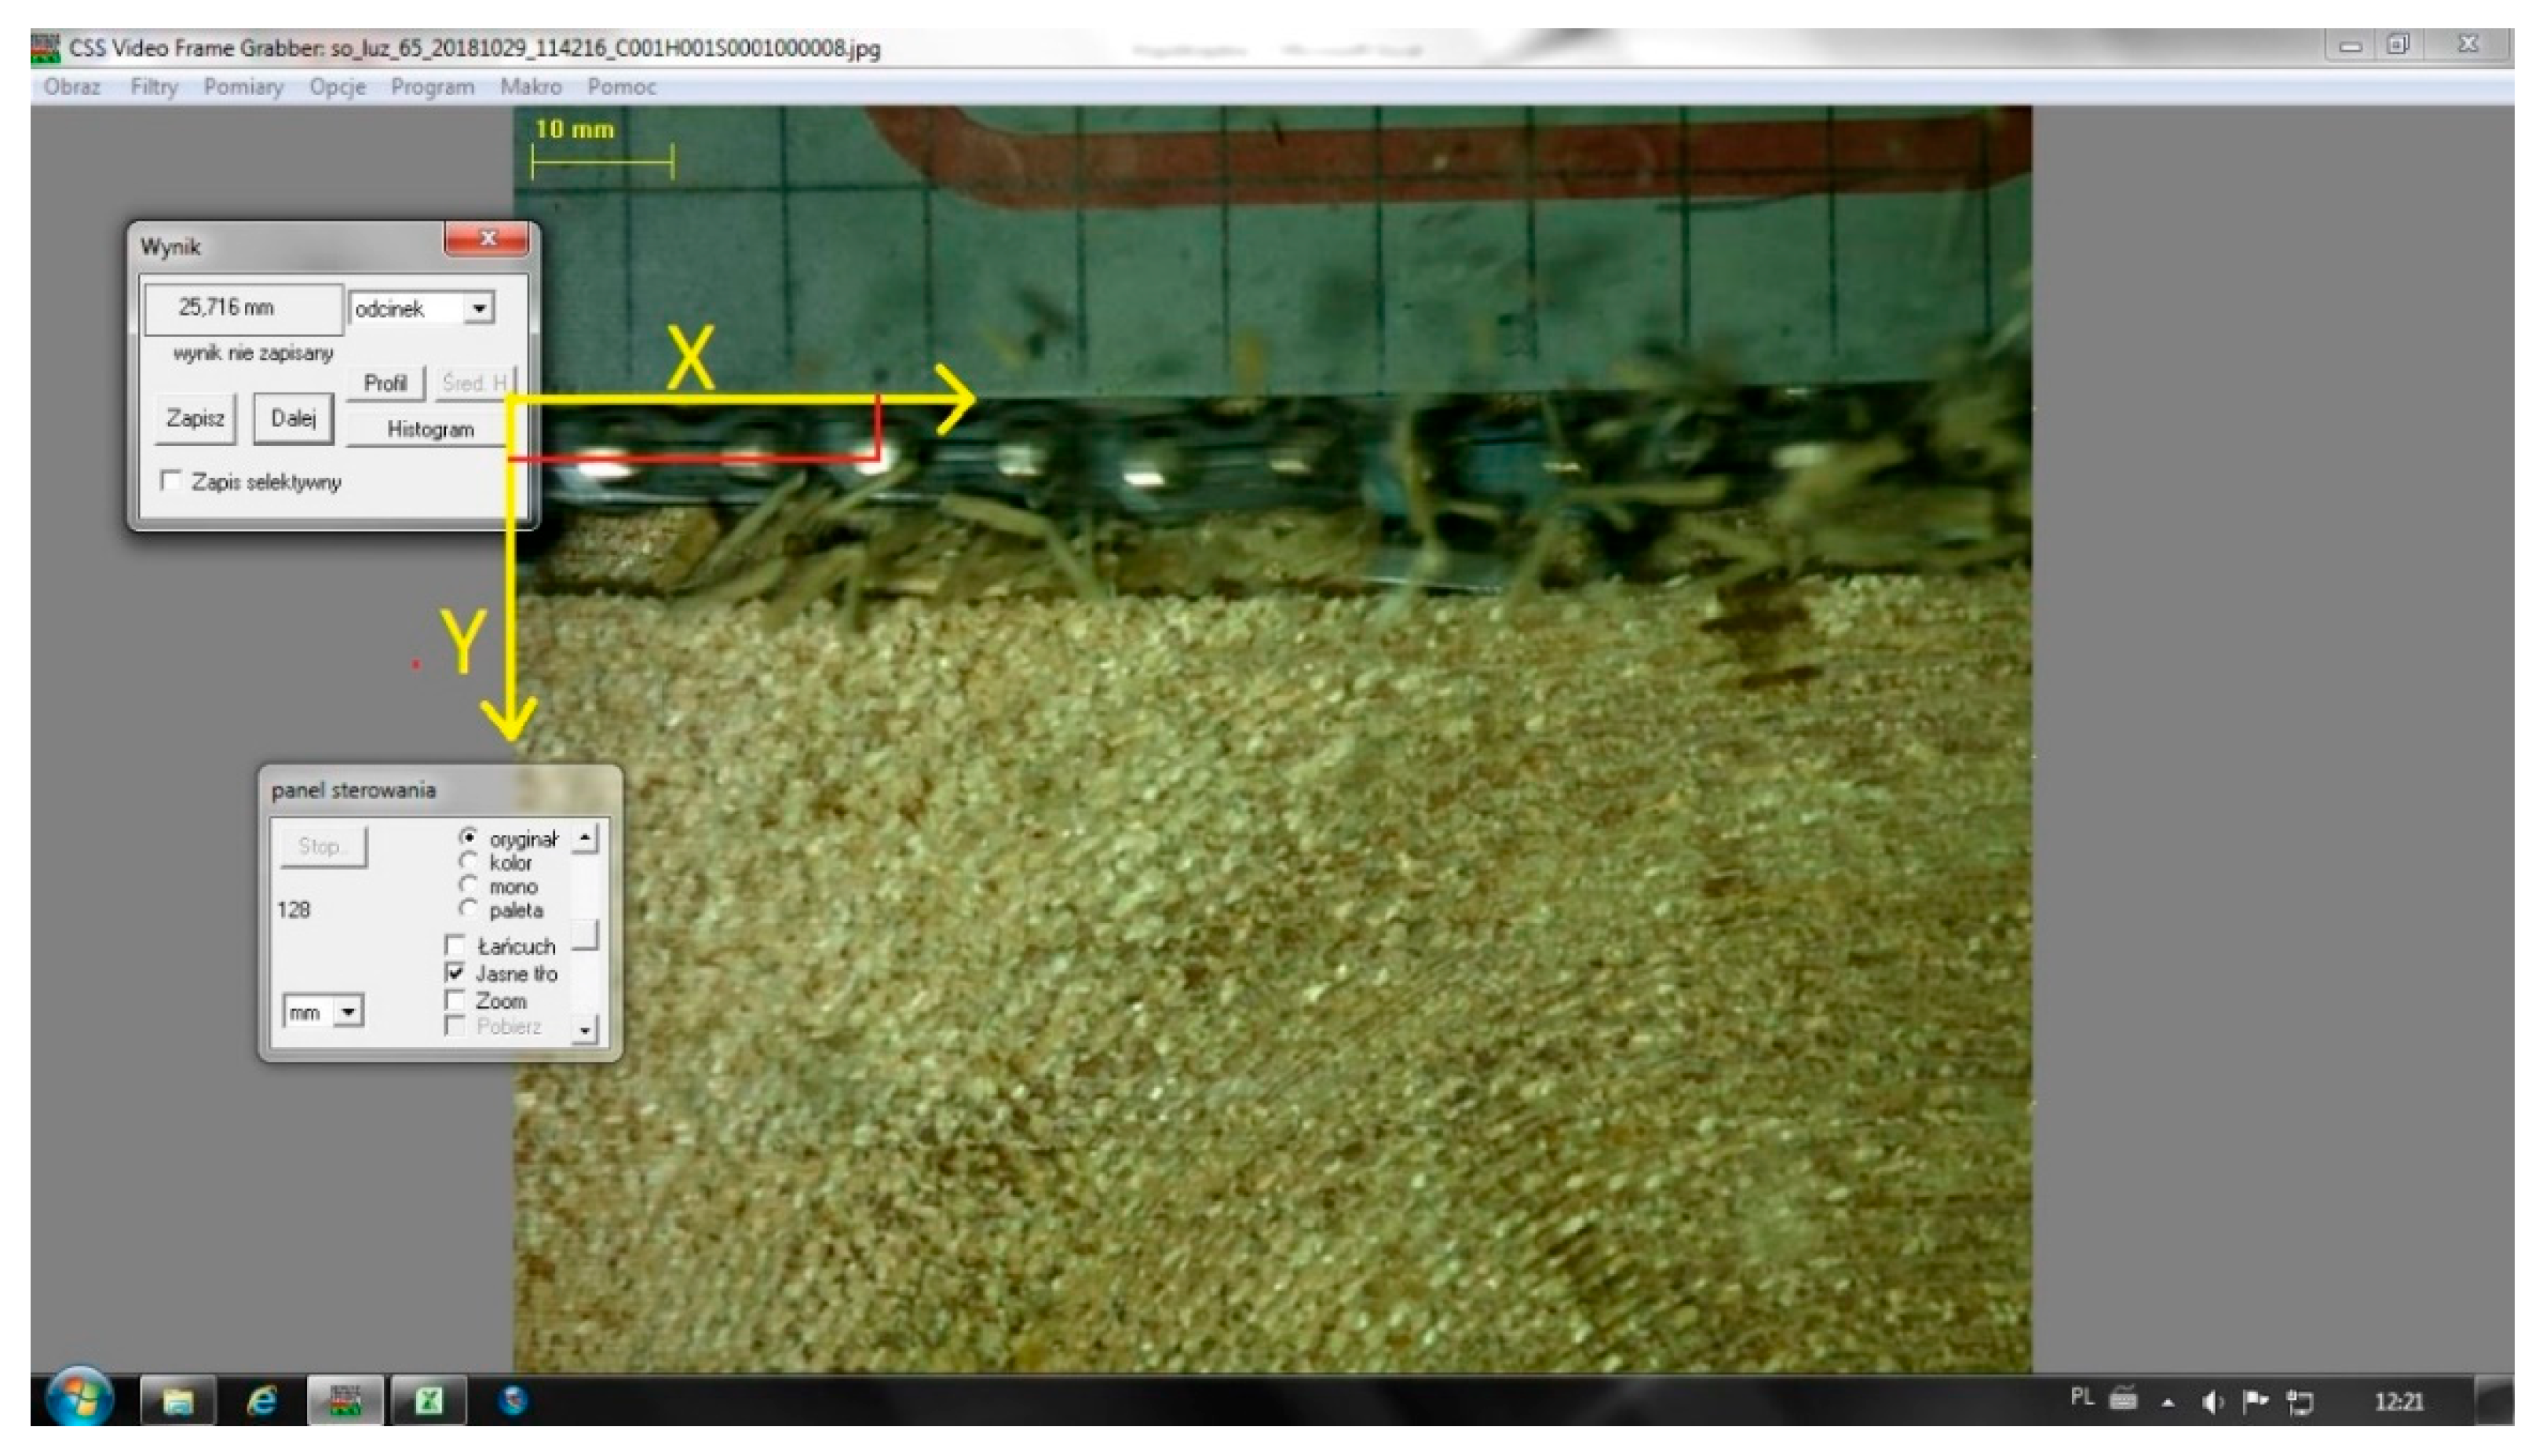
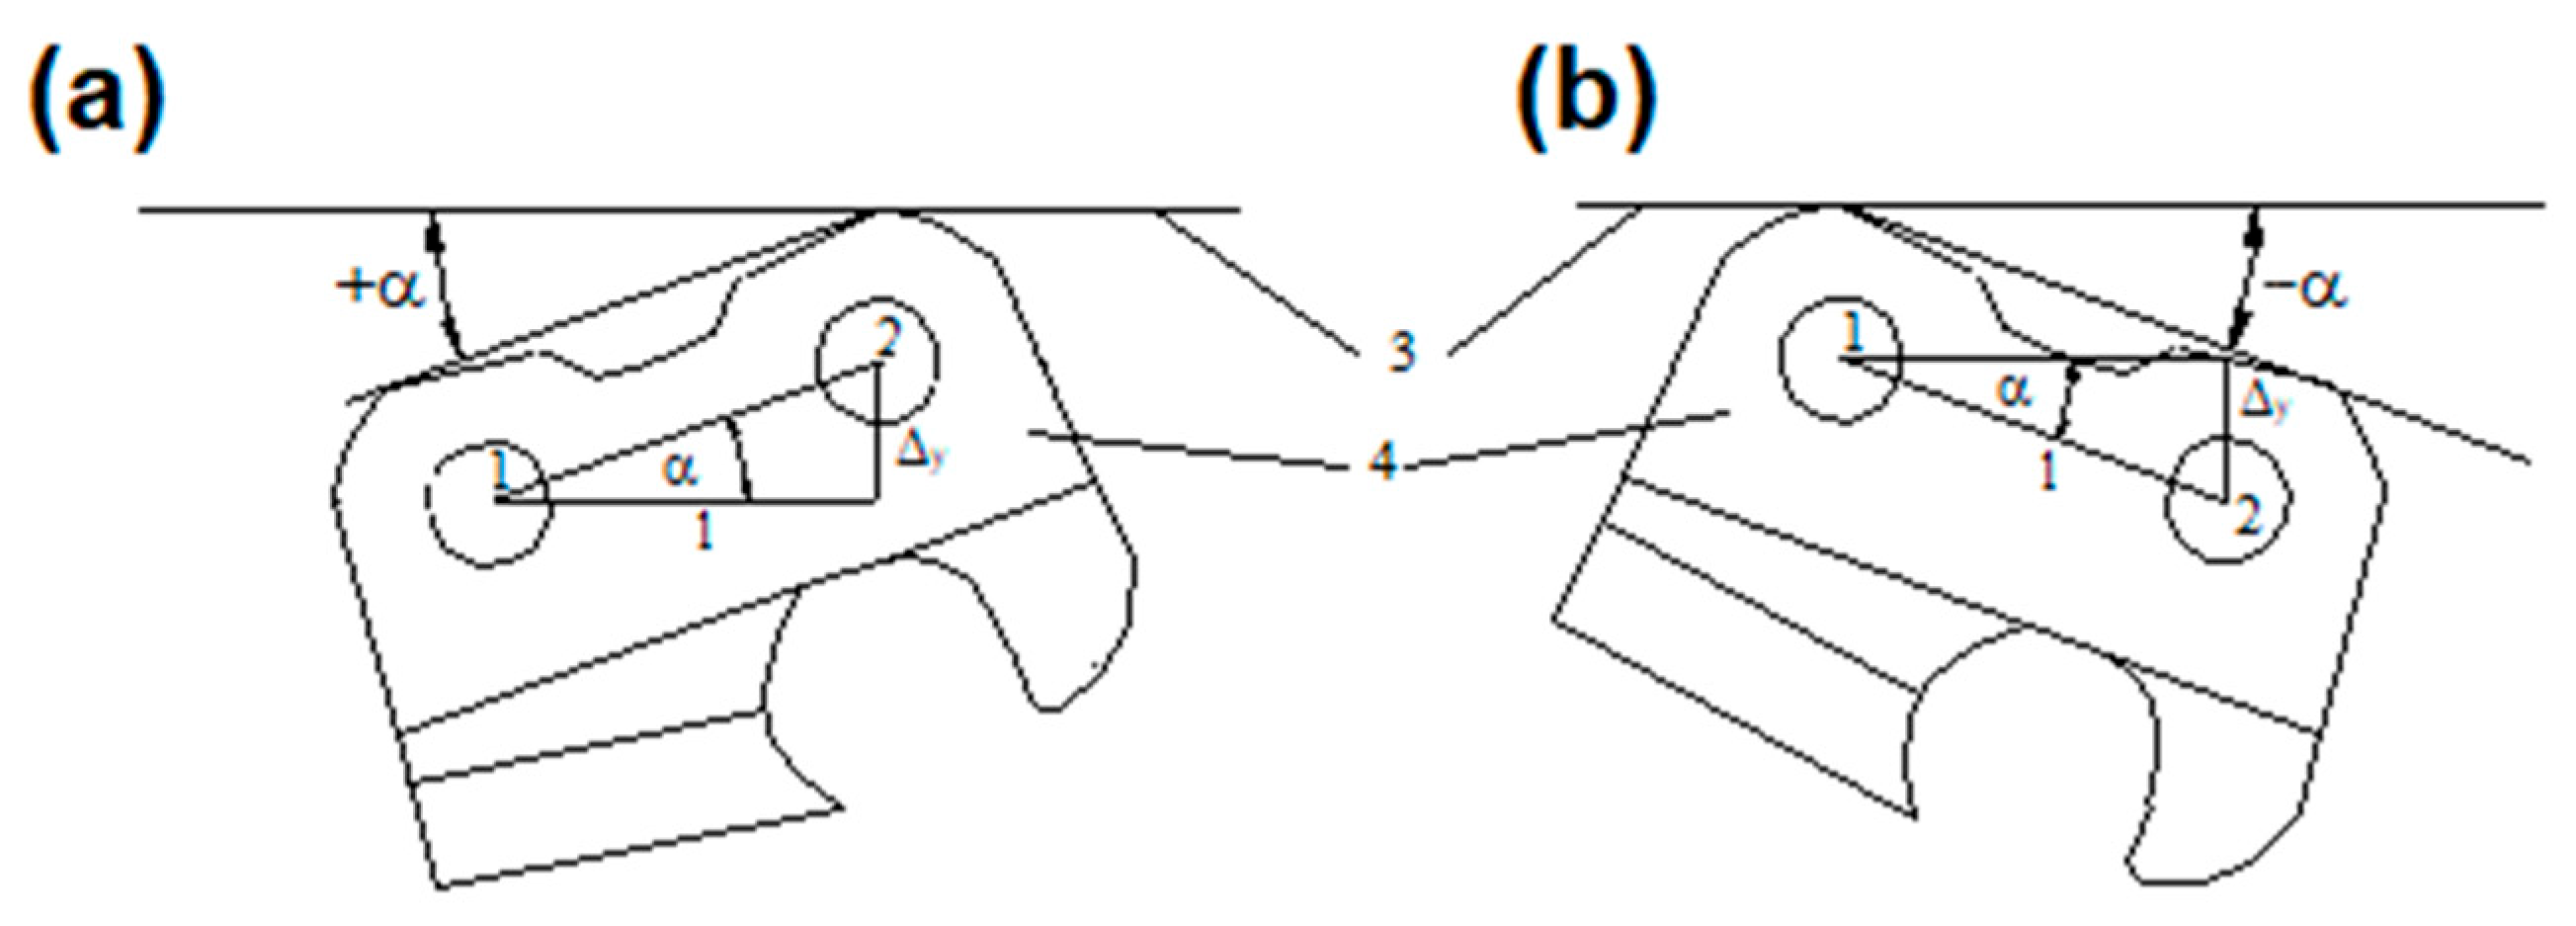
2. Materials and Methods

In the present study, eight different variants of the wood cutting process were recorded using a high-speed digital camera. The study was performed for two wood species (pine and oak), two initial chain tensions, that is, slack and tight (correctly tensioned), and two feed forces (20 N and 80 N). The range of feed forces was selected based on preliminary research. It was the lowest and highest feed force that was possible to cut both tested species. All those variants are presented in Figure 1. The feed force range was adopted on an experimental basis. Prior to proper measurements, it was determined below what feed force the chainsaw could no longer cut wood, which was then used as the lower threshold. Also, the upper threshold was established experimentally as the force above which the chainsaw engine choked.
The cutting chain was powered by a Husqvarna 357XP portable gasoline chainsaw with a cylinder displacement of 56.3 cm3, maximum power output of 3.2 kW, and a weight of 5.5 kg (without a cutting assembly and with empty fuel tanks). The applied chisel chain (3/8 in pitch, 1.5 mm gauge, and 0.5 mm depth gauge) had 56 drive links and 28 cutters mounted on a 15 in guide bar. The radius of the arc between the side and top plates of the cutters was 0.2 mm.
The chain was tensioned before each measurement series (Figure 2) by hanging a 20 N weight halfway along the length of the guide bar and adjusting the tensioner. Chain sag Δy was defined as the distance between the guide bar raceway and the cutter’s toe. The chain was considered slack if the measured Δy value was 8 mm and tight for Δy = 5 mm. This method of initial chain tensioning had also been used in other studies [17,21,24]. Subsequently, the chainsaw was started and the engine was kept running at a high rotational speed for some time to warm up the chain. After that, chain tensioning was double-checked.
This study compared two wood species: pine and oak. Rectangular cuboid samples with a cross-section of 14 × 20 cm and a length of 120 cm were obtained from trees harvested in the Rogów forest district. The moisture content of pine wood was 12.9% and that of oak wood was 14.6%, as determined by loss on drying using a Heraeus UT 6120 forced-air-circulation laboratory oven and a Radwag WPS210S balance (the initial and final weight of samples was determined with an accuracy of 0.001 g). There was a slight difference in humidity of the species tested. According to the literature, an increase in a wood humidity from 10% to 70% causes an increase in cutting resistance by approx. 15%. According to the authors, the difference in humidity level between the tested species of approximately 2% will not significantly affect the obtained results. To avoid the impact of temperature on the obtained results, the saw was warmed up before measurements.
The wood cutting process was recorded using a Fastcam SA1.1 high-speed digital camera from Photron at 12,000 fps. The camera is highly resistant to dust and moisture. The maximum frame rate ranges from 5400 fps at full resolution (1024 × 1024 pixels) to 675,000 fps at reduced resolution (64 × 16 pixels). The camera has a 12-bit image sensor with 20 µm pixel size. To facilitate analysis of cutter behavior during operation, cuts were made as close as possible to the face of the samples.
The wood cutting process was recorded on the experimental stand presented in Figure 3. During experiments the chainsaw (1) was mounted rigidly. The wood sample (3) was placed in a vise (4) horizontally with respect to the chainsaw and perpendicularly with respect to the plane of the guide bar. Feed force was adjusted using weights (7), which were connected to the vise through a steel rope running through guide rollers (6), causing vertical motion of the vise with the sample. After starting the chainsaw, the throttle trigger was locked at maximum rpm. After releasing the weights, the wood sample (3) was vertically moved upwards and was cut across the grain. The work area to be recorded was lit with two LED spotlights (9) with a color temperature of 6000–6500 K. That temperature was selected on the basis of preliminary trials as cutter details were poorly visible under warmer light (with a lower temperature). A fast-speed camera (8) was placed in front of the guide bar to record the cutting process.
Prior to each measurement, the feed force was adjusted using weights and measured using a dynamometer with a relative accuracy of ±5%. Also, the initial chain tension was checked. The chainsaw and camera were started and the workpiece was cut. After each cut, the chainsaw was turned off and prepared for the next trial. Each measurement series consisted of five trials.
The video material was converted into single frames using Photron FASTCAM Viewer software version 1.1. The images were analyzed with CSS Video Frame Grabber (Figure 4). The parameter of interest was the distance between the rivet axis and the bar guide raceway (Y coordinate). The origin of the Y axis coincided with the raceway. All frames were analyzed and the interval between frames was 1/12,000 s.
Subsequently, the deflection angle was calculated based on the determined Y values of pairs of rivets using the following formula:
α = a r c s i n Δ Y l
where
  • Δ Y —is the difference in Y values between rivet axes [mm],
  • l—is the distance between rivet axes [mm] (10 mm for the studied cutters).
Differences in Y values for rivet axes were determined from the formula:
Δ Y = Y 1 Y 2
where
  • Y 1 —is the distance of the rear rivet axis (1) from the guide bar raceway [mm],
  • Y 2 —is the distance of the front rivet axis (2) from the guide bar raceway [mm].
The distances and angles in question are shown in Figure 5. If rivet 1 was farther from the guide bar than rivet 2, the angle α was defined as positive (Figure 5a); in the opposite case it was deemed negative (Figure 5b). Furthermore, mean values and standard deviations were also calculated for the absolute values of cutter deflection angles.
The instantaneous speed of rivets in the X axis was calculated from the following formula:
v x = x i + 1 x i t
where
  • vx—is the rivet speed in the X axis [mm·s−1],
  • xi—is the X coordinate of the axis of the rivet in image i [mm],
  • xi+1—is the X coordinate of the axis of the rivet in image i + 1 [mm],
  • t—is the interval between images [s].
The instantaneous speed of rivets in the Y axis was calculated from the following formula:
v y = y i + 1 y i t
where
  • vy—is the rivet speed in the Y axis [mm·s−1],
  • yi—is the Y coordinate of the axis of the rivet in image i [mm],
  • yi+1—is the Y coordinate of the axis of the rivet in image i + 1 [mm],
  • t—is the interval between images [s].
Rivet acceleration was calculated from the following formulas:
a x = v x ( i + 1 ) v x i t
where
  • ax—is the rivet acceleration in the X axis [mm·s−2];
  • vxi—is the rivet speed in the X axis [mm·s−1];
  • vx(i+1)—is the rivet speed in the X axis after 1/12,000 s [mm·s−1];
  • t—is the interval between images [s].
a y = v y ( i + 1 ) v y i t
where
  • ay—is the rivet acceleration in the Y axis [mm·s−2];
  • vyi—is the rivet speed in the Y axis [mm·s−1];
  • vy(i+1)—is the rivet speed in the Y axis after 1/12,000 s [mm·s−1];
  • t—is the interval between images [s].
In this study, the interval between images was 1/12,000 s. Since speed in the Y axis assumed both positive and negative values, analysis was performed on absolute values, which were also used in analysis of acceleration variability. Acceleration was calculated as the difference between two instantaneous speeds divided by the interval between images.
Cutter deflection angles, speeds, and accelerations were calculated in Microsoft Excel, while the obtained mean values were statistically analyzed in Statistica 13 software. The mean values of deflection angles and the significance of their differences were calculated using their relative values.
Rivets were numbered in line with the way of measuring distance and the adopted system of coordinates (Figure 4). A test for normality of distribution was followed by a test for the significance of differences for independent samples, with the alternative hypotheses being: H0—the difference between means is not statistically significant and H1—the difference between means is significant. If the significance level was p < 0.05, H0 was rejected and H1 was accepted, while at p > 0.05 H0 could not be rejected [25]. That test was performed to compare cutter deflection angles with respect to the guide bar raceway.

3. Results

Analysis of images acquired with a fast-speed digital camera confirmed the presence of marked discontinuities in the process of wood cutting with a portable gasoline chainsaw. It was also found that during chainsaw operation cutters were deflected from the guide bar raceway by different angles and that they transiently lost contact both with the guide bar and the workpiece.
Figure 6 shows sample frames of the films made. Figure 6a shows the cutter engaging with the wood. A deflection of the cutter is visible, whereby the heel of the cutter lost contact with the guide. The same cutter in Figure 6b reached its maximum penetration depth with the chip having maximum thickness. The cutter lost contact with the guide bar and the saw chain was away from the guide bar. In Figure 6c, the blade finished cutting. There were times when no cutter was engaged with the workpiece (Figure 6d). Analysis of the videos shows that cutting was intermittent. The cutters gradually penetrated the wood. After chip thickness reached the maximum value, it began to decline. Mean cutter deflection angles for the studied cases are given in Table 1.
Table 1 presents mean relative values of cutter deflection angles and their standard deviations. The mean cutter deflection angle during pine wood processing at a feed force of 20 N was −1.19° for a tight chain and 0.78° for a slack chain, with the difference being statistically significant (p = 0.000). The mean angle during pine wood processing at a feed force of 80 N was −0.2° for a tight chain and −0.15° for a slack chain, but the difference was not significant at p = 0.833.
In the case of cutting pine wood with a tight chain, significant differences (p = 0.003) in the cutter deflection angle were found between the two feed forces (−1.19° at 20 N vs. 0.2° at 80 N). The negative value of an angle indicates that the cutter toe was farther away from the guide bar than the cutter heel. Also, in the case of cutting pine wood with a slack chain, significant differences (p = 0.000) in the mean cutter deflection angle were found between the two feed forces (0.78° at 20 N vs. −0.15° at 80 N). Analysis of the maximum cutter deflection angles revealed higher values for the lower feed force at both tension settings (−9.1° and 5.88° for a tight and slack chain, respectively). The greatest cutter deflection angle variation was found in the case of cutting pine wood with a tight chain at a feed force of 20 N, with the standard deviation being 3.24°.
The mean cutter deflection angle during oak wood processing at a feed force of 20 N was −0.55° for the higher initial chain tension and 0.23° for the lower tension, with the difference being statistically significant (p = 0.002). The mean angle during oak wood processing at a feed force of 80 N was 0.01° for a tight chain and −0.41° for a slack chain, but the difference was not significant (p = 0.409).
In the case of cutting oak wood with a tight chain, no significant differences (p = 0. 052) in the mean cutter deflection angle were found between the two feed forces (−1.55° at 20 N vs. −0.01° at 80 N). In contrast, in the case of cutting oak wood with a slack chain, significant differences (p = 0.004) in the mean cutter deflection angle were found between the feed forces of 20 N (0.23°) and 80 N (−0.41°). The positive value of the mean deflection angle when cutting oak wood with a slack chain at a feed force of 80 N indicates that the cutter heel was on average further away from the guide, which is similar to the case of pine wood processing.
In the case of oak wood, the highest deflection angle variation was found for a tight chain at a feed force of 80 N, with the standard deviation being 2.41°.
At a feed force of 80 N, the mean deflection angles recorded for the two studied tree species did not differ significantly. Significant differences (p = 0.029) between pine and oak wood were found only in the case of a slack chain at a feed force of 20 N, with the respective mean cutter deflection angles being 0.78° and 0.23°. In both cases the deflection angles were positive, with very similar standard deviations (1.86° and 1.87°, respectively).
Analysis of means calculated from absolute cutter deflection angles (Table 2) shows the highest value for cutting pine wood with a tight chain at feed force of 20 N (2.55°), which is significantly greater than the deflection angles recorded for the other pine cutting cases (p = 0.000). In the case of cutting pine wood with a slack chain, there were no statistically significant differences in deflection angles with increasing feed force (p = 0.494). While cutting pine wood at a feed force of 20 N, initial chain tension did not significantly affect the cutter deflection angle (p = 0.405), which is in contrast to a feed force of 80 N where initial chain tension had a significant influence on that angle (p = 0083—the mean deflection angle for a slack chain was greater than that for a tight chain (1.43° vs. 1.18°)).
In the case of cutting oak wood, the absolute angles recorded for the various experimental setups were more similar to each other. At a feed force of 80 N, the absolute deflection angle changed with initial chain tension (p = 0.04): the angle was greater for a tight chain (1.88°) than for a slack chain (1.42°).
Table 3 presents a comparison of mean speeds with standard deviations for rivets 1 and 2 in the X axis as well as probability values for differences between rivet speeds in each experimental setup.
Rivet speeds in the X axis ranged from 18.87 m·s−1 to 22 m·s−1, with probability values from 0.27 to 0.97. In no case was a significant difference between the two rivet speeds observed, and so the two speeds were combined into one dataset for further analysis. However, it should be noted that standard deviations were always greater for rivet 1, which means that the rear part of the cutter exhibited greater speed variation in the X axis.
Table 4 contains minimum, maximum, and mean cutter speeds with standard deviations for the X axis after combining rivet 1 and 2 speeds into one dataset. Table 5 presents probability values for differences between the various experimental setups. The highest vx speeds were obtained for cutting pine wood at a feed force of 20 N, that is, 21.95 m·s−1 for a tight chain and 21.55 m·s−2 for a slack chain, with the difference not being statistically significant (p = 0.405). In the other pine wood cutting setups the differences were statistically significant. A lower mean cutter speed (20.05 m·s−1) was obtained for cutting pine wood with a slack chain at 80 N and the lowest speed for pine wood (18.94 m·s−1) was recorded for a tight chain at the same feed force, with the difference between the two chain tensions being statistically significant at p = 0.003. The calculated standard deviation values were similar, ranging from 3.71 m·s−1 to 4.91 m·s−1.
In the case of oak wood processing, the highest cutter speeds were obtained for a slack chain at a feed force of 80 N and for a tight chain at a feed force of 20 N (vx = 20.47 m·s−1 and vx = 20.43 m·s−1, respectively, with the difference not being significant at p = 0.939). In the case of cutting oak wood at a feed force of 80 N, statistically significant (p = 0.018) differences in cutter speed were found between different chain tension settings (20.47 m·s−1 for a slack chain vs. 19.25 m·s−1 for a tight chain). In the case of cutting oak wood with a tight chain, significant differences (p = 0.002389) in chain speed were found between the applied feed forces (21.95 m·s−1 at 20 N vs. 18.94 m·s−1 80 N), with standard deviation values being much higher for a slack chain (6.02–6.9 m·s−1) compared to a tight chain (4.08–4.21 m·s−1).
Table 6 presents mean speeds with standard deviations for rivets 1 and 2 in the Y axis, as well as probability values for the differences between their speeds in the various experimental setups. The recorded speed values in the Y axis ranged from 1.99 m·s−1 to 2.85 m·s−1, with probability values from 0.043 to 0.559. In the case of rivet speeds recorded for a slack chain at a feed force of 80 N and for a tight chain at a feed force of 20 N, the obtained p-values were below the adopted statistical significance level of p = 0.05. However, in both cases the calculated probability values were quite high and the differences between the adopted significance level and probability values were very small. According to recommendations taught on statistics courses, the final interpretation of statistical indicators is up to the researchers. Consequently, in light of the small differences between the mean speeds of the two rivets, and to facilitate further analysis, the differences were not deemed to be significant in this case either and so the results for the two rivets were combined into one dataset.
Table 7 presents minimum, maximum and mean rivet speeds with standard deviations in the Y axis (data for rivets 1 and 2 were combined into one dataset). Table 8 contains probability values for the differences between the various experimental setups.
As can be seen from Table 7, in the case of pine wood the processing cutter speeds in the Y axis were from 2.12 m·s−1 to 2.48 m·s−1. Probability values ranging from 0.135 to 0.806 indicate the absence of statistically significant differences between the various experimental setups. In the case of cutting oak wood with a slack chain, the highest cutter speed in the Y axis was found for a feed force of 80 N (2.58 m·s−1), which was significantly greater than the speed recorded for a feed force of 20 N (2.18 N, p = 0.023). In the case of cutting oak wood with a tight chain, the mean cutter speeds were 2.35 m·s−1 for a feed force of 20 N and 2.7 m·s−1 at a feed force of 80 N, with the difference not being statistically significant (p = 0.071). Standard deviations for all experimental setups were similar, ranging from 1.85 m·s−1 to 2.28 m·s−1.
Table 9 contains a comparison of mean accelerations with standard deviations for rivets 1 and 2 in the X axis, as well as probability values for differences between the accelerations of the two rivets in each experimental setup. The accelerations ranged from 45.59 m·s−2 to 118.02 m·s−2, with the highest values recorded for cutting pine wood with a slack chain at a feed force of 20 N, that is, 118.02 m·s−2 for rivet 1 and 100.75 cm·s−2 for rivet 2, with the difference not being statistically significant (p = 0.246).
It should be noted that higher accelerations were recorded for rivet 1. While the differences fell short of statistical significance in the case of pine wood processing, they were found to be significant for cutting oak wood with a slack chain at a feed force of 80 N and with a tight chain at a feed force of 20 N. In the case of a slack chain applied at a feed force of 80 N, the acceleration of rivet 1 in the X axis was 102.82 m·s−2 in contrast to 65.19 m·s−2 for rivet 2, with the difference being statistically significant (p = 0.048). In the case of a tight chain applied at a feed force of 20 N, the acceleration of rivet 1 was 72.12 m·s−2, being significantly higher than that of rivet 2 (53.38 m·s−2, p = 0.022).
Table 10 shows mean accelerations with standard deviations for cutter rivets 1 and 2 in the Y axis, as well as probability values for differences between those accelerations in the various experimental setups. Accelerations in the Y axis ranged from 18.31 m·s−2 to 30.37 m·s−2, with a significant difference between rivets 1 and 2 observed only in one case, that is, cutting oak wood with a slack chain at a feed force of 80 N (ay = 30.37 m·s−2 for rivet 2 vs. 23.94 m·s−2 for rivet 1, p = 0.012). In the other cases, p values were in the range of 0.306–0.905.
In the case of pine wood processing, no significant differences between the accelerations of rivets 1 and 2 were found either in the X or Y axis, which means that findings for the two rivets may be combined into one dataset. Let us now analyze differences between mean accelerations for the various experimental setups for pine wood processing.
Table 11 shows rivet accelerations and standard deviations for pine processing, while Table 12 and Table 13 present probability values for differences between the various pine wood cutting setups. The highest mean acceleration in the X axis (ax = 109.39 m·s−2) was found for a slack chain applied at a feed force of 20 N, as compared to only 52.54 m·s−2 for the same chain tension at a feed force of 80 N, with the difference being statistically significant (p = 0.000). When cutting pine wood with a tight chain, the higher feed force did not lead to a significant decrease in rivet accelerations in the X axis (p = 0.226). A comparison of chain tension settings at a given feed force revealed a significant difference in acceleration at a feed force of 20 N (109.39 m·s−2 for a slack chain vs. 75.13 m·s−2 for a tight chain, p = 0.001). The opposite was found at 80 N; in that case, a greater tension caused a significant increase in mean rivet acceleration from 52.54 m·s−2 for a slack chain to 65.99 m·s−2 for a tight chain (p = 0.013).
Analysis of accelerations in the Y axis revealed much lower values than in the X axis due to the considerably lower rivet speeds in the former case. In the Y axis, all acceleration values are similar, with the only statistically significant difference found for feed force when cutting with a slack chain: at the lower feed force (20 N) the mean acceleration in the Y axis was 25.18 m·s−2 compared to 19.83 m·s−2 for the higher feed force. The higher acceleration values may be attributable to the greater possible cutter deflections in a chain pressed with a lower feed force. In the case of a tight chain, feed force did not have an impact on rivet acceleration (p = 0.631).

4. Discussion

A comparison of the present findings with the available literature is difficult as very few studies have investigated the wood cutting process using a high-speed video camera. The present authors have found only two reports of the kind, one from 1967 [23] and the other one from 1973 [26]. However, at that time it was not possible to record and process images digitally and the cutting process was recorded on analog photographic film. In the 1973 study, the filming rate was 3000 fps at a chain speed of 15 m·s−1, but the acquired images were blurred. Since the blur was caused by an insufficient filming rate, the authors suggested that video analysis would be possible at different experimental parameters: a filming rate of 5000 fps with the chain speed reduced to 3000 m·s−1. The 1967 study involved a chainsaw powered by an electric motor, which behaves in the kerf differently from an identical chainsaw powered by a gasoline engine.
The discontinuities in the process of wood cutting with a chainsaw revealed by image analysis are consistent with the findings of other researchers [16,18]. The present results did not confirm the observation made by To, Doii, and Yokoyama in 1967 that the angle of cutter deflection decreases as chain tension increases. It was found that the absolute value of the deflection angle increases with increasing chain tension.
The differences in cutter deflection angles between different chain tension and feed force values may explain the effects of those factors on the cutting rate [18,20,27]. Researchers achieved lower capacities for a loose chain tension and lower feed force values.
It is difficult to explain why the mean cutter deflection angle diminished with decreasing chain tension and feed force: that requires further study and analyses. This could be attributable to the changing value of the cutting forces and changes in the vibration characteristics of the system.
In most instances, the mean deflection angle had a negative sign, which means that it was the toe of the cutter that was, on average, farther from the guide bar, with the heel remaining in contact with it. This may account for the fact that the cutter heel tends to wear faster due to friction against the guide bar when compared to the toe [20,28].
The differences in cutter deflection angles between tight and slack chains may also explain the different rates of cutter wear depending on chain tension, which were reported in another study [24].
Analysis of the obtained results confirmed the hypotheses that the initial chain tension and wood species affect cutter behavior only at low feed forces and that cutter behavior in the kerf is influenced by the feed force value. The speed values in the X axis recorded in this study are comparable to those reported by other researchers (from approx. 18 to approx. 21 m·s−1) [16,19,21]. The speed values for the Y axis and accelerations cannot be compared to any reference values due to the absence of known previous reports. Finally, it was found that a lower feed force leads to greater cutter deflections in the kerf plane, which was corroborated by the fact that cutter accelerations decreased with increasing feed force. In future research, it will be worth determining how this increased possibility of deflection affects the wear process of chainsaw blades. This is the next research goal of the authors. The obtained interactions in the case of high feed force are consistent with the theoretical assumptions. At high feed force, the link has little freedom of movement. When cutting with a feed force of 80 N, there are no significant statistical differences in the average angles of deflection of the links for both tested wood species and with different initial tension. This can be explained as follows: This is such a high value of feed force that it presses the links against the wood, stabilizing them and limiting the possibility of deflection. As a result, there are no significant differences after changing the initial tension. This studies process may have a different nature in the case of electric chainsaws as electric chainsaws have a different cutting link behavior, in which there are no interruptions in the cutting process. This requires further research.

5. Conclusions

  • In the process of pine wood cutting at low feed force, the absolute value of the mean cutter deflection angle increased with increasing initial chain tension. That phenomenon was not observed in the case of pine wood cutting at high feed force.
  • In the process of pine wood cutting, the absolute value of the mean cutter deflection angle decreased with increasing feed force for both initial chain tension values.
  • In the process of oak wood cutting at low feed force, the absolute value of the mean cutter deflection angle increased with increasing initial chain tension, as was the case with pine wood. Similarly, no significant differences in the mean cutter deflection angle were observed at high feed force. Thus, for both wood species, differences in the mean cutter deflection angle occurred only at low feed force.
  • In the case of a lower feed force, the absolute values of the mean cutter deflection angles were higher for pine wood compared to oak wood at both chain tension values. No significant differences in that respect were found between the two wood species at a higher feed force.
  • The speed and acceleration values recorded for the Y axis were much lower than those for the X axis. Mean cutter speeds in the X axis were 18.94–21.95 m·s−1 as compared to 2.12–2.58 m·s−1 in the Y axis.
  • Mean cutter accelerations ranged from 52.54 m·s−2 to 109.39 m·s−2 in the X axis and from 19.83 m·s−2 to 25.18 m·s−2 in the Y axis.
  • The rear part of the cutter was characterized by greater speed variation in the X axis.
  • In the case of cutting pine wood, no statistically significant differences in cutter speed in the X axis were found between the two chain tensions at a feed force of 20 N, while at a feed force of 80 N the speed recorded for a tight chain was significantly lower than that for a slack chain.
  • In the case of cutting oak wood at a feed force of 80 N, statistically significant differences in cutter speed were noted between different chain tensions in the X axis, with the speed for a slack chain being higher.
  • There were also statistically significant differences in cutter speed in the X axis when cutting oak wood with a tight chain at different feed forces (a higher speed was achieved at the lower feed force).
  • In the case of pine wood processing, no statistically significant differences in cutter speed in the Y axis were found between the various setups. On the other hand, in the case of oak wood, there was a difference between the two feed forces applied with a slack chain, with a higher speed recorded for the feed force of 80 N.
  • The greatest accelerations in the X axis were found for cutting pine wood with a slack chain at a feed force of 20 N. At the higher feed force (80 N) accelerations in the X axis significantly decreased by almost 50%.
  • When using tight chains, applying a higher feed force did not cause a statistically significant decrease in rivet acceleration in the X axis.

Author Contributions

Concept and research idea, M.K.-O. and A.M.; bibliography, M.K.-O.; methodology, A.M. and M.K.-O.; measurements at the cutting stand, M.K.-O. and A.M.; compilation of data, preparation of results, and statistical elaboration, M.K.-O. and A.M.; writing—original draft preparation, review, and editing M.K.-O. and A.M. All authors have read and agreed to the published version of the manuscript.

Funding

This research received no external funding.

Data Availability Statement

The original contributions presented in this study are included in the article. Further inquiries can be directed to the corresponding author(s).

Conflicts of Interest

The authors declare no conflicts of interest.

References

  1. Moskalik, T.; Borz, S.; Dvořák, J.; Ferenčík, M.; Glushkov, S.; Muiste, P.; Lazdiņš, A.; Styranivsky, O. Timber Harvesting Methods in Eastern European Countries: A Review. Croat. J. For. Eng. 2017, 38, 231–241. [Google Scholar]
  2. Karjalainen, T.; Zimmer, B.; Berg, S.; Welling, J.; Schwaiger, H.; Finér, L.; Cortijo, P.; Metsäntutkimuslaitos. Energy, Carbon and Other Material Flows in the Life Cycle Assessment of Forestry and Forest Products. Achievements of the Working Group 1 of the COST Action E9. Joensuu Eur. For. Inst. Discuss. Pap. 2001, 10, 1–67. [Google Scholar]
  3. Spinelli, R.; Magagnotti, N.; Nati, C. Options for the Mechanized Processing of Hardwood Trees in Mediterranean Forests. Int. J. For. Eng. 2009, 20, 39–44. [Google Scholar] [CrossRef]
  4. Montorselli, N.B.; Lombardini, C.; Magagnotti, N.; Marchi, E.; Neri, F.; Picchi, G.; Spinelli, R. Relating Safety, Productivity and Company Type for Motor-Manual Logging Operations in the Italian Alps. Accid. Anal. Prev. 2010, 42, 2013–2017. [Google Scholar] [CrossRef]
  5. Vusić, D.; Šušnjar, M.; Marchi, E.; Spina, R.; Zečić, Ž.; Picchio, R. Skidding Operations in Thinning and Shelterwood Cut of Mixed Stands—Work Productivity, Energy Inputs and Emissions. Ecol. Eng. 2013, 61, 216–223. [Google Scholar] [CrossRef]
  6. Lindroos, O.; Burström, L. Accident Rates and Types among Self-Employed Private Forest Owners. Accid. Anal. Prev. 2010, 42, 1729–1735. [Google Scholar] [CrossRef]
  7. Ashby, R.J.P.; Tim, A.; Bentley, L., Jr. Human Factors Testing in the Forest Industry. In Handbook of Human Factors Testing and Evaluation; CRC Press: Boca Raton, FL, USA, 2001; ISBN 978-1-00-300081-5. [Google Scholar]
  8. Melemez, K.; Tunay, M. Determining physical workload of chainsaw operators working in forest harvesting. Technology 2010, 13, 237–243. [Google Scholar]
  9. Eroglu, H.; Yilmaz, R.; Kayacan, Y. A Study on Determining the Physical Workload of the Forest Harvesting and Nursery-Afforestation Workers. Anthropologist 2015, 21, 168–181. [Google Scholar] [CrossRef]
  10. Poje, A.; Potočnik, I.; Košir, B.; Krč, J. Cutting Patterns as a Predictor of the Odds of Accident among Professional Fellers. Saf. Sci. 2016, 89, 158–166. [Google Scholar] [CrossRef]
  11. Rottensteiner, C.; Tsioras, P.; Stampfer, K. Wood Density Impact on Hand-Arm Vibration. Croat. J. For. Eng. J. Theory Appl. For. Eng. 2012, 33, 303–312. [Google Scholar]
  12. Fonseca, A.; Aghazadeh, F.; de Hoop, C.; Ikuma, L.; Al-Qaisi, S. Effect of Noise Emitted by Forestry Equipment on Workers’ Hearing Capacity. Int. J. Ind. Ergon. 2015, 46, 105–112. [Google Scholar] [CrossRef]
  13. Marenče, J.; Mihelič, M.; Poje, A. Influence of Chain Filing, Tree Species and Chain Type on Cross Cutting Efficiency and Health Risk. Forests 2017, 8, 464. [Google Scholar] [CrossRef]
  14. Dado, M.; Kučera, M.; Salva, J.; Hnilica, R.; Hýrošová, T. Influence of Saw Chain Type and Wood Species on the Mass Concentration of Airborne Wood Dust during Cross-Cutting. Forests 2022, 13, 2009. [Google Scholar] [CrossRef]
  15. Nordfjell, T.; Björheden, R.; Thor, M.; Wästerlund, I. Changes in Technical Performance, Mechanical Availability and Prices of Machines Used in Forest Operations in Sweden from 1985 to 2010. Scand. J. For. Res. 2010, 25, 382–389. [Google Scholar] [CrossRef]
  16. Maciak, A.; Kubuśka, M.; Moskalik, T. Instantaneous Cutting Force Variability in Chainsaws. Forests 2018, 9, 660. [Google Scholar] [CrossRef]
  17. Górski, J. Wood Cutting by Means of Electric Chain Saw; Treatises and Monographs; Wydawnictwo SGGW: Warsaw, Poland, 2001; Volume 241, ISBN 83-7244-205-3. [Google Scholar]
  18. Maciak, A. Treatises and Monographs. The Impact of Structural and Operational Factors on the Process and Performance of Wood Cutting Wit Use of Petrol Chain Saw; Publications of Warsaw University of Life Sciences—SGGW: Warsaw, Poland, 2013; Volume 410, ISBN 978-83-7583-421-5. [Google Scholar]
  19. Kiepuszewski, B.; Legutko, S.; Wieczorkowski, K. Metal Cutting; Wydawnictwo Politechniki Poznańskiej: Poznań, Poland, 1980. [Google Scholar]
  20. Górski, J. An attempt to theoretical description of the process of sawing wood with a chainsaw. Przegląd Tech. Rol. I Leśnej 1995, 6, 13–15. [Google Scholar]
  21. Maciak, A. Influence of Construction Parameters of Chain Saw Cutters on Wood Cutting Efficiency; Warsaw University of Life Sciences—SGGW: Warsaw, Poland, 2001. [Google Scholar]
  22. Andrew, O.; John, P. Velocity, Depth-of-Cut, and Physical Property Effects on Saw Chain Cutting. BioResources 2015, 10, 7273–7291. [Google Scholar] [CrossRef]
  23. To, T.; Doi, O.; Yokoyama, M. Cutting Behaviors of Saw Chain (Part 1); Kitami Institute of Technology Repository, Kitami Institute of Technology: Kitami, Japan, 1967. [Google Scholar]
  24. Maciak, A.; Kubuśka, M.; Młodzińska, E. Impact of Saw Chain Cutters Type on Cutting Efficiency and Fuel Consumption in Timber Cutting. Ann. Wars. Univ. Life Sci.—SGGW Agric. 2017, 69, 71–77. [Google Scholar] [CrossRef]
  25. Wątroba, J. Supporting Statistical Analysis of Empirical Research Results in the Statistica Program Teaching Materials StatSoft Polska; StatSoft: Kraków, Poland, 2009. [Google Scholar]
  26. Botwin, M.; Ciesielczuk, P.; Sztyber, J. Trial applications of high-speed video recording for studying some machines used in forestry. Zesz. Probl. Postępów Nauk Rol. 1973, 148, 45–54. [Google Scholar]
  27. Stempski, W.; Grodecki, J. The influence of the sharpening angle of cutting links on cutting efficiency and durability of chain saws. Poznańskie Tow. Przyj. L Nauk. Pr. Kom. Nauk Rol. I Leśnych 1998, 86, 73–82. [Google Scholar]
  28. Więsik, J. Energy of cutting of wood with a chainsaw. Rocz. Nauk Rol. 1990, t. 78-C-1, 144–156. [Google Scholar]
Figure 1. Variants of cutting parameters examined in the present study.
Forests 16 00859 g001
Figure 2. Chain tensioning measurement.
Forests 16 00859 g002
Figure 3. Experimental stand: (a)—side view, (b)—top view, 1—chainsaw, 2—chainsaw mount, 3—wooden workpiece, 4—vise, 5—slider, 6—guide rolls, 7—weight, 8—camera, 9—spotlights.
Forests 16 00859 g003
Figure 4. Measuring the distance between rivets and guide bar raceway.
Forests 16 00859 g004
Figure 5. Determination of the angle of cutter deflection from the guide bar raceway: (a)—positive value of the angle α, (b)—negative value of the angle α; 1—first rivet, 2—second rivet, 3—guide bar raceway (assumed to be a straight line), 4—cutter body, l—distance between rivet axes, α—angle between the line connecting the rivet axes and a line parallel to the guide bar raceway, Δ—cutter deflection in the plane of the guide bar.
Forests 16 00859 g005
Figure 6. Sample frames of the films: (a) the cutter engaging with the wood), (b) maximum penetration depth, (c) the blade finished cutting, and (d) no cutter is engaged with the workpiece.
Forests 16 00859 g006
Table 1. Mean cutter deflection angles with standard deviations.
Initial Chain TensionFeed Force [N]Mean Deflection Angle [°]Min
[°]
Max
[°]
Standard Deviation [°]
Oak wood
Slack200.23−4.694.661.87
80−0.41−5.343.991.78
Tight20−0.55−5.993.911.98
800.01−6.685.332.41
Pine wood
Slack200.78−3.915.881.86
80−0.15−4.814.321.87
Tight20−1.19−9.103.913.24
80−0.20−3.923.911.53
Table 2. Mean cutter deflection angles calculated from absolute angle values.
Initial Chain TensionFeed Force [N]Mean Deflection Angle [°]Min
[°]
Max
[°]
Standard Deviation [°]
Oak wood
Slack201.520.004.691.11
801.420.005.341.13
Tight201.590.005.991.29
801.880.006.681.49
Pine wood
Slack201.550.005.881.29
801.430.004.811.21
Tight202.550.009.102.32
801.180.003.920.99
Table 3. Mean speeds and standard deviations for cutter rivets 1 and 2, and probability values.
Initial Chain
Tension
Feed Force
[N]
Speed
vx Rivet 1
[m·s−1]
Speed
vx Rivet 2
[m·s−1]
Probability Value p for Differences Between Rivet SpeedsStandard Deviation vx Rivet 1
[m·s−1]
Standard Deviation
vx Rivet 2
[m·s−1]
Oak wood
Slack2020.4219.580.2727.613.84
8020.8620.10.3598.634.62
Tight2020.5720.30.6034.573.53
8019.4619.040.4474.44.02
Pine wood
Slack2021.5421.560.9735.604.14
8020.0820.030.9124.392.91
Tight202221.900.8704.752.85
8018.8719.020.7754.493.64
Table 4. Mean cutter speeds with standard deviations and speed ranges in the X axis.
Initial Chain TensionFeed Force [N]Mean Speed
vx [m·s−1 ]
Min
[m·s−1]
Max
[m·s−1]
Standard Deviation
[m·s−1]
Oak wood
Slack2019.995.1388.586.02
8020.473.1791.56.90
Tight2020.431.133.674.08
8019.250.4637.054.21
Pine wood
Slack2021.555.6735.254.91
8020.059.0935.243.71
Tight2021.951.1451.63.88
8018.945.6840.924.08
Table 5. Probability values for differences between cutter speeds in the X axis for the various setups.
Oak, Slack Chain, 20 NOak, Slack Chain, 80 NOak, Tight Chain, 20 NOak, Tight Chain, 80 NPine, Slack Chain, 20 NPine, Slack Chain, 80 NPine, Tight Chain, 20 NPine, Tight Chain, 80 N
Oak, slack chain, 20 N10.3980.3560.1190.0060.8960.0000.029
Oak, slack chain, 80 N0.39810.9390.0190.0810.4130.0080.003
Oak, tight chain, 20 N0.3560.93910.0020.0150.3020.0000.000
Oak, tight chain, 80 N0.1190.0180.00210.0000.0310.0000.426
Pine, slack chain, 20 N0.0060.0810.0150.00010.0000.4052270.000
Pine, slack chain, 80 N0.8960.4130.3020.0310.00010.0000.003
Pine, tight chain, 20 N0.0000.0080.0000.0000.4050.00010.000
Pine, tight chain, 80 N0.0290.0040.0000.4260.0000.0030.0001
Table 6. Mean speeds with standard deviations for cutter rivets 1 and 2, and probability values for differences between the two rivets in the Y axis.
Initial Chain TensionFeed Force [N]Speed
vy Rivet 1
[m·s−1]
Speed
vy Rivet 2 [m·s−1]
Probability Value p for Differences Between Rivet SpeedsStandard deviation
vx Rivet 1
[m·s−1]
Standard Deviation
vx Rivet 2
[m·s−1]
Oak wood
Slack202.362.010.1392.041.69
802.322.850.0431.972.36
Tight202.622.110.0481.931.93
802.622.790.5592.082.25
Pine wood
Slack202.372.590.4932.252.30
801.992.240.3301.811.88
Tight202.652.250.1652.161.88
802.502.290.4372.042.18
Table 7. Mean cutter speeds with standard deviations and speed ranges in the Y axis.
Initial Chain TensionFeed Force [N]Mean Speed vy [m·s−1]Min
[m·s−1]
Max
[m·s−1]
Standard Deviation
[m·s−1]
Oak wood
Slack202.180.009.761.88
802.580.0011.042.19
Tight202.350.008.361.94
802.700.009.772.17
Pine wood
Slack202.480.0010.912.28
802.120.0010.921.85
Tight202.440.009.552.03
802.400.009.572.11
Table 8. Probability values for differences between cutter speeds in the Y axis.
Oak, Slack Chain, 20 NOak, Slack Chain, 80 NOak, Tight Chain, 20 NOak, Tight Chain, 80 NPine, Slack Chain, 20 NPine, Slack Chain, 80 NPine, Tight Chain, 20 NPine, Tight Chain, 80 N
Oak, slack chain, 20 N10.0240.3290.0040.1270.6930.1530.238
Oak, slack chain, 80 N0.02410.2160.5380.6240.0110.4870.330
Oak, tight chain, 20 N0.3290.21610.0700.5320.1870.6290.818
Oak, tight chain, 80 N0.0040.5380.07010.3070.0020.2090.126
Pine, slack chain, 20 N0.1270.6240.5320.30710.0720.8710.691
Pine, slack chain, 80 N0.6930.0110.1870.0020.07210.0820.135
Pine, tight chain, 20 N0.1530.4870.6290.2090.8710.08210.806
Pine, tight chain, 80 N0.2380.3300.8180.1260.6910.1350.8061
Table 9. Mean accelerations with standard deviations for cutter rivets 1 and 2 and probability values for differences between accelerations of the two rivets in the X axis.
Initial Chain TensionFeed Force [N]Acceleration ax Rivet 1 [m·s−2]Acceleration ax Rivet 2 [m·s−2]Probability Value p for Differences Between AccelerationsStandard Deviation
vx Rivet 1 [m·s−2]
Standard Deviation
vx Rivet 2 [m·s−2]
Oak wood
Slack2082.6861.270.109135.7869.13
80102.8265.190.0048142.8066.90
Tight2072.1253.380.02260.5561.91
8071.55661.860.25968.0863.96
Pine wood
Slack20118.02100.750.246102.07104.49
8059.4845.590.06556.8339.48
Tight2083.1467.120.213106.6373.39
8068.9363.040.48764.0563.66
Table 10. Mean accelerations with standard deviations for cutter rivets 1 and 2 and probability values for differences in accelerations between the rivets in the Y axis.
Initial Chain TensionFeed Force [N]ay Rivet 1 [m·s−2]ay Rivet 2 [m·s−2]Probability Value p for Differences Between AccelerationsStandard Deviation
vx Rivet 1 [m·s−2]
Standard Deviation
vx Rivet 2 [m·s−2]
Oak wood
Slack2020.1118.310.44418.0719.92
8023.9430.370.01220.2922.65
Tight2024.5021.870.30619.3719.33
8023.3324.190.77921.6625.02
Pine wood
Slack2024.6525.720.73323.3420.05
8020.1319.540.80618.6417.47
Tight2023.2723.590.90519.4619.73
8021.4323.560.44217.8223.53
Table 11. Mean cutter accelerations with standard deviations and acceleration ranges for pine wood cutting.
Initial Chain TensionFeed Force
[N]
Mean Acceleration
[m·s−2]
Min
[m·s−2]
Max
[m·s−2]
Standard Deviation
[m·s−2]
Acceleration in the X axis
Slack20109.390.00358.44103.38
8052.540.00259.2049.31
Tight2075.130.00619.2091.65
8065.990.00313.8063.78
Acceleration in the Y axis
Slack2025.180.00112.2021.71
8019.830.0098.2118.03
Tight2023.430.0098.1919.54
8022.490.0099.3020.85
Table 12. Probability values for differences between accelerations in the X axis for pine wood setups.
Slack Chain, 20 NSlack Chain, 80 NTight Chain, 20 NTight Chain, 80 N
Slack chain, 20 N10.0000.0000.000
Slack chain, 80 N0.00010.0010.013
Tight chain, 20 N0.0000.00110.226
Tight chain, 80 N0.0000.0120.2261
Table 13. Probability values for differences between accelerations in the Y axis for pine wood setups.
Slack Chain, 20 NSlack Chain, 80 NTight Chain, 20 NTight Chain, 80 N
Slack chain, 20 N10.0060.3970.196
Slack chain, 80 N0.00610.0500.148
Tight chain, 20 N0.3970.05010.631
Tight chain, 80 N0.1960.1480.6311
Disclaimer/Publisher’s Note: The statements, opinions and data contained in all publications are solely those of the individual author(s) and contributor(s) and not of MDPI and/or the editor(s). MDPI and/or the editor(s) disclaim responsibility for any injury to people or property resulting from any ideas, methods, instructions or products referred to in the content.

