
Non-Destructive Methods for Diagnosing Surface-Fire-Damaged Pinus densiflora and Quercus variabilis

 , ,
, ,
Abstract
1. Introduction
2. Materials and Methods
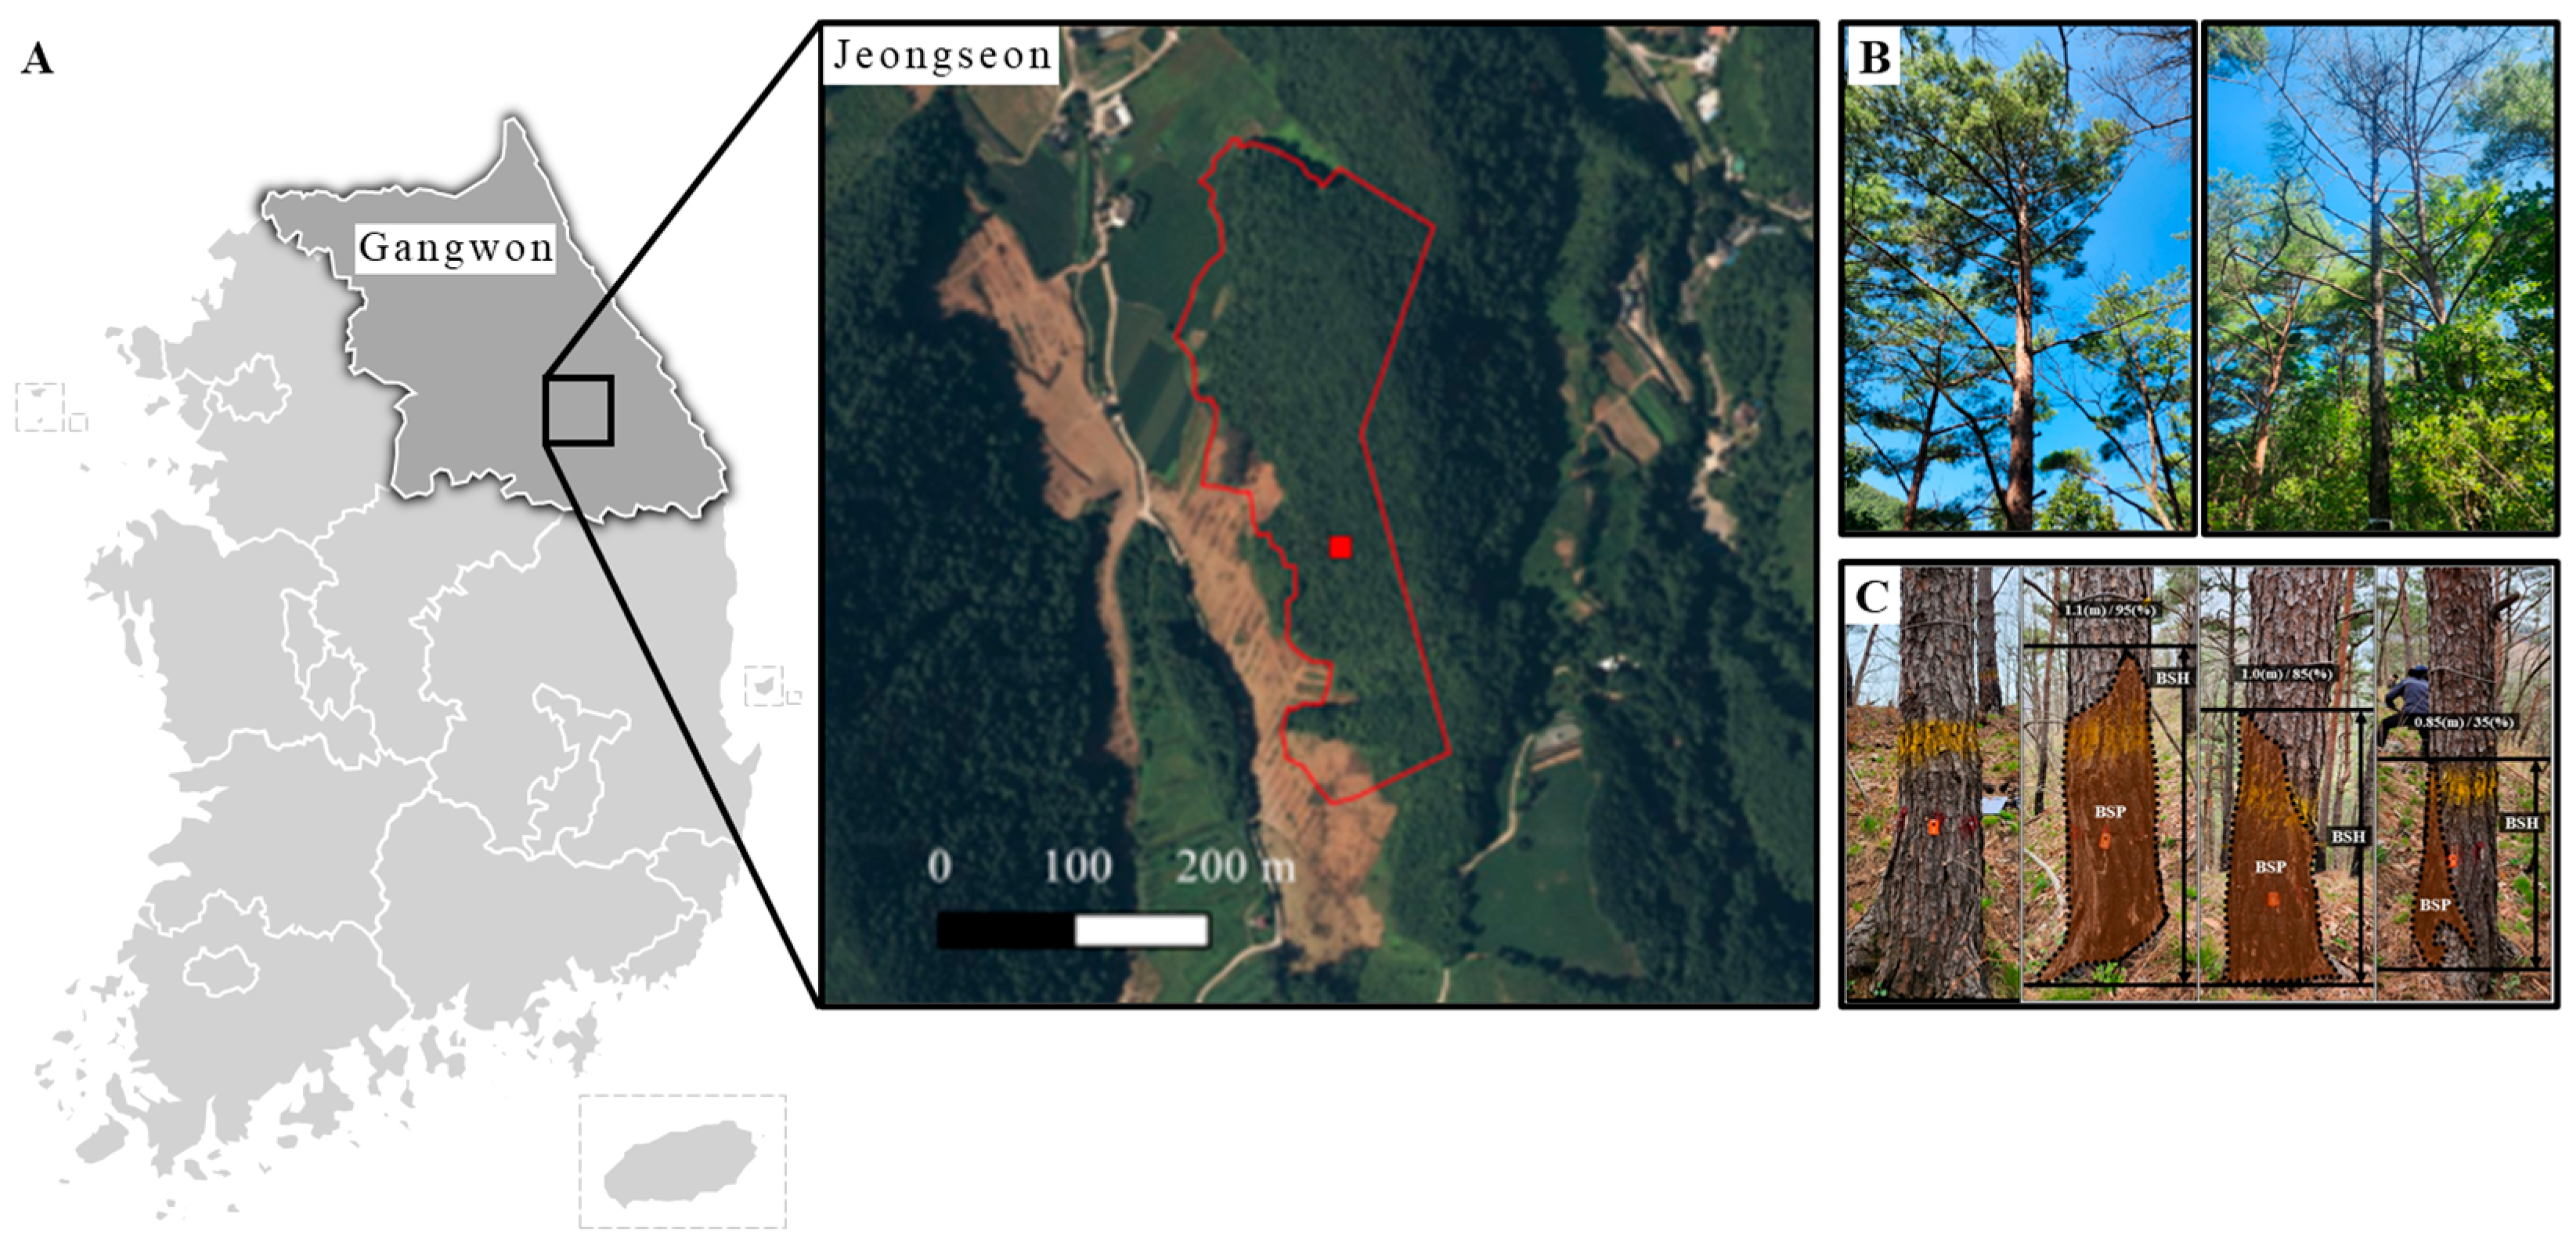
2.1. Study Site
2.2. External Morphological Characteristics
2.3. Trunk Internal Damage Diagnosis
2.4. Canopy Physiological Responses
2.5. Statistical Analysis
3. Results
3.1. Observed External Morphological Features
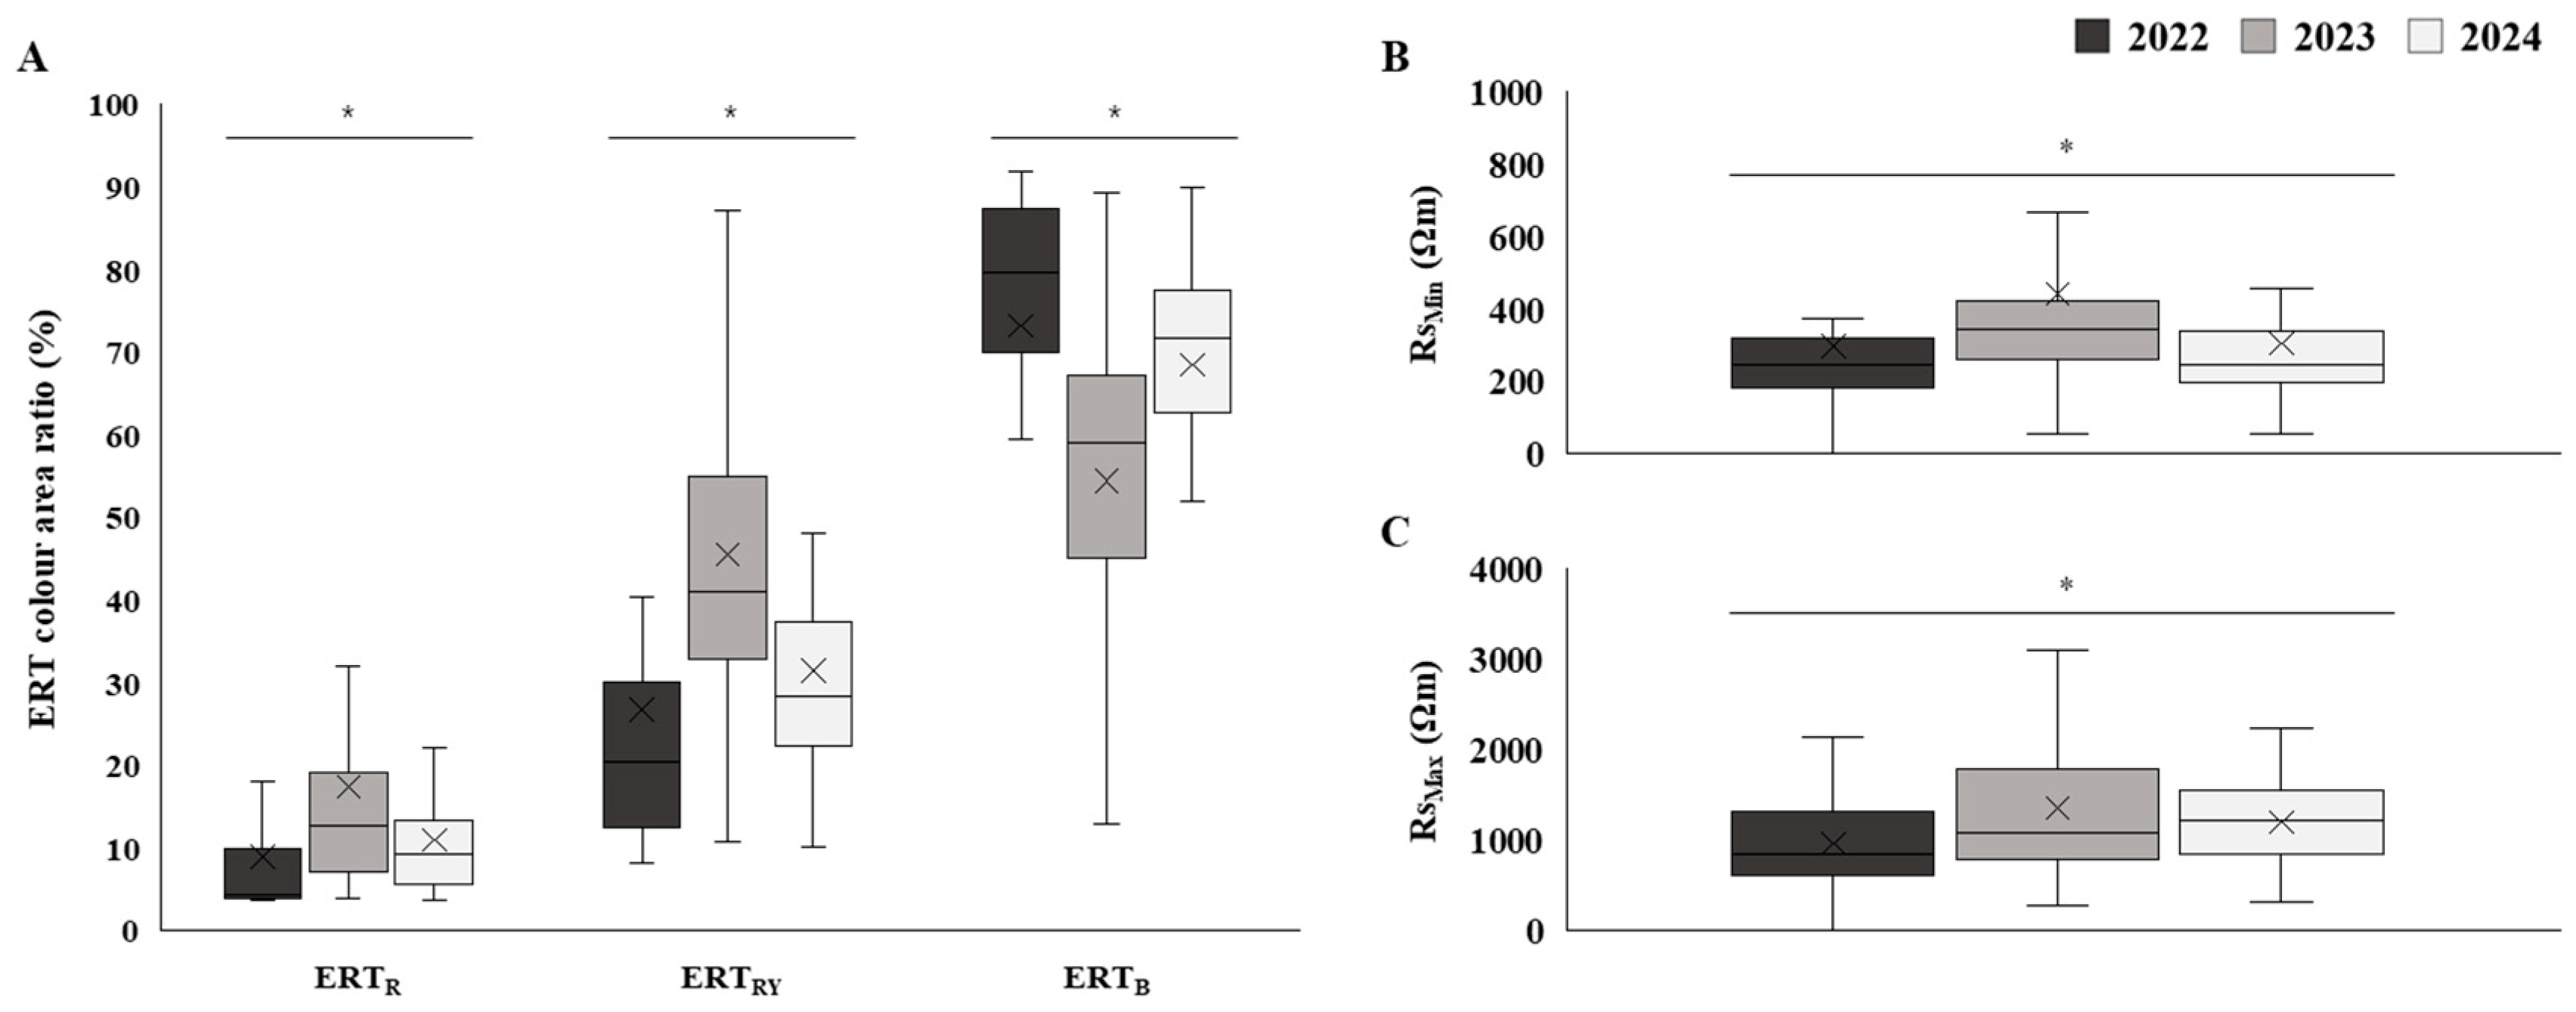
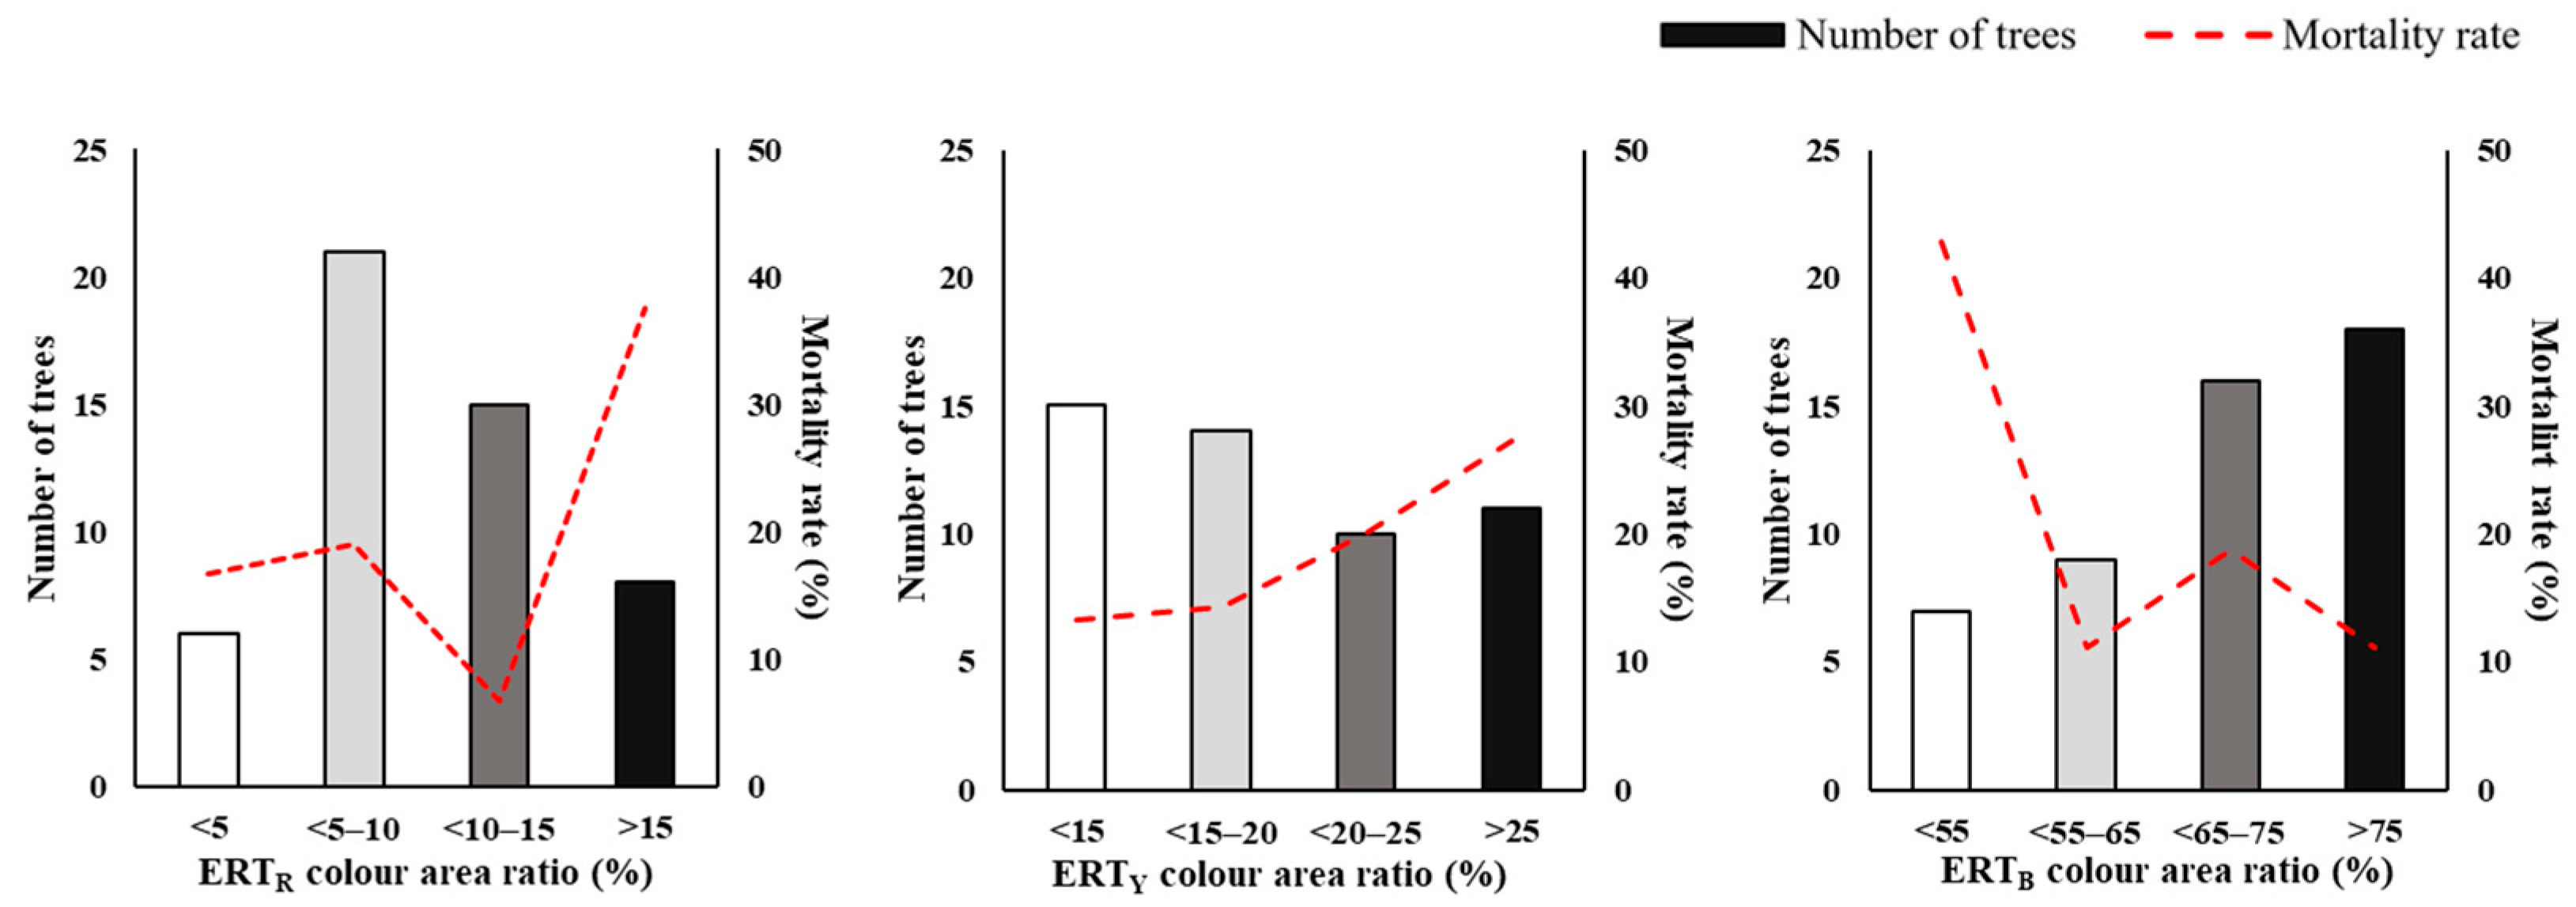
3.2. Assessment of Trunk Internal Damage
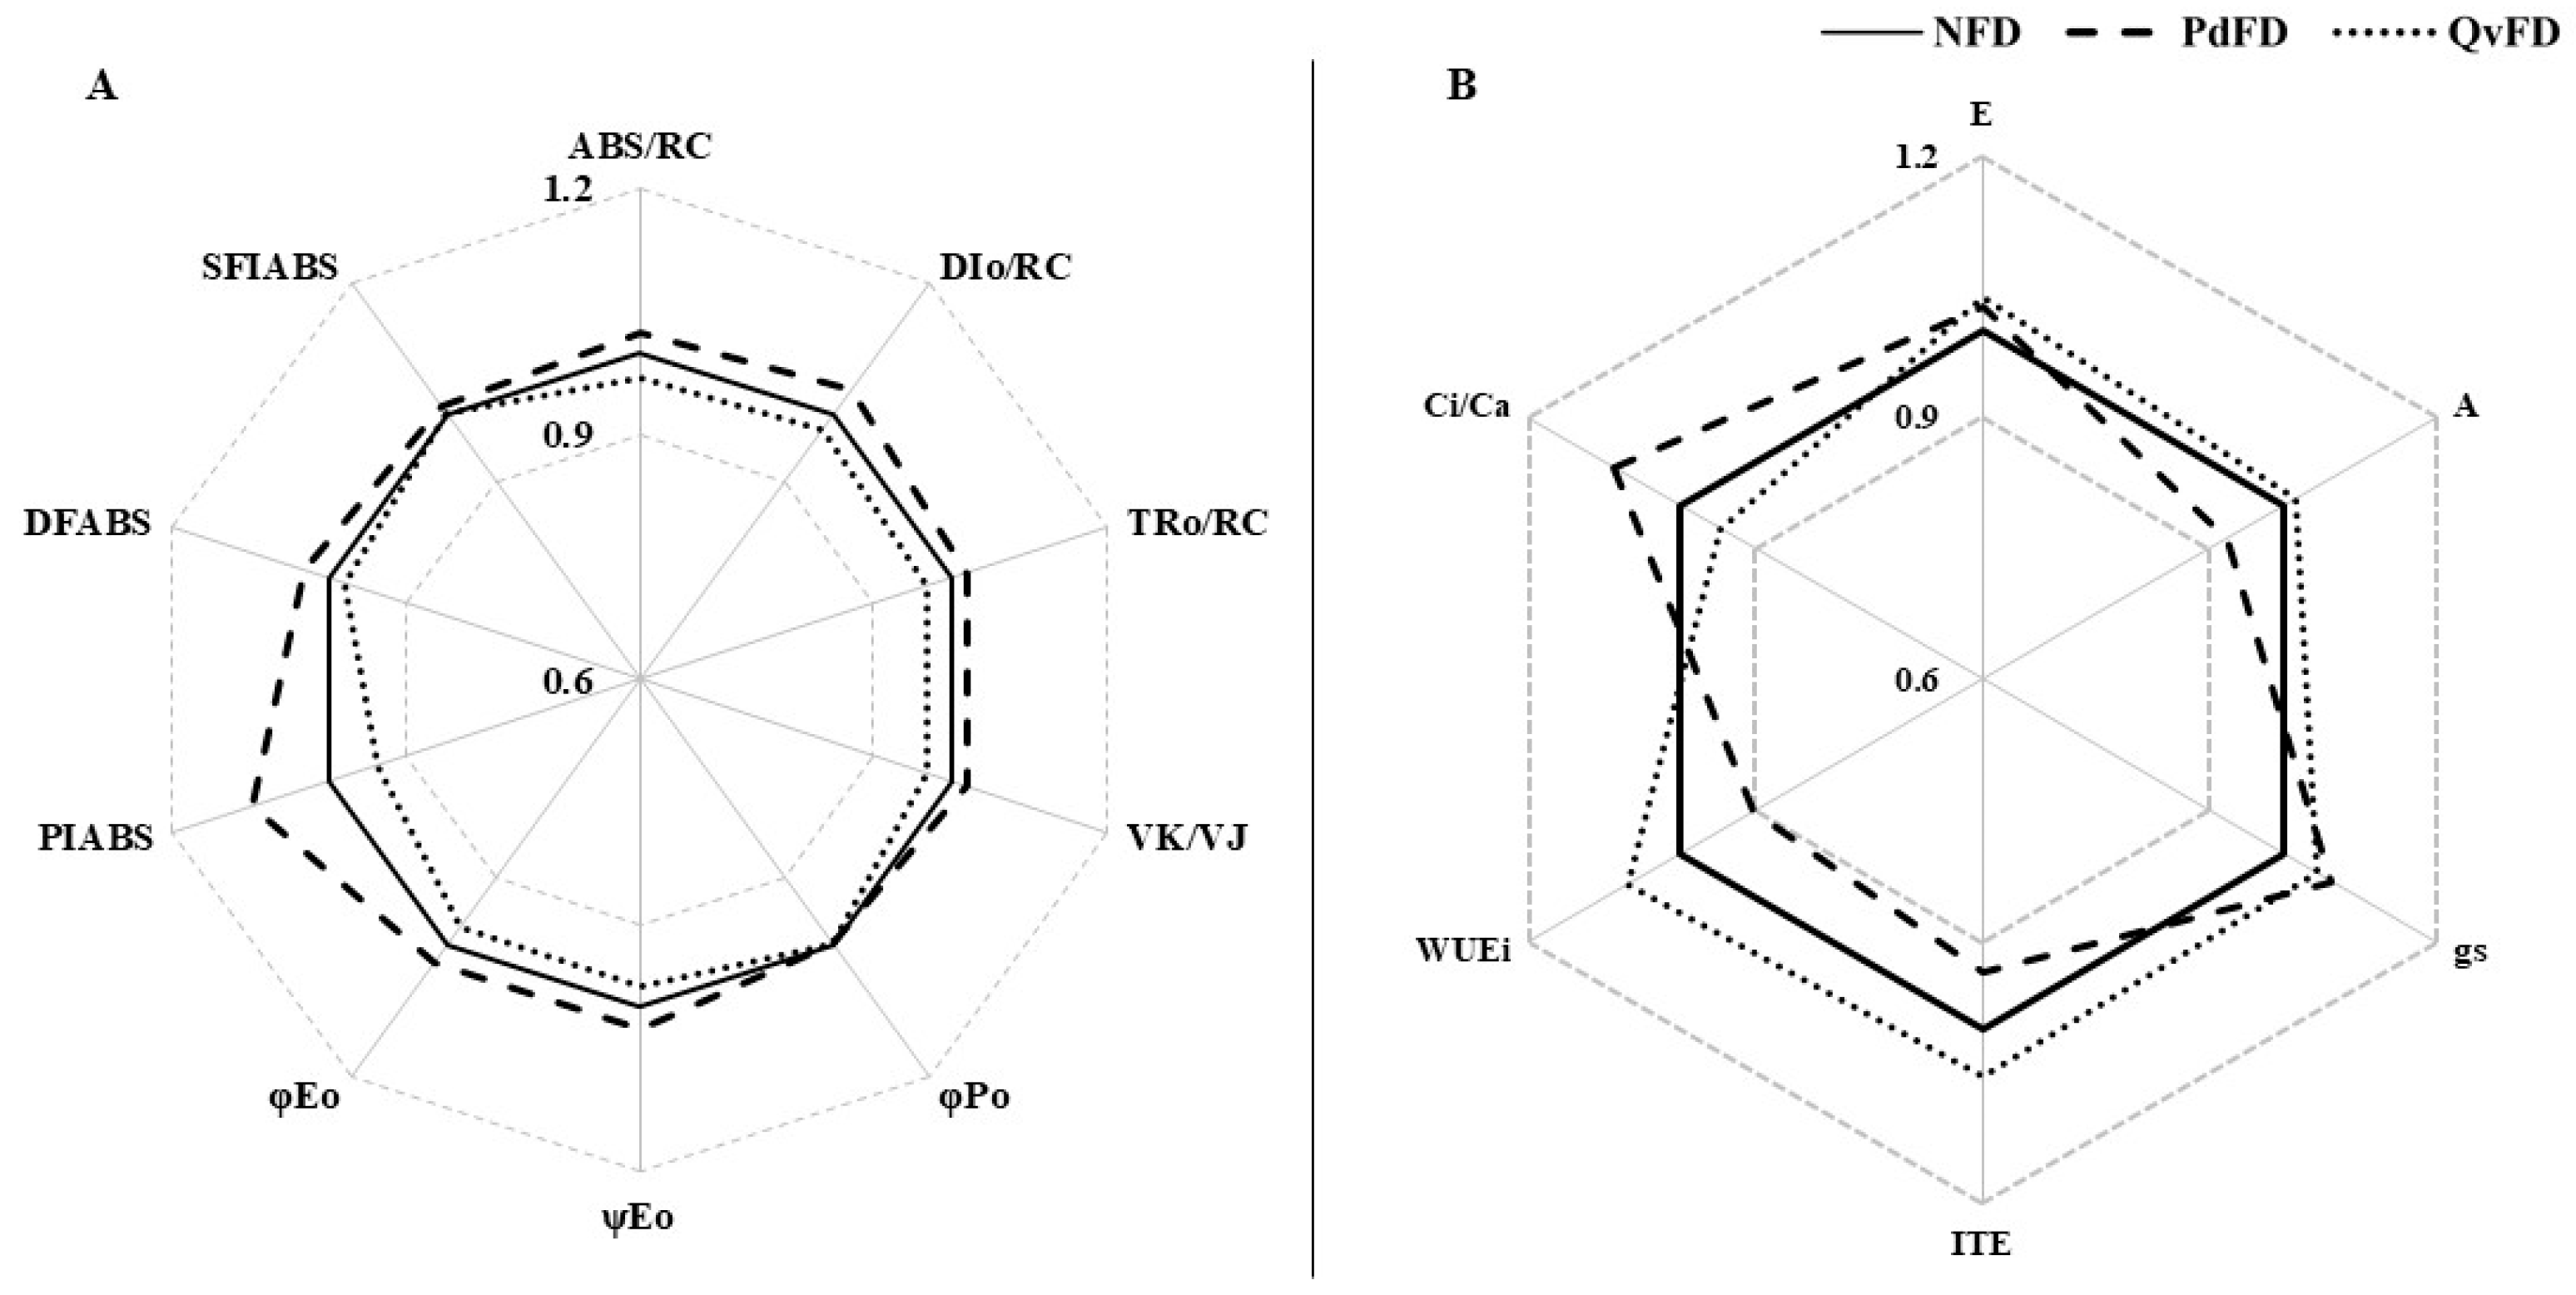
3.3. Physiological Characteristics of the Canopy Layer
3.4. Cross-Species Comparison of Fire Damage Indicators
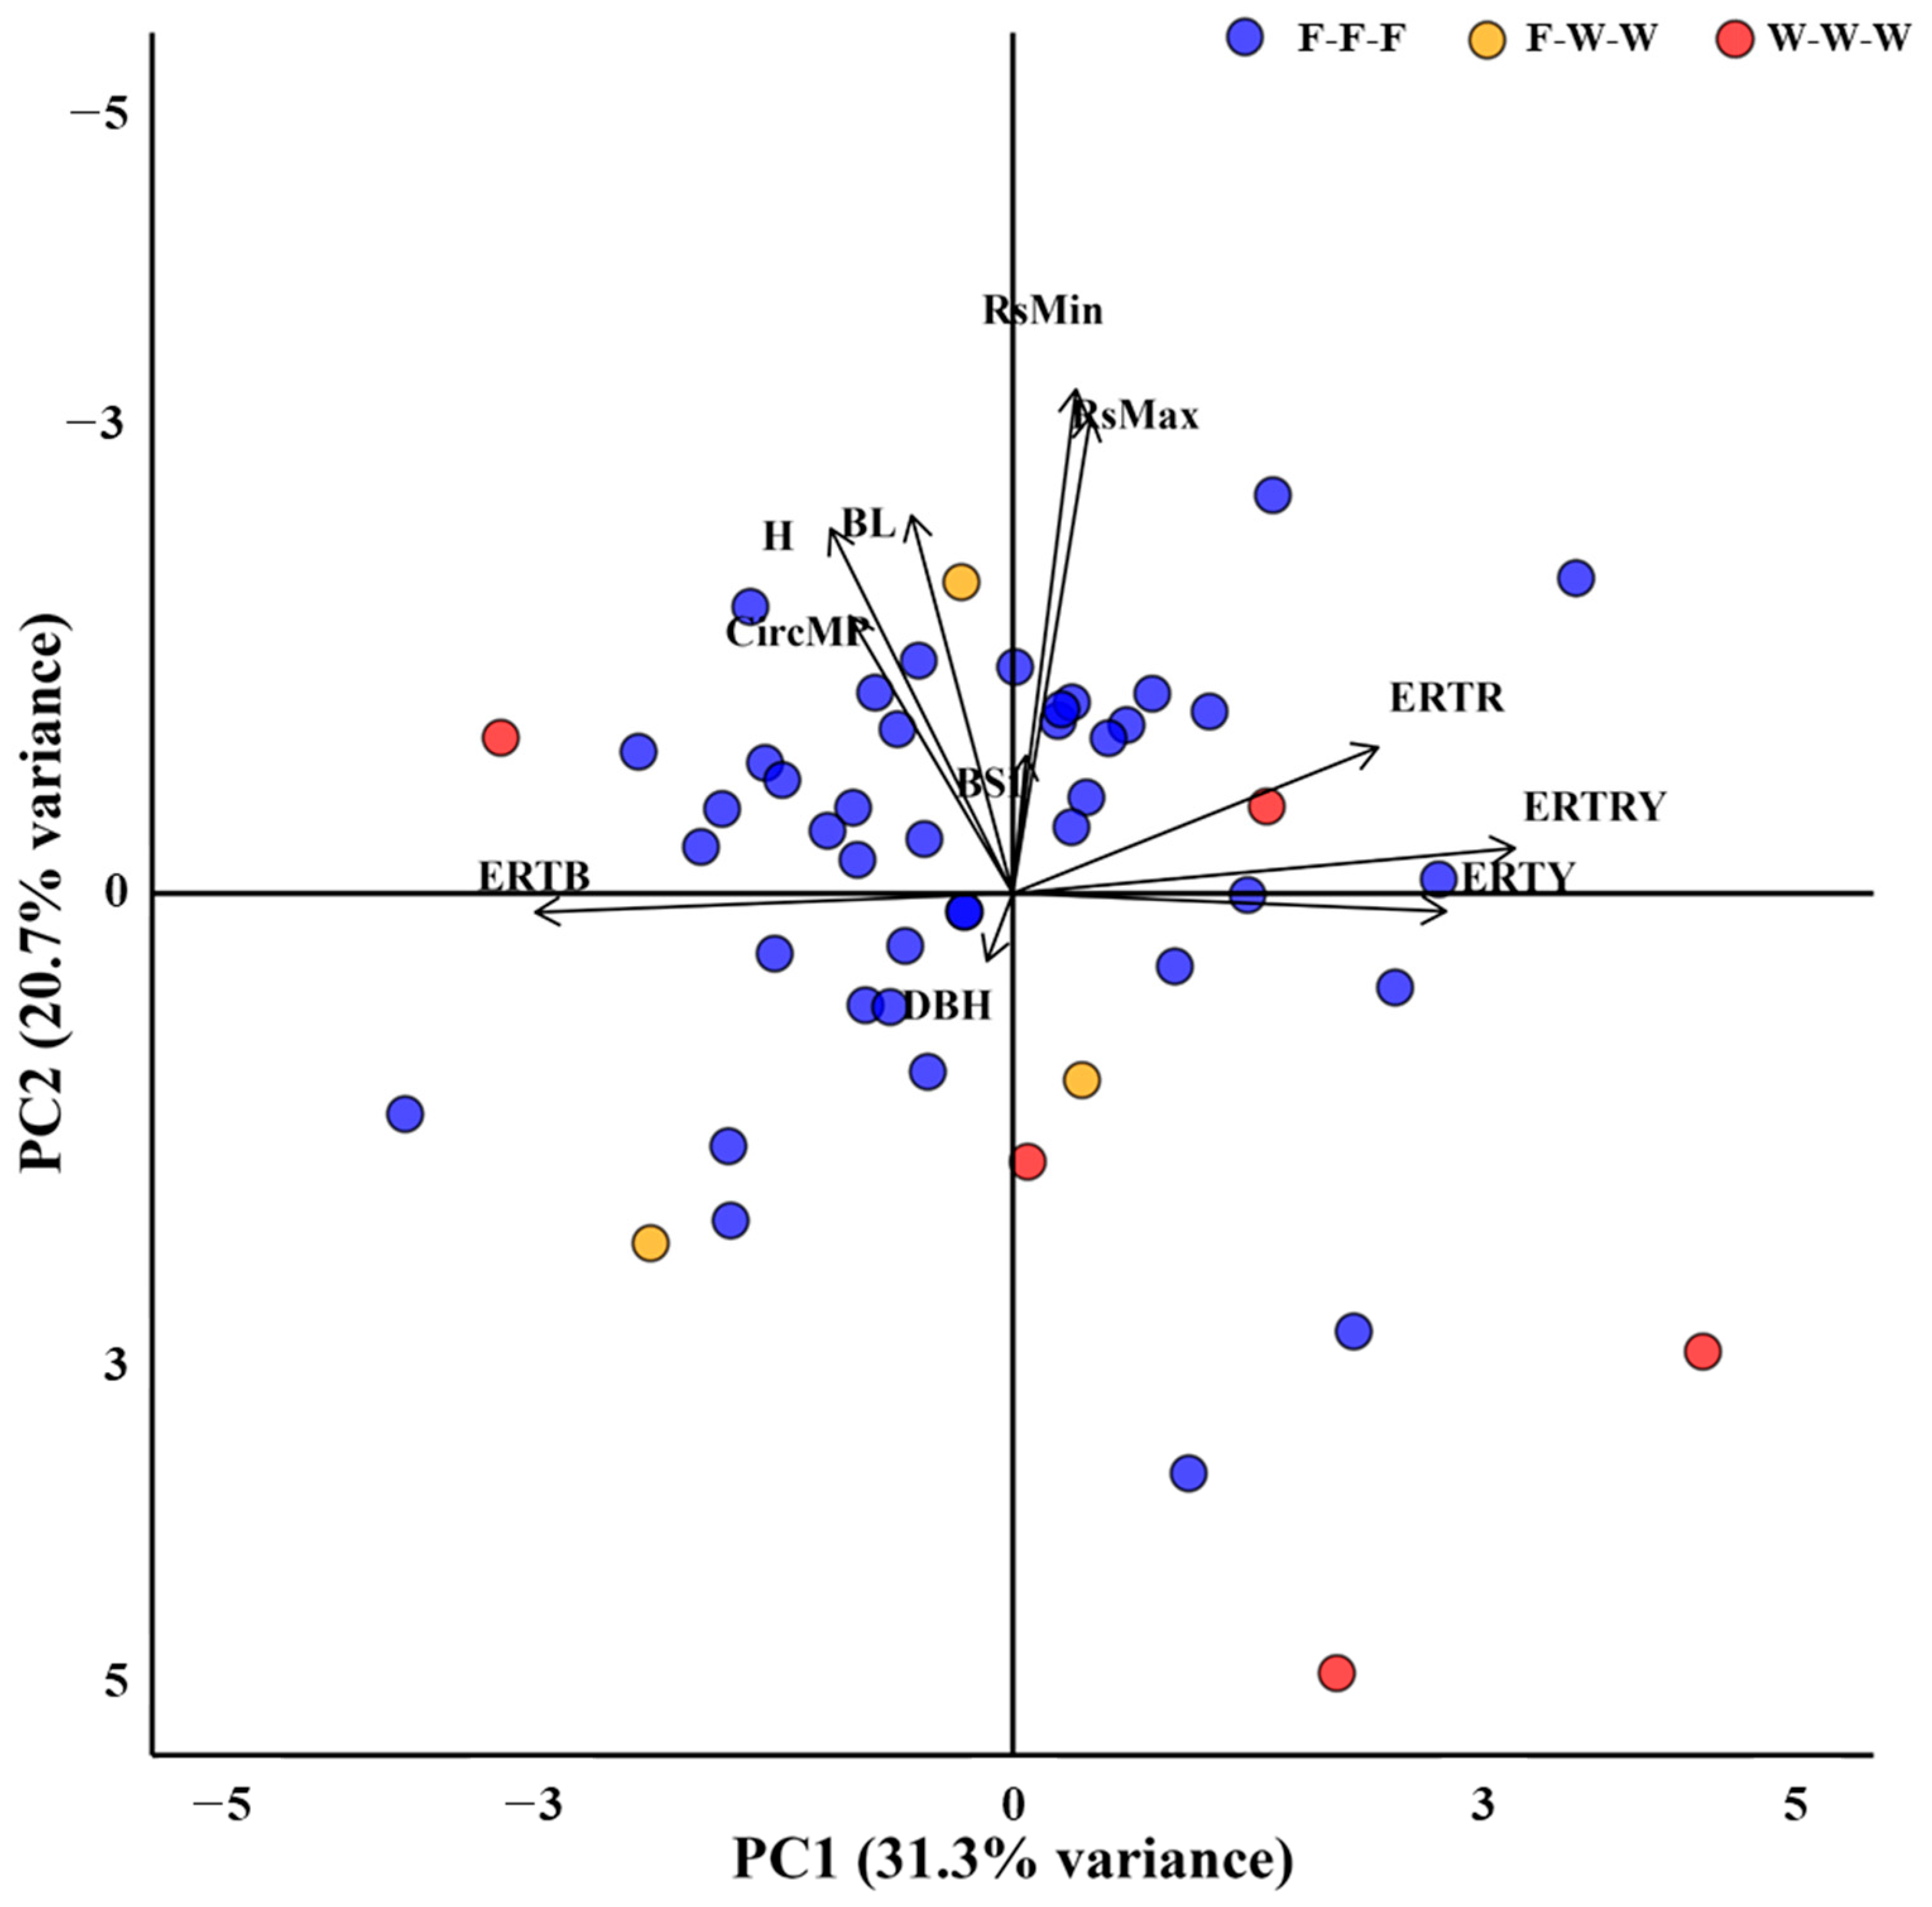
3.5. Results of Principal Component Analysis (PCA)
4. Discussion
4.1. Interpretation of Morphological Changes
4.2. Insights from Trunk Damage Diagnosis
4.3. The Physiological Responses of the Canopy Layer
4.4. Implication from Principal Component Analysis (PCA)
5. Conclusions
Author Contributions
Funding
Data Availability Statement
Conflicts of Interest
References
- Korea Forest Service. Wildfire Statistical Annual Report, Korea; Korea Forest Service: Daejeon, Republic of Korea, 2024. [Google Scholar]
- Sedano, F.; Randerson, J. Multi-scale influence of vapor pressure deficit on fire ignition and spread in boreal forest ecosystems. Biogeosciences 2014, 11, 3739–3755. [Google Scholar] [CrossRef]
- Seager, R.; Hoerling, M.; Schubert, S.; Wang, H.; Lyon, B.; Kumar, A.; Nakamura, J.; Henderson, N. Causes of the 2011–14 California drought. J. Clim. 2015, 28, 6997–7024. [Google Scholar] [CrossRef]
- Brotons, L.; Aquilué, N.; De Cáceres, M.; Fortin, M.J.; Fall, A. How fire history, fire suppression practices and climate change affect wildfire regimes in Mediterranean landscapes. PLoS ONE 2013, 8, e62392. [Google Scholar] [CrossRef] [PubMed]
- Hurteau, M.D.; Bradford, J.B.; Fulé, P.Z.; Taylor, A.H.; Martin, K.L. Climate change, fire management, and ecological services in the southwestern US. For. Ecol. Manag. 2014, 327, 280–289. [Google Scholar] [CrossRef]
- De la Barrera, F.; Barraza, F.; Favier, P.; Ruiz, V.; Quense, J. Megafires in Chile 2017: Monitoring multiscale environmental impacts of burned ecosystems. Sci. Total Environ. 2018, 637, 1526–1536. [Google Scholar] [CrossRef]
- Sung, M.K.; Lim, G.H.; Choi, E.H.; Lee, Y.Y.; Won, M.S.; Koo, K.S. Climate change over Korea and its relation to the forest fire occurrence. Atmosphere 2010, 20, 27–35. [Google Scholar]
- Chang, D.Y.; Jeong, S.; Park, C.E.; Park, H.; Shin, J.; Bae, Y.; Park, H.; Park, C.R. Unprecedented wildfires in Korea: Historical evidence of increasing wildfire activity due to climate change. Agric. For. Meteorol. 2024, 348, 109920. [Google Scholar] [CrossRef]
- Liu, N. Wildland surface fire spread: Mechanism transformation and behavior transition. Fire Saf. J. 2023, 141, 103974. [Google Scholar] [CrossRef]
- Carabella, C.; Miccadei, E.; Paglia, G.; Sciarra, N. Post-wildfire landslide hazard assessment: The case of the 2017 Montagna del Morrone fire (Central Apennines, Italy). Geosciences 2019, 9, 175. [Google Scholar] [CrossRef]
- Rengers, F.K.; McGuire, L.A.; Oakley, N.S.; Kean, J.W.; Staley, D.M.; Tang, H. Landslides after wildfire: Initiation, magnitude, and mobility. Landslides 2020, 17, 2631–2641. [Google Scholar] [CrossRef]
- Culler, E.S.; Livneh, B.; Rajagopalan, B.; Tiampo, K.F. A data-driven evaluation of post-fire landslide susceptibility. Nat. Hazards Earth Syst. Sci. Discuss. 2021, 23, 1631–1652. [Google Scholar] [CrossRef]
- Yu, Y.; Ginoux, P. Enhanced dust emission following large wildfires due to vegetation disturbance. Nat. Geosci. 2022, 15, 878–884. [Google Scholar] [CrossRef]
- Hare, R.C. Heat Effects on Living Plants; Occasional Paper 183; USDA, Forest Service, Southern Forest Experiment Station: Asheville, NC, USA, 1961. [Google Scholar]
- Köster, K.; Köster, E.; Orumaa, A.; Parro, K.; Jõgiste, K.; Berninger, F.; Pumpanen, J.; Metslaid, M. How time since forest fire affects stand structure, soil physical-chemical properties and soil CO2 efflux in hemiboreal Scots pine forest fire chronosequence? Forests 2016, 7, 201. [Google Scholar] [CrossRef]
- Smirnova, E. The Effects of Fire Behaviour on Secondary Succession in Boreal Pine Stands: Vegetation Structure, Coarse Woody Debris Dynamics and Soil Characteristics. Doctoral Dissertation, Université du Québec en Abitibi-Témiscamingue, Rouyn-Noranda, QC, Canada, 2009. [Google Scholar]
- Hood, S.M.; Varner, J.M.; Van Mantgem, P.; Cansler, C.A. Fire and tree death: Understanding and improving modeling of fire-induced tree mortality. Environ. Res. Lett. 2018, 13, 113004. [Google Scholar] [CrossRef]
- Resco de Dios, V. Effects of fire on plant performance. In Plant-Fire Interactions: Applying Ecophysiology to Wildfire Management; Springer Nature: Cham, Switzerland, 2020; pp. 117–132. [Google Scholar]
- Parker, T.J.; Clancy, K.M.; Mathiasen, R.L. Interactions among fire, insects and pathogens in coniferous forests of the interior western United States and Canada. Agric. For. Entomol. 2006, 8, 167–189. [Google Scholar] [CrossRef]
- Michaletz, S.T.; Johnson, E.A. How forest fires kill trees: A review of the fundamental biophysical processes. Scand. J. For. Res. 2007, 22, 500–515. [Google Scholar] [CrossRef]
- Westlind, D.J.; Kelsey, R.G. Predicting post-fire attack of red turpentine or western pine beetle on ponderosa pine and its impact on mortality probability in Pacific Northwest forests. For. Ecol. Manag. 2019, 434, 181–192. [Google Scholar] [CrossRef]
- Neary, D.G.; Klopatek, C.C.; DeBano, L.F.; Ffolliott, P.F. Fire effects on belowground sustainability: A review and synthesis. For. Ecol. Manag. 1999, 122, 51–71. [Google Scholar] [CrossRef]
- Rosenberg, B.; Kemeny, G.; Switzer, R.C.; Hamilton, T.C. Quantitative evidence for protein denaturation as the cause of thermal death. Nature 1971, 232, 471–473. [Google Scholar] [CrossRef]
- Dickinson, M.B.; Jolliff, J.; Bova, A.S. Vascular cambium necrosis in forest fires: Using hyperbolic temperature regimes to estimate parameters of a tissue-response model. Aust. J. Bot. 2004, 52, 757–763. [Google Scholar] [CrossRef]
- Proença, V.; Pereira, H.M.; Vicente, L. Resistance to wildfire and early regeneration in natural broadleaved forest and pine plantation. Acta Oecol. 2010, 36, 626–633. [Google Scholar] [CrossRef]
- Shangguan, W.; Chen, Z.; Zhao, J.; Song, X. Thermogravimetric analysis of cork and cork components from Quercus variabilis. Wood Sci. Technol. 2018, 52, 181–192. [Google Scholar] [CrossRef]
- Seo, H.S.; Choung, Y.S. Vulnerability of Pinus densiflora to forest fire based on ignition characteristics. J. Ecol. Environ. 2010, 33, 343–349. [Google Scholar] [CrossRef]
- Kwon, S.; Kim, S.; Kim, J.; Kang, W.; Park, K.H.; Kim, C.B.; Girona, M.M. Predicting post-fire tree mortality in a temperate pine forest, Korea. Sustainability 2021, 13, 569. [Google Scholar] [CrossRef]
- Bär, A.; Michaletz, S.T.; Mayr, S. Fire effects on tree physiology. New Phytol. 2019, 223, 1728–1741. [Google Scholar] [CrossRef]
- Son, J.; Lee, G.; Shin, J. Noninvasive Sonic Tomography for Detecting Internal Defects in Old, Large Oriental White Oak in Cultural Heritage Areas. Forests 2022, 13, 638. [Google Scholar] [CrossRef]
- Son, J.; Kim, S.; Shin, J.; Lee, G.; Kim, H. Reliability of non-destructive sonic tomography for detection of defects in old Zelkova serrata (Thunb.) Makino trees. For. Sci. Technol. 2021, 17, 110–118. [Google Scholar]
- Son, J.; Lee, G.; Shin, J. Reliability of Noninvasive Sonic Tomography for the Detection of Internal Defects in Old, Large Trees of Abies holophylla Maxim. Forests 2021, 12, 1131. [Google Scholar] [CrossRef]
- Deflorio, G.; Fink, S.; Schwarze, F.W. Detection of incipient decay in tree stems with sonic tomography after wounding and fungal inoculation. Wood Sci. Technol. 2008, 42, 117–132. [Google Scholar] [CrossRef]
- Brazee, N.J.; Marra, R.E. Incidence of internal decay in American elms (Ulmus americana) under regular fungicide injection to manage Dutch elm disease. Arboric. Urban For. 2020, 46, 1–11. [Google Scholar] [CrossRef]
- Bieker, D.; Kehr, R.; Weber, G.; Rust, S. Non-destructive monitoring of early stages of white rot by Trametes versicolor in Fraxinus excelsior. Ann. For. Sci. 2010, 67, 210. [Google Scholar] [CrossRef]
- Lin, C.J.; Chung, C.H.; Yang, T.H.; Lin, F.C. Detection of electric resistivity tomography and evaluation of the sapwood-heartwood demarcation in three Asia Gymnosperm species. Silva Fenn. 2012, 46, 415–424. [Google Scholar] [CrossRef]
- Guyot, A.; Ostergaard, K.T.; Lenkopane, M.; Fan, J.; Lockington, D.A. Using electrical resistivity tomography to differentiate sapwood from heartwood: Application to conifers. Tree Physiol. 2013, 33, 187–194. [Google Scholar] [CrossRef] [PubMed]
- Brazee, N.J.; Marra, R.E.; Göcke, L.; Van Wassenaer, P. Non-destructive assessment of internal decay in three hardwood species of northeastern North America using sonic and electrical impedance tomography. Forestry 2011, 84, 33–39. [Google Scholar] [CrossRef]
- Gilbert, G.S.; Ballesteros, J.O.; Barrios-Rodriguez, C.A.; Bonadies, E.F.; Cedeño-Sánchez, M.L.; Fossatti-Caballero, N.J.; Trejos-Rodríguez, M.M.; Pérez-Suñiga, J.M.; Holub-Young, K.S.; Henn, L.A.; et al. Use of sonic tomography to detect and quantify wood decay in living trees. Appl. Plant Sci. 2016, 4, 1600060. [Google Scholar] [CrossRef]
- Martin, L.; Cochard, H.; Mayr, S.; Badel, E. Using electrical resistivity tomography to detect wetwood and estimate moisture content in silver fir (Abies alba Mill.). Ann. For. Sci. 2021, 78, 65. [Google Scholar] [CrossRef]
- Trifilo, P.; Raimondo, F.; Lo Gullo, M.A.; Barbera, P.M.; Salleo, S.; Nardini, A. Relax and refill: Xylem rehydration prior to hydraulic measurements favours embolism repair in stems and generates artificially low PLC values. Plant Cell Environ. 2014, 37, 2491–2499. [Google Scholar] [CrossRef]
- Rowland, L.; da Costa, A.C.; Galbraith, D.R.; Oliveira, R.S.; Binks, O.J.; Oliveira, A.A.; Pullen, A.M.; Doughty, C.E.; Metcalfe, D.B.; Vasconcelos, S.S.; et al. Death from drought in tropical forests is triggered by hydraulics not carbon starvation. Nature 2015, 528, 119–122. [Google Scholar] [CrossRef]
- Hiscox, J.D.; Israelstam, G.F. A method for the extraction of chlorophyll from leaf tissue without maceration. Can. J. Bot. 1979, 57, 1332–1334. [Google Scholar] [CrossRef]
- Arnon, D.I. Copper enzymes in isolated chloroplasts. Polyphenoloxidase in Beta vulgaris. Plant Physiol. 1949, 24, 1. [Google Scholar] [CrossRef]
- Lichtenthaler, H.K. [34] Chlorophylls and carotenoids: Pigments of photosynthetic biomembranes. Methods Enzymol. 1987, 148, 350–382. [Google Scholar]
- Kalaji, H.M.; Bosa, K.; Kościelniak, J.; Żuk-Gołaszewska, K. Effects of salt stress on photosystem II efficiency and CO2 assimilation of two Syrian barley landraces. Environ. Exp. Bot. 2011, 73, 64–72. [Google Scholar] [CrossRef]
- Stević, F.; Varga, M. Adaptation of Amorpha fruticosa to different habitats is enabled by photosynthetic apparatus plasticity. Photosynthetica 2021, 59, 137–147. [Google Scholar]
- Sharkey, T.D.; Bernacchi, C.J.; Farquhar, G.D.; Singsaas, E.L. Fitting photosynthetic carbon dioxide response curves for C3 leaves. Plant Cell Environ. 2007, 30, 1035–1040. [Google Scholar] [CrossRef] [PubMed]
- Lee, K.C.; Kweon, H.; Sung, J.W.; Kim, Y.S.; Song, Y.G.; Cha, S.; Koo, N. Physiological response analysis for the diagnosis of drought and waterlogging damage in Prunus yedoensis. For. Sci. Technol. 2022, 18, 14–25. [Google Scholar] [CrossRef]
- Benson, A.R.; Koeser, A.K.; Morgenroth, J. Estimating conductive sapwood area in diffuse and ring porous trees with electronic resistance tomography. Tree physiol. 2019, 39, 484–494. [Google Scholar] [CrossRef]
- Agee, J.K. The influence of forest structure on fire behavior. In Proceedings of the 17th Annual Forest Vegetation Management Conference, Redding, CA, USA, 16–18 January 1996; pp. 52–68. [Google Scholar]
- Li, X.; Magill, W. Modeling fire spread under environmental influence using a cellular automaton approach. Complex. Int. 2001, 8, 1–14. [Google Scholar]
- Song, H.S.; Lee, S.H. Effects of wind and tree density on forest fire patterns in a mixed-tree species forest. For. Sci. Technol. 2017, 13, 9–16. [Google Scholar] [CrossRef]
- Prichard, S.J.; O’Neill, S.M.; Eagle, P.; Andreu, A.G.; Drye, B.; Dubowy, J.; Urbanski, S.; Strand, T.M. Wildland fire emission factors in North America: Synthesis of existing data, measurement needs and management applications. Int. J. Wildland Fire 2020, 29, 132–147. [Google Scholar] [CrossRef]
- Storey, M.A.; Price, O.F.; Fox-Hughes, P. The influence of regional wind patterns on air quality during forest fires near Sydney, Australia. Sci. Total Environ. 2023, 905, 167335. [Google Scholar] [CrossRef]
- Rigolot, E. Predicting postfire mortality of Pinus halepensis Mill. and Pinus pinea L. Plant Ecol. 2004, 171, 139–151. [Google Scholar] [CrossRef]
- Brando, P.M.; Nepstad, D.C.; Balch, J.K.; Bolker, B.; Christman, M.C.; Coe, M.; Putz, F.E. Fire-induced tree mortality in a neotropical forest: The roles of bark traits, tree size, wood density and fire behavior. Glob. Change Biol. 2012, 18, 630–641. [Google Scholar] [CrossRef]
- Frejaville, T.; Curt, T.; Carcaillet, C. Bark flammability as a fire-response trait for subalpine trees. Front. Plant Sci. 2013, 4, 71181. [Google Scholar] [CrossRef] [PubMed]
- Pinard, M.A.; Huffman, J. Fire resistance and bark properties of trees in a seasonally dry forest in eastern Bolivia. J. Trop. Ecol. 1997, 13, 727–740. [Google Scholar] [CrossRef]
- Lawes, M.J.; Richards, A.; Dathe, J.; Midgley, J.J. Bark thickness determines fire resistance of selected tree species from fire-prone tropical savanna in north Australia. Plant Ecol. 2011, 212, 2057–2069. [Google Scholar] [CrossRef]
- Odhiambo, B.; Meincken, M.; Seifert, T. The protective role of bark against fire damage: A comparative study on selected introduced and indigenous tree species in the Western Cape, South Africa. Trees 2014, 28, 555–565. [Google Scholar] [CrossRef]
- Savero, A.M.; Kim, J.H.; Purusatama, B.D.; Prasetia, D.; Park, S.H.; Van Duong, D.; Kim, N.H. Characterization of anatomical and non-anatomical properties for the identification of six commercial wood species from Vietnamese plantation forests. Forests 2023, 14, 496. [Google Scholar] [CrossRef]
- Kopaczyk, J.M.; Warguła, J.; Jelonek, T. The variability of terpenes in conifers under developmental and environmental stimuli. Environ. Exp. Bot. 2020, 180, 104197. [Google Scholar] [CrossRef]
- Lai, M.; Zhang, L.; Lei, L.; Liu, S.; Jia, T.; Yi, M. Inheritance of resin yield and main resin components in Pinus elliottii Engelm. at three locations in southern China. Ind. Crops Prod. 2020, 144, 112065. [Google Scholar] [CrossRef]
- Ganteaume, A.; Romero, B.; Fernandez, C.; Ormeño, E.; Lecareux, C. Volatile and semi-volatile terpenes impact leaf flammability: Differences according to the level of terpene identification. Chemoecology 2021, 31, 259–275. [Google Scholar] [CrossRef]
- Baek, G.; Kim, C. Litterfall, litter decomposition, and carbon storage of Pinus densiflora and Quercus variabilis stands in South Korea. Folia Oecol. 2024, 51, 39–46. [Google Scholar] [CrossRef]
- Seo, Y.; Lee, D.; Choi, J. Growth analysis of red pine (Pinus densiflora) by stem analysis in the eastern region of Korea. J. For. Environ. Sci. 2015, 31, 47–54. [Google Scholar] [CrossRef]
- Ryan, K.C.; Peterson, D.L.; Reinhardt, E.D. Modeling long-term fire-caused mortality of Douglas-fir. For. Sci. 1988, 34, 190–199. [Google Scholar] [CrossRef]
- Ryan, K.C. Effects of Fire Injury on Water Relations of Ponderosa Pine. In Fire and Forest Ecology: Innovative Silviculture and Vegetation Management; Moser, W.K., Moser, C.F., Eds.; Tall Timbers Research Station: Tallahassee, FL, USA, 2000; pp. 58–66. [Google Scholar]
- Bison, N.N.; Partelli-Feltrin, R.; Michaletz, S.T. Trait phenology and fire seasonality co-drive seasonal variation in fire effects on tree crowns. New Phytol. 2022, 234, 1654–1663. [Google Scholar] [CrossRef]
- Guo, H.; Kong, L.; Gao, Y.; Xiang, D.; Li, Z.; Gong, L.; Zhang, Y. Transition from surface fire to crown fire and effects of crown height, moisture content and Tree Flower. Fire Technol. 2022, 60, 1403–1419. [Google Scholar] [CrossRef]
- Gutsell, S.L.; Johnson, E.A. How fire scars are formed: Coupling a disturbance process to its ecological effect. Can. J. For. Res. 1996, 26, 166–174. [Google Scholar] [CrossRef]
- Lodge, A.G.; Dickinson, M.B.; Kavanagh, K.L. Xylem heating increases vulnerability to cavitation in longleaf pine. Environ. Res. Lett. 2018, 13, 055007. [Google Scholar] [CrossRef]
- O’Brien, J.J.; Kevin Hiers, J.; Mitchell, R.J.; Varner, J.M.; Mordecai, K. Acute physiological stress and mortality following fire in a long-unburned longleaf pine ecosystem. Fire Ecol. 2010, 6, 1–12. [Google Scholar] [CrossRef]
- Renninger, H.J.; Clark, K.L.; Skowronski, N.; Schäfer, K.V. Effects of a prescribed fire on water use and photosynthetic capacity of pitch pines. Trees 2013, 27, 1115–1127. [Google Scholar] [CrossRef]
- Mathur, S.; Jajoo, A.; Mehta, P.; Bharti, S. Analysis of elevated temperature-induced inhibition of photosystem II using chlorophyll a fluorescence induction kinetics in wheat leaves (Triticum aestivum). Plant Biol. 2011, 13, 1–6. [Google Scholar] [CrossRef]
- Martinazzo, E.G.; Ramm, A.; Bacarin, M.A. The chlorophyll a fluorescence as an indicator of the temperature stress in the leaves of Prunus persica. Braz. J. Plant Physiol. 2012, 24, 237–246. [Google Scholar] [CrossRef]
- Brestic, M.; Zivcak, M. PSII fluorescence techniques for measurement of drought and high temperature stress signal in crop plants: Protocols and applications. In Molecular Stress Physiology of Plants; Springer: Delhi, India, 2013; pp. 87–131. [Google Scholar]
- Wang, Y.W.; Xu, C.; Lv, C.F.; Wu, M.; Cai, X.J.; Liu, Z.T.; Song, X.M.; Chen, G.X.; Lv, C.G. Chlorophyll a fluorescence analysis of high-yield rice (Oryza sativa L.) LYPJ during leaf senescence. Photosynthetica 2016, 54, 422–429. [Google Scholar] [CrossRef]
- Lee, K.C.; An, J.; Hwang, J.E.; Kim, P.B.; Park, H.B.; Kim, S.; Park, H.J.; Lee, C.W.; Lee, B.D.; Kim, N.Y. Effects of light condition on growth and physiological characteristics of the endangered species Sedirea japonica under RCP 6.0 climate change scenarios. Plants 2021, 10, 1891. [Google Scholar] [CrossRef]
- Rathod, D.P.; Brestic, M.; Shao, H.B. Chlorophyll a fluorescence determines the drought resistance capabilities in two varieties of mycorrhized and non-mycorrhized Glycine max Linn. Afr. J. Microbiol. Res. 2011, 5, 4197–4206. [Google Scholar] [CrossRef]
- Kalaji, H.M.; Jajoo, A.; Oukarroum, A.; Brestic, M.; Zivcak, M.; Samborska, I.A.; Cetner, M.D.; Łukasik, I.; Goltsev, V.; Ladle, R.J. Chlorophyll a fluorescence as a tool to monitor physiological status of plants under abiotic stress conditions. Acta Physiol. Plant. 2016, 38, 102. [Google Scholar] [CrossRef]
- Beghin, R.; Cherubini, P.; Battipaglia, G.; Siegwolf, R.; Saurer, M.; Bovio, G. Tree-ring growth and stable isotopes (13C and 15N) detect effects of wildfires on tree physiological processes in Pinus sylvestris L. Trees 2011, 25, 627–636. [Google Scholar] [CrossRef]
- Gómez-Rey, M.X.; Couto-Vázquez, A.; García-Marco, S.; González-Prieto, S.J. Impact of fire and post-fire management techniques on soil chemical properties. Geoderma 2013, 195, 155–164. [Google Scholar] [CrossRef]
- Agbeshie, A.A.; Abugre, S.; Atta-Darkwa, T.; Awuah, R. A review of the effects of forest fire on soil properties. J. For. Res. 2022, 33, 1419–1441. [Google Scholar] [CrossRef]
- Field, C.; Mooney, H.A. The photosynthesis-nitrogen relationship in wild plants. In On the Economy of Plant Form and Function; Givnish, T.J., Ed.; Cambridge University Press: Cambridge, UK, 1986; pp. 25–55. [Google Scholar]
- Reich, P.B.; Abrams, M.D.; Ellsworth, D.S.; Kruger, E.L.; Tabone, T.J. Fire affects ecophysiology and community dynamics of central Wisconsin oak forest regeneration. Ecology 1990, 71, 2179–2190. [Google Scholar] [CrossRef]
- Boerner, R.E.; Lord, T.R. First-year loss of mass and nutrients from leaf litter in the New Jersey pine barrens. Bartonia 1984, 50, 12–20. [Google Scholar]
- dos Santos, U.M., Jr.; de Carvalho Gonçalves, J.F.; Feldpausch, T.R. Growth, leaf nutrient concentration and photosynthetic nutrient use efficiency in tropical tree species planted in degraded areas in central Amazonia. For. Ecol. Manag. 2006, 226, 299–309. [Google Scholar] [CrossRef]
- Hu, M.; Wan, S. Effects of fire and nitrogen addition on photosynthesis and growth of three dominant understory plant species in a temperate forest. J. Plant Ecol. 2019, 12, 759–768. [Google Scholar] [CrossRef]
- Escudey, M.; Arancibia-Miranda, N.; Pizarro, C.; Antilén, M. Effect of ash from forest fires on leaching in volcanic soils. Catena 2015, 135, 383–392. [Google Scholar] [CrossRef]


| Abbreviations | Descriptions |
|---|---|
| General terms | |
| P. densiflora; Pd | Pinus densiflora |
| Q. variabilis; Qv | Quercus variabilis |
| FD | Fire-damaged |
| NFD | Non-fire-damaged |
| Terms related to external appearances | |
| TH | Tree height |
| BL | Bole length |
| DBH | Diameter at breast height |
| CircMP | Circumstances at measuring point |
| BSI | Bark scorch index |
| BSH | Bark scorch height |
| BSP | Bark scorch proportion |
| F-F-F | Fine from 2022 to 2024 |
| F-W-W | Fine until 2022 and withered from 2023 |
| W-W-W | Withered from 2022 |
| Terms related to internal diagnosis | |
| Geo | Geometry |
| SoT | Sonic tomography |
| ERT | Electrical resistance tomography |
| CAR | Color area ratio |
| RsMin | Minimum resistivity |
| RsMax | Maximum resistivity |
| Abbreviations | Descriptions |
|---|---|
| ABS/RC | Absorption flux per RC |
| DIo/RC | Energy dissipation flux per RC |
| TRo/RC | Trapped energy flux per RC |
| VK/VJ | Ratio of variable fluorescence in K to J step as indicator of PSII donor side limitation |
| ϕPo | Maximum quantum yield of primary photochemistry |
| ψEo | Efficiency with which trapped exciton moves electron into ETC beyond QA |
| ϕEo | Quantum yield of electron transport |
| PIABS | Performance index on absorption basis |
| DFABS | Driving force on absorption basis |
| SFIABS | Structural and functional index on absorption basis |
| Species | Status | TH | BL | DBH | CircMP | BSI |
|---|---|---|---|---|---|---|
| (m) | (m) | (cm) | (mm) | |||
| P. densiflora | Total | 11.9 ± 2.1 *** | 6.5 ± 2.7 ** | 23.2 ± 5.8 ** | 885.0 ± 213.6 ** | 4.8 ± 1.7 * |
| Fine | 12.2 ± 1.4 ns | 6.7 ± 2.7 ns | 23.5 ± 5.8 ns | 913.9 ± 201.0 ns | 4.5 ± 1.7 * | |
| Withered | 10.4 ± 3.3 | 5.4 ± 2.1 | 22.0 ± 5.5 | 753.3 ± 219.8 | 6.1 ± 1.7 | |
| Q. variabilis | Total | 9.3 ± 1.4 | 4.6 ± 1.1 | 19.3 ± 2.8 | 721.7 ± 116.1 | 3.9 ± 2.1 |
| Species | FD/NFD | F/W | SoT | ERT | ||
|---|---|---|---|---|---|---|
| 2022 | 2023 | 2024 | ||||
| Pd | FD | F-F-F |  |  |  |  |
| F-W-W |  |  |  |  | ||
| W-W-W |  |  |  |  | ||
| NFD | F-F-F |  |  | - | - | |
| Qv | FD | F-F-F |  |  | - | - |
| NFD | F-F-F |  |  | - | - | |
| Species | FD/NFD | ERT Color Area Ratio (%) | |||
|---|---|---|---|---|---|
| ERTR | ERTY | ERTRY | ERTB | ||
| P. densiflora | FD | 8.9 ± 9.9 ns | 17.8 ± 13.2 ns | 26.8 ± 21.0 ns | 73.2 ± 21.0 ns |
| NFD | 5.8 ± 3.4 | 13.7 ± 8.7 | 19.5 ± 9.0 | 80.5 ± 9.0 | |
| Q. variabilis | FD | 9.4 ± 4.0 ns | 21.1 ± 5.9 ns | 30.5 ± 7.6 ns | 69.5 ± 7.6 ns |
| NFD | 8.8 ± 3.1 | 25.7 ± 7.2 | 34.5 ± 5.8 | 65.5 ± 5.8 | |
| Treatment | Chlorophyll (mg·g−1) | Carotenoid | Chl a/b | T Chl/Car | ||
|---|---|---|---|---|---|---|
| a | b | Total | (mg·g−1) | |||
| PdFD | 8.1 ± 1.1 * | 2.8 ± 0.6 ns | 10.9 ± 1.4 * | 2.2 ± 0.4 * | 3.0 ± 0.5 ns | 5.1 ± 1.0 ns |
| PdNFD | 11.5 ± 1.1 | 3.5 ± 0.3 | 15.0 ± 1.4 | 2.9 ± 0.1 | 3.3 ± 0.00 | 5.3 ± 0.3 |
| QvFD | 24.6 ± 2.4 ns | 12.5 ± 2.3 ns | 37.1 ± 4.5 ns | 5.9 ± 0.7 ns | 2.0 ± 0.2 ns | 6.4 ± 1.1 ns |
| QvNFD | 26.8 ± 0.9 | 14.2 ± 0.6 | 40.9 ± 0.4 | 6.5 ± 0.4 | 1.9 ± 0.1 | 6.3 ± 0.3 |
| Variable/Indicator | P. densiflora (Fire-Damaged) | Q. variabilis (Fire-Damaged) | Key Observation/Interpretation |
|---|---|---|---|
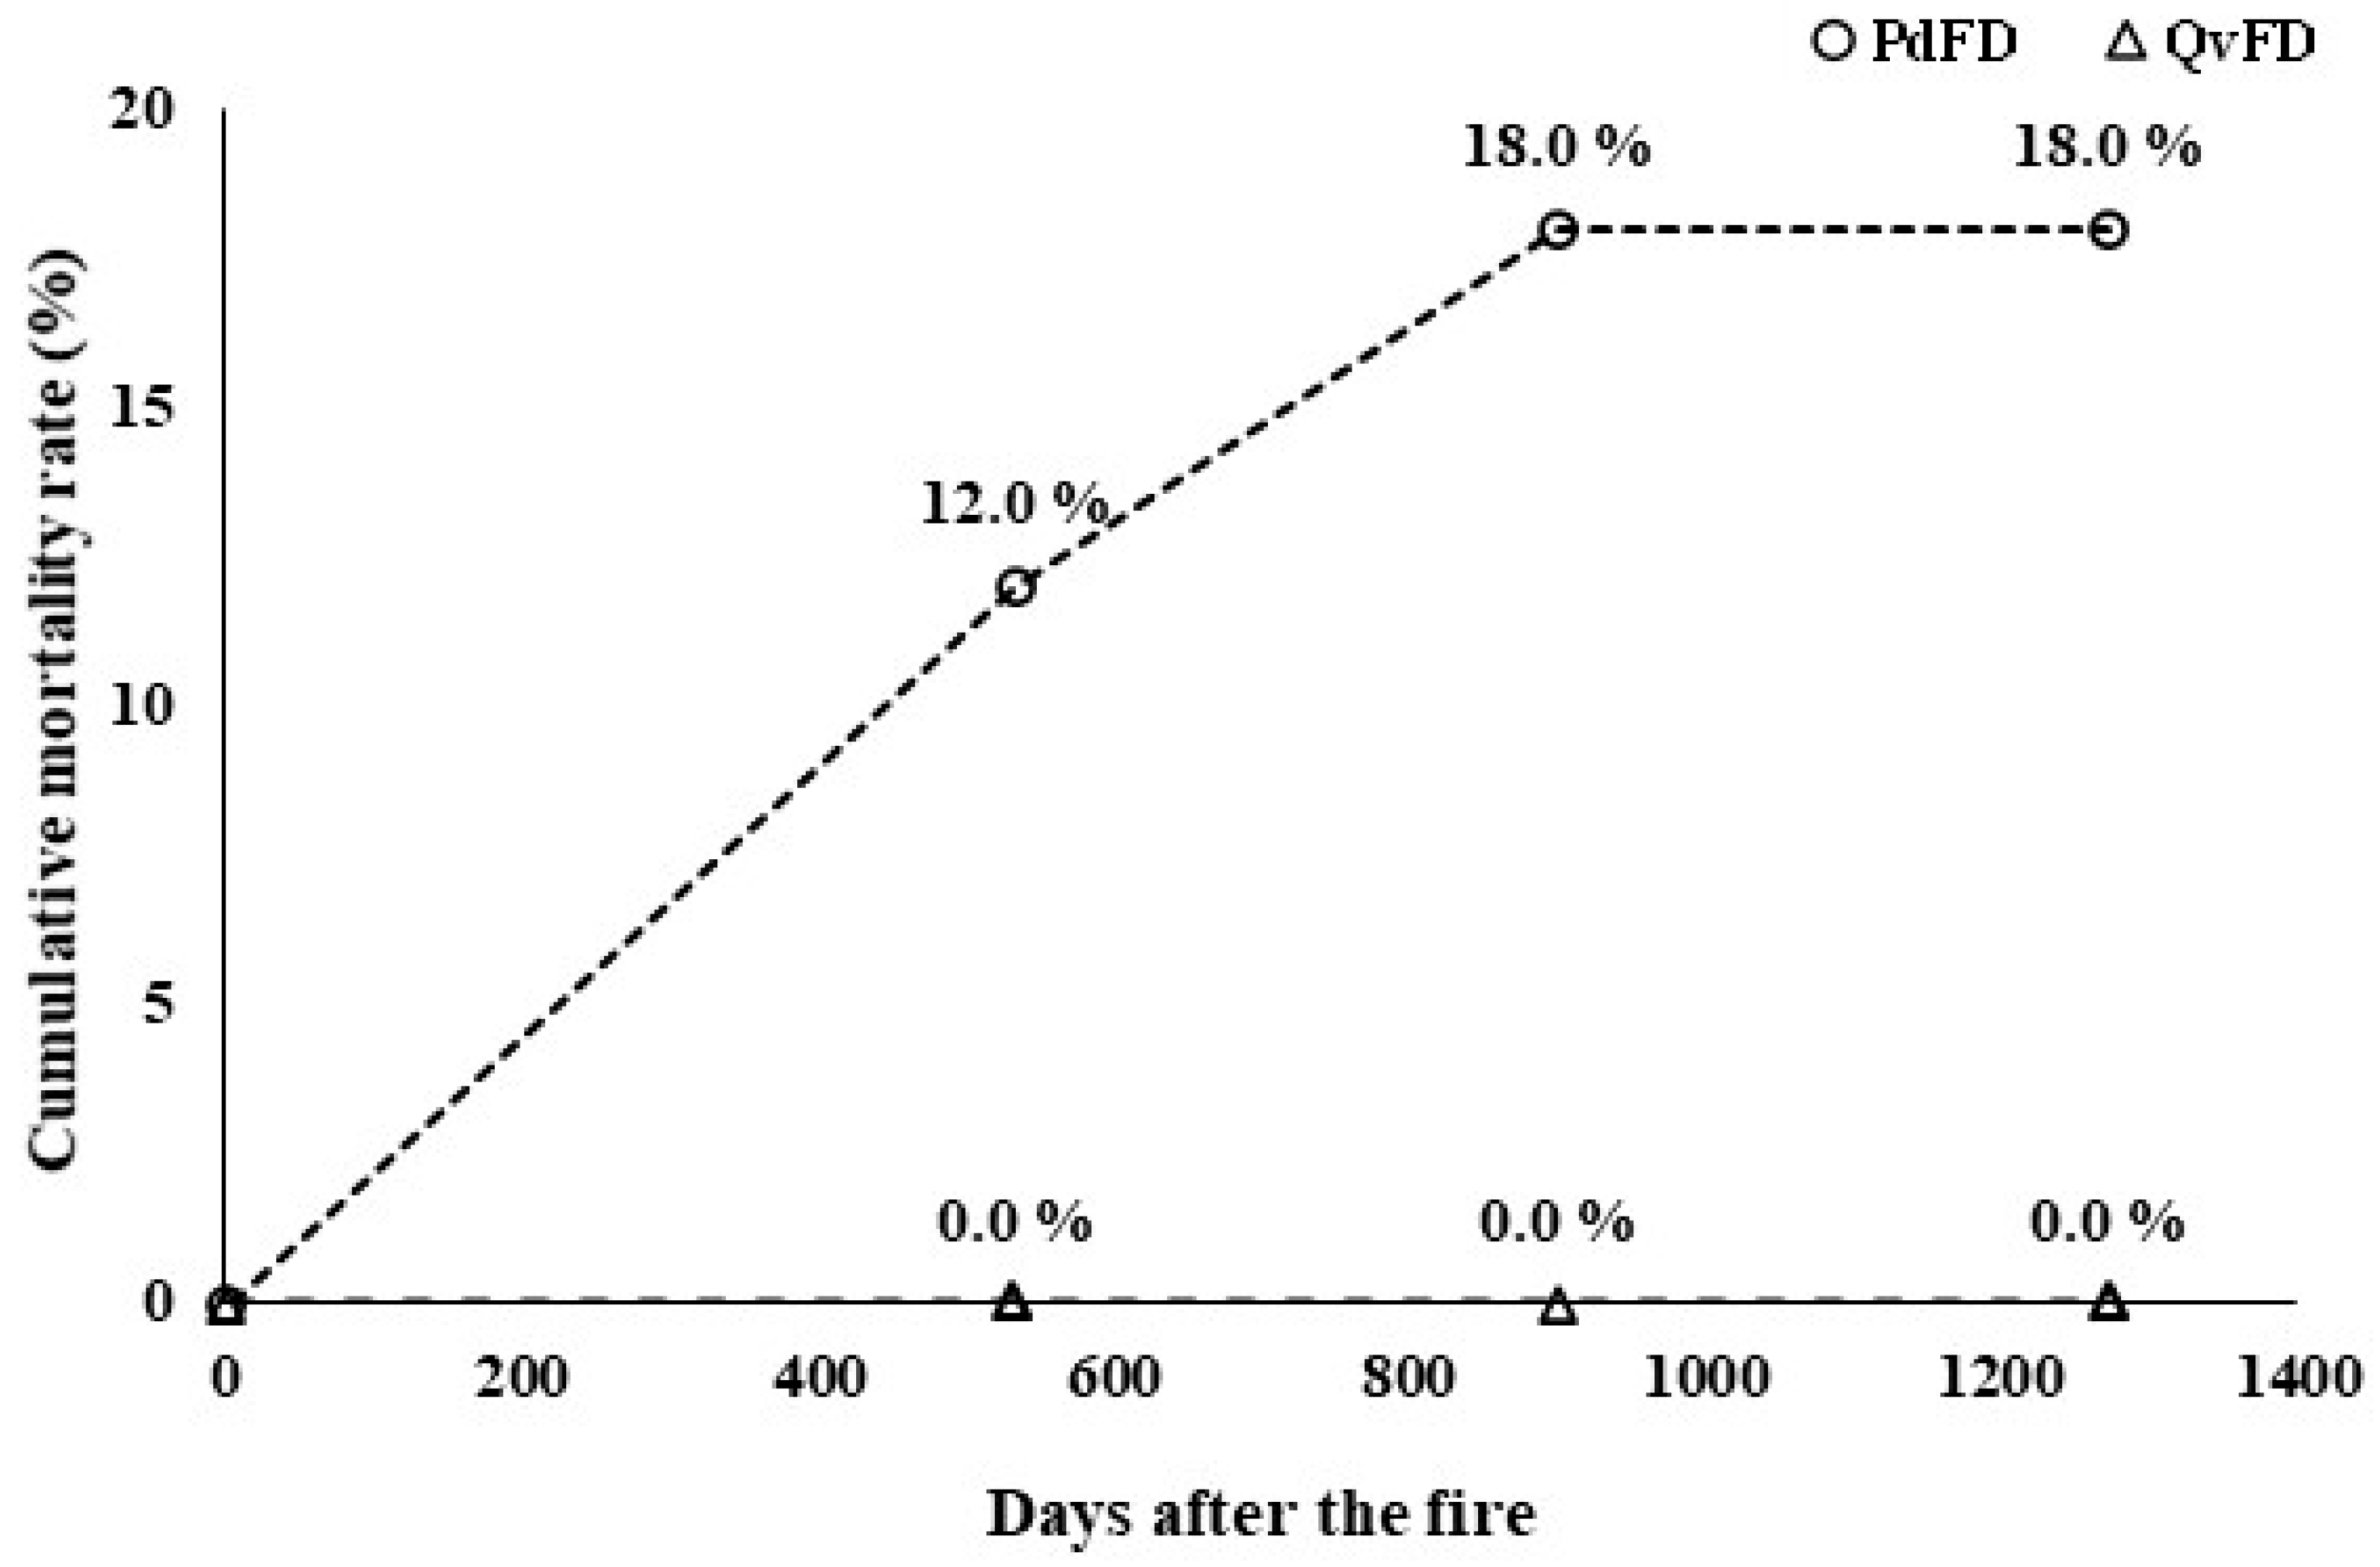
| Mortality Rate (2022–2024) | 18.0% cumulative mortality | 0% mortality | Higher post-fire survival in Q. variabilis |
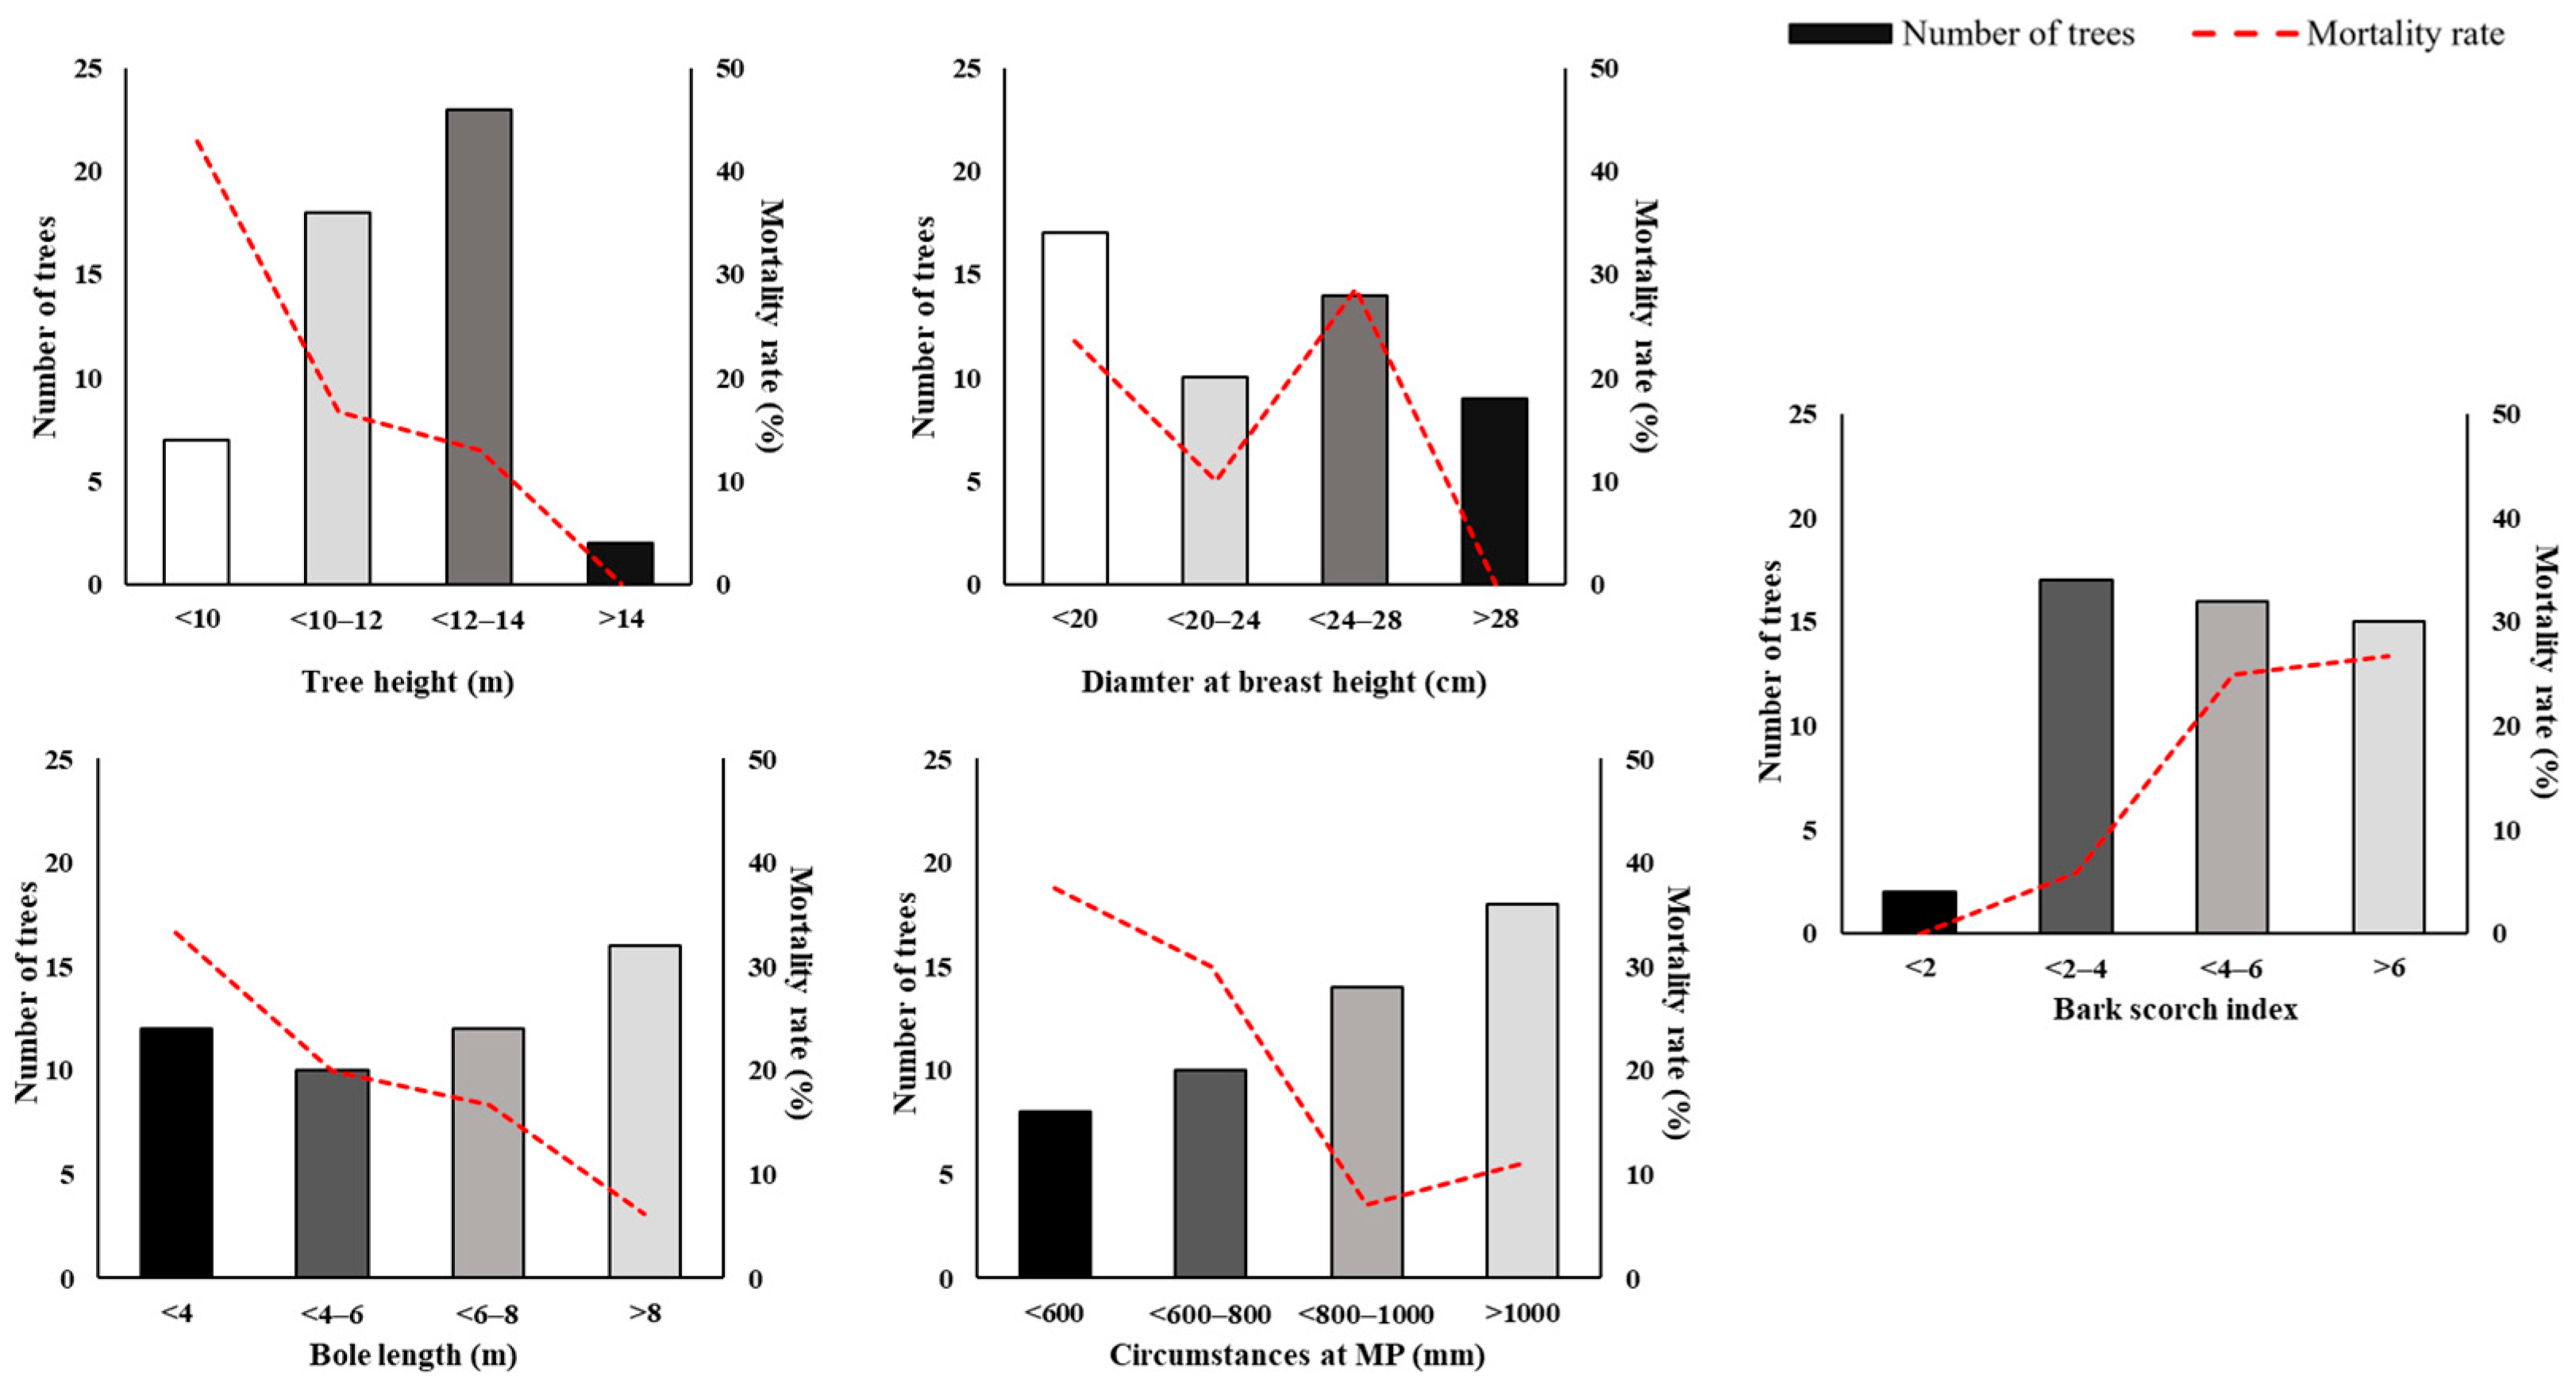
| Bark Scorch Index (BSI) | High BSI in dead trees | Significantly lower BSI | BSI closely linked with tree mortality in P. densiflora |
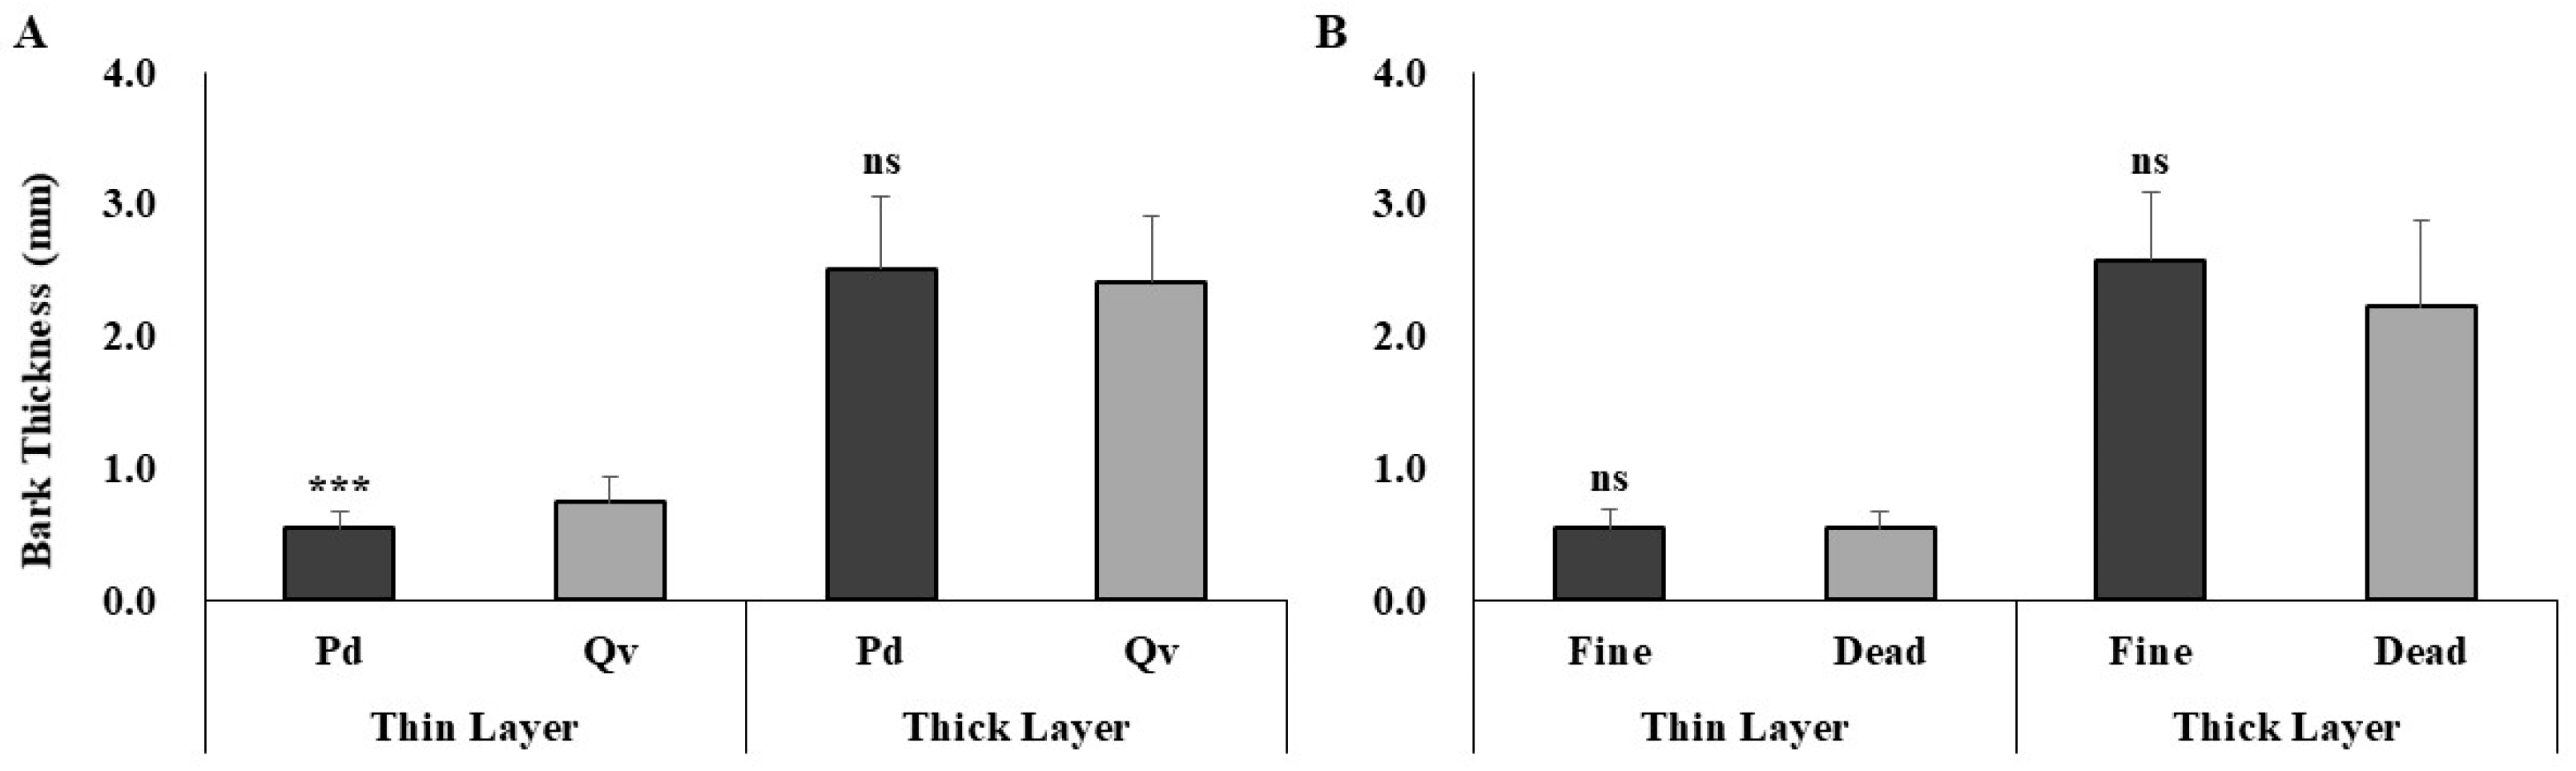
| Bark Thickness | Generally thinner | Thicker bark | Thicker bark may have protected Q. variabilis from heat damage |
| Internal Assessment (SoT/ERT) | No clear internal decay (SoT); varied ERT values; higher ERTR ratio in trees that withered the following year | Minimal damage patterns in both SoT and ERT | Early internal damage detected using ERT |
| Canopy Condition | Variable, sometimes linked with BSI | Stable, healthy canopy | Crown stability higher in Q. variabilis post-fire |
| Physiological Response | Decreased pigment content, but no significant impact on photosynthetic activity (A, gs, and PIABS) | Stable pigment levels and physiological traits | Pigment degradation occurred in P. densiflora, but function remained intact |
Disclaimer/Publisher’s Note: The statements, opinions and data contained in all publications are solely those of the individual author(s) and contributor(s) and not of MDPI and/or the editor(s). MDPI and/or the editor(s) disclaim responsibility for any injury to people or property resulting from any ideas, methods, instructions or products referred to in the content. |
© 2025 by the authors. Licensee MDPI, Basel, Switzerland. This article is an open access article distributed under the terms and conditions of the Creative Commons Attribution (CC BY) license (https://creativecommons.org/licenses/by/4.0/).
Share and Cite
Song, Y.; Jung, Y.; Lee, Y.; Kang, W.; Bae, J.; Han, S.; Lee, K. Non-Destructive Methods for Diagnosing Surface-Fire-Damaged Pinus densiflora and Quercus variabilis. Forests 2025, 16, 817. https://doi.org/10.3390/f16050817
Song Y, Jung Y, Lee Y, Kang W, Bae J, Han S, Lee K. Non-Destructive Methods for Diagnosing Surface-Fire-Damaged Pinus densiflora and Quercus variabilis. Forests. 2025; 16(5):817. https://doi.org/10.3390/f16050817
Chicago/Turabian StyleSong, Yeonggeun, Yugyeong Jung, Younggeun Lee, Wonseok Kang, Jeonghyeon Bae, Sangsub Han, and Kyeongcheol Lee. 2025. "Non-Destructive Methods for Diagnosing Surface-Fire-Damaged Pinus densiflora and Quercus variabilis" Forests 16, no. 5: 817. https://doi.org/10.3390/f16050817
APA StyleSong, Y., Jung, Y., Lee, Y., Kang, W., Bae, J., Han, S., & Lee, K. (2025). Non-Destructive Methods for Diagnosing Surface-Fire-Damaged Pinus densiflora and Quercus variabilis. Forests, 16(5), 817. https://doi.org/10.3390/f16050817