Abstract
Extreme drought events under the background of global warming pose a significant threat to China’s forest industry system. This study aims to analyze the impact of drought on China’s forest industry from the perspective of economics, and, through the mechanism test, to further study the communication path of drought to the forest industry. The study finds: (1) drought has been increasing in China in the last 50 years. (2) Drought has a significant restraining effect on the Chinese forest industry. Moreover, inland areas are more vulnerable to drought than coastal areas. (3) Drought will lead to an increase in the occurrence area of forest pests and diseases, forming a compound eco-economic loss effect, thus inhibiting the development of the forest industry. (4) Drought can drive an increase in irrigation facilities. Efficient irrigation may mitigate biological damages caused by drought, so as to resist part of the economic losses. (5) Drought may cause labor to migrate from the forest sector to non-forest sectors, leading to lower production in the forest industry. Labor transfer effects caused by drought are more obvious in the areas where the income gap is relatively big between rural and urban regions, e.g., in inland areas.
1. Introduction
The forest is one of the most important ecosystems on Earth and plays a crucial role in maintaining the global ecological balance and stability of the Earth’s climate system [1]. However, drought strongly restricts the development of forests. Chaudhary et al. found that tree growth declined sharply during droughts, and although it recovered significantly after the drought, it remained below pre-drought levels. Moreover, drought will directly lead to increased tree mortality and change the composition and structure of forests [2]. Global economic losses due to drought are estimated to be as high as USD 0.6–8 billion per year, far more than other climate disasters [3]. Under the background of global warming, drought has become an important ecological and economic issue threatening the forest industry [4].
In China, drought is a major natural disaster. Statistics show that China experiences an average of 10.62 million hectares of drought annually for more than 50 years [5]. According to the Ministry of Natural Resources of China, as of 2025, China’s total forest area is 283.7 million hectares, with forest coverage exceeding 25% of the country’s total land area [6]. The forestry industry is an important force in China’s economic development [7]. The output of China’s forestry industry is keeping increasing. In 2010, the total output value of China’s forestry was RMB 2.28 trillion, and by 2021, it had increased to RMB 8.68 trillion. The growth of the forestry industry is crucial to the sustainable utilization of forest resources, and is closely related to afforestation, biodiversity protection, and carbon sink functions [8,9]. All of these factors create an urgent need to understand the impact of drought on the growth of the forest industry in China.
The impact of drought on forest industry is a complex systemic issue involving multiple fields such as ecology, forestry, meteorology, and economics. Therefore, interdisciplinary research cooperation is particularly important. Most current research focuses on the negative impact of drought on forest ecosystems and tree physiology, but very little research analyses the impact on the forest industry from a social–economic perspective.
This study aims to reveal the impact mechanism of drought on the forest industry, from a social–economic perspective. Our research questions are whether drought had a negative impact on the growth of the forest industry in China in the last 50 years, and what the internal mechanisms of drought stress on the growth of forest industry in China are.
2. Literature Review
2.1. Drought Is Intensifying
As a costly natural disaster, drought has been widely studied by scholars. A large amount of research has found that the global drought phenomenon is intensifying [10,11]. Sergio M. Vicente-Serrano et al. have found that the severity of global agricultural droughts has increased over the past 120 years and made drought predictions based on the global system model [12]. Paola A. Arias et al. pointed out the increasingly severe drought in Central and South America was caused by the low precipitation [13]. Williams et al. found that the severity of drought in the southwestern part of North America increased rapidly from 2021 to 2022, and 19% of it was caused by human activities [14]. Markonis et al. have revealed the fact that the European region has suffered huge economic losses and environmental damage over the past few decades due to the increasingly arid phenomenon [15]. Some research has studied drought in China. For example, Liu et al. studied the drought trend in Sichuan Province, China based on the observation data of 44 meteorological stations [16]. Cao et al. revealed the spatio-temporal variations in drought in the northwest region of China [17]. These research all found that drought was becoming more intensified in a small part of China, but did not reveal the development of drought in the entire China. Therefore, we assume that drought has been increasing in China in the last 50 years.
Hypothesis 1.
Drought has been increasing in China in the last 50 years.
2.2. Impact of Drought on Forest Industry in China
A large number of scholars have studied the effects of drought on forests. Brodribb et al. revealed the long-term impact of drought on the structure and function of forest ecosystems through dendrochronology and remote sensing analysis [18,19]. McDowell et al. analyzed the effects of drought on forest growth, mortality, and carbon cycling through model simulation and data analysis [20]. Gao et al. comprehensively evaluated the impact of drought on forest ecosystem productivity through field experiments and data analysis [21]. Li et al. explored the impact of drought events on vegetation productivity in China by using remote sensing data and statistical analysis [22]. Schwalm et al. concluded that frequent drought events led to a weakened carbon absorption capacity of trees through the observation of remote sensing data and global monitoring network data [23]. Gessler et al. proposed the influence of nutrients on tree growth during drought through case analysis [24]. Sungmin et al. analyzed the response of forest ecosystems to sudden drought events by monitoring data such as leaf area index and solar-induced chlorophyll fluorescence [25]. Hisano et al. found that forests in drought-prone areas were extremely sensitive to environmental changes such as climate warming and drought, and their productivity generally declined due to the pressure of water shortage [26]. Li et al. used leaf area index to measure the impact of drought on vegetation growth [27].
Since it has been established that drought has a negative impact on the productivity of forests, it is reasonable to believe that drought also has a negative influence on the growth of the forest industry in China.
Hypothesis 2.
Drought is negatively related to the growth of China’s forest industry.
2.3. Internal Mechanism of Drought Stress in Forest Industry in China
For the past few decades, a wide range of studies have found that drought hinders plant growth and induces plant death by increasing their susceptibility to wildfire, insect pests, and disease. Yu et al. revealed the different response mechanisms of drought in different grassland ecosystems, providing theoretical support for addressing climate change and adaptive management [28]. Ernandez et al. found that during droughts, highly correlated hydraulic constraints are often the underlying mechanism leading to an increase in forest mortality [29]. Chitra-Tarak et al. discovered that when droughts occur, deep-water channels are an important mechanism for plants to survive [30]. Bose et al. found that one of the main reasons for the accelerated withering of Scottish pines in the past 20 years is self-thinning caused by drought [31].
The internal mechanisms of drought stress in the forest industry involve complex interactions across multiple levels. This study discusses the internal mechanisms from ecological, economic, and social perspectives.
2.3.1. Ecological Mechanism
Disease and pest outbreaks are more likely to occur during drought stress due to the decrease in physiological resistance of trees [32]. If the drought persists, the damage area of coniferous dry pests can increase by 2–3 times [33]. Occurrence area of forest pests and diseases is selected to reflect the direct destruction mechanism of biological stress. Kotlarz and Bejger mentioned increasing climate change effects like pets and diseases may reduce the timber supply in the forest industry, thus cause significant economic impacts [34]. The outbreak of insects would lead to a large number of tree deaths, and have a negative impact on the forest industry [35]. Drought stress can reduce tree resistance and make forest ecosystems more vulnerable to pests and diseases, negatively affecting the forest industry (Keenan et al., 2019) [36]. Thus, it is reasonable to assume that forest pests and diseases are more likely to break out under drought stress in China.
Hypothesis 3.
Drought can curb the development of the forestry industry by increasing the area where forest pests and diseases occur.
2.3.2. Economic Mechanism
In the face of the challenges of climate change and water scarcity, irrigation facilities as adaptive measures can help maintain the stability and productivity of forest ecosystems. Through reasonable irrigation management, the loss of forest industry caused by drought and other natural disasters can be reduced and the sustainable use of forest resources can be ensured [37]. The number of forestry irrigation facilities is selected to reflect the regulation mechanism of economic resources [38]. It has been established that a moderate irrigation strategy could optimize forest growth [39]. Fertilized and dry-season irrigated plantations promote timber production and carbon storage [40]. Therefore, it is reasonable to assume that drought will increase irrigation facilities in China.
Hypothesis 4.
Drought can offset some of the losses in the forestry industry by increasing the number of forestry irrigation facilities.
2.3.3. Social Mechanism
The drought-induced drop in income will drive some labor force from the forest to the non-forest sector [41], This phenomenon is consistent with the dual economy theory proposed by Lewis (1954) [42]. Labor transfer rate is selected as a mechanism variable to show the influence of drought on social life. Labor force transfer would lead to the reduction in rural forestry production labor force, increase the price of forestry labor force, and thus increase the production cost of forestry [43]. Meanwhile, the migration of the labor force will also lead the left-behind farmers to switch to low-labor-intensity grain cultivation to ensure their basic food and clothing needs, ultimately suppressing the development of the forestry industry [44]. Therefore, droughts could constrain the development of forestry by increasing the transfer rate of the labor force away from forest industry. This leads to our fifth hypothesis.
Hypothesis 5.
Drought will intensify the transfer of labor force and thereby restrict the development of the forestry industry.
3. Materials and Methods
3.1. Variable Selection and Data Collection
This study analyses the influence of drought on the growth of forest industry with a regression model. The growth of the forest industry is described by a composite index of the forest industry as the explained variable, while drought is described by a drought index as an explanatory variable. In order to eliminate other potential interfering factors and ensure that the relationship between the core explanatory variable and the explained variable is not distorted, control variables are selected from three perspectives:, i.e., economic, social and ecological, based on the theory of social–ecological systems [45,46].
We also conducted mechanism tests to evaluate internal mechanisms of drought stress in forest industry in China. Three mechanism variables reflect economic, social, and ecological factors.
The definitions of all variables are shown in Table 1.

Table 1.
Variables definition.
3.1.1. Explanatory Variable
The explanatory variable of this study is drought data based on the standardized precipitation–evapotranspiration index (SPEI).
Drought is usually divided into four categories: meteorological drought, agricultural drought, hydrological drought, and socioeconomic drought [47]. Meteorological drought is usually defined as the lack of precipitation in an area over a period of time [48]. Agricultural drought refers to a type of drought where the soil moisture supply is insufficient to meet the normal growth needs of crops or vegetation, resulting in reduced crop yields, restricted growth, or damage to the ecosystem [49]. Hydrological drought refers to a type of drought where the reserves of surface water or groundwater remain persistently below normal levels, resulting in insufficient water supply and affecting activities such as human water use, ecological water demand, and hydropower generation [50]. Socioeconomic drought refers to a type of drought where water shortage leads to the inability to meet social production, economic activities, or living demands, thereby causing economic losses, difficulties in people’s livelihood, or social conflicts [47,51]. Among these droughts, meteorological drought is usually regarded as the origin of other droughts [50,52]. In light of the research questions, this study should choose a drought index that is both meteorologically and agriculturally oriented.
There are many drought monitoring indexes; the most commonly used are the Palmer drought index (PDSI), the standard precipitation index (SPI), and the SPEI. Among them, the PDSI lacks the validity of time and space comparison, and has strong subjectivity in drought classification [53]. SPI is based on precipitation only, and does not consider the influence of temperature and evapotranspiration on drought conditions [54]. Vicente-Serrano et al. proposed the SPEI in 2010, which not only retains the advantage of PDSI’s sensitivity to potential evapotranspiration, but also has the characteristics of SPI’s multiple time scales, which is suitable for drought characteristics analysis under the background of global warming [55]. Moreover, the SPEI may reflect both meteorological and agricultural droughts. It is well suited for the research purposes of this study [56].
The SPEI dataset for this study was provided by the global SPEI database (https://spei.csic.es/ accessed on 28 April 2025)) with a spatial resolution of 0.5° × 0.5°. The precipitation and potential evapotranspiration data used to calculate the SPEI data were provided by the Climatic Research Center of the University of East Anglia [57,58].
3.1.2. Explained Variable
The explained variable of this study is the forest industry comprehensive index (FICI), and its construction is based on the existing literature [59,60,61]. The specific contents of each indicator are shown in Table 2. After comprehensive consideration of the validity and availability of data from various statistical yearbooks, empirical analysis was conducted on panel data from 31 provinces (excluding Hong Kong, Macao, and Taiwan) from 2001 to 2020. Data were collected from the ERA5-Land dataset, the Guotai’an database, the China Statistical Yearbook, the National Economic Statistical Bulletin, the China Forest and Grassland Yearbook, and the China Population and Employment Statistical Yearbook. In addition, missing data were supplemented by interpolation.
Table 2.
Construction of an FICI.
Because FICI, the explained variable, is composed of multiple sub-indicators, in order to provide a more accurate and comprehensive reflection of the overall situation of the variable, an entropy method is used to assign weights to sub-indicators to eliminate the cross-overlap of variables between sub-indicators and the influence of subjective assumptions in sub-indicator design [62].
Firstly, the tertiary indicators such as planned investment, completed investment, proportion of primary industry, proportion of secondary industry, proportion of the tertiary industry, output value per unit forest area, and per capita forestry output value are normalized by min–max scaling.
For positive indicators:
For negative indicators:
where represents the scaling result of the j indicator of the i province in the t year; represents the score of the i province in the j indicator in the t year; represents the lowest score of indicator j in all provinces; and represents the highest score of indicator j in all provinces.
Secondly, proportion of the indicator j in the i province is calculated in the t year, as follows:
Thirdly, the information entropy and information utility of indicator j are calculated as follows:
Then, the weight of indicator j can be calculated as follows:
Finally, the comprehensive score of the i province in the t year is calculated as follows:
3.1.3. Control Variable
Control variables are selected from three perspectives, i.e., economic, social, and ecological, based on the theory of social–ecological systems [45,46]. The control variables included in this study’s list of potentially affecting factors are as follows.
On the economic aspect, the level of economic development and the urban–rural income gap are set as control variables, because regional economic development may affect forestry resource management through capital formation ability, and the income gap between urban and rural areas may affect the decision for rural labor transfer through push–pull effect, resulting in the loss of special human capital from the forest industry [63,64]. Secondly, at the level of social system adjustment, the urbanization rate, the average years of education in rural areas, and the number of employees in the forest industry at the end of a year were set as control variables. Urbanization may adjust the forestry structure through the change in land use and wood demand. The level of rural education may improve knowledge-based ecological management through technology adoption and ecological consciousness. As a direct representation of the industry scale, the number of employees in the forestry system will directly affect the development of the forest industry [65,66,67]. Finally, for ecosystems, the forest ecological environment and forest coverage are set as control variables. Forest ecological environment (such as forest coverage rate) can lower drought stress intensity by regulating microclimate and conserving soil and water, so as to maintain forest productivity. Forest area constitutes the basis of industrial resilience through scale effect and resource reserve [68,69]. Therefore, the control variables of this study are the level of economic development (PerGDP), the urban–rural income gap (Incomegap), the urbanization rate (Urbanization), the average years of education in rural areas (Education), the number of employees in the forestry system at the end of the year (Employees), the forest ecological environment (Coveragerate), and forest area (Forest).
3.1.4. Mechanism Variable
Mechanism variables are also selected from economic, social and ecological perspectives [60,70]. The occurrence area of forest pests and diseases (Acreage) is selected to reflect the direct destruction mechanism of biological stress. The number of forestry irrigation facilities (Quantity) is selected to reflect the regulation mechanism of economic resource [38]. The labor transfer rate (Rate) is selected as a mechanism variable to show the influence of drought on social life. These three variables construct a mechanism chain, which conforms to the multi-scale analysis framework of complex systems theory [7,71].
3.2. Model
Before the empirical analysis, in order to ensure the rationality of model selection, we carried out a series of relevant tests. First of all, through the multicollinearity test, since all variables and the average VIF value are less than 10, it can be considered that there is no multicollinearity problem, as shown in Table 3. Secondly, through the Hausmann test, it can be seen from the results that for the explained variable forest industry composite index (score), the Chi-square test value is 75.05 and the p-value is 0, and the null hypothesis is rejected at the 1% level, as shown in Table 4. This result supports our decision to choose the two-way fixed effect model.
Table 3.
Multicollinearity test.
Table 4.
Hausmann test.
The following model was constructed to clarify the impact of drought on the forest industry and its mechanism:
where is the explained variable, representing the FICI of province in period ; is the explanatory variable, representing the SPEI value of province in period ; is the control variable of province in period ; is the fixed effect at the provincial level; is the time fixed effect; and is the random disturbance term.
Secondly, this study also reveals the intermediate mechanism of drought on the forest industry from the perspective of eco-economic coupling [60]. The model is set as follows:
where is the explained variable, that is, the transmission channel to be verified in this study, and represents the mechanism variable of province during period . is the explanatory variable, representing the SPEI value of province in period . is the control variable of province in period . is the fixed effect at the provincial level. is the time fixed effect, and is the random disturbance term.
3.3. Endogenous Processing, Robustness Test, and Heterogeneity Analysis
3.3.1. Endogenous Processing
This study contains three types of endogenous problems—reverse causality, measurement error, and missing variables. In order to overcome endogeneity, precipitation and the normalized vegetation index were selected as instrumental variables [72,73,74] for a two-stage instrumental variable regression.
3.3.2. Robustness Test
A robustness test was conducted to further verify the robustness of the regression results, prevent pseudo-regression problems, and increase the authenticity of the regression results. On the basis of the previous regression, we replaced the explanatory variables, replaced the models, and eliminated the impact of the financial crisis and the COVID-19 pandemic to cross-verify the regression results. First, the explanatory variables were replaced by delaying them for one period. Second, the system GMM model was used for regression [75]. Third, the financial crisis and the COVID-19 pandemic seriously affected local economies and the macro social environment, resulting in sample data of the current year that did not truly reflect the actual situation; that is, the data were distorted due to changes in the external environment. Therefore, a robustness test was conducted by eliminating the samples from relevant years. In addition, the regression of data samples was also conducted by removing outliers and 1% tail shrinkage.
3.3.3. Heterogeneity Analysis
Considering the differences in natural endowment, industrial structure, and policy support in different regions, it is particularly important to explore the differences in SPEI’s impact on forest industry in different regions. The samples were divided into two sub-samples by region: coastal area and inland area.
4. Results
4.1. Descriptive Statistics
Table 5 reports descriptive statistical results for the main variables selected. These data provide a wealth of information. First, in the forest industry, the data show significant differences in the value of the industry between provinces. Specifically, the minimum value of the forest industry composite index is 0.045, the maximum value is 0.812, and the standard deviation is 0.134, which indicates that there are obvious individual differences among provinces in the forest industry. Secondly, from the perspective of drought, the minimum value of drought is −1.725, the maximum is 1.483, and the standard deviation is 0.676. These data reflect some differences in the degree of drought among provinces.
Table 5.
Descriptive statistics of variables.
4.2. Analysis of SPEI at Different Time Scales
As depicted in Figure 1, notable differences exist in the variation trends of the SPEI time series across diverse time scales. The monthly SPEI (Figure 1a) has the most frequent fluctuation, with obvious alternation between dry and wet. The seasonal SPEI in May, August, November, and February (Figure 1b) was followed by continuous dry periods and wet periods, while the annual SPEI (Figure 1c) had the least fluctuating frequency, showing an obvious switch between dry and wet periods. Therefore, when the time scale is extended, the SPEI changes gradually trend to flatline, reflecting that water differences over multiple months are more average than the water difference in a single month, and overall periodicity is more obvious. SPEI values for different time scales have different sensitivities to precipitation and potential evapotranspiration. The larger the time scale, the less obvious the response of SPEI to short-term precipitation and potential evapotranspiration, and only long-term precipitation and potential evapotranspiration can cause the SPEI to fluctuate, which is more suitable for detecting long-term water status [76,77]. On the whole, SPEI linear tendency rates at monthly, seasonal, and annual scale were −0.004·10-a, −0.006·10-a and −0.012·10-a, respectively, showing a decreasing trend. Clearly, drought in China has increased significantly in the past 50 years. Hence, Hypothesis 1 is supported.
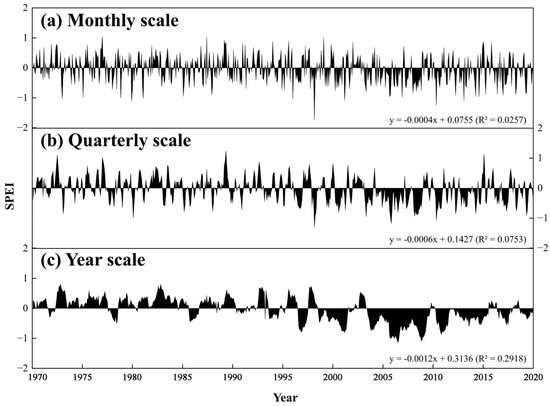
Figure 1.
SPEI at different time scales in China, 1971−2020, (a) Monthly scale; (b) Quarterly scale; (c) Yearly scale.
4.3. Results of Baseline Regression Analyses
Referring to accepted practice, the benchmark regression gradually adds control variables at both the forestry level and the provincial economic level for regression [78,79]. Table 6 details the regression results of the bidirectional fixed-effect model of SPEI for the composite index of the forest industry, which includes provincial and year fixed effects. In Column (1), we only controlled provincial fixed effects and year fixed effects. The regression results show that the SPEI had a positive impact on the resilience of the forest industry. In Columns (2) and (3), on the basis of controlling the fixed effects of provinces and years, we gradually introduced control variables, including forest area, number of employees in the forestry system at the end of the year, forest ecological environment, urbanization rate, urban–rural income gap, average years of education in rural areas, and economic development level in each province. After gradually adding these control variables, the SPEI had an increasingly significant positive promoting effect on the comprehensive index of the forest industry. In Column (3), in particular, when all control variables were controlled, the SPEI increased by 1%, and the forest industry composite index increased by 0.01 units. The results showed that SPEI had a positive effect on the comprehensive index of forest industry, that is, drought would significantly inhibit the development of forest industry. Therefore, Hypothesis 2 is supported.
Table 6.
Regression results of SPEI on the forest industry composite index.
Observe the other control variables. First of all, looking at the situation at the economic level, the improvement of economic development level has a slight inhibitory effect on the forest industry, which may be due to the phenomenon of resources being tilted to other industries in the process of economic development. The income gap between urban and rural areas is significant at the 1% level, indicating that the widening of the income gap between urban and rural areas significantly inhibits the forest industry. Secondly, looking at the situation at the social level, the inhibitory effect of urbanization rate on the forest industry has not passed the significance test. The effect of rural education level on the forest industry is not significant; however, it is worth noting that the increase in the number of employees in the forestry system has a significant positive driving effect on the development of the forest industry. Finally, at the ecological level, the forest area has no significant effect on the forest industry, but the improvement of forest ecological environment has a strong and significant effect on the development of the forest industry. In conclusion, drought has an inhibitory effect on the forest industry. The increase in the number of employees in the forestry system and the improvement in the ecological environment in the forest region can effectively promote the development of the forest industry, while the widening of the urban–rural income gap and the improvement of the economic development level have an inhibitory effect on the forest industry. For specific inhibitory regions, see the heterogeneity test section below.
4.4. Results of Endogenetic Processing and Robustness Test
4.4.1. Results of Endogenous Processing
The endogenous processing results obtained from the two-stage instrumental variable approach are presented in Table 7 and Table 8.
Table 7.
Regression results of instrumental variable I (precipitation).
Table 8.
Regression results of instrumental variable II (NDVI).
In the first-stage regression of Instrumental Variable I (precipitation), the results demonstrate a significant positive correlation between precipitation and the standardized precipitation–evapotranspiration index (SPEI). Specifically, an increase in precipitation corresponds to a higher SPEI score, which aligns with real-world observations. The second-stage regression results are congruent with the aforementioned baseline regression findings, thereby validating the robustness of the model. Regarding Instrumental Variable II (the normalized difference vegetation index; NDVI), the first-stage regression reveals a significant positive relationship between the normalized vegetation index and the SPEI, in accordance with practical observations. The second-stage regression results further corroborate the robustness of the baseline regression results, highlighting the stability and reliability of the overall analytical framework.
4.4.2. Results of Robustness Test
Table 9.
Robustness Test I (replacement of explanatory variables).
Table 10.
Robustness Test II (regression with system GMM model).
Table 11.
Robustness Test III (excluding effects of the financial crisis and the COVID–19 pandemic).
Table 12.
Robustness Test IV (excluding outliers and 1% tailing treatment before and after).
In Table 9, the comprehensive index of the forest industry is delayed by one stage for the robustness test. In Column (1), with only the province fixed effect and year fixed effect controlled, the regression results show that the SPEI has a positive impact on the forest industry. In Column (2), after controlling for province fixed effects and year fixed effects variables, and controlling for all control variables, the results still showed that the SPEI had a positive influence on the forest industry, with the effect becoming increasingly pronounced. Table 10 uses the GMM model for regression. With or without control variables, the results show the positive impact of SPEI on the forest industry. After excluding the effects of the financial crisis and COVID-19 pandemic, Table 11 Columns (1) and (2) show that SPEI has a positive effect on the forest industry when only the fixed effects of provinces and years are controlled. The regression results of Table 11 Columns (3) and (4) show that, on the basis of the fixed effects of controlled provinces and years, when all control variables were controlled, the SPEI showed a more significant positive effect on the forest industry. The regression results in Column (4), in particular, were significant at the 5% level after excluding the COVID-19 pandemic. Table 12 reports the regression results after 1% tail reduction treatment of the samples and further removing the sample outliers. The findings indicate that in Column (1), where no control variables are incorporated, the SPEI exerts a positive influence on the forest industry. Subsequently, when all control variables are introduced in Column (2), the coefficient gradually increases to 0.010. This suggests that, at the 10% significance level, the SPEI demonstrates a significant positive association with the forest industry. These outcomes are consistent with the baseline regression results, thereby validating the robustness of the baseline regression findings.
4.5. Results of Heterogeneity Analysis
The results of the heterogeneity analysis are shown in Table 13.
Table 13.
Heterogeneity analysis.
When all control variables are added, it is concluded that in inland areas, SPEI is significantly positive at the 5% level, but in coastal areas, SPEI does not show a significant impact on its forest industry. It indicates that from coastal to inland, the promoting effect of SPEI on the forest industry gradually increases.
In addition, the increase in the number of employees in the inland forestry system at the end of the year and the improvement of the forest ecology environment have a significant role in promoting the forest industry. The widening of the income gap between urban and rural areas, the average years of education in rural areas, and the level of economic development have a significant inhibitory effect on the inland forest industry. However, the effect of these control variables in coastal areas is not obvious, and even the increase in average years in education in rural areas will promote the development of forest industry in coastal areas. This may be because the subsidy measures in inland areas are not enough, resulting in the liberation of specialized talents, which in turn inhibits the development of the forest industry.
4.6. Mechanism Testing
This study tested three mechanism variables, namely the occurrence area of forest pests and diseases, number of forestry irrigation facilities, and labor transfer rate, to explain the intermediate mechanism of drought on forest industry.
As shown in Table 14, the coefficient of SPEI in Column (2) is significantly negative at the 5% level, indicating that drought will significantly increase the occurrence area of forest diseases and insect pests. Hence, Hypothesis 3 is supported.
Table 14.
Mechanism inspection.
In Column (3), the coefficient of SPEI is significantly negative at the 5% level, implying that drought stress will lead to a significant increase in the number of forestry irrigation facilities. So, Hypothesis 4 is supported.
In Column (4), the coefficient of SPEI is significantly negative at the 5% level, showing that the risk of labor transfer will be intensified after drought. We can see that Hypothesis 5 is supported.
5. Discussion
Our study reveals the influence process of drought on forest industry. Five hypotheses are all held to be true in this study.
It is evident from SPEI data that drought in China has increased significantly in the past 50 years, and that drought has a significant restraining effect on Chinese forest industry. Moreover, inland areas are more vulnerable to drought than coastal areas. This difference between coastal and inland areas may be closely related to the economic imbalance between the two regions [80,81].
Drought will lead to an increase in the occurrence area of forest pests and diseases, forming a compound eco-economic loss effect, thus inhibiting the development of forest industry. Kotlarz and Bejger mentioned increasing climate change effects, like pets and diseases, may reduce the timber supply in the forest industry, thus cause significant economic impacts [34]. The outbreak of insects would lead to a large number of tree deaths, and have a negative impact on the forest industry [35]. Drought stress can reduce tree resistance and make forest ecosystems more vulnerable to pests and diseases, negatively affecting the forest industry [36]. Therefore, drought will inhibit the development of the forest industry by increasing pests and diseases.
Drought can drive the increase in irrigation facilities. Efficient irrigation may mitigate biological damage caused by drought, so as to resist part of the economic losses. It has been established that a moderate irrigation strategy could optimize forest growth [39]. Fertilized and dry-season irrigated plantations promote timber production and carbon storage [40]. Therefore, drought will reduce the loss of the forest industry by demanding more irrigation facilities.
Drought may cause labor to migrate from forest sector to non-forest sectors, leading to lower production in the forest industry. Labor transfer effects caused by drought are more obvious in the areas where the income gap is relatively big between rural and urban regions, e.g., inland areas. Labor force transfer would lead to the reduction in the rural forestry production labor force, increases in the price of forestry labor force, and thus increases in the production cost of forestry [43]. Meanwhile, the migration of the labor force will also lead the left-behind farmers to switch to low-labor-intensity grain cultivation to ensure their basic food and clothing needs, ultimately suppressing the development of the forestry industry [44]. Therefore, droughts could constrain the development of forestry by increasing the transfer rate of the labor force away from forest industry.
6. Conclusions
Our study reveals the internal mechanisms of drought event transmission to the forest industry through economic, social, and ecological dimensions. It adds to the forest resilience literature and expands the research dimension of climate change economics, providing theoretical support and practical paths for improving forest resilience and the sustainable management of forest resources.
In the long term, drought may alter the distribution of China’s forest resources. The forest industry will need to adapt to these changes by adjusting its operations and management practices. The findings of this study provide two important lessons for policy-making related to resilience reconstruction of forest industry under climate risk. First, as drought tends to occur more frequently, policy-makers should make further efforts to strengthen irrigation facilities and water-saving technology. Second, since drought intensifies labor force transfer, there is a need to develop tailored social protection schemes that retains forest workers in the forest sector during and after drought.
This study has potential limitations. Firstly, the economic and social data are collected at the provincial level. The findings are relevant at provincial level, rather than at a smaller scale. It has been found in this study that the impacts of drought vary between different provinces. Further studies on the effects of drought within one or more nearby provinces may investigate the mechanism underlying the effect of drought on the forest industry with more relevant variables. Secondly, this study focuses on only one type of extreme weather events, which might affect forest resilience. Future research may explore, e.g., how other extreme weather events could affect forest industry, and how two or more extreme weather events together affect forest resilience.
Author Contributions
Conceptualization, L.W.; methodology, L.W.; formal analysis, X.W.; data curation, X.W.; writing—original draft preparation, X.W.; writing—review and editing, W.W.; supervision, L.W.; funding acquisition, L.W. All authors have read and agreed to the published version of the manuscript.
Funding
This research was funded by the National Key Research and Development Program of China (Grant No. 2023YFE0105100).
Data Availability Statement
The original data presented in the study are openly available in the Global SPEI database at https://spei.csic.es/, and CNKI-CSYD at https://data.cnki.net/.
Conflicts of Interest
The authors declare no conflict of interest.
References
- Lee, H.; Calvin, K.; Dasgupta, D.; Krinner, G.; Mukherji, A.; Thorne, P.W.; Trisos, C.; Romero, J.; Aldunce, P.; Barrett, K.; et al. Climate Change 2023 Synthesis Report; IPCC: Geneva, Switzerland, 2023; pp. 35–115. [Google Scholar] [CrossRef]
- Chaudhary, T.; Xi, W.; Subedi, M.; Rideout-Hanzak, S.; Su, H.; Dewez, N.P.; Clarke, S.; Thom, D. East Texas forests show strong resilience to exceptional drought. Forestry 2023, 96, 326–339. [Google Scholar] [CrossRef]
- Liu, X.; Wang, S.; Zhou, Y.; Wang, F.; Li, W.; Liu, W. Regionalization and Spatiotemporal Variation of Drought in China Based on Standardized Precipitation Evapotranspiration Index (1961–2013). Adv. Meteorol. 2015, 2015, 1–18. [Google Scholar] [CrossRef]
- Smith, C.; Baker, J.C.A.; Spracklen, D.V. Tropical deforestation causes large reductions in observed precipitation. Nature 2023, 615, 270–275. [Google Scholar] [CrossRef] [PubMed]
- China, Ministry of Water Resources of the People’s Republic of China. Bulletin of Flood and Drought Disasters in China. Available online: http://www.mwr.gov.cn/sj/tjgb/zgshzhgb/ (accessed on 28 April 2025).
- Xinhua. China’s Man-Made Forest, Grassland Areas Lead Globally. Available online: https://english.www.gov.cn/english.www.gov.cn/news/202503/15/content_WS67d4b235c6d0868f4e8f0d47.html (accessed on 28 April 2025).
- Flores, B.M.; Montoya, E.; Sakschewski, B.; Nascimento, N.; Staal, A.; Betts, R.A.; Levis, C.; Lapola, D.M.; Esquível-Muelbert, A.; Jakovac, C.; et al. Critical transitions in the Amazon forest system. Nature 2024, 626, 555–564. [Google Scholar] [CrossRef]
- Verkerk, P.J.; Costanza, R.; Hetemäki, L.; Kubiszewski, I.; Leskinen, P.; Nabuurs, G.J.; Potočnik, J.; Palahí, M. Climate-Smart Forestry: The missing link. For. Policy Econ. 2020, 115, 102164. [Google Scholar] [CrossRef]
- Chen, C.; Ye, F.; Xiao, H.; Xie, W.; Liu, B.; Wang, L. The digital economy, spatial spillovers and forestry green total factor productivity. J. Clean. Prod. 2023, 405, 136890. [Google Scholar] [CrossRef]
- Wu, H.; Su, X.; Huang, S.; Singh, V.P.; Zhou, S.; Tan, X.; Hu, X. Decreasing dynamic predictability of global agricultural drought with warming climate. Nat. Clim. Change 2025, 15, 411–419. [Google Scholar] [CrossRef]
- Yuan, X.; Chen, X.; Ochege, F.U.; Hamdi, R.; Tabari, H.; Li, B.; He, B.; Zhang, C.; De Maeyer, P.; Luo, G. Weakening of global terrestrial carbon sequestration capacity under increasing intensity of warm extremes. Nat. Ecol. Evol. 2024, 9, 124–133. [Google Scholar] [CrossRef]
- Vicente-Serrano, S.M.; Peña-Angulo, D.; Beguería, S.; Domínguez-Castro, F.; Tomás-Burguera, M.; Noguera, I.; Gimeno-Sotelo, L.; El Kenawy, A. Global drought trends and future projections. Philos. Trans. R. Soc. A Math. Phys. Eng. Sci. 2022, 380, 20210285. [Google Scholar] [CrossRef]
- Arias, P.A.; Rivera, J.A.; Sörensson, A.A.; Zachariah, M.; Barnes, C.; Philip, S.; Kew, S.; Vautard, R.; Koren, G.; Pinto, I.; et al. Interplay between climate change and climate variability: The 2022 drought in Central South America. Clim. Change 2023, 177, 6. [Google Scholar] [CrossRef]
- Williams, A.P.; Cook, B.I.; Smerdon, J.E. Rapid intensification of the emerging southwestern North American megadrought in 2020–2021. Nat. Clim. Change 2022, 12, 232–234. [Google Scholar] [CrossRef]
- Markonis, Y.; Kumar, R.; Hanel, M.; Rakovec, O.; Máca, P.; AghaKouchak, A. The rise of compound warm-season droughts in Europe. Sci. Adv. 2021, 7, eabb9668. [Google Scholar] [CrossRef] [PubMed]
- Liu, C.; Yang, C.; Yang, Q.; Wang, J. Spatiotemporal drought analysis by the standardized precipitation index (SPI) and standardized precipitation evapotranspiration index (SPEI) in Sichuan Province, China. Sci. Rep. 2021, 11, 1280. [Google Scholar] [CrossRef] [PubMed]
- Cao, S.; Zhang, L.; He, Y.; Zhang, Y.; Chen, Y.; Yao, S.; Yang, W.; Sun, Q. Effects and contributions of meteorological drought on agricultural drought under different climatic zones and vegetation types in Northwest China. Sci. Total Environ. 2022, 821, 153270. [Google Scholar] [CrossRef]
- Cohen, W.; Healey, S.; Yang, Z.; Stehman, S.; Brewer, C.; Brooks, E.; Gorelick, N.; Huang, C.; Hughes, M.; Kennedy, R.; et al. How Similar Are Forest Disturbance Maps Derived from Different Landsat Time Series Algorithms? Forests 2017, 8, 98. [Google Scholar] [CrossRef]
- Brodribb, T.J.; Powers, J.; Cochard, H.; Choat, B. Hanging by a thread Forests and drought. Science 2020, 368, 261–266. [Google Scholar] [CrossRef]
- McDowell, N.G.; Allen, C.D.; Anderson-Teixeira, K.; Aukema, B.H.; Bond-Lamberty, B.; Chini, L.; Clark, J.S.; Dietze, M.; Grossiord, C.; Hanbury-Brown, A.; et al. Pervasive shifts in forest dynamics in a changing world. Science 2020, 368, eaaz9463. [Google Scholar] [CrossRef]
- Gao, J.; Zhang, L.; Tang, Z.; Wu, S.; Battipaglia, G. A synthesis of ecosystem aboveground productivity and its process variables under simulated drought stress. J. Ecol. 2019, 107, 2519–2531. [Google Scholar] [CrossRef]
- Zhang, L.; Xiao, J.; Zhou, Y.; Zheng, Y.; Li, J.; Xiao, H. Drought events and their effects on vegetation productivity in China. Ecosphere 2016, 7, e01591. [Google Scholar] [CrossRef]
- Schwalm, C.R.; Williams, C.A.; Schaefer, K.; Baldocchi, D.; Black, T.A.; Goldstein, A.H.; Law, B.E.; Oechel, W.C.; Paw U, K.T.; Scott, R.L. Reduction in carbon uptake during turn of the century drought in western North America. Nat. Geosci. 2012, 5, 551–556. [Google Scholar] [CrossRef]
- Gessler, A.; Schaub, M.; McDowell, N.G. The role of nutrients in drought-induced tree mortality and recovery. New Phytol. 2016, 214, 513–520. [Google Scholar] [CrossRef] [PubMed]
- Sungmin, O.; Park, S.K. Global ecosystem responses to flash droughts are modulated by background climate and vegetation conditions. Commun. Earth Environ. 2024, 5, 88. [Google Scholar]
- Hisano, M.; Ghazoul, J.; Chen, X.; Chen, H.Y.H. Functional diversity enhances dryland forestproductivity under long-term climate change. Science 2024, 10, eadn4152. [Google Scholar]
- Li, Z.; Sun, F.; Wang, H.; Wang, T.; Feng, Y. Detecting the interactions between vegetation greenness and drought globally. Atmos. Res. 2024, 304, 107409. [Google Scholar] [CrossRef]
- Yu, Q.; Xu, C.; Wu, H.; Ke, Y.; Zuo, X.; Luo, W.; Ren, H.; Gu, Q.; Wang, H.; Ma, W.; et al. Contrasting drought sensitivity of Eurasian and North American grasslands. Nature 2025, 639, 114–118. [Google Scholar] [CrossRef]
- Fernández-de-Uña, L.; Martínez-Vilalta, J.; Poyatos, R.; Mencuccini, M.; McDowell, N.G. The role of height-driven constraints and compensations on tree vulnerability to drought. New Phytol. 2023, 239, 2083–2098. [Google Scholar] [CrossRef]
- Chitra-Tarak, R.; Xu, C.; Aguilar, S.; Anderson-Teixeira, K.J.; Chambers, J.; Detto, M.; Faybishenko, B.; Fisher, R.A.; Knox, R.G.; Koven, C.D.; et al. Hydraulically-vulnerable trees survive on deep-water access during droughts in a tropical forest. New Phytol. 2021, 231, 1798–1813. [Google Scholar] [CrossRef]
- Bose, A.K.; Gessler, A.; Büntgen, U.; Rigling, A. Tamm review: Drought-induced Scots pine mortality—trends, contributing factors, and mechanisms. For. Ecol. Manag. 2024, 561, 121873. [Google Scholar] [CrossRef]
- Allen, C.D.; Macalady, A.K.; Chenchouni, H.; Bachelet, D.; McDowell, N.; Vennetier, M.; Kitzberger, T.; Rigling, A.; Breshears, D.D.; Hogg, E.H.; et al. A global overview of drought and heat-induced tree mortality reveals emerging climate change risks for forests. For. Ecol. Manag. 2010, 259, 660–684. [Google Scholar] [CrossRef]
- Breshears, D.D.; Cobb, N.S.; Rich, P.M.; Price, K.P.; Allen, C.D.; Balice, R.G.; Romme, W.H.; Kastens, J.H.; Floyd, M.L.; Belnap, J.; et al. Regional vegetation die-off in response to global-change-type drought. Proc. Natl. Acad. Sci. USA 2005, 102, 15144–15148. [Google Scholar] [CrossRef]
- Kotlarz, J.; Bejger, S. Estimation of the Short-Term Impact of Climate-Change-Related Factors on Wood Supply in Poland in 2023–2025. Forests 2024, 15, 108. [Google Scholar] [CrossRef]
- Kurz, W.A.; Dymond, C.C.; Stinson, G.; Rampley, G.J.; Neilson, E.T.; Carroll, A.L.; Ebata, T.; Safranyik, L. Mountain pine beetle and forest carbon feedback to climate change. Nature 2008, 452, 987–990. [Google Scholar] [CrossRef] [PubMed]
- Keenan, R.J. Climate change impacts and adaptation in forest management: A review. Ann. For. Sci. 2015, 72, 145–167. [Google Scholar] [CrossRef]
- Yan, X.-L.; Dai, T.-F.; Jia, L.-M. Evaluation of the cumulative effect of drip irrigation and fertigation on productivity in a poplar plantation. Ann. For. Sci. 2018, 75, 5. [Google Scholar] [CrossRef]
- Yildiz, V.; Onen, M.O.; Arslan, C.; Hatipoglu, M.A. Drought Management and Planning for Water Resources. In Hydrology and Urban Water Supply; Water and Wastewater Management; Bahadir, M., Haarstrick, A., Eds.; Springer Cham: Cham, Swiss, 2024; pp. 87–98. [Google Scholar]
- Zhao, J.; Han, T.; Wang, C.; Jia, H.; Worqlul, A.W.; Norelli, N.; Zeng, Z.; Chu, Q. Optimizing irrigation strategies to synchronously improve the yield and water productivity of winter wheat under interannual precipitation variability in the North China Plain. Agric. Water Manag. 2020, 240, 106298. [Google Scholar] [CrossRef]
- Yang, L.; Lin, Y.; Kong, J.; Yu, Y.; He, Q.; Su, Y.; Li, J.; Qiu, Q. Effects of fertilization and dry-season irrigation on the timber production and carbon storage in subtropical Eucalyptus plantations. Ind. Crops Prod. 2023, 192, 116143. [Google Scholar] [CrossRef]
- Afridi, F.; Mahajan, K.; Sangwan, N. The Gendered Effects of Droughts Production Shocks and Labor Response in Agriculture. Labour Econ. 2022, 78, 102227. [Google Scholar] [CrossRef]
- LEWIS, W.A. Economic Development with Unlim.ited Supplies of Labour. Manch. Sch. 1954, 22, 139–191. [Google Scholar] [CrossRef]
- Wen, Y.; Feng, L.; Liu, W. Labor transfer, market development, and the outsourcing of forestry production by farmers: A case study in Fujian, China. Front. Sustain. Food Syst. 2023, 7, 1282444. [Google Scholar] [CrossRef]
- Qian, W.; Wang, D.; Zheng, L. The impact of migration on agricultural restructuring: Evidence from Jiangxi Province in China. J. Rural. Stud. 2016, 47, 542–551. [Google Scholar] [CrossRef]
- Partelow, S. A review of the social-ecological systems framework: Applications, methods, modifications, and challenges. Ecol. Soc. 2018, 23, 36. [Google Scholar] [CrossRef]
- Tavares, J.V.; Oliveira, R.S.; Mencuccini, M.; Signori-Müller, C.; Pereira, L.; Diniz, F.C.; Gilpin, M.; Marca Zevallos, M.J.; Salas Yupayccana, C.A.; Acosta, M.; et al. Basin-wide variation in tree hydraulic safety margins predicts the carbon balance of Amazon forests. Nature 2023, 617, 111–117. [Google Scholar] [CrossRef] [PubMed]
- Bhardwaj, K.; Shah, D.; Aadhar, S.; Mishra, V. Propagation of Meteorological to Hydrological Droughts in India. J. Geophys. Res. Atmos. 2020, 125, e2020JD033455. [Google Scholar] [CrossRef]
- Yao, N.; Zhao, H.; Li, Y.; Biswas, A.; Feng, H.; Liu, F.; Pulatov, B. National-Scale Variation and Propagation Characteristics of Meteorological, Agricultural, and Hydrological Droughts in China. Remote Sens. 2020, 12, 3407. [Google Scholar] [CrossRef]
- Xu, Z.; Wu, Z.; Shao, Q.; He, H.; Guo, X. From meteorological to agricultural drought: Propagation time and probabilistic linkages. J. Hydrol. Reg. Stud. 2023, 46, 101329. [Google Scholar] [CrossRef]
- Duan, A.; Zhong, Y.; Xu, G.; Yang, K.; Tian, B.; Wu, Y.; Bai, H.; Hu, E. Quantifying the 2022 extreme drought in the Yangtze River Basin using GRACE-FO. J. Hydrol. 2024, 630, 130680. [Google Scholar] [CrossRef]
- Smith, M.D.; Kate, D.W.; Holdrege, M.C.; Wilfahrt, P.; Collins, S.L.; Alan, K.; Knapp, O.E.S.; Dukes, J.S.; Richard, P.; Phillips, L.Y.; et al. Extreme drought impacts have been underestimated in grasslands and shrublands globally. Proc. Natl. Acad. Sci. USA 2024, 121, e2309881120. [Google Scholar] [CrossRef]
- Fang, W.; Huang, S.; Huang, Q.; Huang, G.; Wang, H.; Leng, G.; Wang, L. Identifying drought propagation by simultaneously considering linear and nonlinear dependence in the Wei River basin of the Loess Plateau, China. J. Hydrol. 2020, 591, 125287. [Google Scholar] [CrossRef]
- Vicente-Serrano, S.M.; Beguería, S.; López-Moreno, J.I. A Multiscalar Drought Index Sensitive to Global Warming: The Standardized Precipitation Evapotranspiration Index. J. Clim. 2010, 23, 1696–1718. [Google Scholar] [CrossRef]
- Tirivarombo, S.; Osupile, D.; Eliasson, P. Drought monitoring and analysis: Standardised Precipitation Evapotranspiration Index (SPEI) and Standardised Precipitation Index (SPI). Phys. Chem. Earth Parts A/B/C 2018, 106, 1–10. [Google Scholar] [CrossRef]
- Vicente-Serrano, S.M.; Van der Schrier, G.; Beguería, S.; Azorin-Molina, C.; Lopez-Moreno, J.-I. Contribution of precipitation and reference evapotranspiration to drought indices under different climates. J. Hydrol. 2015, 526, 42–54. [Google Scholar] [CrossRef]
- Beguería, S.; Vicente-Serrano, S.M.; Reig, F.; Latorre, B. Standardized precipitation evapotranspiration index (SPEI) revisited: Parameter fitting, evapotranspiration models, tools, datasets and drought monitoring. Int. J. Climatol. 2014, 34, 3001–3023. [Google Scholar] [CrossRef]
- The Climatic Research Unit of the University of East Anglia. High-Resolution Gridded Datasets (and Derived Products). Available online: https://crudata.uea.ac.uk/cru/data/hrg/index.htm#formats (accessed on 27 April 2025).
- Harris, I.; Osborn, T.J.; Jones, P.; Lister, D. Version 4 of the CRU TS monthly high-resolution gridded multivariate climate dataset. Sci. Data 2020, 7, 109. [Google Scholar] [CrossRef] [PubMed]
- Dong, P.W.; Zhang, X. Measurement Study on System Coupling between Forestry and Forest Ecosystems. China Soft Sci. 2013, 11, 178–184. [Google Scholar] [CrossRef]
- Fan, X. Research on the coupling of ecological environment and socio-economic development in resource-based cities: Based on scenario simulation method. Sustain. Cities Soc. 2024, 114, 105810. [Google Scholar] [CrossRef]
- Anderegg, W.R.L.; Konings, A.G.; Trugman, A.T.; Yu, K.; Bowling, D.R.; Gabbitas, R.; Karp, D.S.; Pacala, S.; Sperry, J.S.; Sulman, B.N.; et al. Hydraulic diversity of forests regulates ecosystem resilience during drought. Nature 2018, 561, 538–541. [Google Scholar] [CrossRef]
- Libório, M.P.; Karagiannis, R.; Diniz, A.M.A.; Ekel, P.I.; Vieira, D.A.G.; Ribeiro, L.C. The Use of Information Entropy and Expert Opinion in Maximizing the Discriminating Power of Composite Indicators. Entropy 2024, 26, 143. [Google Scholar] [CrossRef]
- Caravaggio, N. Economic growth and forest transition in Latin America. For. Policy Econ. 2022, 135, 102667. [Google Scholar] [CrossRef]
- Duan, W.; Hogarth, N.J.; Shen, J.; Zhang, Y.; Chen, Q. Effects of Rural-Urban Labour Migration on Household Forest Management in the Context of Rural Reform and Development in China. Small-Scale For. 2021, 20, 543–568. [Google Scholar] [CrossRef]
- Ma, L.; Wang, Q.; Zhu, Y.; Liu, Z. The Impact and Mechanism of New-Type Urbanization on High-Quality Forestry Development: A Case Study of the Yellow River Basin in China. Diversity 2024, 17, 7. [Google Scholar] [CrossRef]
- Mook, A.; Dwivedi, P. Exploring links between education, forest management intentions, and economic outcomes in light of gender differences in the United States. For. Policy Econ. 2022, 145, 102861. [Google Scholar] [CrossRef]
- Zhang, B.; Jiang, X. Research on forestry labor input measurement and forestry industry development in China. For. Econ. Rev. 2023, 5, 2–22. [Google Scholar] [CrossRef]
- Mäkelä, M. Environmental impacts and aspects in the forest industry: What kind of picture do corporate environmental reports provide? For. Policy Econ. 2017, 80, 178–191. [Google Scholar] [CrossRef]
- Seppälä, J.; Melanen, M.; Jouttijärvi, T.; Kauppi, L.; Leikola, N. Forest industry and the environment a life cycle assessment study from Finland. Resour. Conserv. Recycl. 1998, 23, 87–105. [Google Scholar] [CrossRef]
- Sun, P.; Ge, C.; Yao, R.; Bian, Y.; Yang, H.; Zhang, Q.; Xu, C.-Y.; Singh, V.P. Development of a nonstationary Standardized Precipitation Evapotranspiration Index (NSPEI) and its application across China. Atmos. Res. 2024, 300, 107256. [Google Scholar] [CrossRef]
- II, B.L.T.; Kasperson, R.E.; Matson, P.A.; McCarthy, J.J.; Corell, R.W.; Christensen, L.; Eckley, N.; Kasperson, J.X.; Luers, A.; Martello, M.L.; et al. A framework for vulnerability analysis in sustainability science. Proc. Natl. Acad. Sci. USA 2003, 100, 8074–8079. [Google Scholar]
- Feyisa, G.L.; Meilby, H.; Fensholt, R.; Proud, S.R. Automated Water Extraction Index: A new technique for surface water mapping using Landsat imagery. Remote Sens. Environ. 2014, 140, 23–35. [Google Scholar] [CrossRef]
- Gazol, A.; Camarero, J.J.; Vicente-Serrano, S.M.; Sánchez-Salguero, R.; Gutiérrez, E.; de Luis, M.; Sangüesa-Barreda, G.; Novak, K.; Rozas, V.; Tíscar, P.A.; et al. Forest resilience to drought varies across biomes. Glob. Change Biol. 2018, 24, 2143–2158. [Google Scholar] [CrossRef]
- Forzieri, G.; Dakos, V.; McDowell, N.G.; Ramdane, A.; Cescatti, A. Emerging signals of declining forest resilience under climate change. Nature 2022, 608, 534–539. [Google Scholar] [CrossRef]
- Wichitaksorn, N.; Choy, S.T.B.; Gerlach, R. A mixture of generalized hyperbolic distributions. Can. J. Stat. 2014, 43, 176–198. [Google Scholar]
- Wu, J.; Wang, J.; Hui, W.; Zhao, F.; Wang, P.; Su, C.; Gong, W. Physiology of Plant Responses to Water Stress and Related Genes: A Review. Forests 2022, 13, 324. [Google Scholar] [CrossRef]
- Lou, Z.; Zheng, Z.; Yan, N.; Jiang, X.; Zhang, X.; Chen, S.; Xu, R.; Liu, C.; Xu, L. Modification and Application of Bamboo-Based Materials: A Review—Part II: Application of Bamboo-Based Materials. Forests 2023, 14, 2266. [Google Scholar] [CrossRef]
- de Chaisemartin, C.; D’Haultfœuille, X. Two-way fixed effects and differences-in-differences estimators with several treatments. J. Econom. 2023, 236, 105480. [Google Scholar] [CrossRef]
- Schunck, R.; Perales, F. Within and between cluster effects in generalized linear mixed models A discussion of approaches and the xthybrid command. Stata J. 2017, 17, 89–115. [Google Scholar] [CrossRef]
- Liu, R.; Fan, J.; Dai, F. Comparison and Measurement of Economic Growth in Coastal Areas and Inland Provinces of China. China Financ. Econ. Rev. 2020, 9, 73–94. [Google Scholar]
- Wan, G.; Zhang, Y. Explaining the Poverty Difference between Inland and Coastal China: A Regression-based Decomposition Approach. Rev. Dev. Econ. 2008, 12, 455–467. [Google Scholar] [CrossRef]

Disclaimer/Publisher’s Note: The statements, opinions and data contained in all publications are solely those of the individual author(s) and contributor(s) and not of MDPI and/or the editor(s). MDPI and/or the editor(s) disclaim responsibility for any injury to people or property resulting from any ideas, methods, instructions or products referred to in the content. |
© 2025 by the authors. Licensee MDPI, Basel, Switzerland. This article is an open access article distributed under the terms and conditions of the Creative Commons Attribution (CC BY) license (https://creativecommons.org/licenses/by/4.0/).