
Spatiotemporal Variations of Fractional Vegetation Coverage and Its Driving Mechanisms in Southwestern China

Abstract
1. Introduction
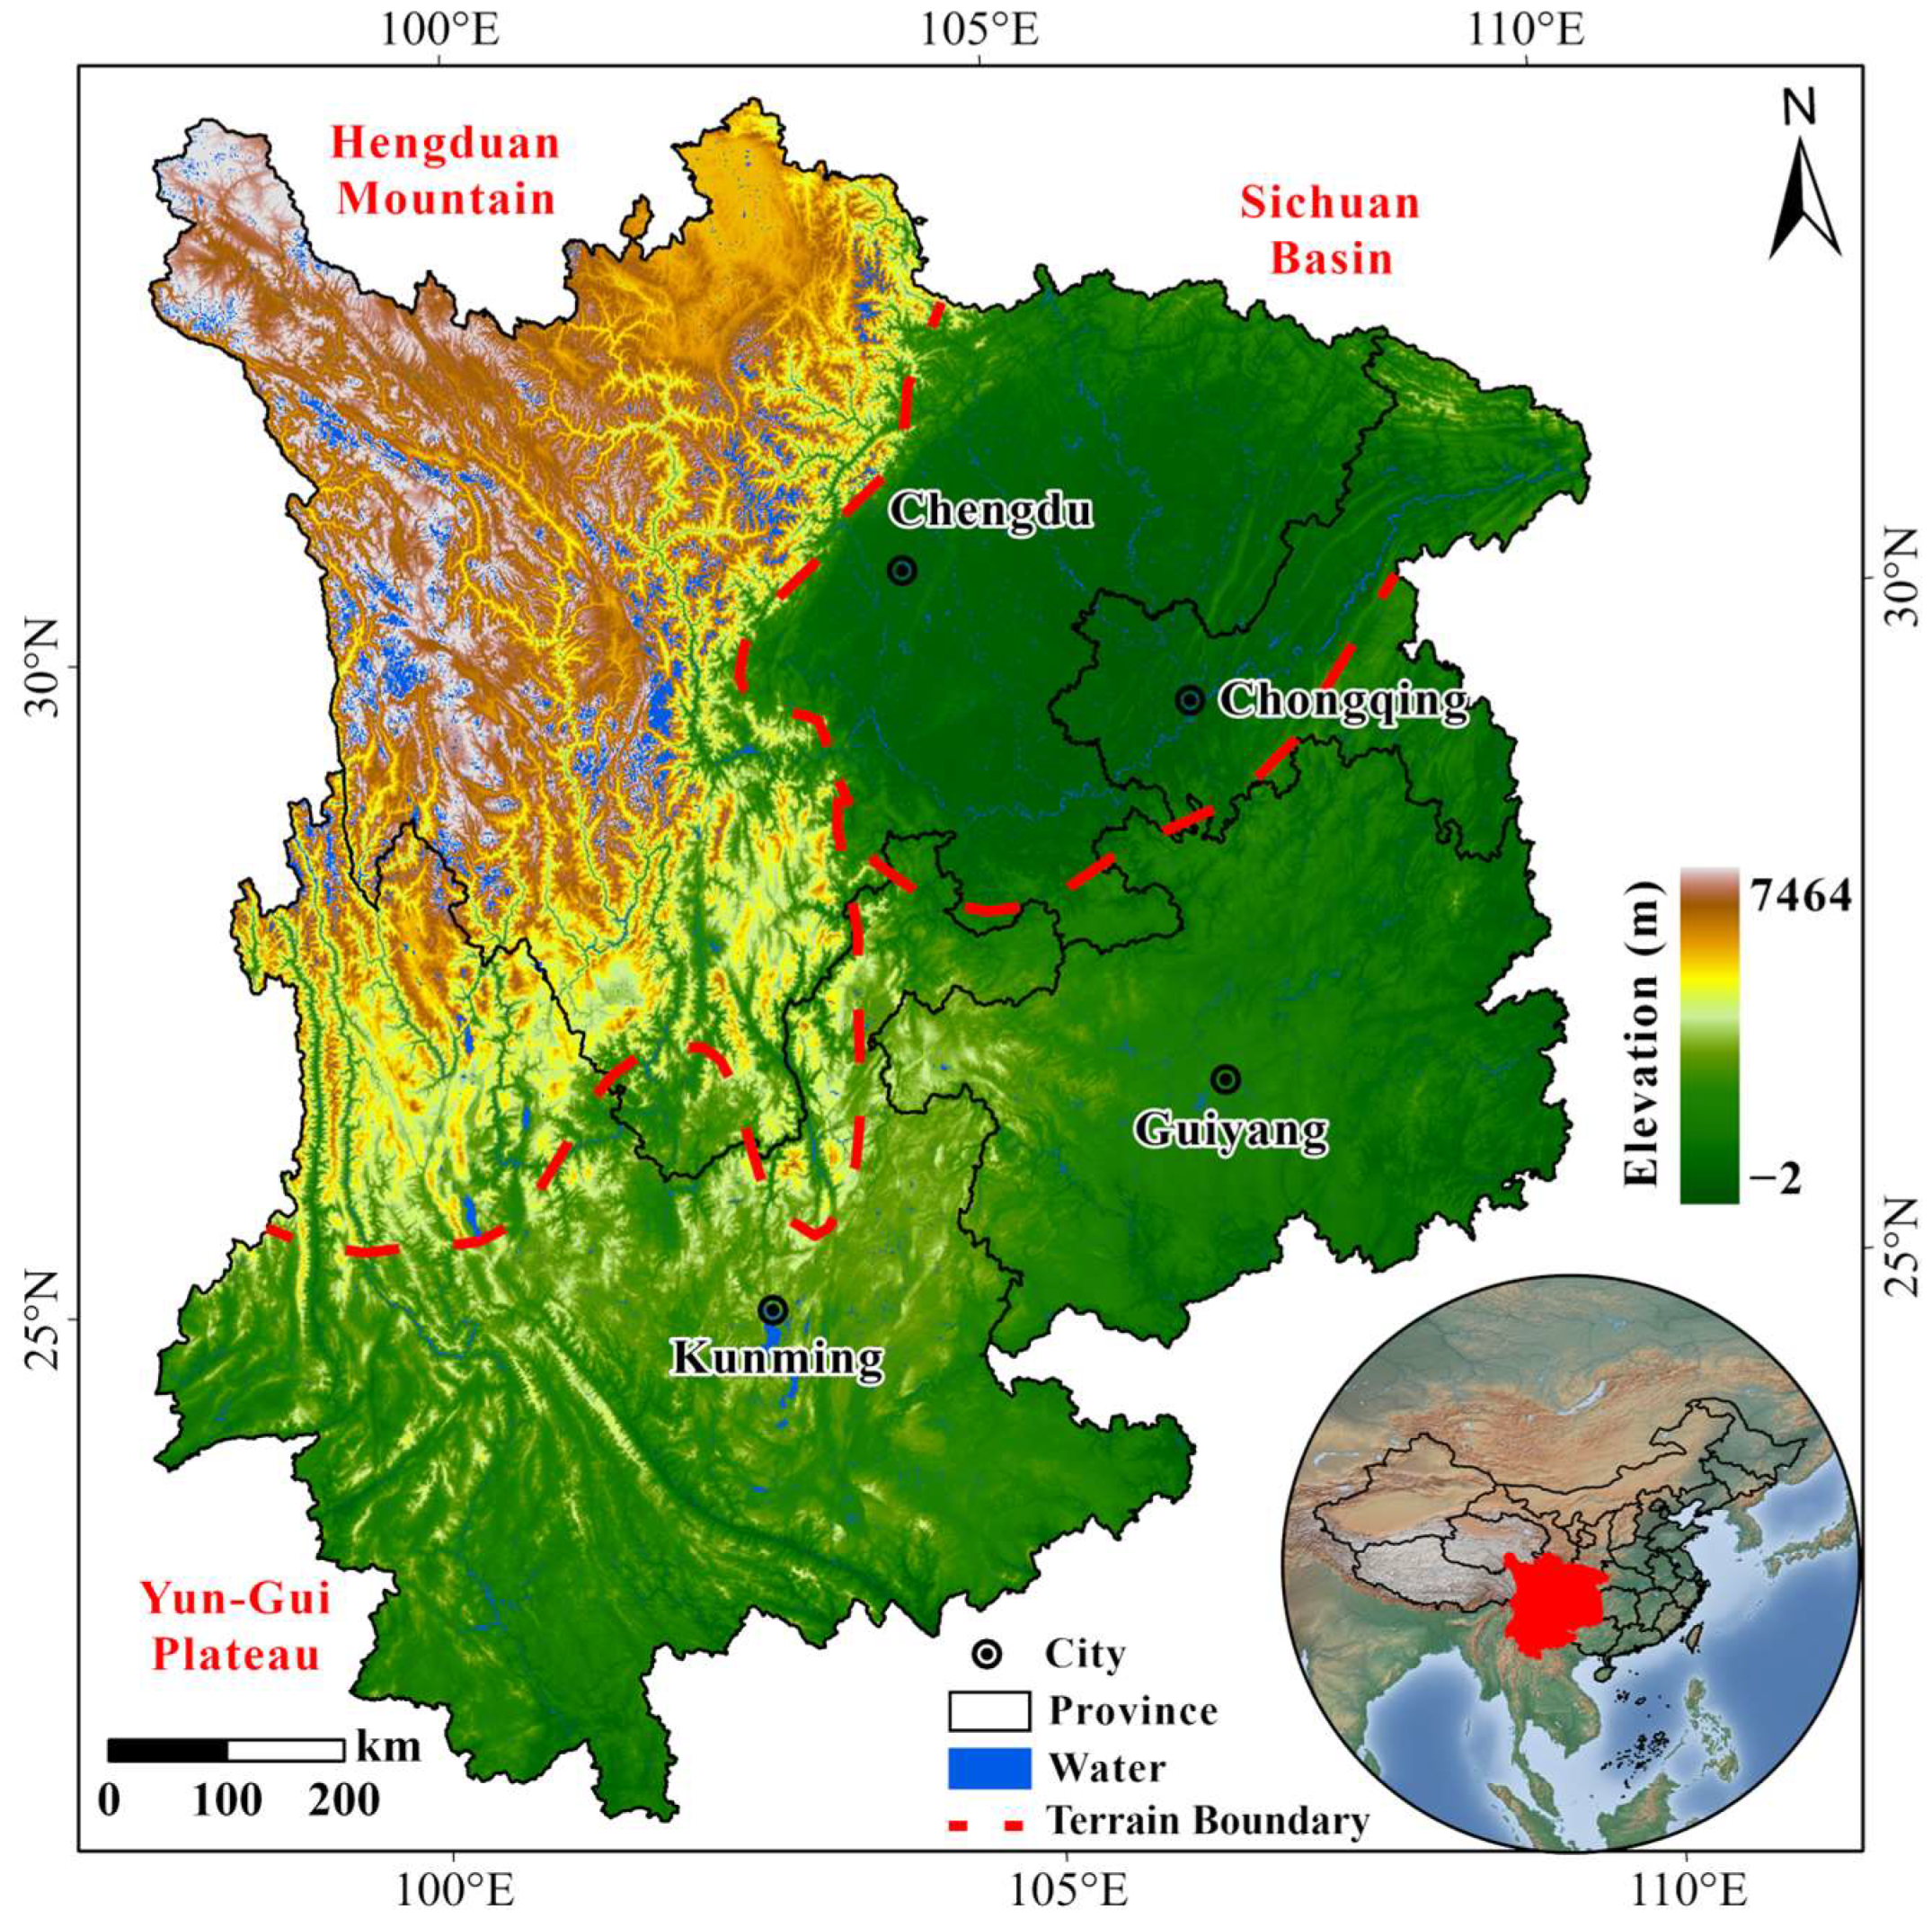
2. Study Area
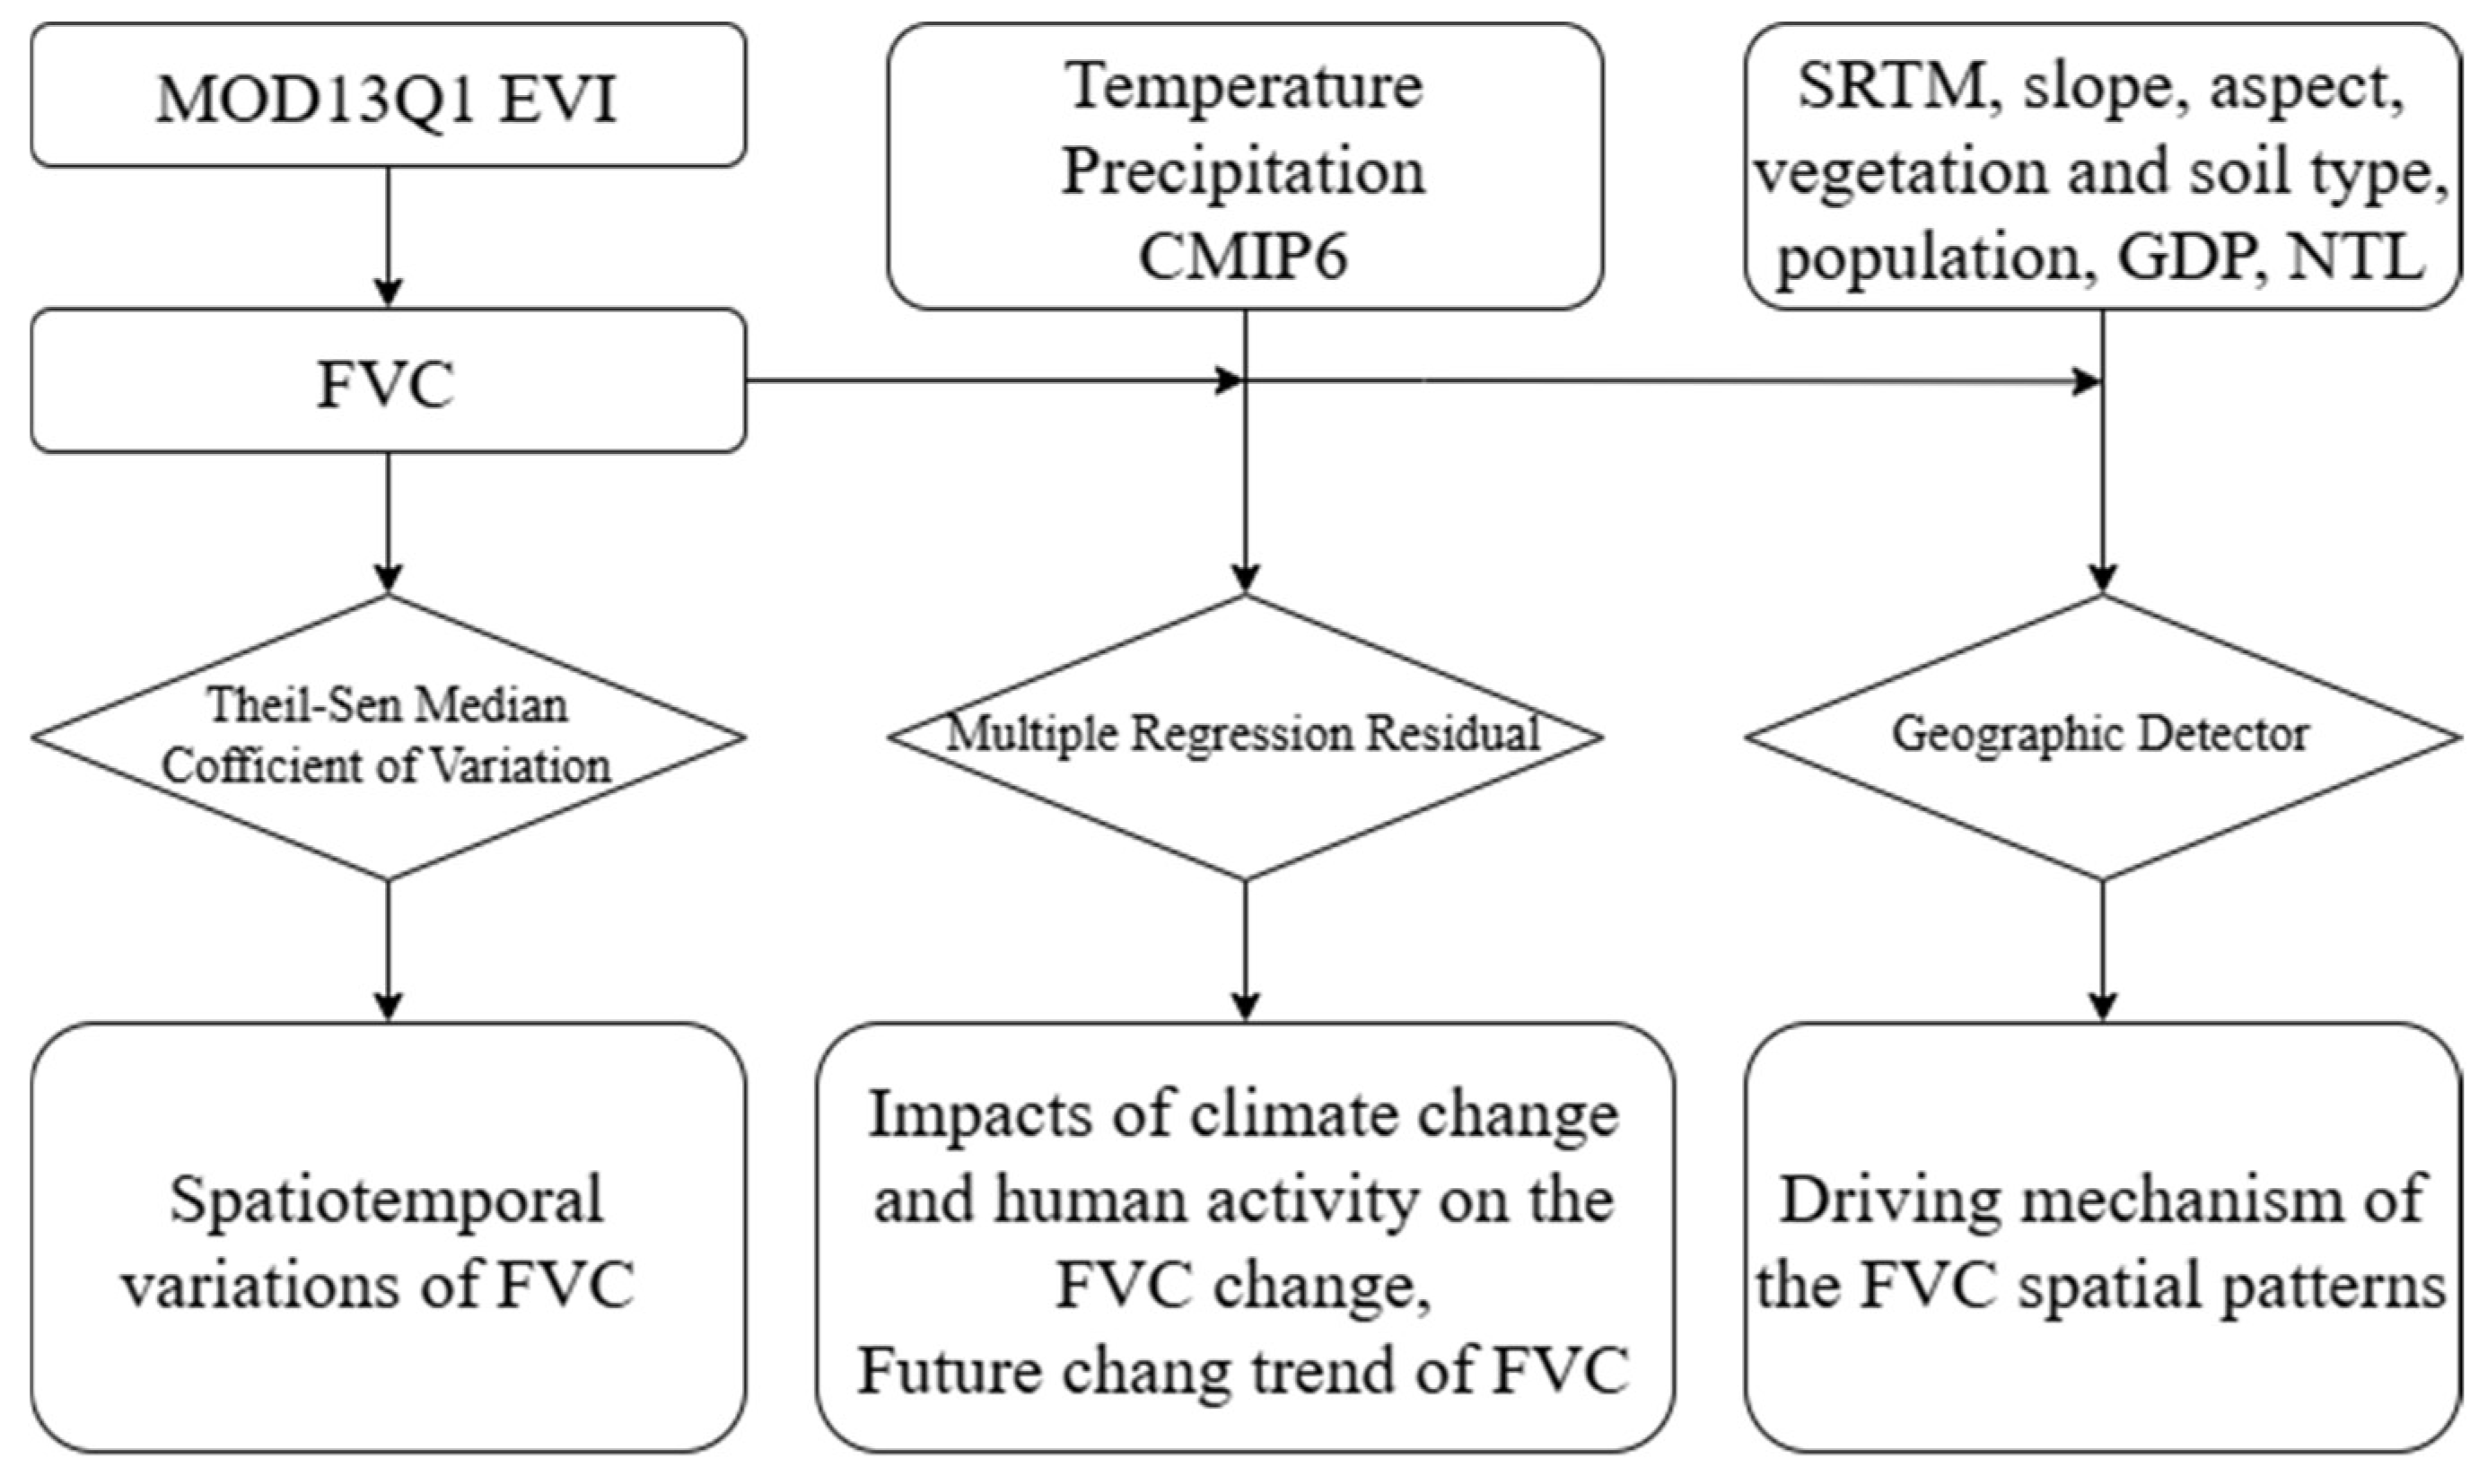
3. Data and Methods
3.1. Data Sources
3.2. FVC Calculation
3.3. Theil–Sen Median Analysis and Mann–Kendall Test
3.4. Coefficient of Variation
3.5. Multiple Regression Residual Analysis
3.6. Geographic Detector
4. Results
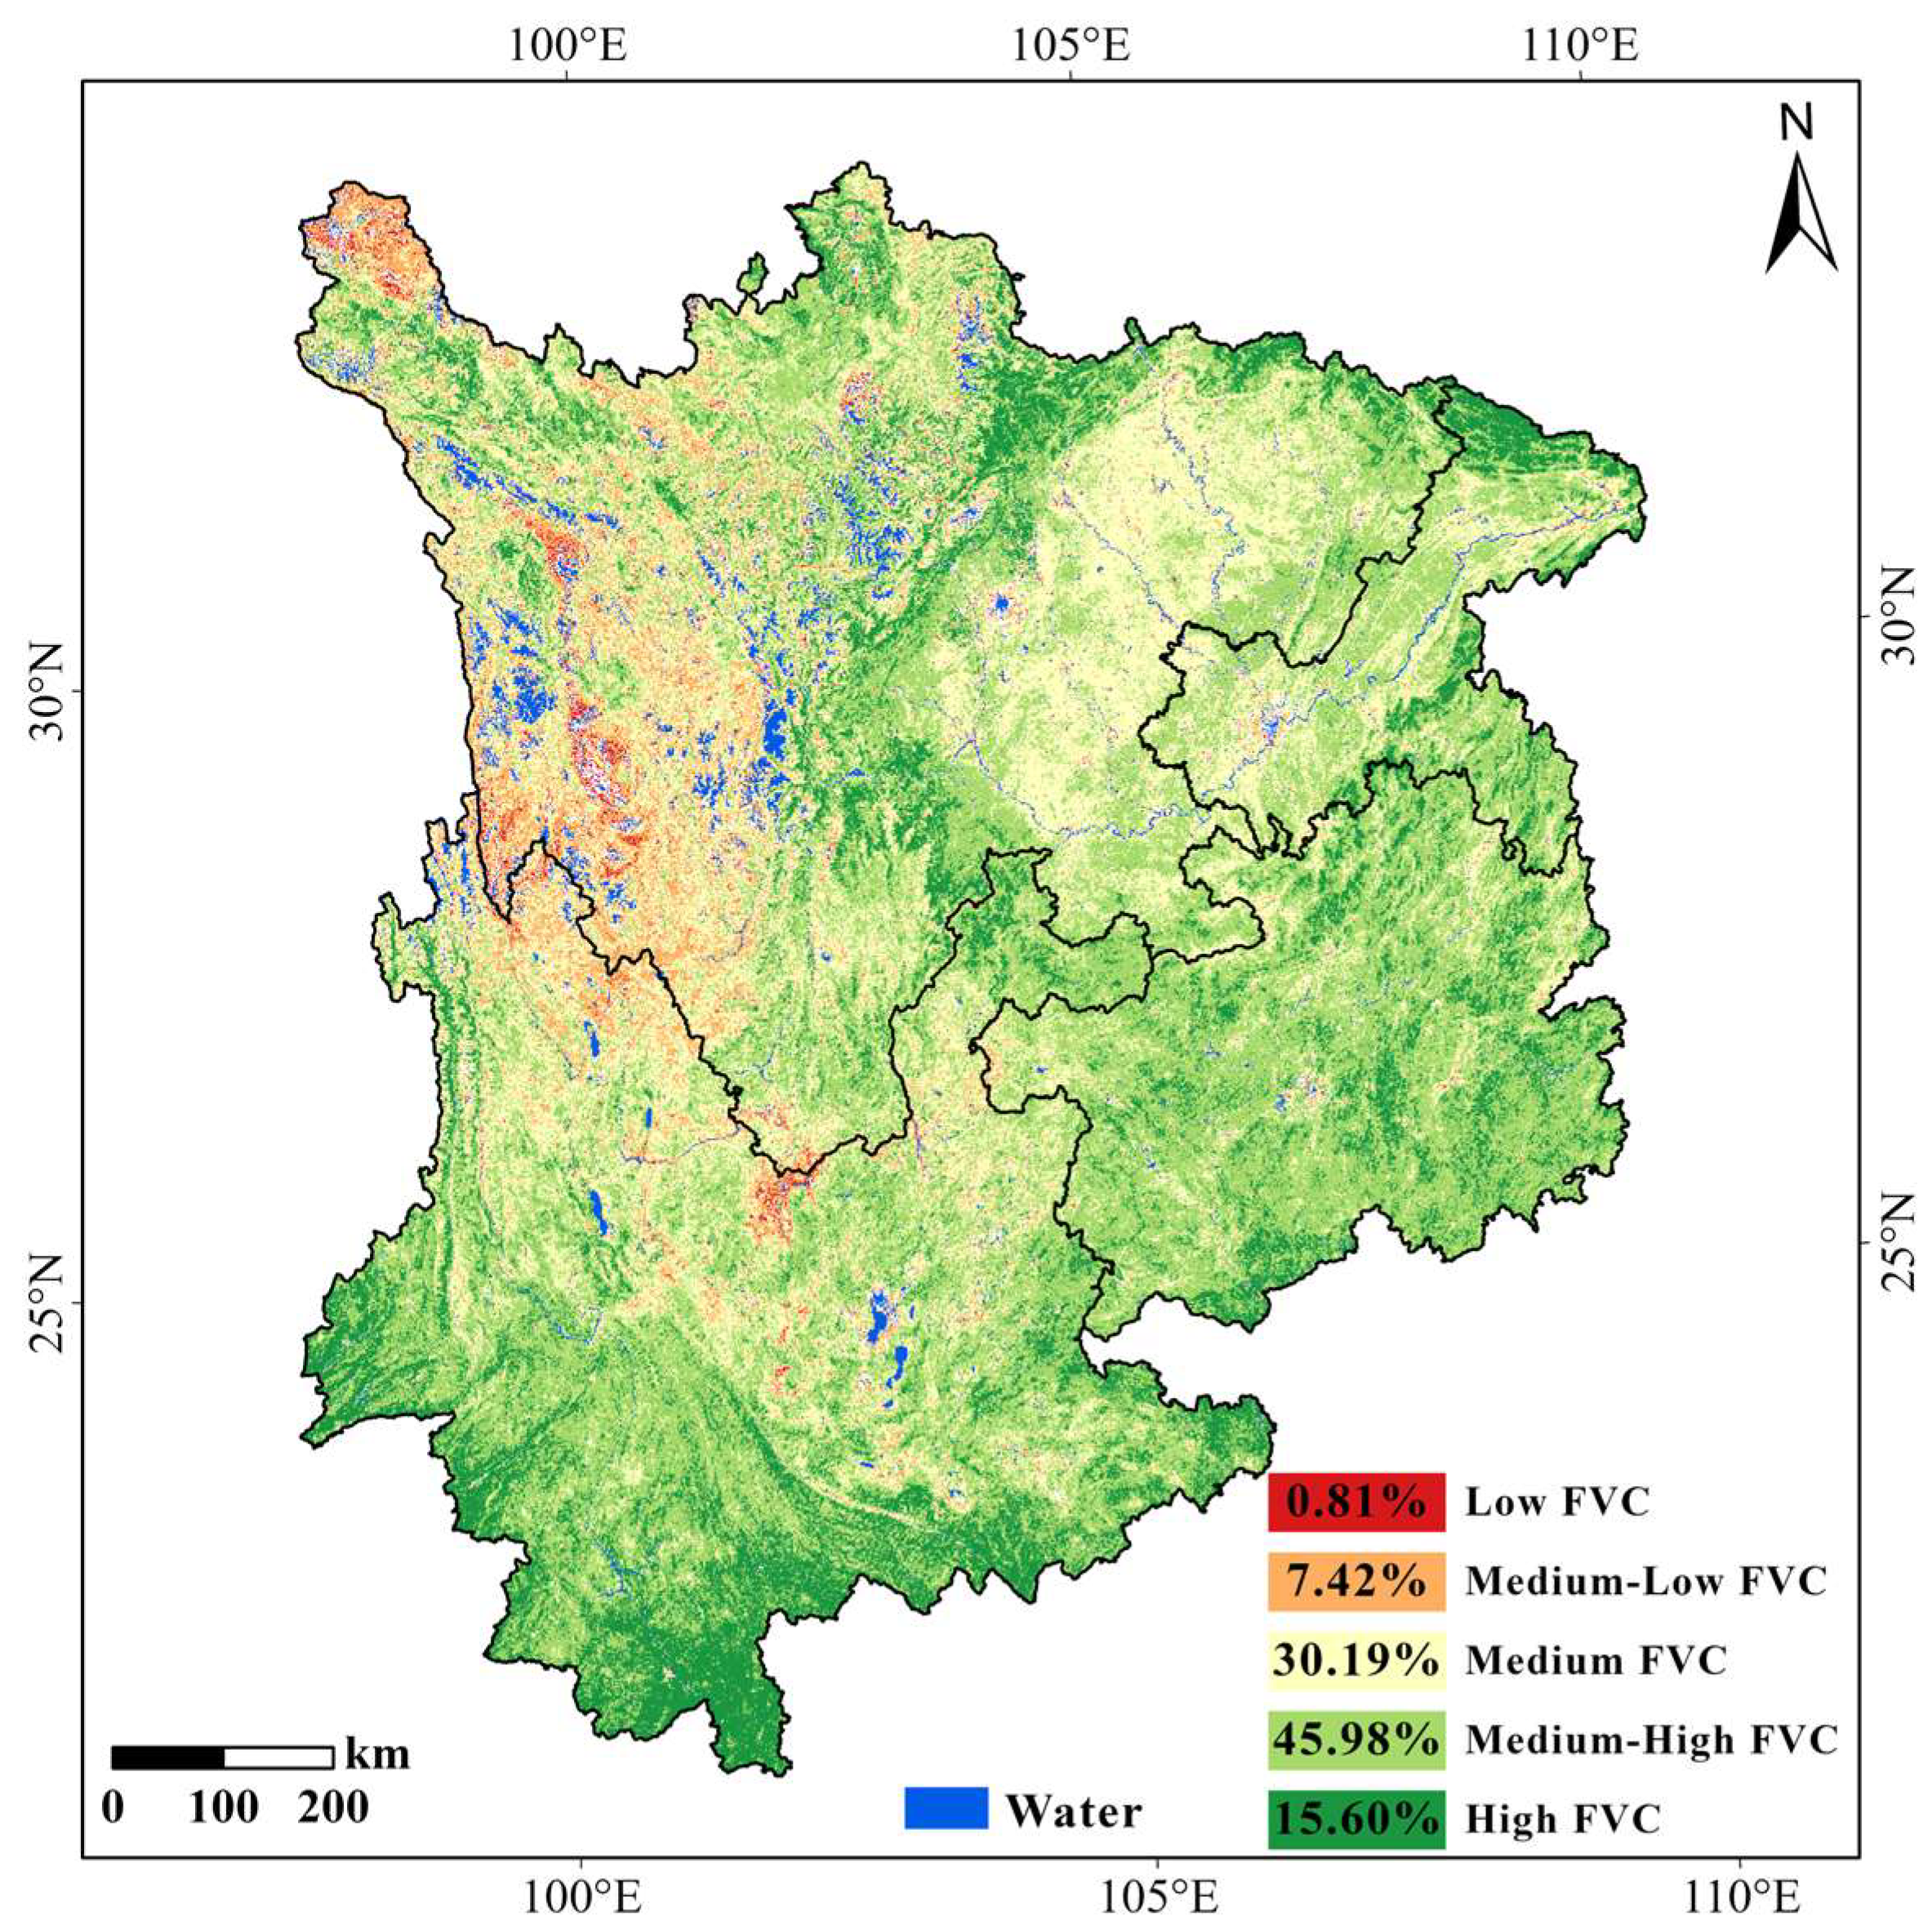
4.1. FVC Spatial Patterns
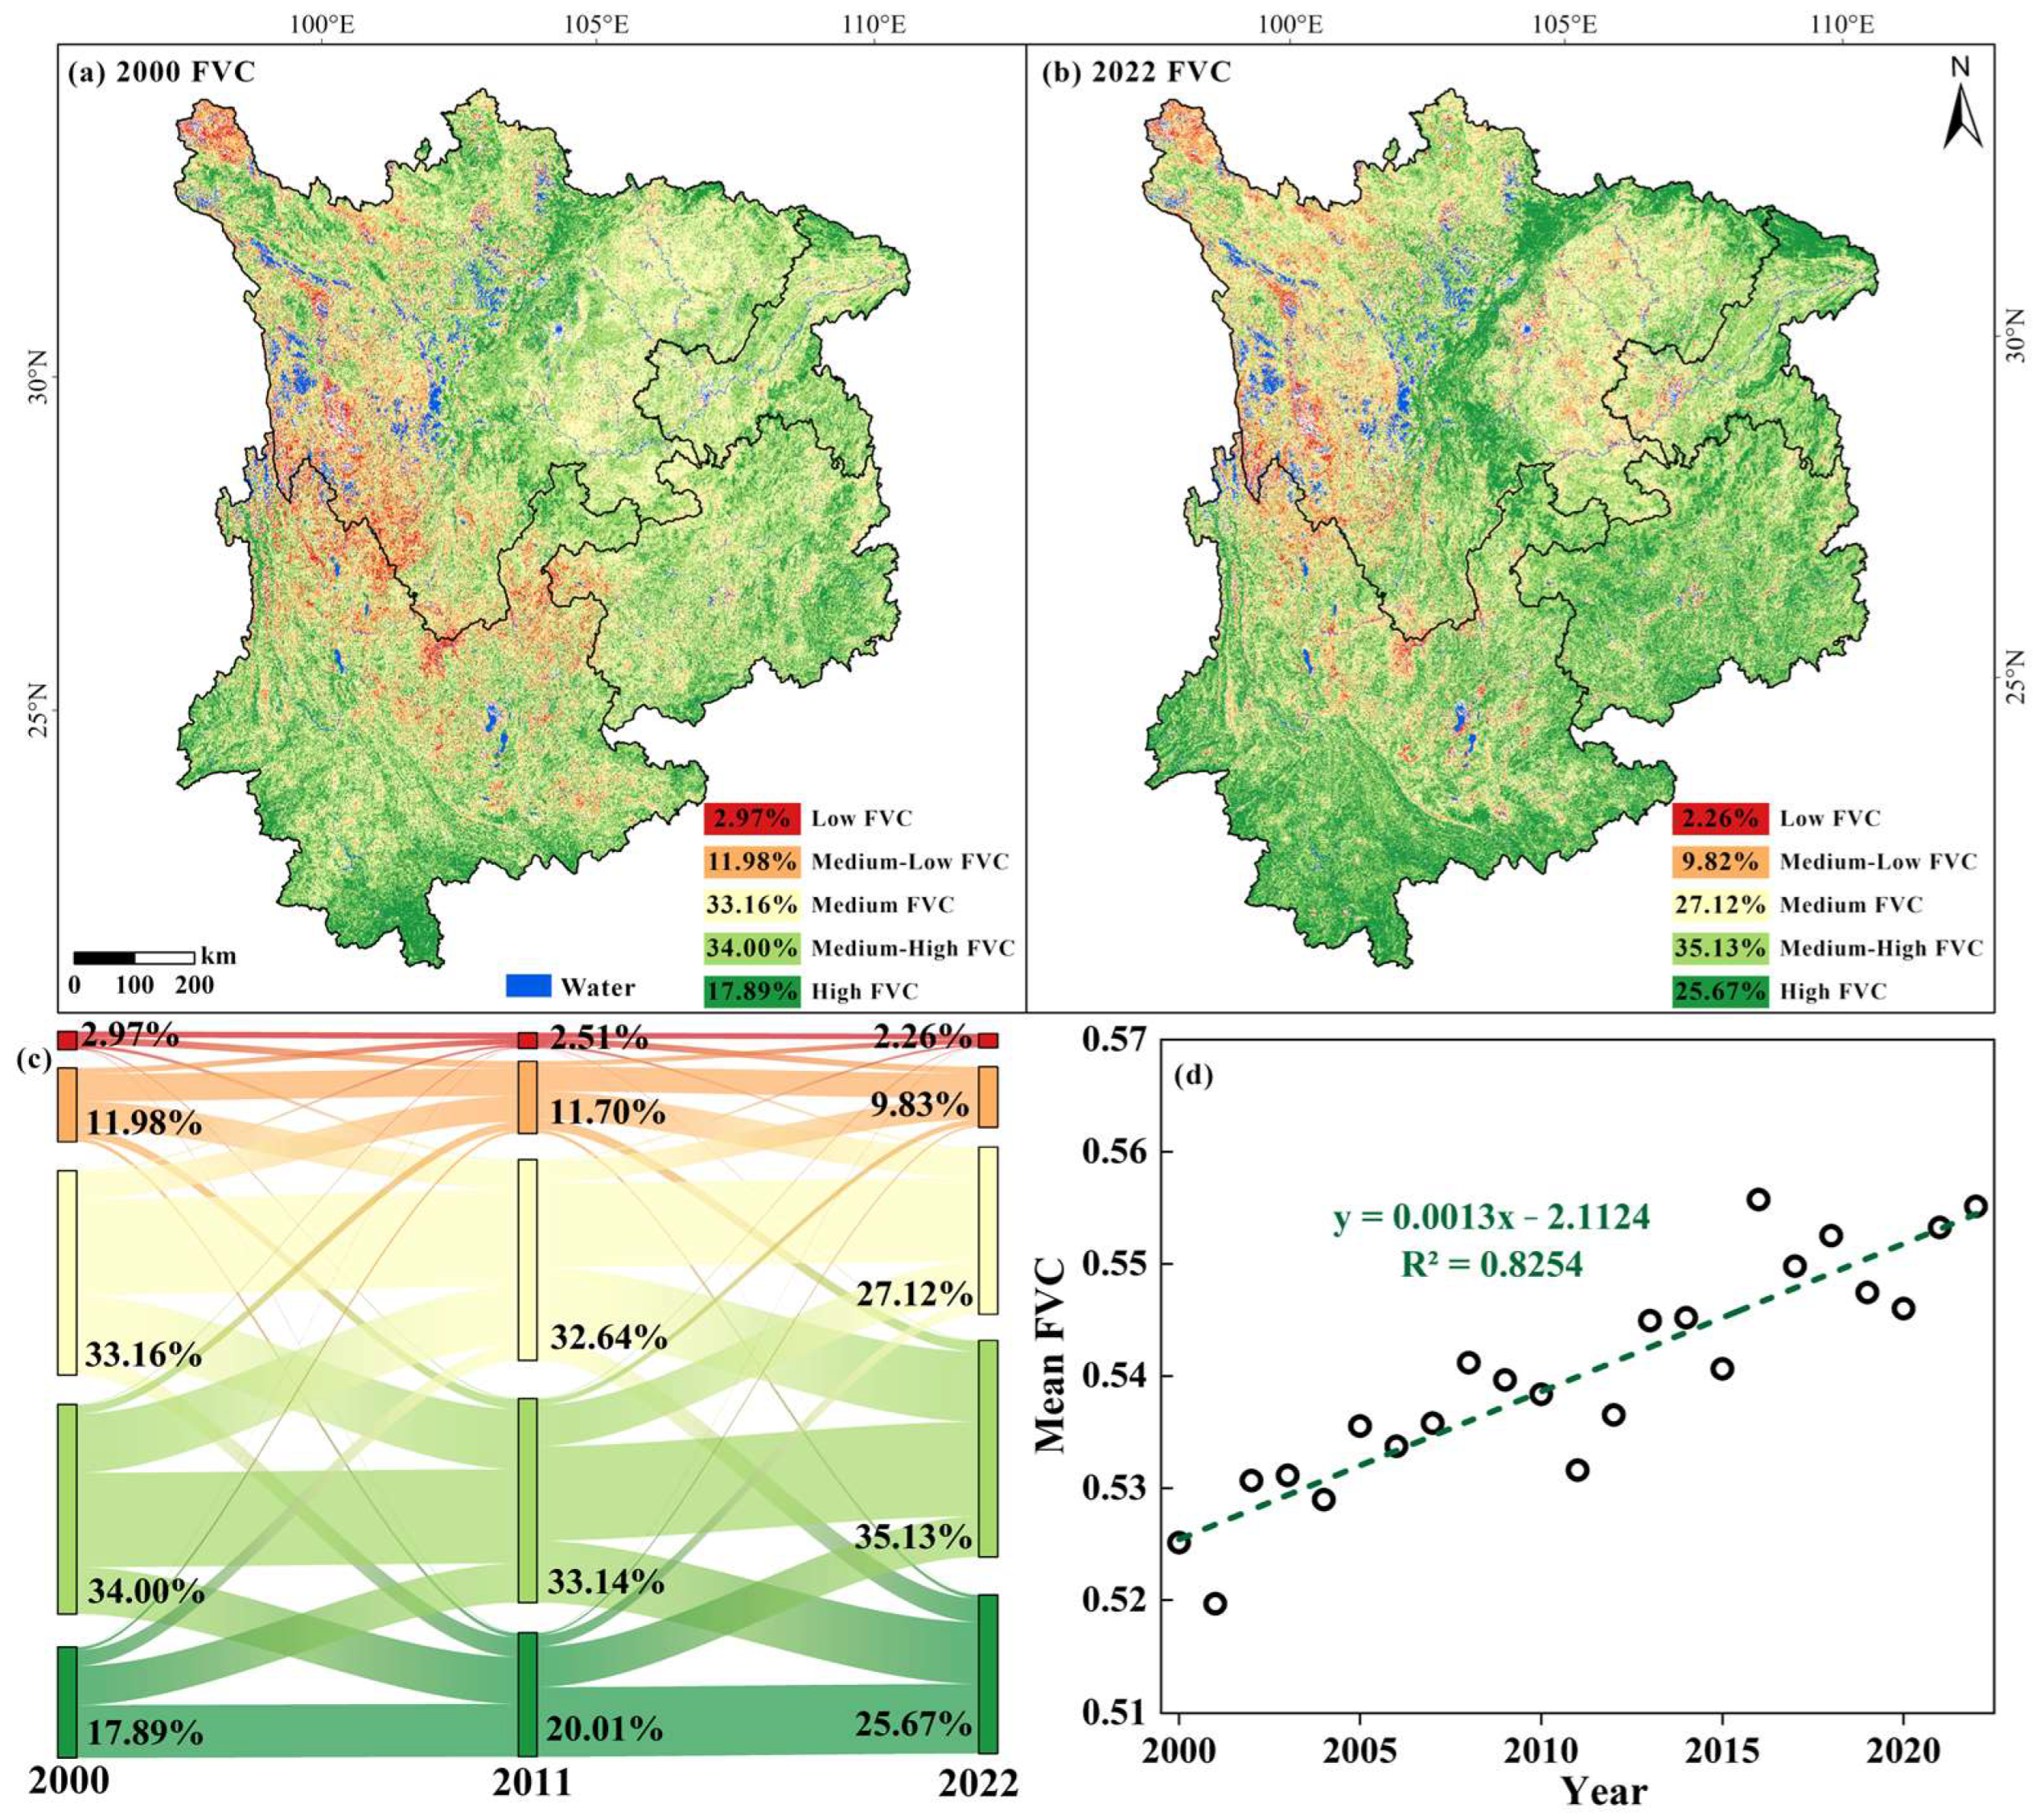
4.2. FVC Temporal Dynamics
4.3. Change Trend for FVC and Its Stability
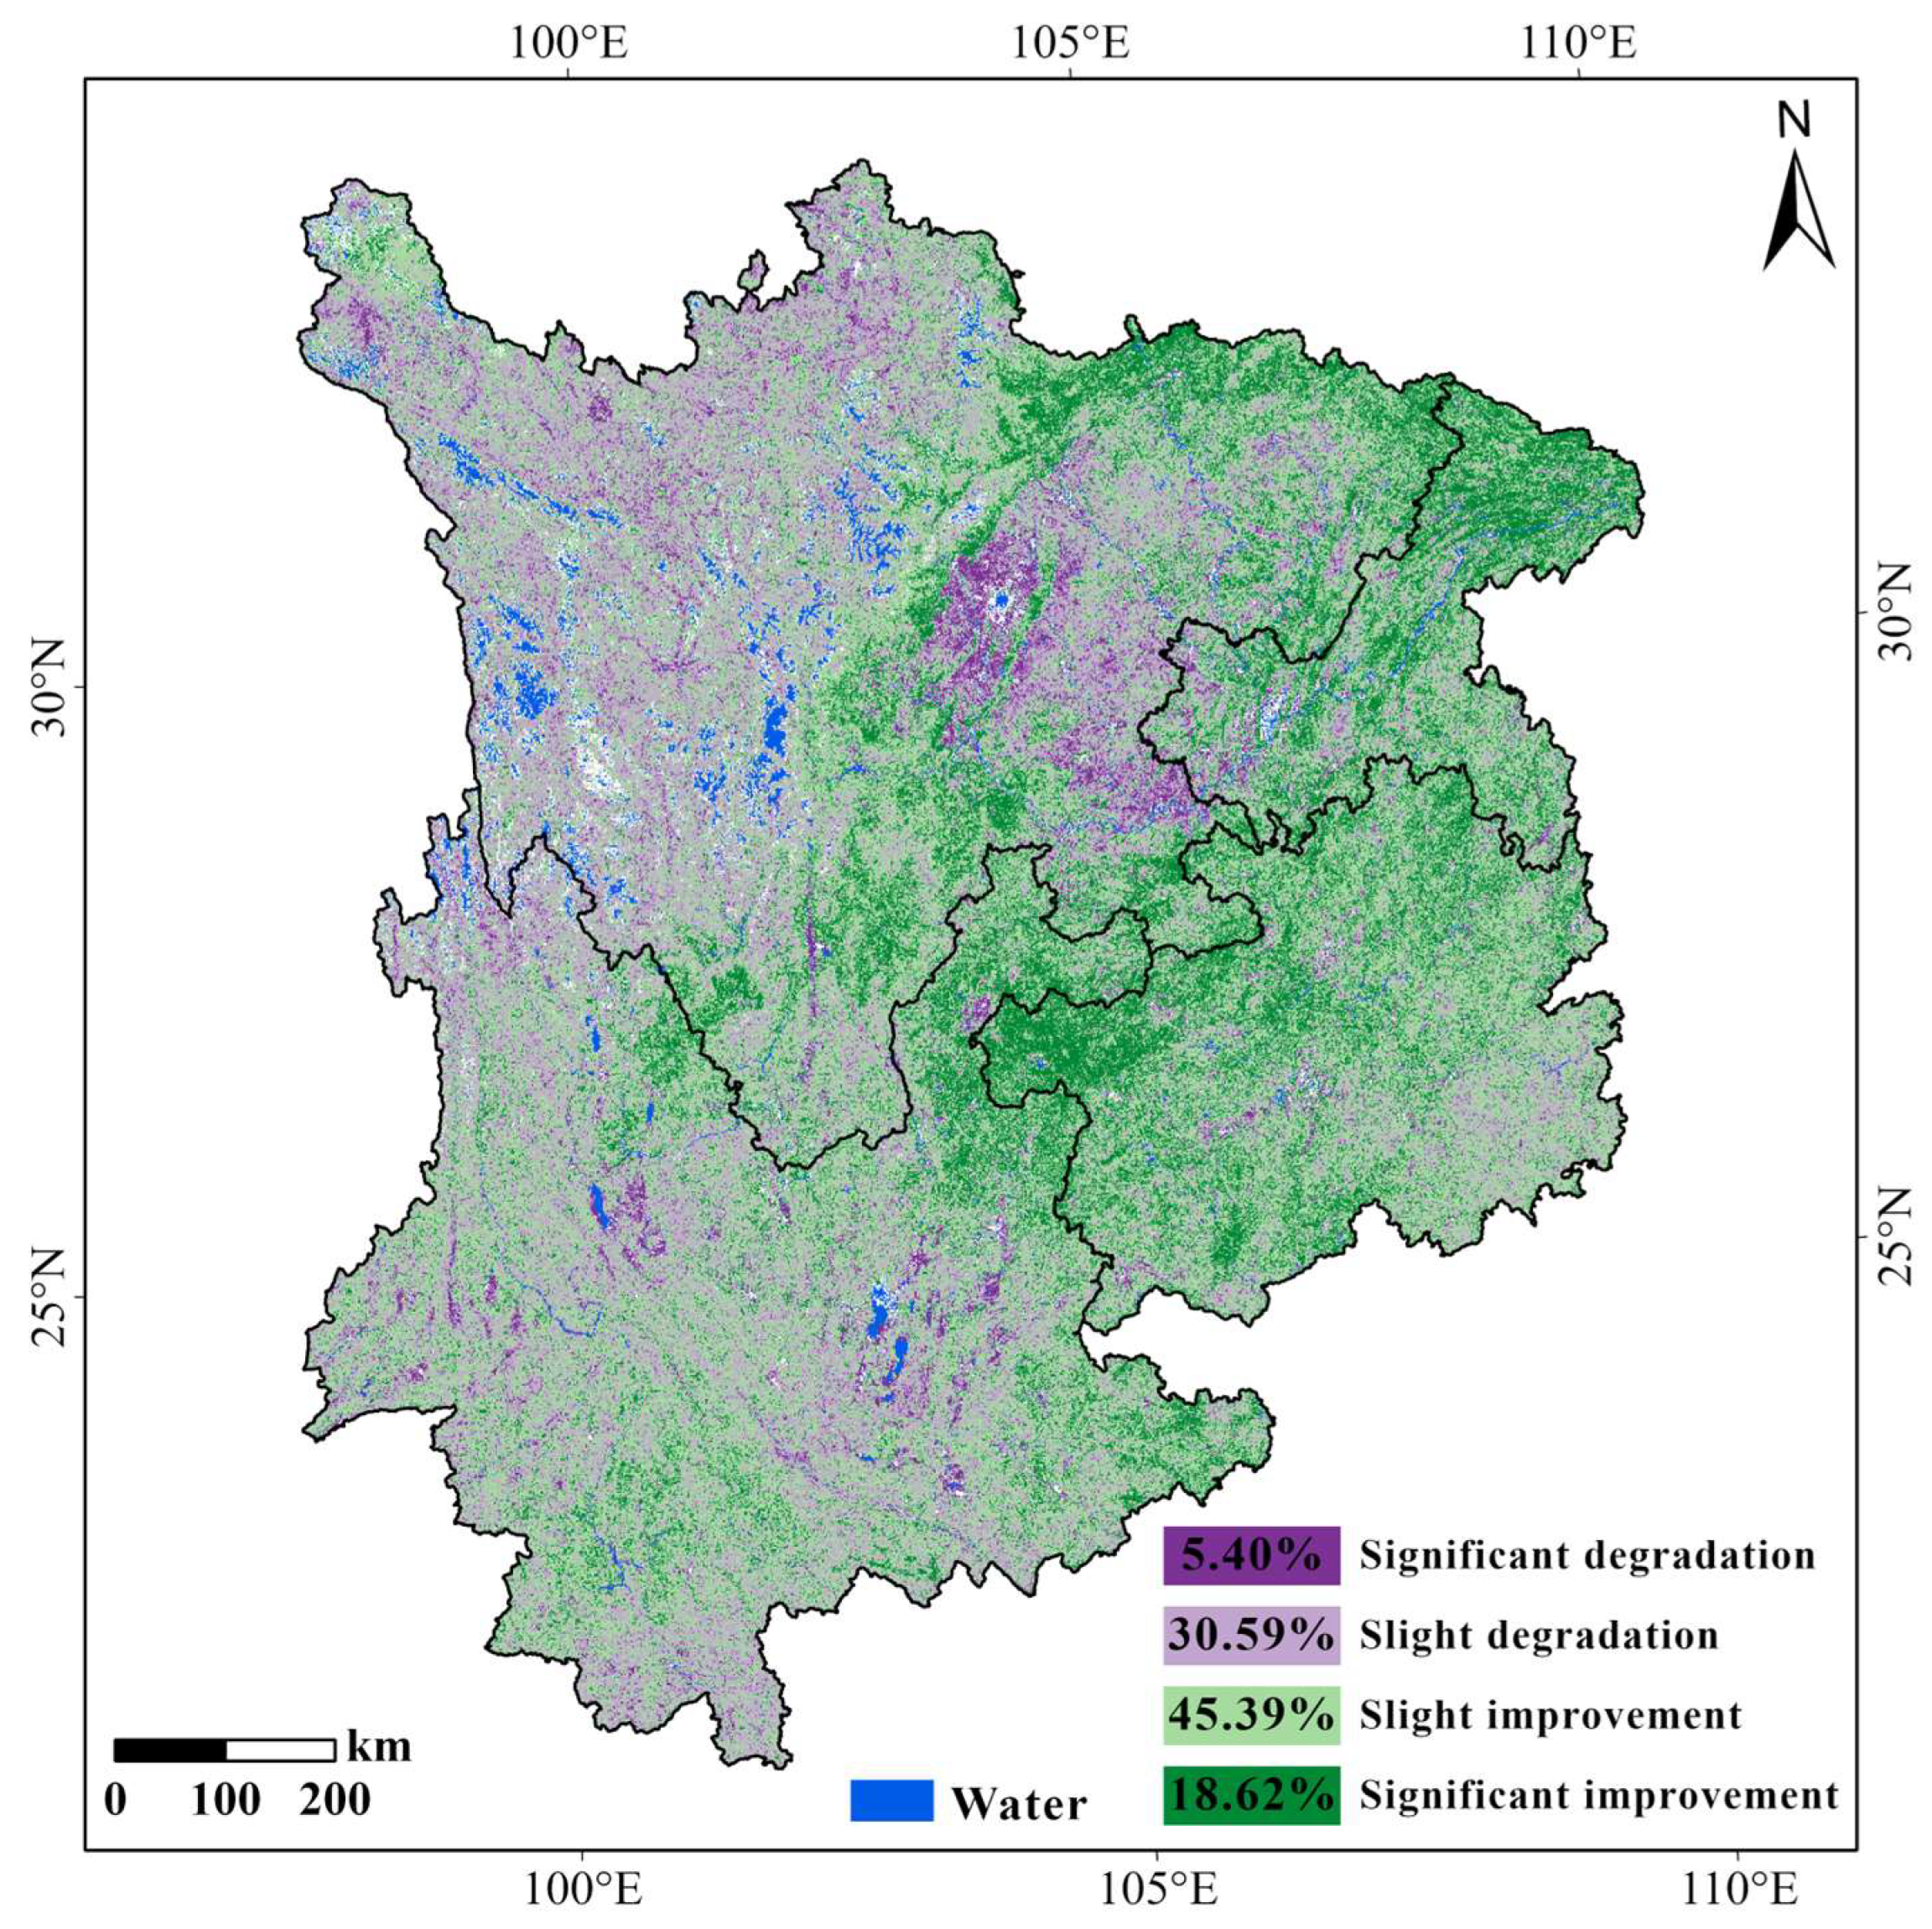
4.3.1. FVC Change Trend
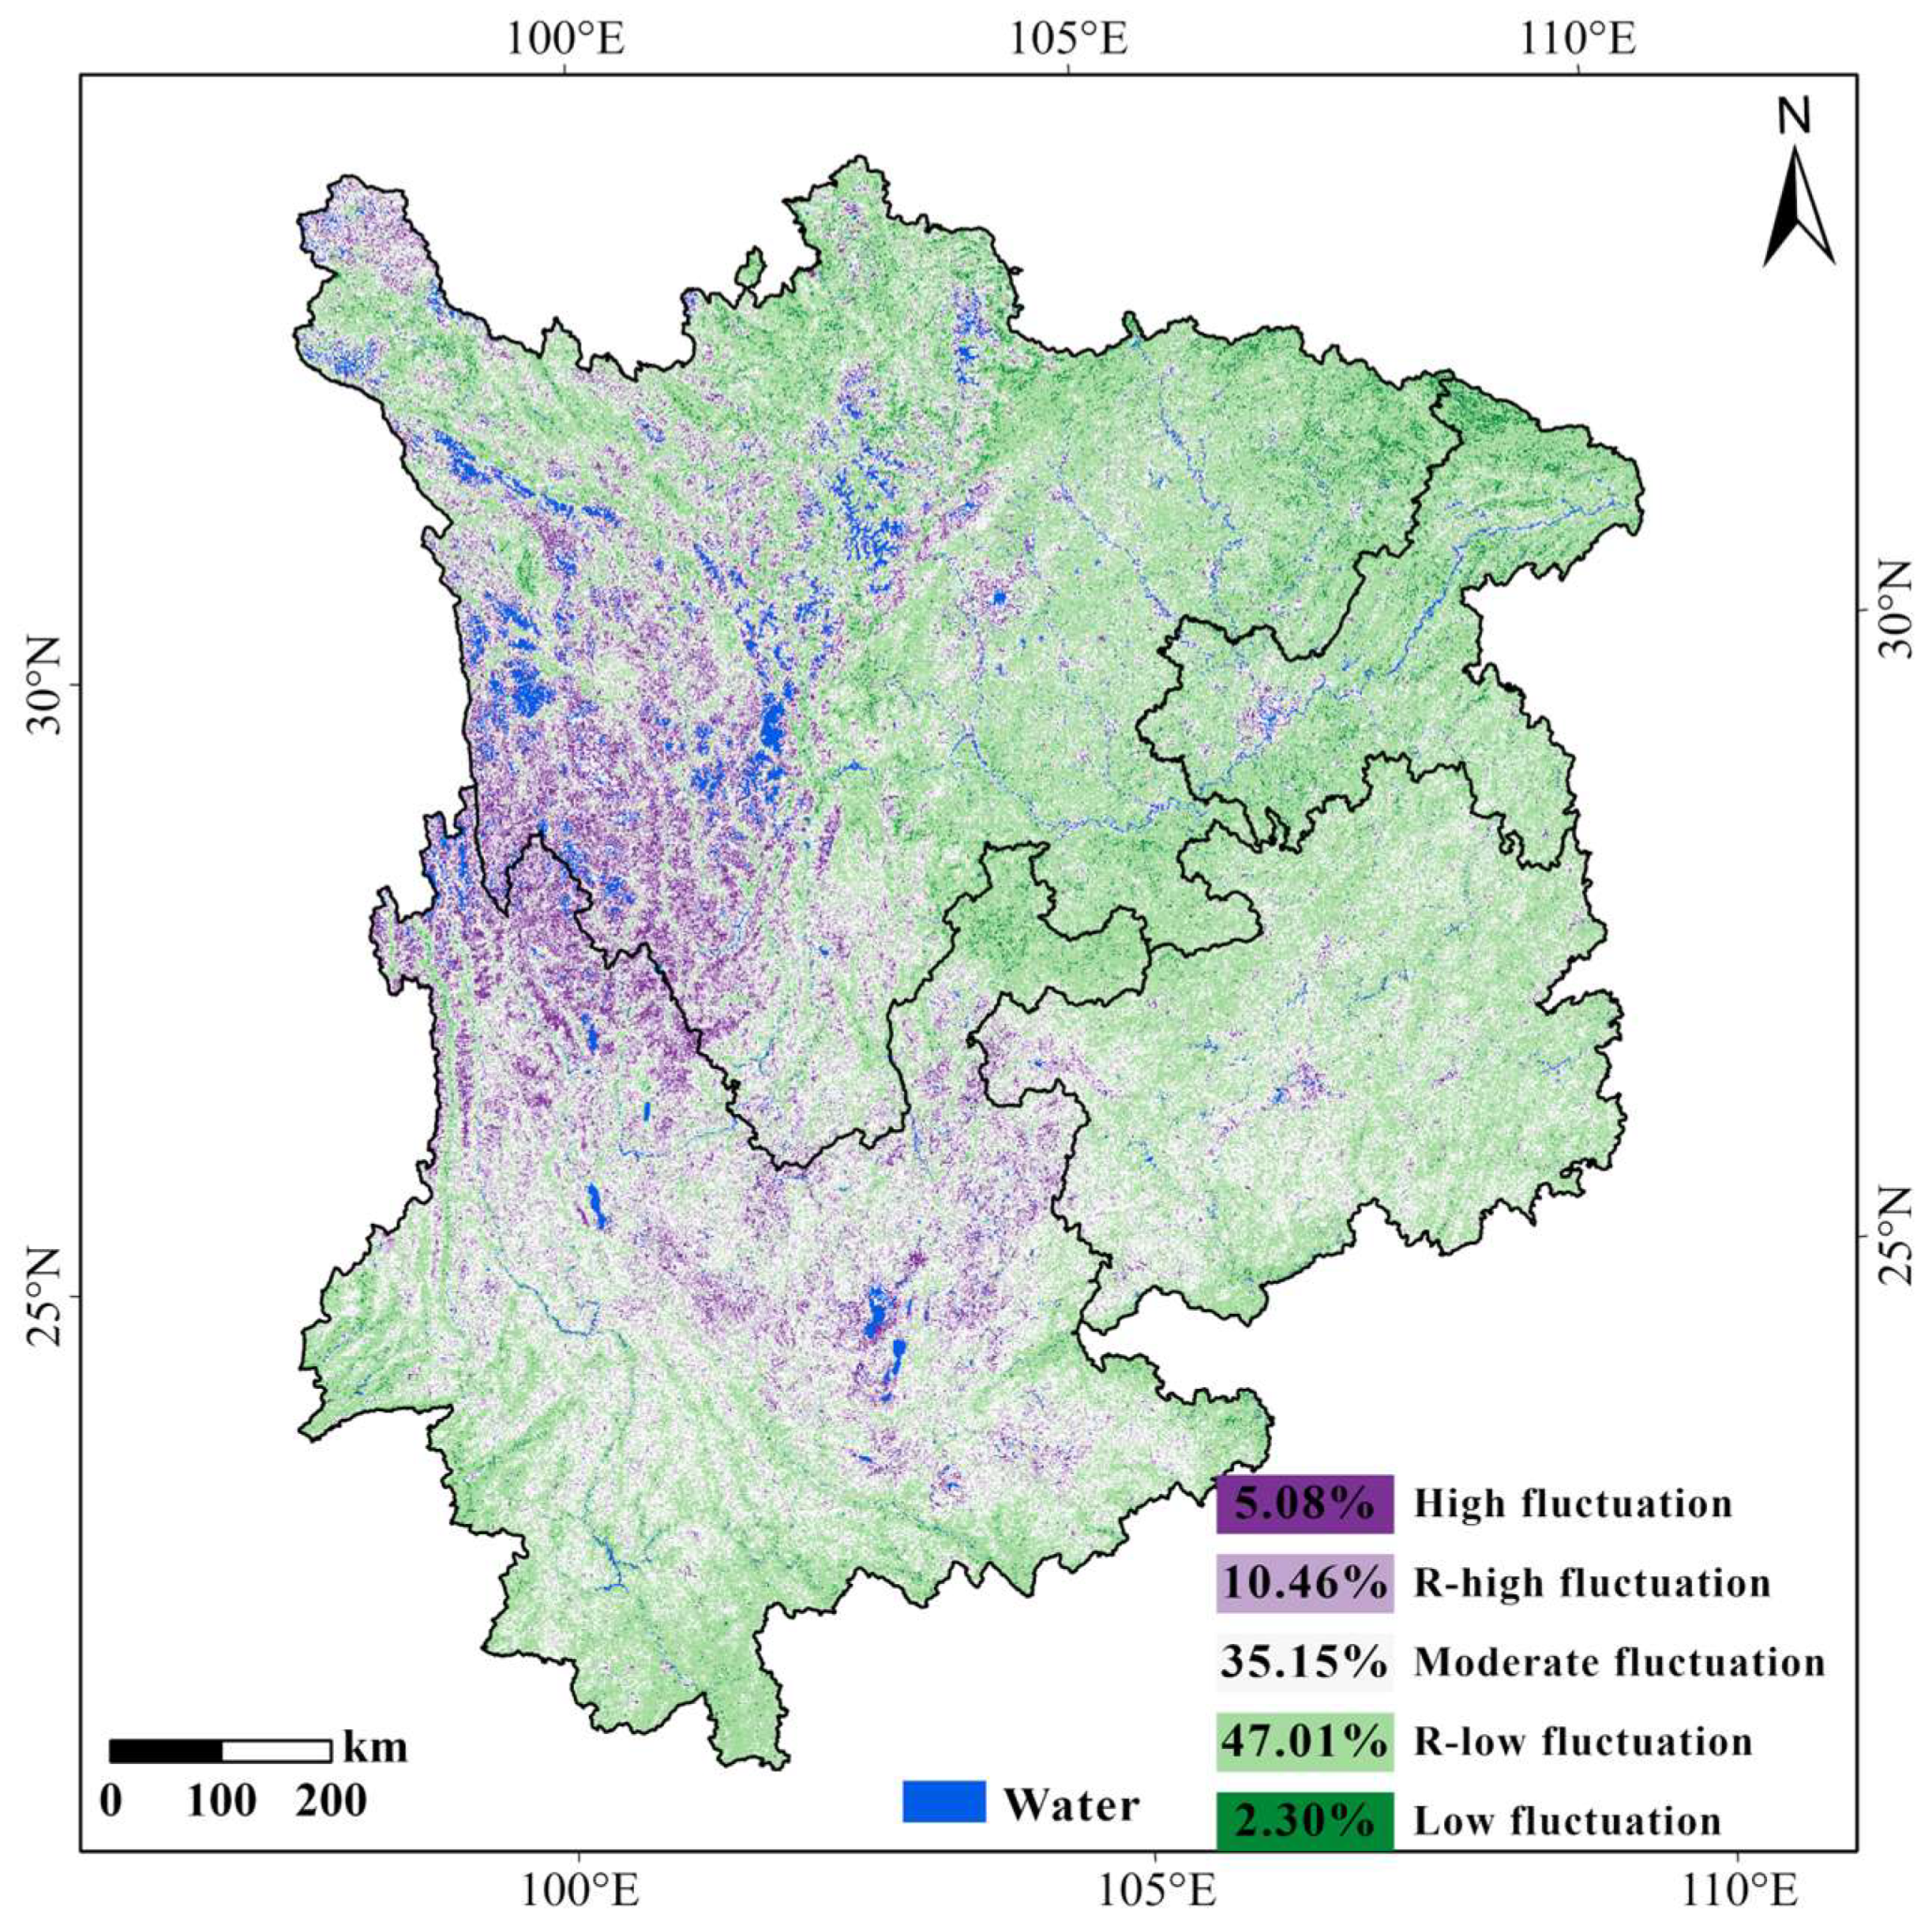
4.3.2. FVC Stability
4.4. Impacts of Climate Change and Human Activity on FVC Change
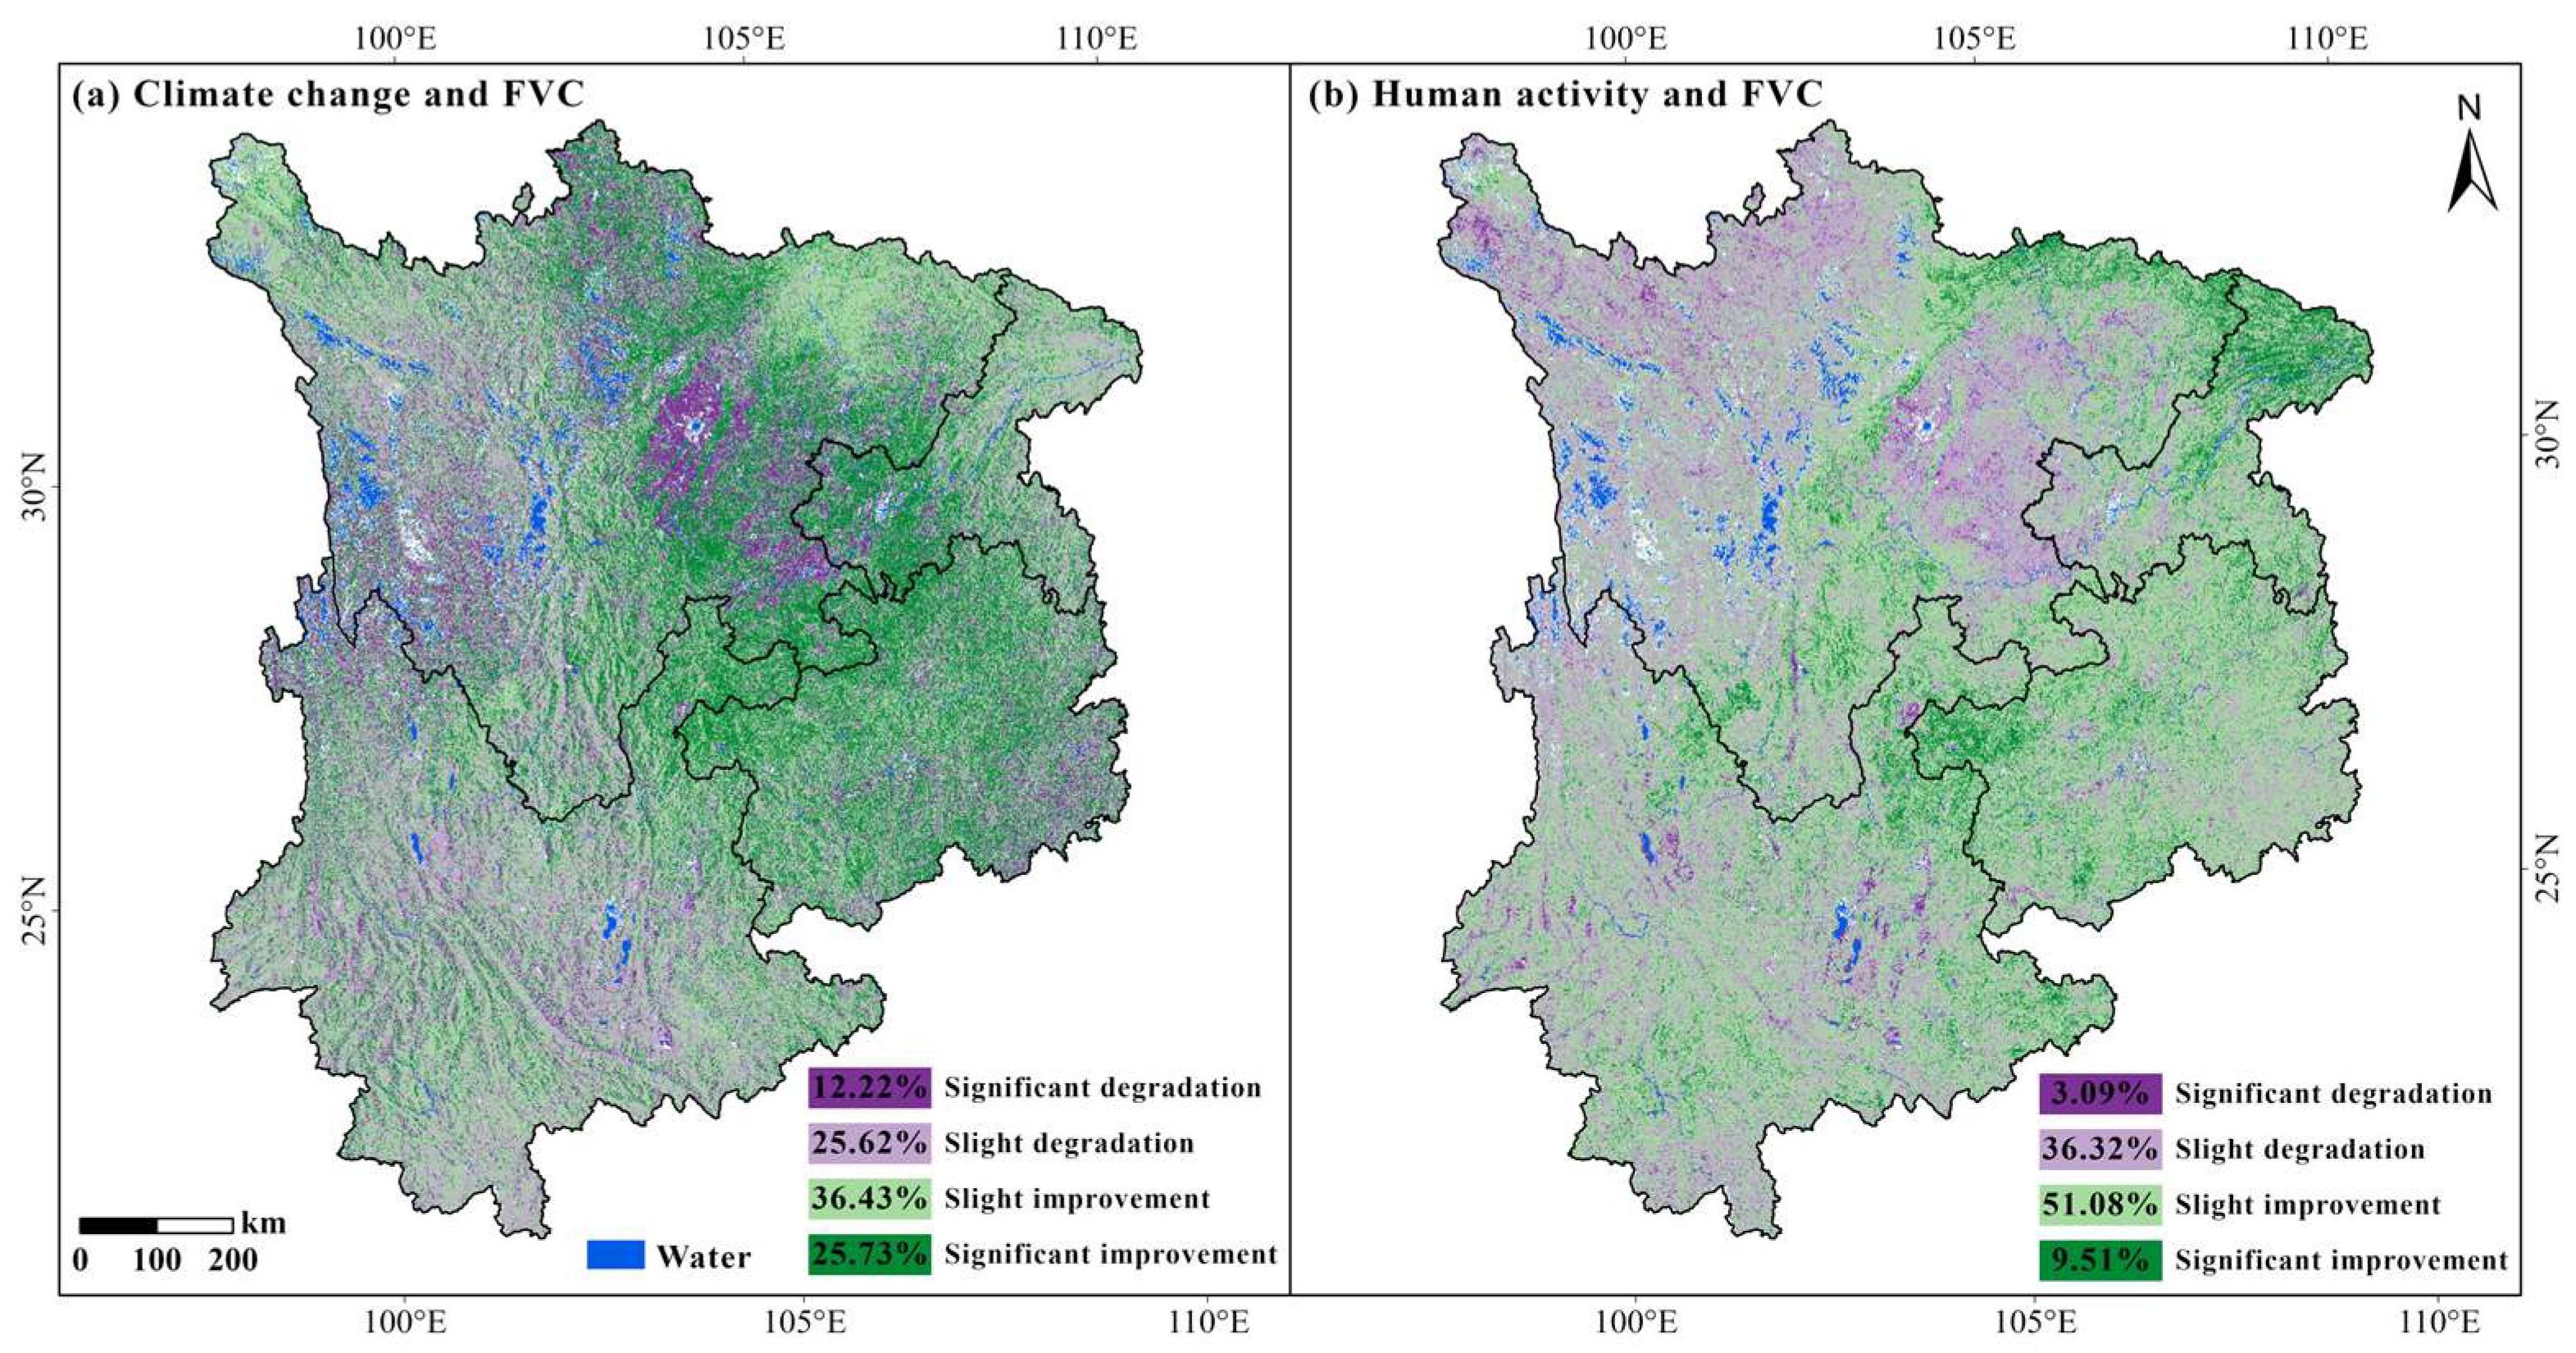
4.4.1. FVC Change Trends Under the Impacts of Climate Changes and Human Activities
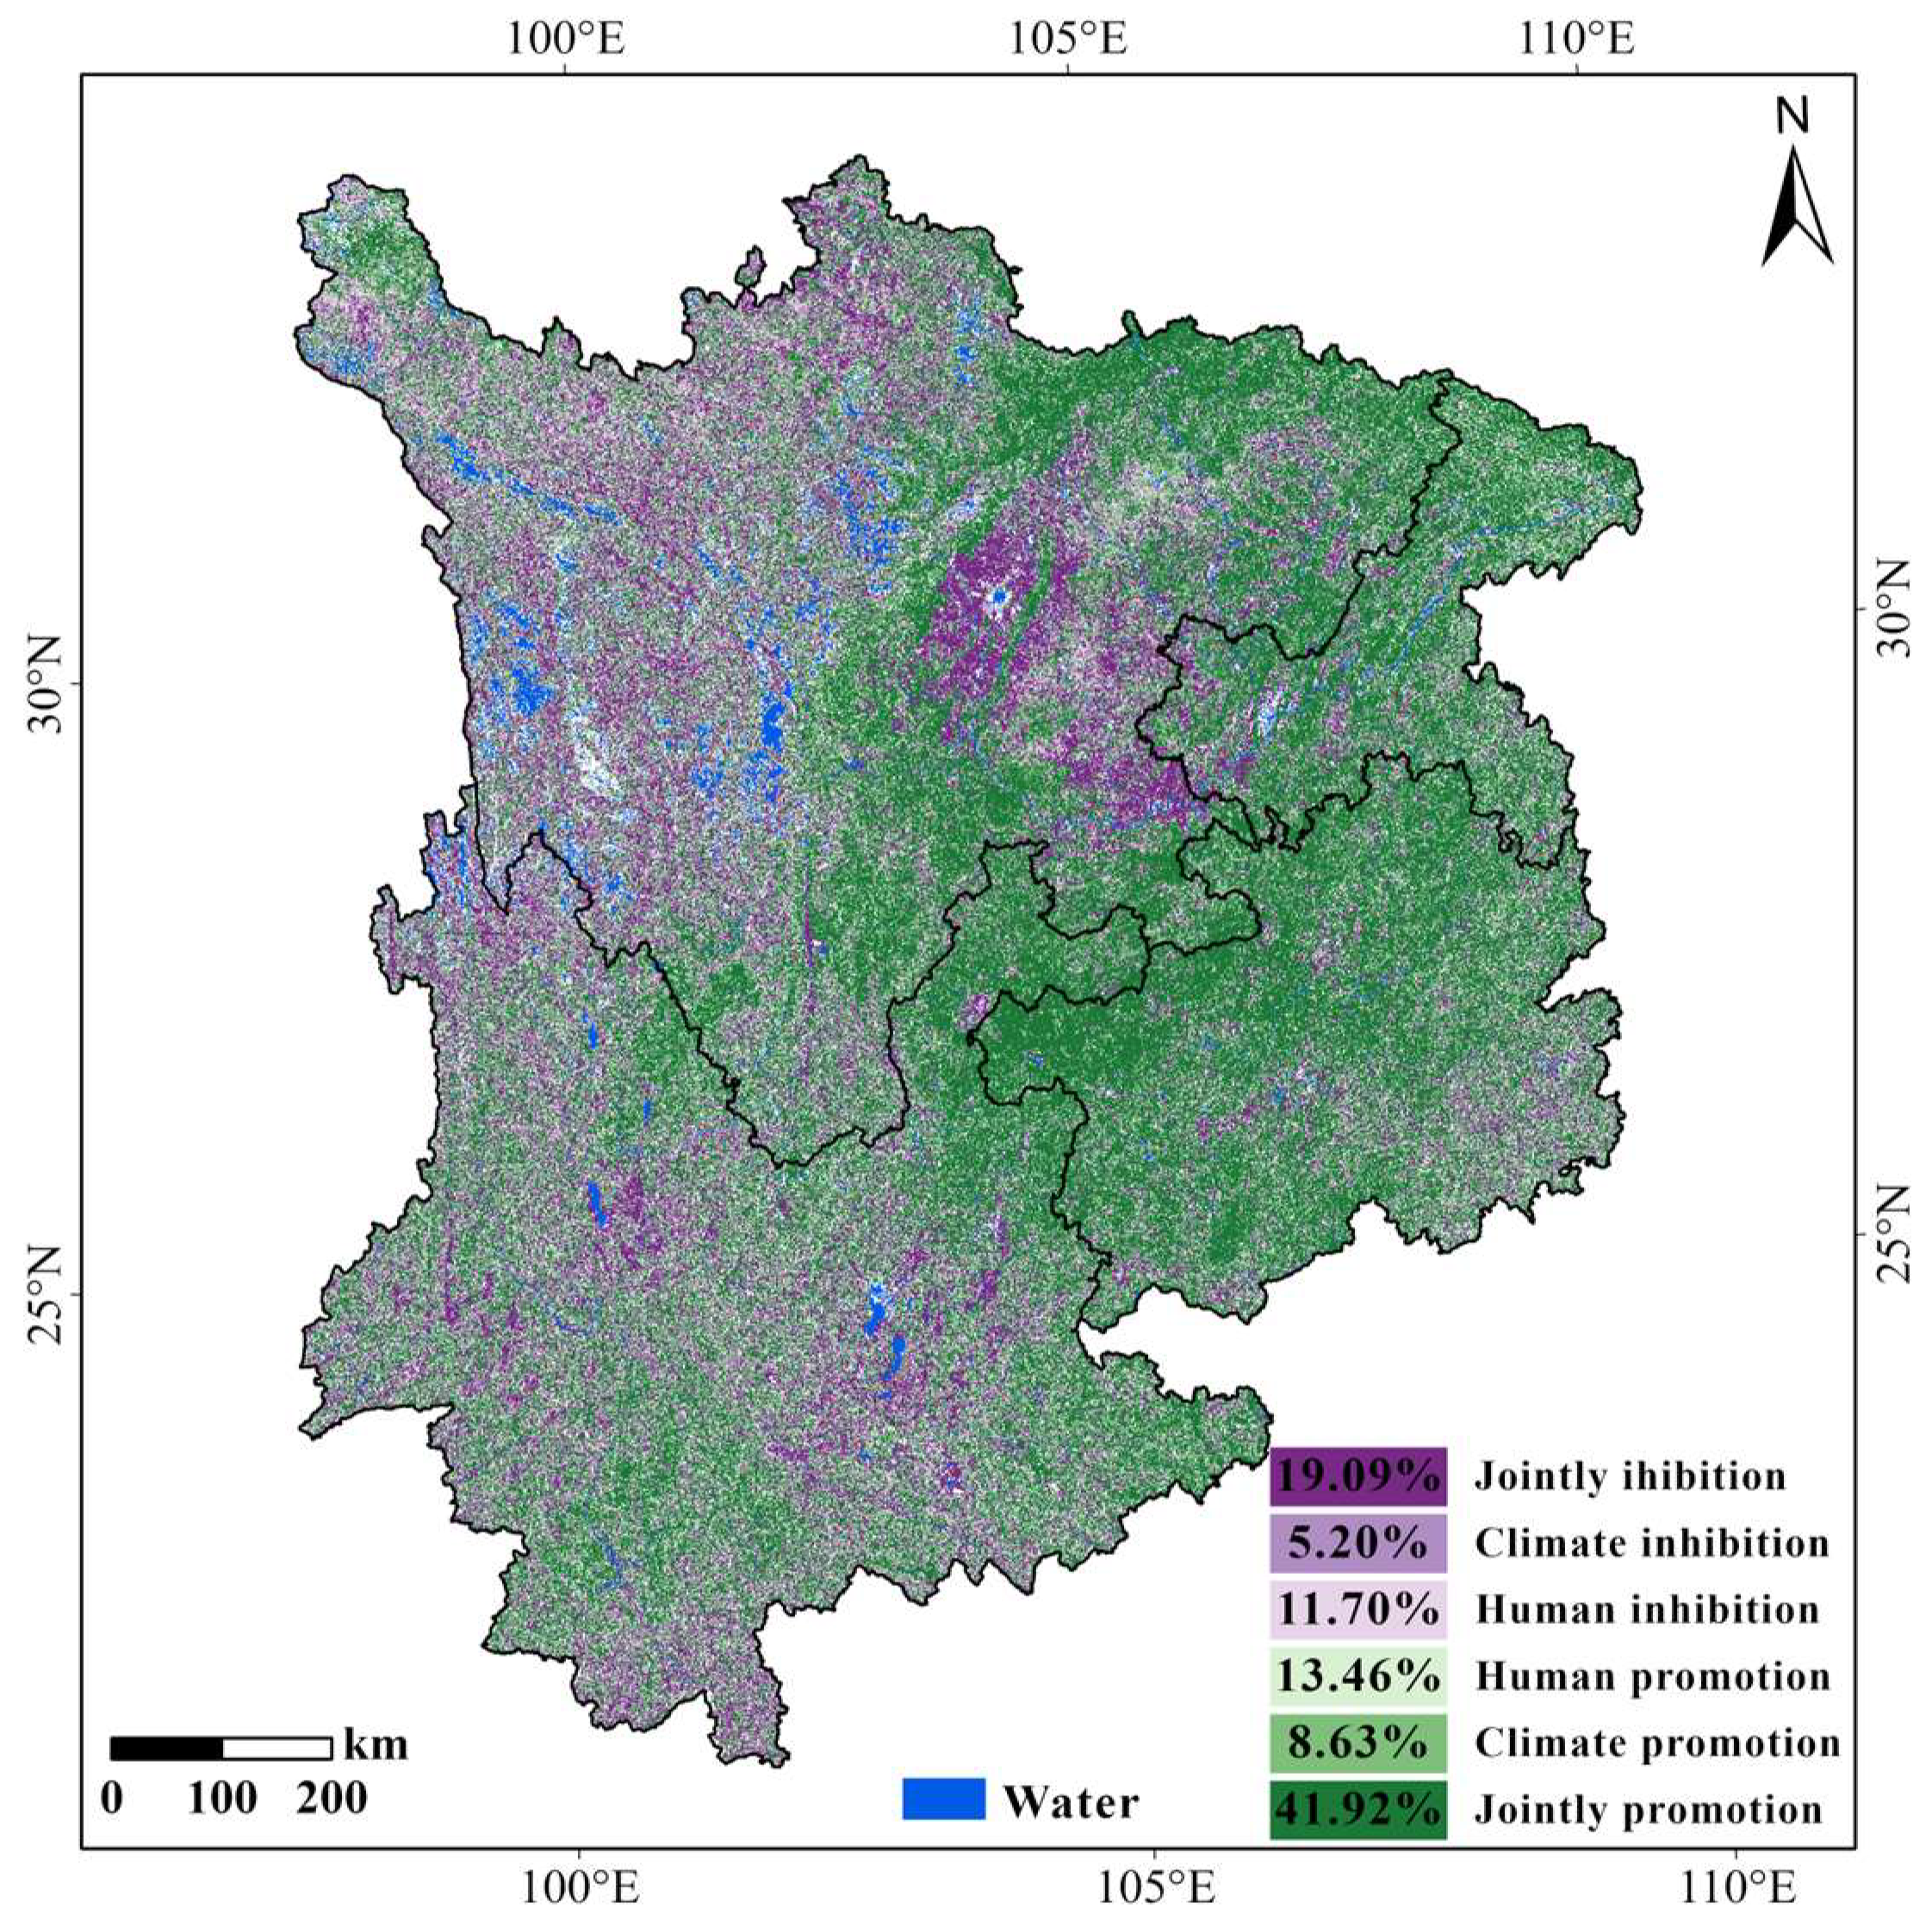
4.4.2. Driving Effects of Climate Change and Human Activities on FVC Changes
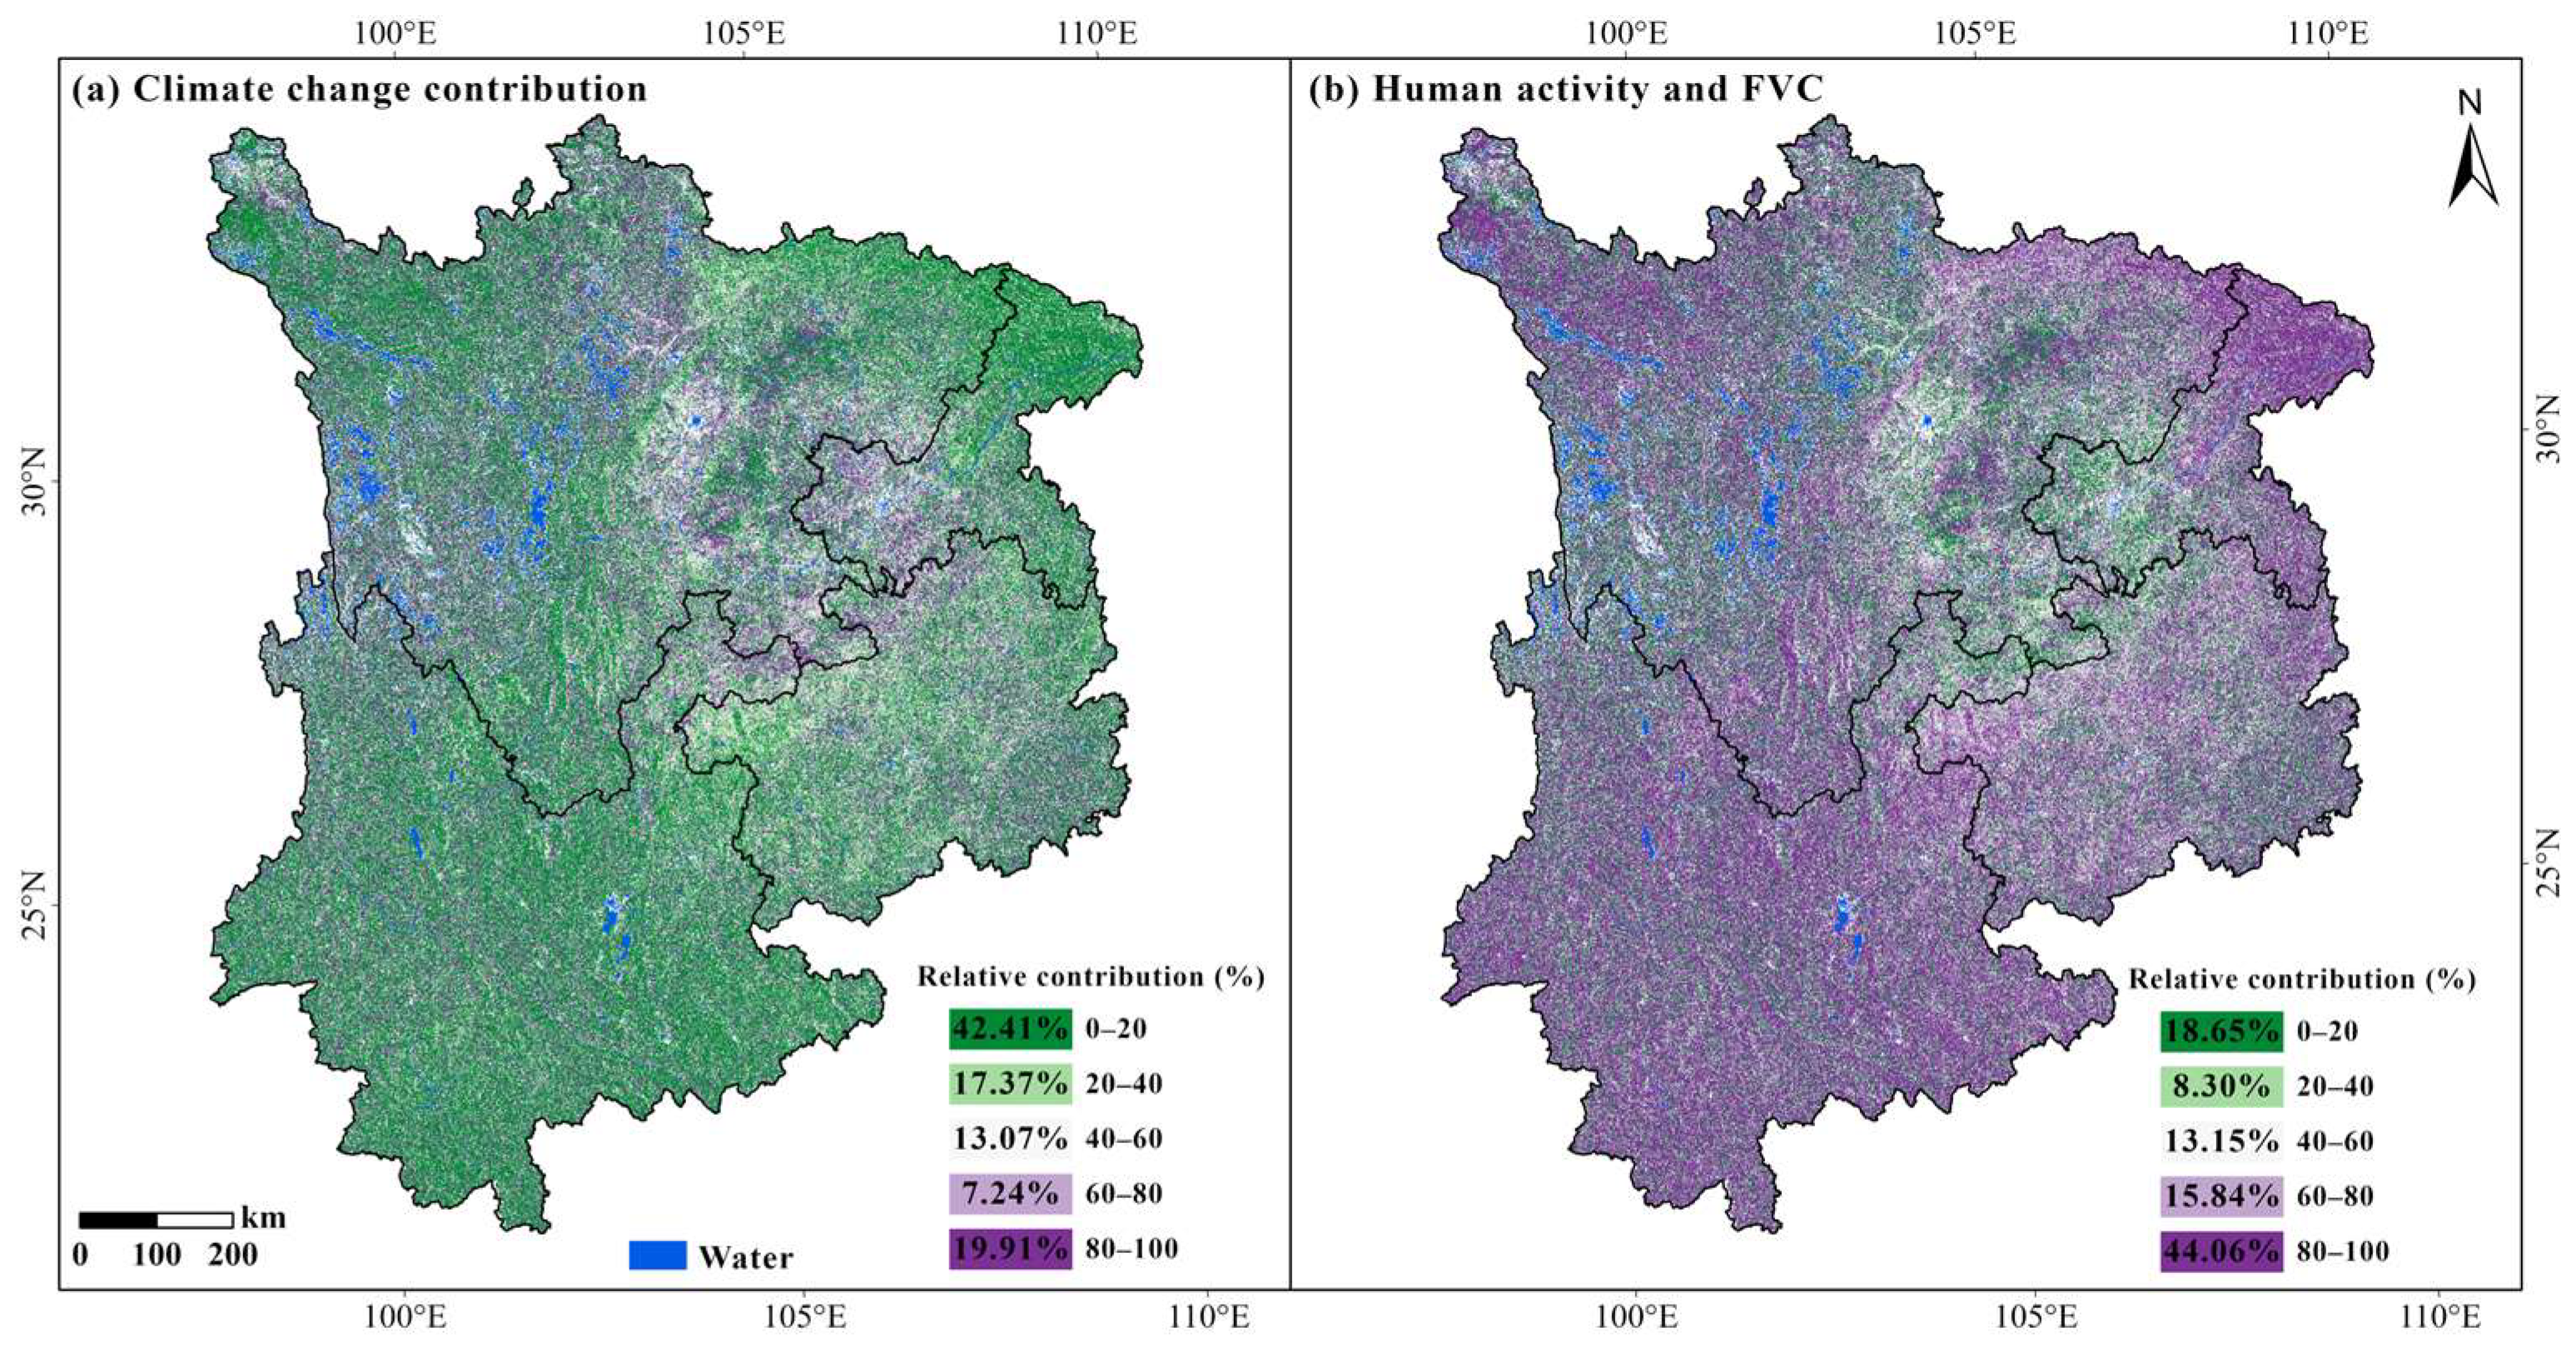
4.4.3. Contributions of Climate Change and Human Activities to FVC Changes
4.5. Driving Mechanism of FVC Spatial Patterns
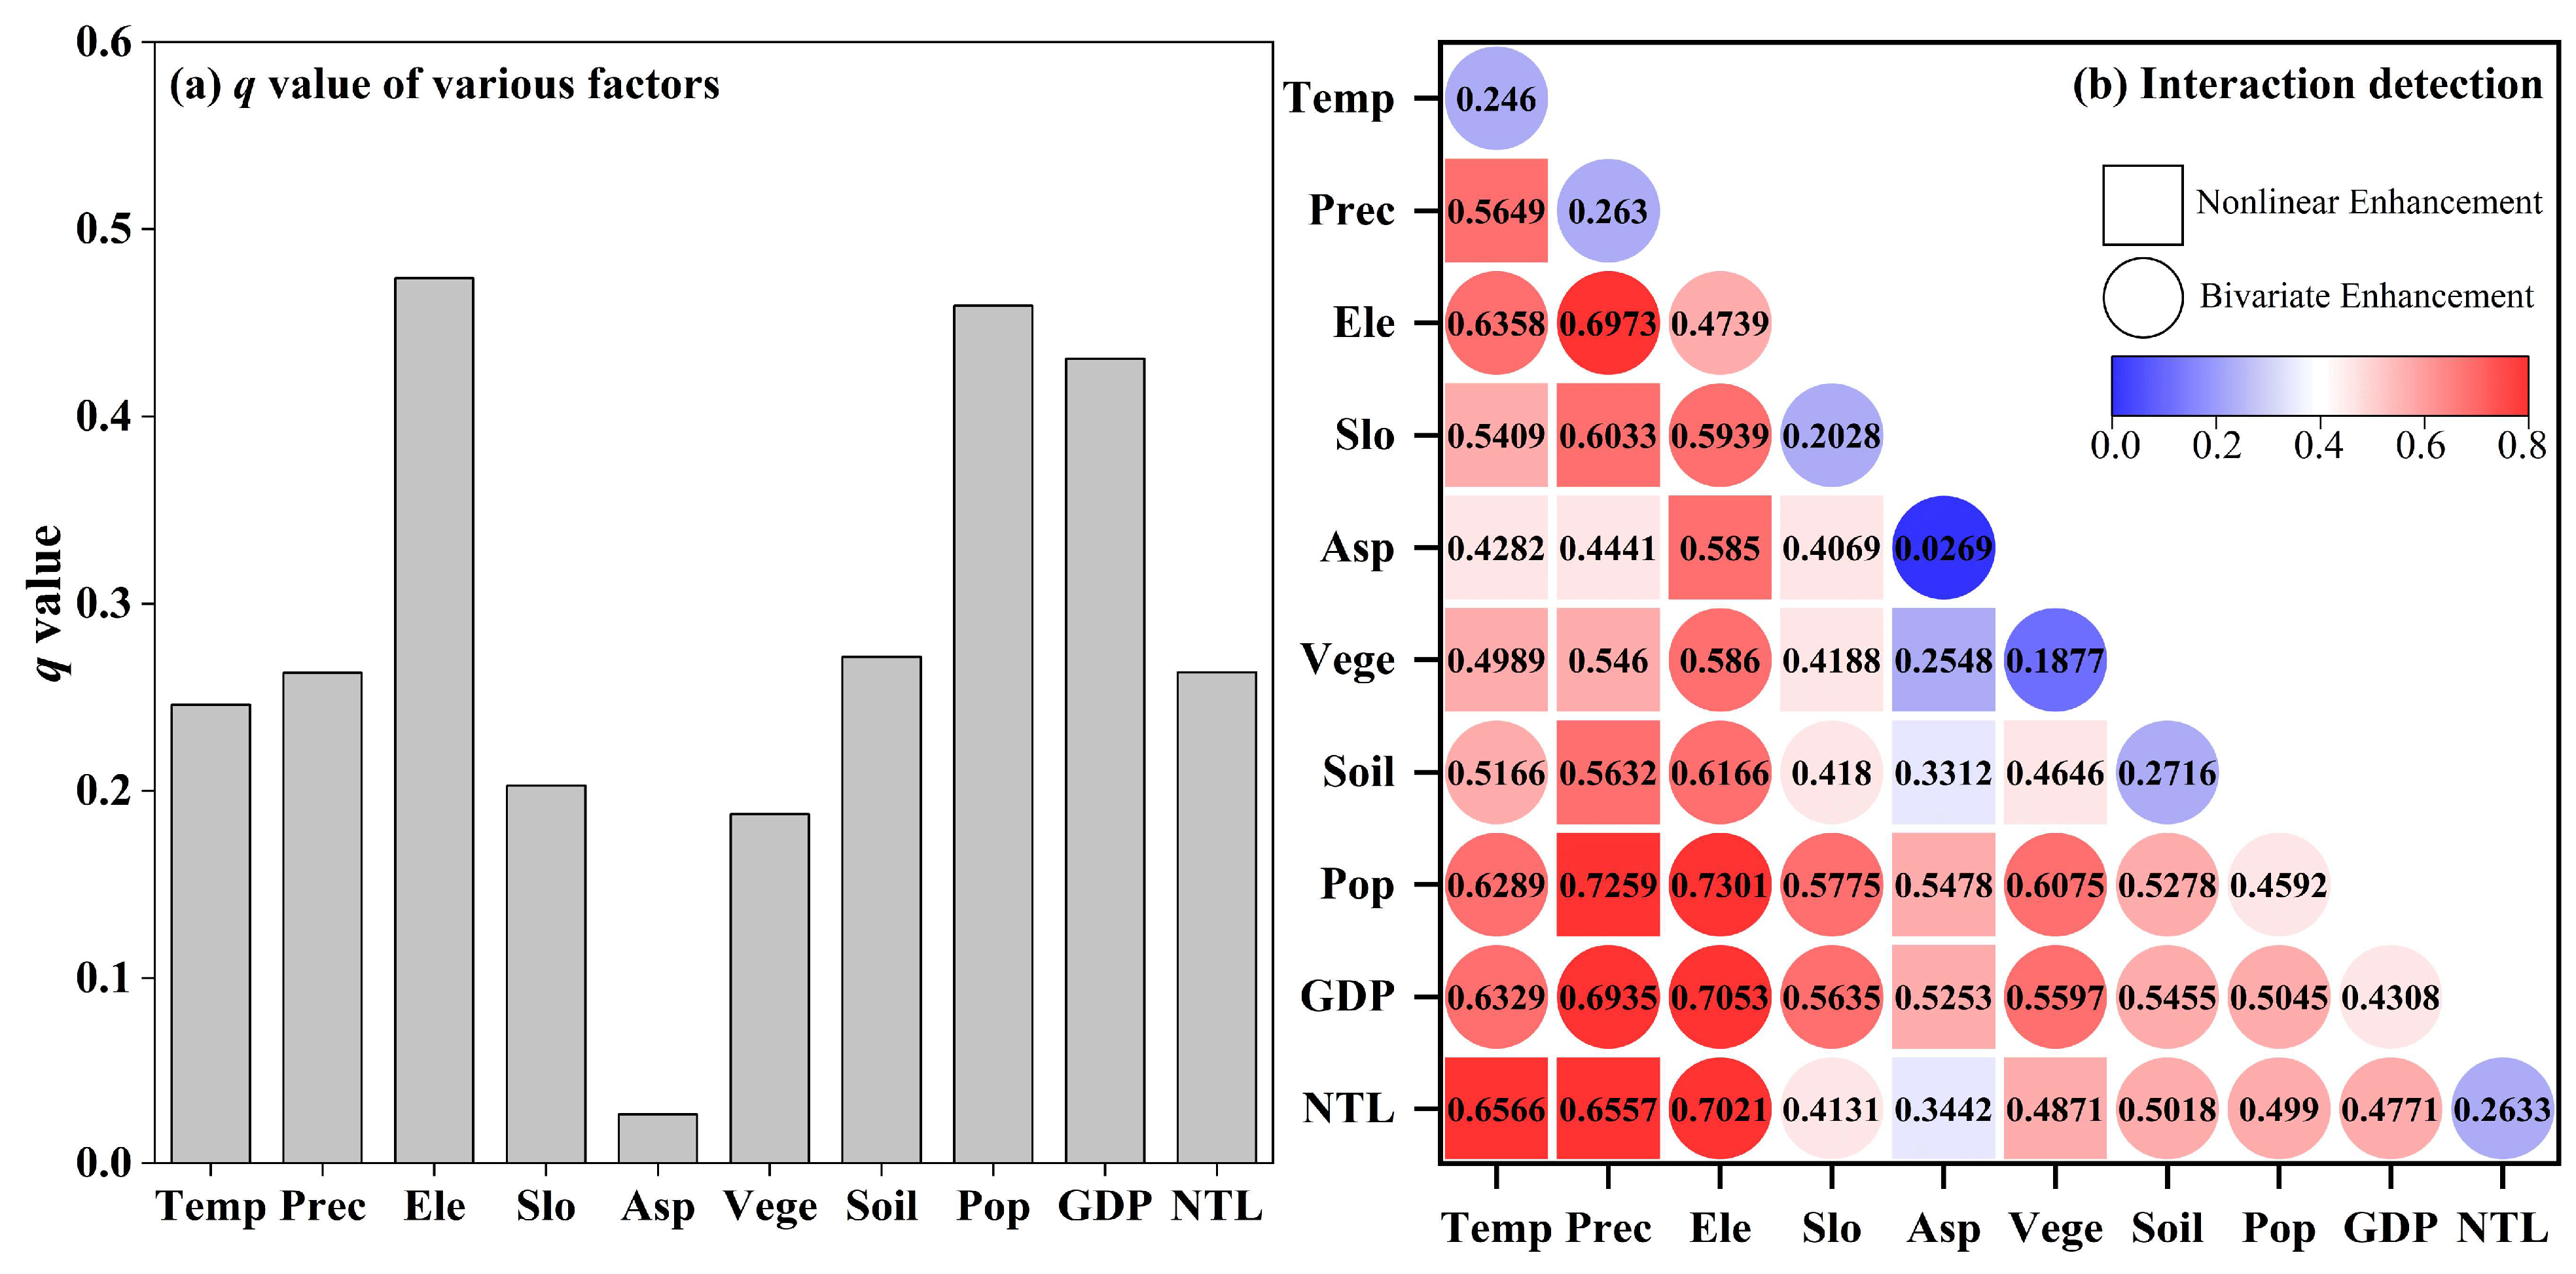
4.5.1. Single Factor Detection
4.5.2. Interaction Detection
4.6. Future Change Trend in FVC
5. Discussion
5.1. The Spatiotemporal Variations of FVC
5.2. Driving Mechanism of FVC Spatial Patterns
5.3. Limitations and Future Work
6. Conclusions
- (1)
- The overall FVC in southwestern China exhibited a slight increasing trend, with distinct spatial heterogeneity. Elevation was identified as the primary factor driving this spatial variability, influencing hydrothermal conditions, vegetation types, soil types, and human activity intensity. The factors influencing FVC were not independent but interrelated, with interactions amplifying their combined explanatory power. The interaction between elevation and other factors had the greatest explanatory power on FVC spatial pattern.
- (2)
- The joint impact of climate changes and human activities were the primary drivers of FVC changes. The relative contribution of human activity (62.25%) outweighed that of climate change (37.75%). Activities such as indiscriminate logging and urbanization inhibited FVC, while ecological restoration projects significantly promoted it.
- (3)
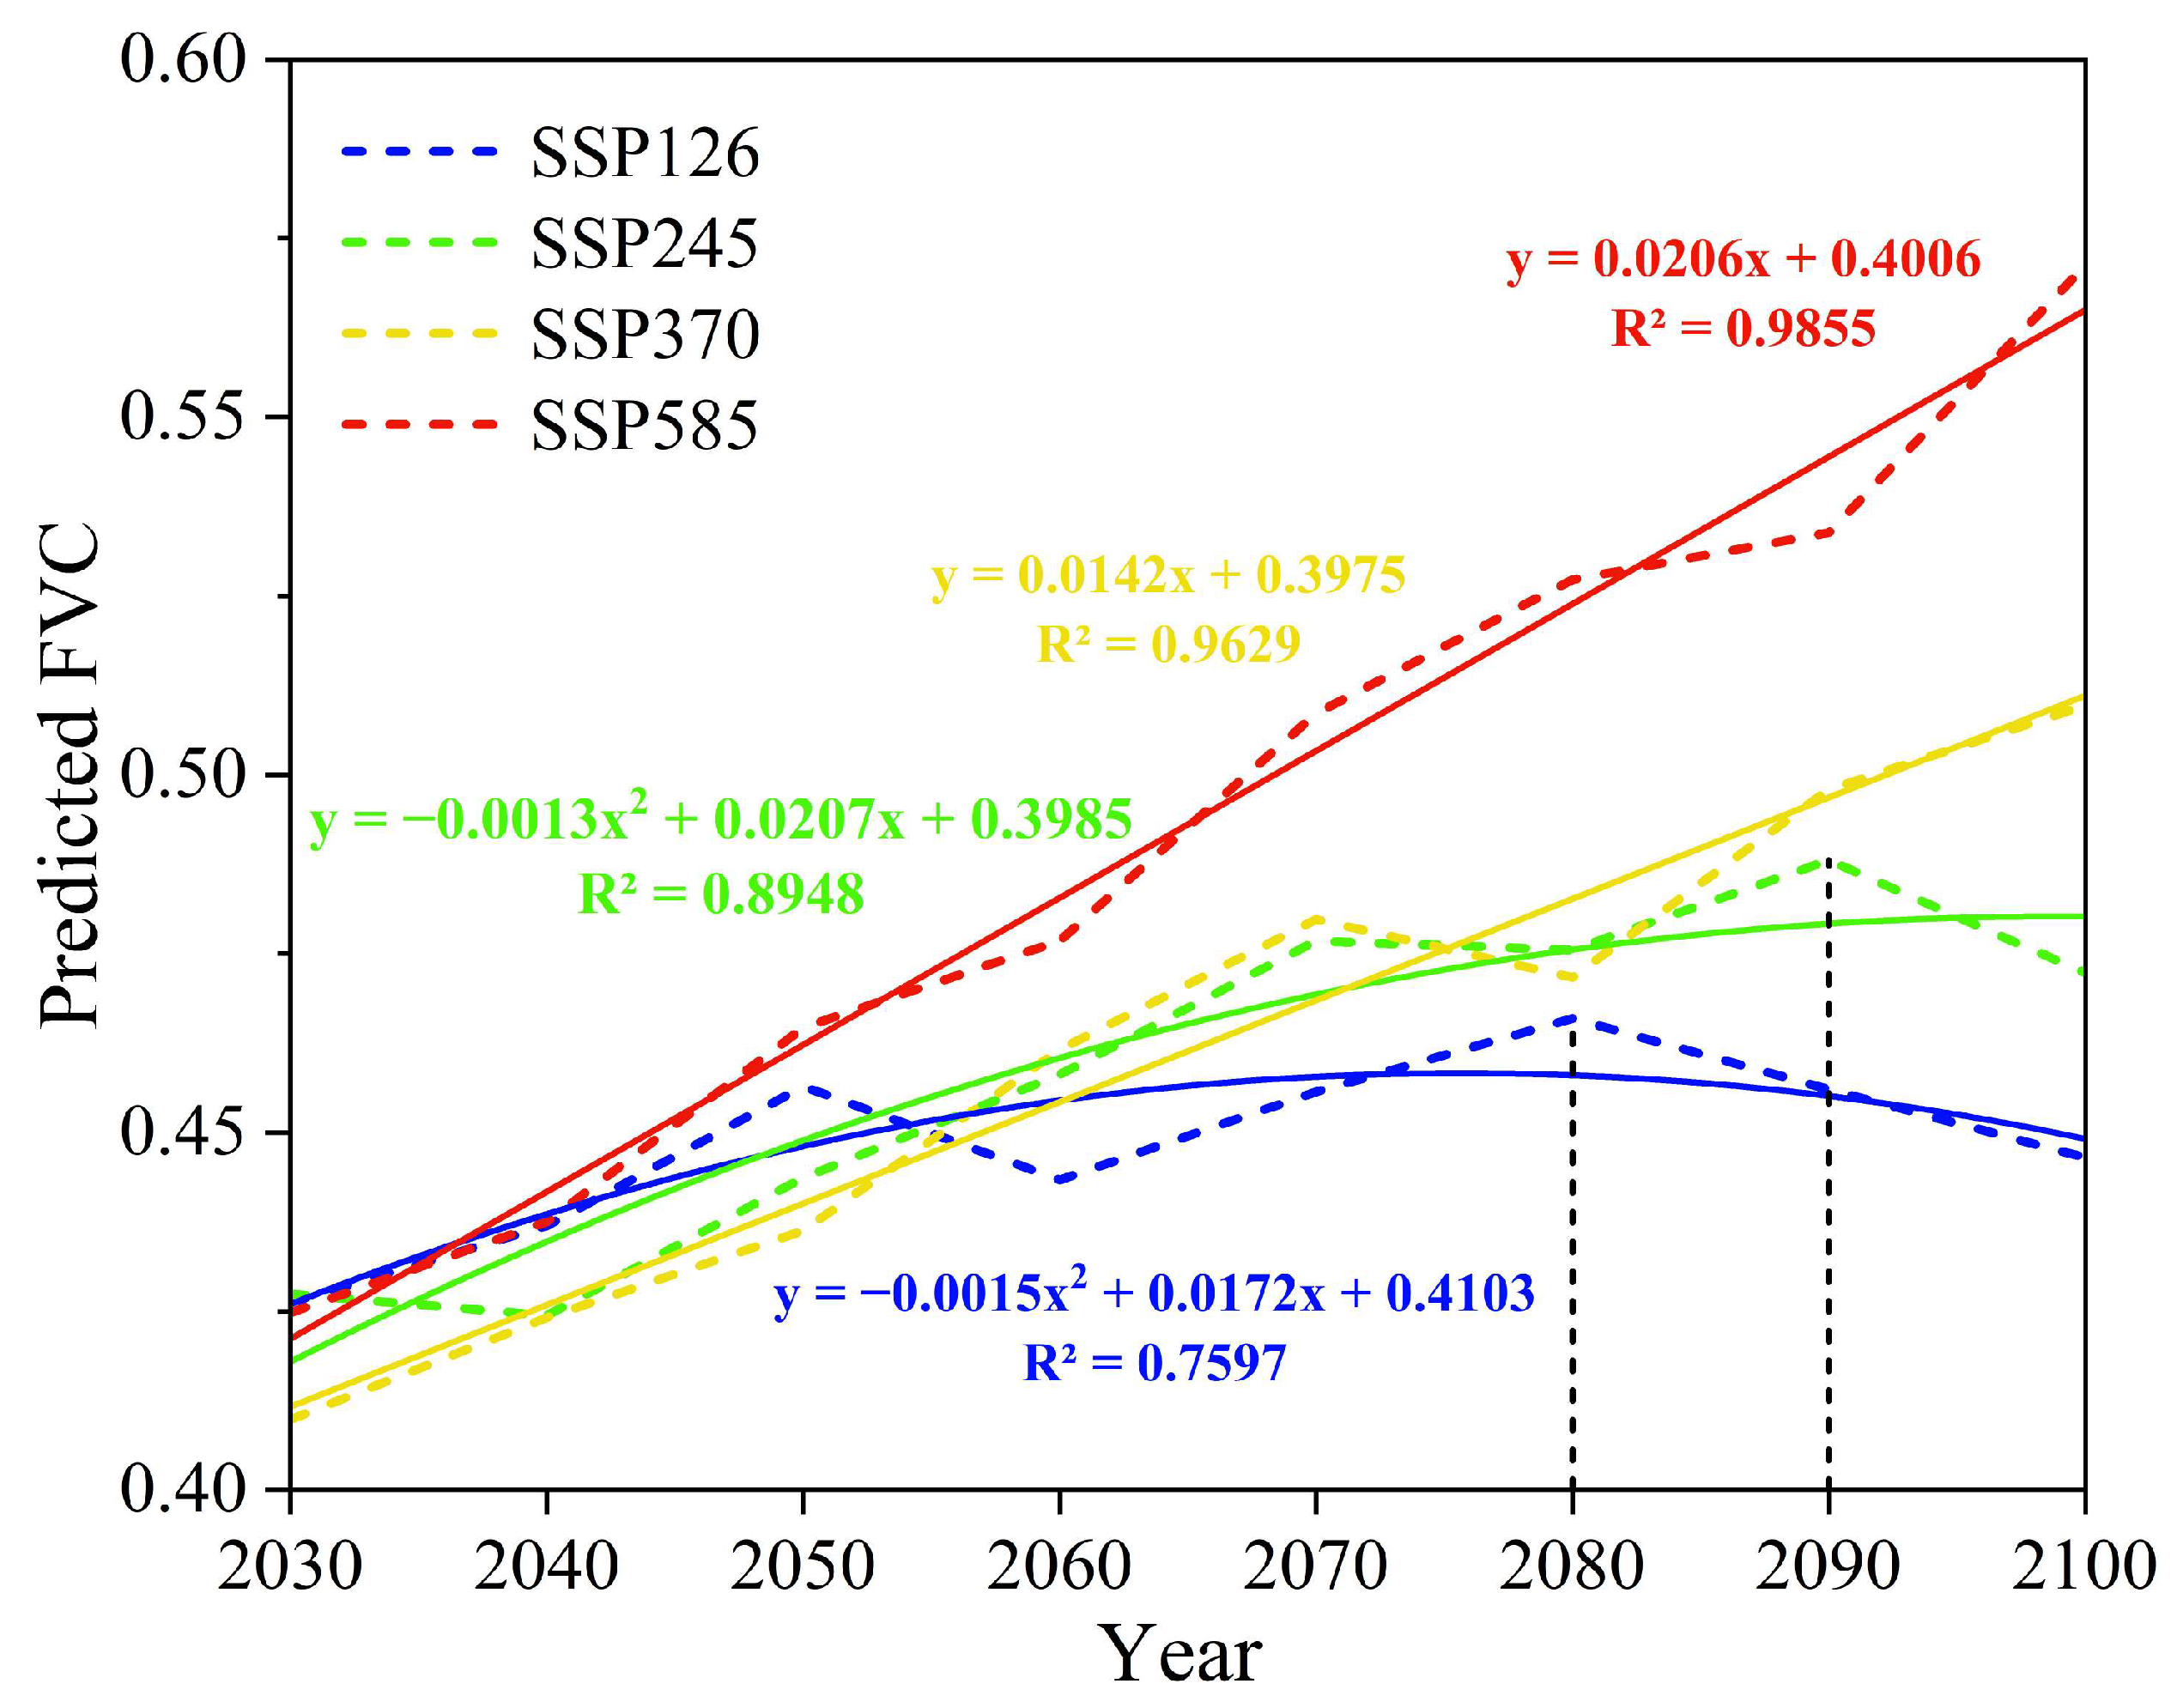
- Based on various SPP scenarios, future FVC predictions show varying trends. Under high-emission scenarios, FVC increases steadily while, under low-emission scenarios, it exhibits an “increase-decrease” pattern, with shifts occurring in 2080 and 2090 under SSP126 and SSP245, respectively. FVC dynamics in the future underscore the need for adaptive and forward-looking management strategies that account for potential shifts in climate conditions.
- (4)
- Further research on FVC need to clarify the individual and combined impacts of climate change and human activities, particularly through integrated modeling approaches and long-term observational data. This includes the application of dynamic land-use models, higher-resolution remote sensing datasets, and spatially explicit analyses to better understand the mechanisms driving vegetation dynamics under varying environmental and anthropogenic pressures.
Author Contributions
Funding
Data Availability Statement
Acknowledgments
Conflicts of Interest
References
- Bonan, G.B. Forests and Climate Change: Forcings, Feedbacks, and the Climate Benefits of Forests. Science 2008, 320, 1444–1449. [Google Scholar] [CrossRef] [PubMed]
- Li, D.; Pan, M.; Cong, Z.; Zhang, L.; Wood, E. Vegetation control on water and energy balance within the Budyko framework. Water Resour. Res. 2013, 49, 969–976. [Google Scholar] [CrossRef]
- Loisel, J.; Yu, Z. Surface vegetation patterning controls carbon accumulation in peatlands. Geophys. Res. Lett. 2013, 40, 5508–5513. [Google Scholar] [CrossRef]
- Kim, J.H.; Jackson, R.B. A Global Analysis of Groundwater Recharge for Vegetation, Climate, and Soils. Vadose Zone J. 2012, 11. [Google Scholar] [CrossRef]
- Shao, J.; Si, B.; Jin, J. Rooting Depth and Extreme Precipitation Regulate Groundwater Recharge in the Thick Unsaturated Zone: A Case Study. Water 2019, 11, 1232. [Google Scholar] [CrossRef]
- Carlson, T.N.; Ripley, D.A.J. On the relation between NDVI, fractional vegetation cover, and leaf area index. Remote Sens. Environ. 1997, 62, 241–252. [Google Scholar] [CrossRef]
- Hill, M.J.; Guerschman, J.P. Global trends in vegetation fractional cover: Hotspots for change in bare soil and non-photosynthetic vegetation. Agric. Ecosyst. Environ. 2022, 324, 107719. [Google Scholar] [CrossRef]
- De Stefano, A.; Fowers, B.; Mealor, B.A. Comparison of visual estimation and line-point intercept vegetation survey methods on annual grass–invaded rangelands of Wyoming. Invasive Plant Sci. Manag. 2021, 14, 240–252. [Google Scholar] [CrossRef]
- Gao, L.; Wang, X.; Johnson, B.A.; Tian, Q.; Wang, Y.; Verrelst, J.; Mu, X.; Gu, X. Remote sensing algorithms for estimation of fractional vegetation cover using pure vegetation index values: A review. ISPRS J. Photogramm. Remote Sens. 2020, 159, 364–377. [Google Scholar] [CrossRef]
- Zhu, Z.; Woodcock, C.E. Continuous change detection and classification of land cover using all available Landsat data. Remote Sens. Environ. 2014, 144, 152–171. [Google Scholar] [CrossRef]
- Ghazal, M.; Khalil, Y.A.; Hajjdiab, H. UAV-based remote sensing for vegetation cover estimation using NDVI imagery and level sets method. In Proceedings of the 2015 IEEE International Symposium on Signal Processing and Information Technology (ISSPIT), Abu Dhabi, United Arab Emirates, 7–10 December 2015; pp. 332–337. [Google Scholar]
- Song, D.; Wang, Z.; He, T.; Wang, H.; Liang, S. Estimation and validation of 30 m fractional vegetation cover over China through integrated use of Landsat 8 and Gaofen 2 data. Sci. Remote Sens. 2022, 6, 100058. [Google Scholar] [CrossRef]
- Zhao, T.; Mu, X.; Song, W.; Liu, Y.; Xie, Y.; Zhong, B.; Xie, D.; Jiang, L.; Yan, G. Mapping Spatially Seamless Fractional Vegetation Cover over China at a 30-m Resolution and Semimonthly Intervals in 2010–2020 Based on Google Earth Engine. J. Remote Sens. 2023, 3, 0101. [Google Scholar] [CrossRef]
- Zhou, Q.; Chen, W.; Wang, H.; Wang, D. Spatiotemporal evolution and driving factors analysis of fractional vegetation coverage in the arid region of northwest China. Sci. Total Environ. 2024, 954, 176271. [Google Scholar] [CrossRef]
- Wang, R.; Wang, Y.; Yan, F. Vegetation Growth Status and Topographic Effects in Frozen Soil Regions on the Qinghai–Tibet Plateau. Remote Sens. 2022, 14, 4830. [Google Scholar] [CrossRef]
- Son, N.T.; Chen, C.F.; Chen, C.R.; Minh, V.Q.; Trung, N.H. A comparative analysis of multitemporal MODIS EVI and NDVI data for large-scale rice yield estimation. Agric. For. Meteorol. 2014, 197, 52–64. [Google Scholar] [CrossRef]
- Chen, C.; Park, T.; Wang, X.; Piao, S.; Xu, B.; Chaturvedi, R.K.; Fuchs, R.; Brovkin, V.; Ciais, P.; Fensholt, R.; et al. China and India lead in greening of the world through land-use management. Nat. Sustain. 2019, 2, 122–129. [Google Scholar] [CrossRef]
- Piao, S.; Wang, X.; Park, T.; Chen, C.; Lian, X.; He, Y.; Bjerke, J.W.; Chen, A.; Ciais, P.; Tømmervik, H.; et al. Characteristics, drivers and feedbacks of global greening. Nat. Rev. Earth Environ. 2019, 1, 14–27. [Google Scholar] [CrossRef]
- Zhu, Z.; Piao, S.; Myneni, R.B.; Huang, M.; Zeng, Z.; Canadell, J.G.; Ciais, P.; Sitch, S.; Friedlingstein, P.; Arneth, A.; et al. Greening of the Earth and its drivers. Nat. Clim. Change 2016, 6, 791–795. [Google Scholar] [CrossRef]
- Mao, L.; Pei, X.; He, C.; Bian, P.; Song, D.; Fang, M.; Wu, W.; Zhan, H.; Zhou, W.; Tian, G. Spatiotemporal Changes in Vegetation Cover and Soil Moisture in the Lower Reaches of the Heihe River Under Climate Change. Forests 2024, 15, 1921. [Google Scholar] [CrossRef]
- Tian, X.; Tao, Z.; Xie, Y.; Shao, W.; Zhang, S. Spatiotemporal Evolution and Driving Mechanism of Fractional Vegetation Coverage in the Yangtze River Delta. IEEE J. Sel. Top. Appl. Earth Obs. Remote Sens. 2024, 17, 10979–10997. [Google Scholar] [CrossRef]
- Tong, S.; Zhang, J.; Ha, S.; Lai, Q.; Ma, Q. Dynamics of Fractional Vegetation Coverage and Its Relationship with Climate and Human Activities in Inner Mongolia, China. Remote Sens. 2016, 8, 776. [Google Scholar] [CrossRef]
- Lai, J.; Zhao, T.; Qi, S. Spatiotemporal Variation in Vegetation and Its Driving Mechanisms in the Southwest Alpine Canyon Area of China. Forests 2023, 14, 2357. [Google Scholar] [CrossRef]
- Kong, Z.; Ling, H.; Deng, M.; Han, F.; Yan, J.; Deng, X.; Wang, Z.; Ma, Y.; Wang, W. Past and projected future patterns of fractional vegetation coverage in China. Sci. Total Environ. 2023, 902, 166133. [Google Scholar] [CrossRef]
- Shen, Y.; Li, T.; Tang, M.; Deng, H. Spatial patterns of biocultural diversity in Southwest China. Acta Ecol. Sin. 2019, 39, 2454–2461. [Google Scholar]
- Li, X.; Liu, Y.; Wang, L. Change in Fractional Vegetation Cover and Its Prediction during the Growing Season Based on Machine Learning in Southwest China. Remote Sens. 2024, 16, 3623. [Google Scholar] [CrossRef]
- Li, X.; Jia, H.; Wang, L. Remote Sensing Monitoring of Drought in Southwest China Using Random Forest and eXtreme Gradient Boosting Methods. Remote Sens. 2023, 15, 4840. [Google Scholar] [CrossRef]
- Li, W.; Kang, J.; Wang, Y. Integrating ecosystem services supply-demand balance into landscape ecological risk and its driving forces assessment in Southwest China. J. Clean. Prod. 2024, 475, 143671. [Google Scholar] [CrossRef]
- Jiang, Z.; Lian, Y.; Qin, X. Rocky desertification in Southwest China: Impacts, causes, and restoration. Earth-Sci. Rev. 2014, 132, 1–12. [Google Scholar] [CrossRef]
- Li, W.; Kang, J.; Wang, Y. Effects of habitat fragmentation on ecosystem services and their trade-offs in Southwest China: A multi-perspective analysis. Ecol. Indic. 2024, 167, 112699. [Google Scholar] [CrossRef]
- Kuang, Y.; Zhou, H.; Yin, L. Assessment of the Impact of Land Use on Biodiversity Based on Multiple Scenarios—A Case Study of Southwest China. Diversity 2024, 16, 630. [Google Scholar] [CrossRef]
- Holben, B.N. Characteristics of maximum-value composite images from temporal AVHRR data. Int. J. Remote Sens. 1986, 7, 1417–1434. [Google Scholar] [CrossRef]
- Peng, S.; Ding, Y.; Liu, W.; Li, Z. 1 km monthly temperature and precipitation dataset for China from 1901 to 2017. Earth Syst. Sci. Data. 2019, 11, 1931–1946. [Google Scholar] [CrossRef]
- Chen, Z.; Yu, B.; Yang, C.; Zhou, Y.; Yao, S.; Qian, X.; Wang, C.; Wu, B.; Wu, J. An extended time series (2000–2018) of global NPP-VIIRS-like nighttime light data from a cross-sensor calibration. Earth Syst. Sci. Data 2021, 13, 889–906. [Google Scholar] [CrossRef]
- Gocic, M.; Trajkovic, S. Analysis of changes in meteorological variables using Mann-Kendall and Sen’s slope estimator statistical tests in Serbia. Glob. Planet. Change 2013, 100, 172–182. [Google Scholar] [CrossRef]
- Yue, S.; Pilon, P.; Cavadias, G. Power of the Mann–Kendall and Spearman’s rho tests for detecting monotonic trends in hydrological series. J. Hydrol. 2002, 259, 254–271. [Google Scholar] [CrossRef]
- Yan, Y.; Liu, H.; Bai, X.; Zhang, W.; Wang, S.; Luo, J.; Cao, Y. Exploring and attributing change to fractional vegetation coverage in the middle and lower reaches of Hanjiang River Basin, China. Environ. Monit. Assess. 2022, 195, 131. [Google Scholar] [CrossRef] [PubMed]
- Xu, Y.; Dai, Q.-Y.; Zou, B.; Xu, M.; Feng, Y.-X. Tracing climatic and human disturbance in diverse vegetation zones in China: Over 20 years of NDVI observations. Ecol. Indic. 2023, 156, 111170. [Google Scholar] [CrossRef]
- Wang, J.-F.; Zhang, T.-L.; Fu, B.-J. A measure of spatial stratified heterogeneity. Ecol. Indic. 2016, 67, 250–256. [Google Scholar] [CrossRef]
- Wang, G.; Peng, W. Quantifying spatiotemporal dynamics of vegetation and its differentiation mechanism based on geographical detector. Environ. Sci. Pollut. Res. 2022, 29, 32016–32031. [Google Scholar] [CrossRef]
- Zhou, Z.; Ding, Y.; Shi, H.; Cai, H.; Fu, Q.; Liu, S.; Li, T. Analysis and prediction of vegetation dynamic changes in China: Past, present and future. Ecol. Indic. 2020, 117, 106642. [Google Scholar] [CrossRef]
- Zhuang, Q.; Wu, S.; Feng, X.; Niu, Y. Analysis and prediction of vegetation dynamics under the background of climate change in Xinjiang, China. PeerJ 2020, 8, e8282. [Google Scholar] [CrossRef] [PubMed]
- Duan, C.; Li, J.; Chen, Y.; Ding, Z.; Ma, M.; Xie, J.; Yao, L.; Tang, X. Spatiotemporal Dynamics of Terrestrial Vegetation and Its Driver Analysis over Southwest China from 1982 to 2015. Remote Sens. 2022, 14, 2497. [Google Scholar] [CrossRef]
- Gu, Z.; Duan, X.; Shi, Y.; Li, Y.; Pan, X. Spatiotemporal variation in vegetation coverage and its response to climatic factors in the Red River Basin, China. Ecol. Indic. 2018, 93, 54–64. [Google Scholar] [CrossRef]
- Li, P.; He, Z.; He, D.; Xue, D.; Wang, Y.; Cao, S. Fractional vegetation coverage response to climatic factors based on grey relational analysis during the 2000-2017 growing season in Sichuan Province, China. Int. J. Remote Sens. 2019, 41, 1170–1190. [Google Scholar] [CrossRef]
- Ma, Y.; Guan, Q.; Sun, Y.; Zhang, J.; Yang, L.; Yang, E.; Li, H.; Du, Q. Three-dimensional dynamic characteristics of vegetation and its response to climatic factors in the Qilian Mountains. CATENA 2022, 208, 105694. [Google Scholar] [CrossRef]
- Chen, W.; Bai, S.; Zhao, H.; Han, X.; Li, L. Spatiotemporal analysis and potential impact factors of vegetation variation in the karst region of Southwest China. Environ. Sci. Pollut. Res. 2021, 28, 61258–61273. [Google Scholar] [CrossRef]
- Mekonnen, Z.; Taddese Berie, H.; Woldeamanuel, T.; Asfaw, Z.; Kassa, H. Land use and land cover changes and the link to land degradation in Arsi Negele district, Central Rift Valley, Ethiopia. Remote Sens. Appl. Soc. Environ. 2018, 12, 1–9. [Google Scholar] [CrossRef]
- Kolluru, V.; John, R.; Chen, J.; Xiao, J.; Amirkhiz, R.G.; Giannico, V.; Kussainova, M. Optimal ranges of social-environmental drivers and their impacts on vegetation dynamics in Kazakhstan. Sci. Total Environ. 2022, 847, 157562. [Google Scholar] [CrossRef]
- Tao, J.; Xu, T.; Dong, J.; Yu, X.; Jiang, Y.; Zhang, Y.; Huang, K.; Zhu, J.; Dong, J.; Xu, Y.; et al. Elevation-dependent effects of climate change on vegetation greenness in the high mountains of southwest China during 1982–2013. Int. J. Climatol. 2018, 38, 2029–2038. [Google Scholar] [CrossRef]
- Zhang, Y.; Peng, C.; Li, W.-Z.; Tian, L.; Zhu, Q.; Chen, H.; Fang, X.; Zhang, G.; Liu, G.; Mu, X.; et al. Multiple afforestation programs accelerate the greenness in the ‘Three North’ region of China from 1982 to 2013. Ecol. Indic. 2016, 61, 404–412. [Google Scholar] [CrossRef]
- Ma, H.; Zhang, L.; Wei, X.; Shi, T.; Chen, T. Spatial and temporal variations of land use and vegetation cover in Southwest China from 2000 to 2015. Chin. J. Appl. Ecol. 2021, 32, 618–628. [Google Scholar]


| Data | Type | Resolution | Date | Usage | Source |
|---|---|---|---|---|---|
| EVI | Vegetation | 1 km | 2000–2022 | FVC calculation | RESDC |
| Temperature | Climatic natural factors | 1 km | 2000–2022 | Multiple Regression Residual analysis/Geographic Detector analysis | NESSDC |
| Precipitation | Climatic natural factors | 1 km | 2000–2022 | NESSDC | |
| SRTM DEM | Non-Climatic natural factors | 30 m | 2000 | Geographic Detector analysis | GDC |
| Slope | Non-Climatic natural factors | 30 m | 2000 | Geographic Detector analysis | GDC |
| Aspect | Non-Climatic natural factors | 30 m | 2000 | Geographic Detector analysis | GDC |
| Vegetation types | Non-Climatic natural factors | 1 km | 2000 | Geographic Detector analysis | RESDC |
| Soil types | Non-Climatic natural factors | 1 km | 2000 | Geographic Detector analysis | RESDC |
| Population | Human activity factor | 1 km | 2000–2020 | Geographic Detector analysis | RESDC |
| GDP | Human activity factor | 1 km | 2000–2020 | Geographic Detector analysis | RESDC |
| NTL | Human activity factor | 500 m | 2000–2022 | Geographic Detector analysis | NESSDC |
| CMIP6 | Future climate scenarios | 50 km | 2015–2100 | FVC changes in the future | RESDC |
| FVC | FVC Change | FVC Fluctuation | |||
|---|---|---|---|---|---|
| FVC Value | Classification | TSM&MK | Classification | CV Value | Classification |
| <20% | Low FVC | β > 0 and Z ≥ 1.96 | Significant increase | <0.1 | Low fluctuation |
| 20%–35% | Medium Low FVC | β > 0 and Z < 1.96 | Slight increase | 0.1–0.2 | Relatively low fluctuation |
| 35%–50% | Medium FVC | β < 0 and Z < 1.96 | Slight decrease | 0.2–0.3 | Moderate fluctuation |
| 50%–65% | Medium High FVC | β < 0 and Z ≥ 1.96 | Significant decrease | 0.3–0.4 | Relatively high fluctuation |
| >65% | High FVC | >0.4 | High fluctuation | ||
| β | Type of Influences | Relative Contribution | |||
|---|---|---|---|---|---|
| Climate Change | Human Activities | ||||
| >0 | >0 | >0 | Jointly promotion | ) | ) |
| >0 | <0 | Climate promotion | 100 | 0 | |
| <0 | >0 | Human promotion | 0 | 100 | |
| <0 | <0 | <0 | Jointly inhibition | ) | ) |
| <0 | >0 | Climate inhibition | 100 | 0 | |
| >0 | <0 | Human inhibition | 0 | 100 | |
Disclaimer/Publisher’s Note: The statements, opinions and data contained in all publications are solely those of the individual author(s) and contributor(s) and not of MDPI and/or the editor(s). MDPI and/or the editor(s) disclaim responsibility for any injury to people or property resulting from any ideas, methods, instructions or products referred to in the content. |
© 2025 by the authors. Licensee MDPI, Basel, Switzerland. This article is an open access article distributed under the terms and conditions of the Creative Commons Attribution (CC BY) license (https://creativecommons.org/licenses/by/4.0/).
Share and Cite
Cheng, P.; Wu, K.; Pan, Y. Spatiotemporal Variations of Fractional Vegetation Coverage and Its Driving Mechanisms in Southwestern China. Forests 2025, 16, 798. https://doi.org/10.3390/f16050798
Cheng P, Wu K, Pan Y. Spatiotemporal Variations of Fractional Vegetation Coverage and Its Driving Mechanisms in Southwestern China. Forests. 2025; 16(5):798. https://doi.org/10.3390/f16050798
Chicago/Turabian StyleCheng, Pingping, Kunpeng Wu, and Yujun Pan. 2025. "Spatiotemporal Variations of Fractional Vegetation Coverage and Its Driving Mechanisms in Southwestern China" Forests 16, no. 5: 798. https://doi.org/10.3390/f16050798
APA StyleCheng, P., Wu, K., & Pan, Y. (2025). Spatiotemporal Variations of Fractional Vegetation Coverage and Its Driving Mechanisms in Southwestern China. Forests, 16(5), 798. https://doi.org/10.3390/f16050798