Article

Effects of Plant Communities in Urban Green Spaces on Microclimate and Thermal Comfort

College of Landscape Architecture, Jiyang College of Zhejiang A&F University, Zhuji 311800, China
*
Author to whom correspondence should be addressed.
Forests 2025, 16(5), 799; https://doi.org/10.3390/f16050799
Submission received: 30 March 2025 / Revised: 1 May 2025 / Accepted: 8 May 2025 / Published: 10 May 2025
(This article belongs to the Section Urban Forestry)

Abstract

:
Urban green spaces are crucial for regulating microclimates and enhancing human comfort. The study, conducted at Jiyang College of Zhejiang A&F University, investigates the effects of plant communities with diverse canopy structures on campus microclimates and thermal comfort in summer and winter. Data on air temperature (AT), relative humidity (RH), wind speed (WS), and light intensity (LI) were collected over three consecutive sunny days in both summer and winter. Concurrently, plant community structural characteristics, including three-dimensional green biomass (3DGB), canopy density (CD), and sky-view factor (SVF), were measured and analyzed. Quantitative relationships between these plant characteristics and microclimate/thermal comfort indices were evaluated using statistical analyses. The results indicate that, in summer, plant communities produced significant cooling (daily average AT reduced by 2.3 °C) and humidifying effects, and decreased the daily maximum thermal humidity index (THI) by 1 °C compared to control areas without vegetation. In winter, the moderation of temperature and humidity was present but less pronounced, and no statistically significant temperature difference was observed. Communities with larger 3DGB, higher CD, and lower SVF provided more effective shading and improved microclimatic regulation. A regression analysis identified AT as the primary factor influencing outdoor thermal comfort across both seasons. Planting configurations such as “Tree-Shrub-Herb” and “Tree-Small Tree”, as well as the use of broad-crowned shade trees, were shown to be effective in optimizing microclimate and outdoor comfort. Overall, enhancing the vegetation structure may address outdoor thermal comfort requirements in campus environments throughout the year.

1. Introduction

Urbanization has become a growing global trend, with projections indicating that cities will accommodate around two-thirds of the world’s population by 2050.
While urbanization has been instrumental in advancing human civilization and economic development, it has also led to environmental problems, such as the urban heat island effect and heat waves [1]. Despite urban areas covering less than 3% of the Earth’s surface, they contribute to approximately 71% of global energy-related carbon emissions [2]. The urban heat island (UHI) effect is both a global and local issue that is predicted to increase the frequency and intensity of extreme temperature and precipitation events, exerting a key substantial influence on urban regions. The rise in average temperature and the associated climate change have been shown to have various negative impacts on urban environments.
As an important part of the urban ecosystem, urban green space is widely involved in the exchange and utilization of material and energy in the urban ecosystem, fostering the harmonious coexistence of society and nature. Urban green space helps to alleviate the increasingly severe urban heat island effect and becomes a key element in the virtuous cycle of urban ecosystems [3,4]. Park greening in urban green space can contribute to improving the thermal comfort of tourists by providing shade and regulating microclimate conditions, thus mitigating the urban heat island effect [5]. Furthermore, green spaces in urban areas help decrease noise levels, improve air quality, and reduce urban rainwater runoff [6,7,8].
In addition to large-scale green spaces, small green spaces also actively improve the microclimate. Wu et al. suggested that small-sized green spaces under 1 hectare can enhance the outdoor thermal environment of urban communities via optimized size, shape, and distribution. For example, linear green spaces along narrow streets can reduce the PCI by 10.2 °C [9]. Ariani et al. put forward that, in high-density building areas, pocket parks with an area of less than 1 hectare can significantly improve the local microclimate and provide residents with a more comfortable environment [10]. It is also found that a pocket park can effectively reduce the temperature of the surrounding environment during the high temperature period in summer, and the cooling effect on local areas of the city is obvious [11]. Rui et al. quantified the impact of green space in residential areas on microclimate and studied the impact of different types of vegetation (herbaceous plants, shrubs, and trees) and different green layouts on central green space in residential areas [12]. Lu et al. tested four green layouts in a residential area of Chongqing, including an arbor–grass mix, a shrub–grass mix, a single lawn, and an arbor–shrub–grass mix. It was found that grass mixed planting and tree–shrub–grass mixed planting showed effective cooling and humidifying effects [13]. School campuses, as part of the urban environment, are characterized by a high population density and diverse activities. The outdoor thermal comfort of campus outdoor spaces, which serve as daily activity sites for faculty and students, has profound significance for their outdoor activities. The changes in meteorological factors (AT, RH, WS, solar radiation, etc.) in campus green spaces also have a significant impact on human health [14]. Antoniadis et al. conducted field microclimate measurements at two Greek universities and found that solar radiation was the main factor leading to heat perception and heat stress, followed by WS, vegetation, building materials, and building orientation [15]. Öğüztürk took the South Campus of Anhui Jianzhu University as an example, analyzed the impact of different types of green space (broadleaf trees, conifers, shrubs, and lianas) on urban temperature regulation, and found that green space can significantly reduce the ground temperature and improve thermal comfort during the high temperature period in summer [16]. The academic research of Antoniadis et al. on the thermal environment of school playgrounds demonstrated that increasing the vegetation coverage can significantly enhance the outdoor microclimate environment [17]. Zhang et al. investigated four distinct types of outdoor spaces on university campuses (fully open, semi-open, semi-enclosed, and fully enclosed areas) and utilized the physiological equivalent temperature (PET) as an indicator to analyze the spatiotemporal distribution of thermal comfort. Their research revealed that outdoor thermal comfort is influenced by multiple factors, including vegetation, surface materials, building configurations, and wind–heat environmental conditions [18]. Ghaffarianhoseini et al. employed an ENVI-met numerical simulation to assess the thermal comfort conditions on the campus of the University of Kuala Lumpur and discovered that spaces sheltered by trees and adjacent buildings offered favorable thermal comfort [19]. Nastos et al. conducted field measurements of temperature, relative humidity, wind speed, and total solar irradiance in the atrium, open area, and green atrium of campus buildings. Based on the RayMan urban microclimate model, the physiological equivalent temperature (PET) was modeled by using different sky-view factors. Through the analysis of biometric meteorological perception and thermal sensation in the complex microenvironment of the campus of the University of Athens, the results show that trees and green vegetation play a crucial role in the complex environment and are key factors in alleviating heat stress and improving the quality of life of residents in urban areas [20]. The existing research predominantly examines large-scale green spaces, such as urban parks and urban forests, with limited focus on small-scale green spaces [21,22]. Accordingly, it is of important practical significance to analyze the impact of campus green space on microclimate.
The introduction of plant elements in microclimate modeling can contribute to the assessment of the thermal environment and comfort of outdoor microclimates in urban environments [23]. Plants contribute to cooling the air by evaporating water through leaf transpiration, absorbing heat, and converting solar radiation into latent heat. Green spaces enhance human comfort by reducing the air temperature and blocking direct sunlight [24,25,26]. Trees’ cooling effects vary depending on factors such as air conditions, wind speed, solar radiation, and stomatal resistance. Stomatal resistance helps to mitigate environmental effects on leaf temperature in situations where higher wind speeds can diminish the cooling effect of the tree [27]. Tree canopies filter sunlight, allowing only 15% to reach the ground during the day [28], creating distinct microclimatic conditions significantly different from the surrounding environmental climate [29,30]. Biophysical processes like evaporation, transpiration, and shading mitigate temperature fluctuations throughout the day, with tree canopies retaining heat at night [31,32]. These mechanisms create favorable microclimatic conditions for species beneath the canopy. Research indicates that green spaces, especially those with tall trees and extensive canopy coverage, enhance thermal comfort [33].
Further in-depth study revealed that canopy characteristics, canopy density, canopy porosity, leaf area index, and sky-view factor have a significant influence on summer thermal comfort indices and negative oxygen ion concentrations [34]. Factors such as understory and canopy density (CD) have a significant impact on meteorological indicators [35]. The tree crown density of plants can lower air temperature and increase air humidity [36]. The number of effective layers and diversity in leaf height within plant communities had a more pronounced impact on air and soil temperature variations compared to canopy cover, plant area index, stand height, and altitude [37]. Areas with denser tree coverage (lower SVF and higher LAI) tend to be cooler [38]. Different phytocommunities, such as grassland, woodland, and ornamental shrubs, were found to affect temperature differently in distinct environments [39]. Different tree species exhibit significant variations in morphological characteristics (e.g., height, crown width, and leaf density), which play a regulatory role in microclimate modulation [40].
The cooling and humidifying effectiveness of urban green spaces is acknowledged as crucial ecological infrastructure for mitigating urban thermal issues. Studies indicate that the size and distribution of green spaces significantly impact their cooling abilities. However, the relationship between plant formation structure configuration and ecological services in urban forest planning requires further investigation. Notably, there is a research gap concerning how the phytocoenosium structure interacts with human thermal comfort. Conducting thorough research in this area is essential for enhancing urban green spaces’ ecological functions and improving living environments.
This study focuses on the typical urban green space type of campus green space and explores the quantitative relationship between vegetation community microclimate factors, plant canopy structure, and thermal comfort through seasonal (summer and winter) comparative studies. To be specific, this study proposes two core questions. (1) Do plant community characteristics have a marked differential effect on the distribution of temperature and humidity in campus green space, and do they have different effects in different seasons? (2) Based on the confirmation of the above impacts, is there a distinctive correlation between plant community canopy structure and microclimatic factors, along with their underlying mechanism?
The following research hypotheses are proposed in this study based on the above research questions:
Assumption 1 (H1):
Plant community characteristics have a prominent role in the distribution of temperature and humidity in campus green space.
H1a: 
Greater vertical structural diversity (tree–shrub–grass) leads to enhanced cooling and humidity regulation;
H1b: 
Increased horizontal plant coverage strengthens temperature and humidity regulation capabilities;
H1c: 
Temperature and humidity regulation by plant communities vary between seasons (summer and winter).
Assumption 2 (H2):
There is a noteworthy correlation between plant community canopy structure, microclimate factors, and thermal comfort.
H2a: 
The complexity of the plant canopy structure is positively correlated with thermal comfort;
H2b: 
Microclimatic factors (AT, RH, WS, etc.) act as mediating variables between plant canopy structure and thermal comfort;
H2c: 
Such correlations showed different characteristic patterns in summer and winter.

2. Materials and Methods

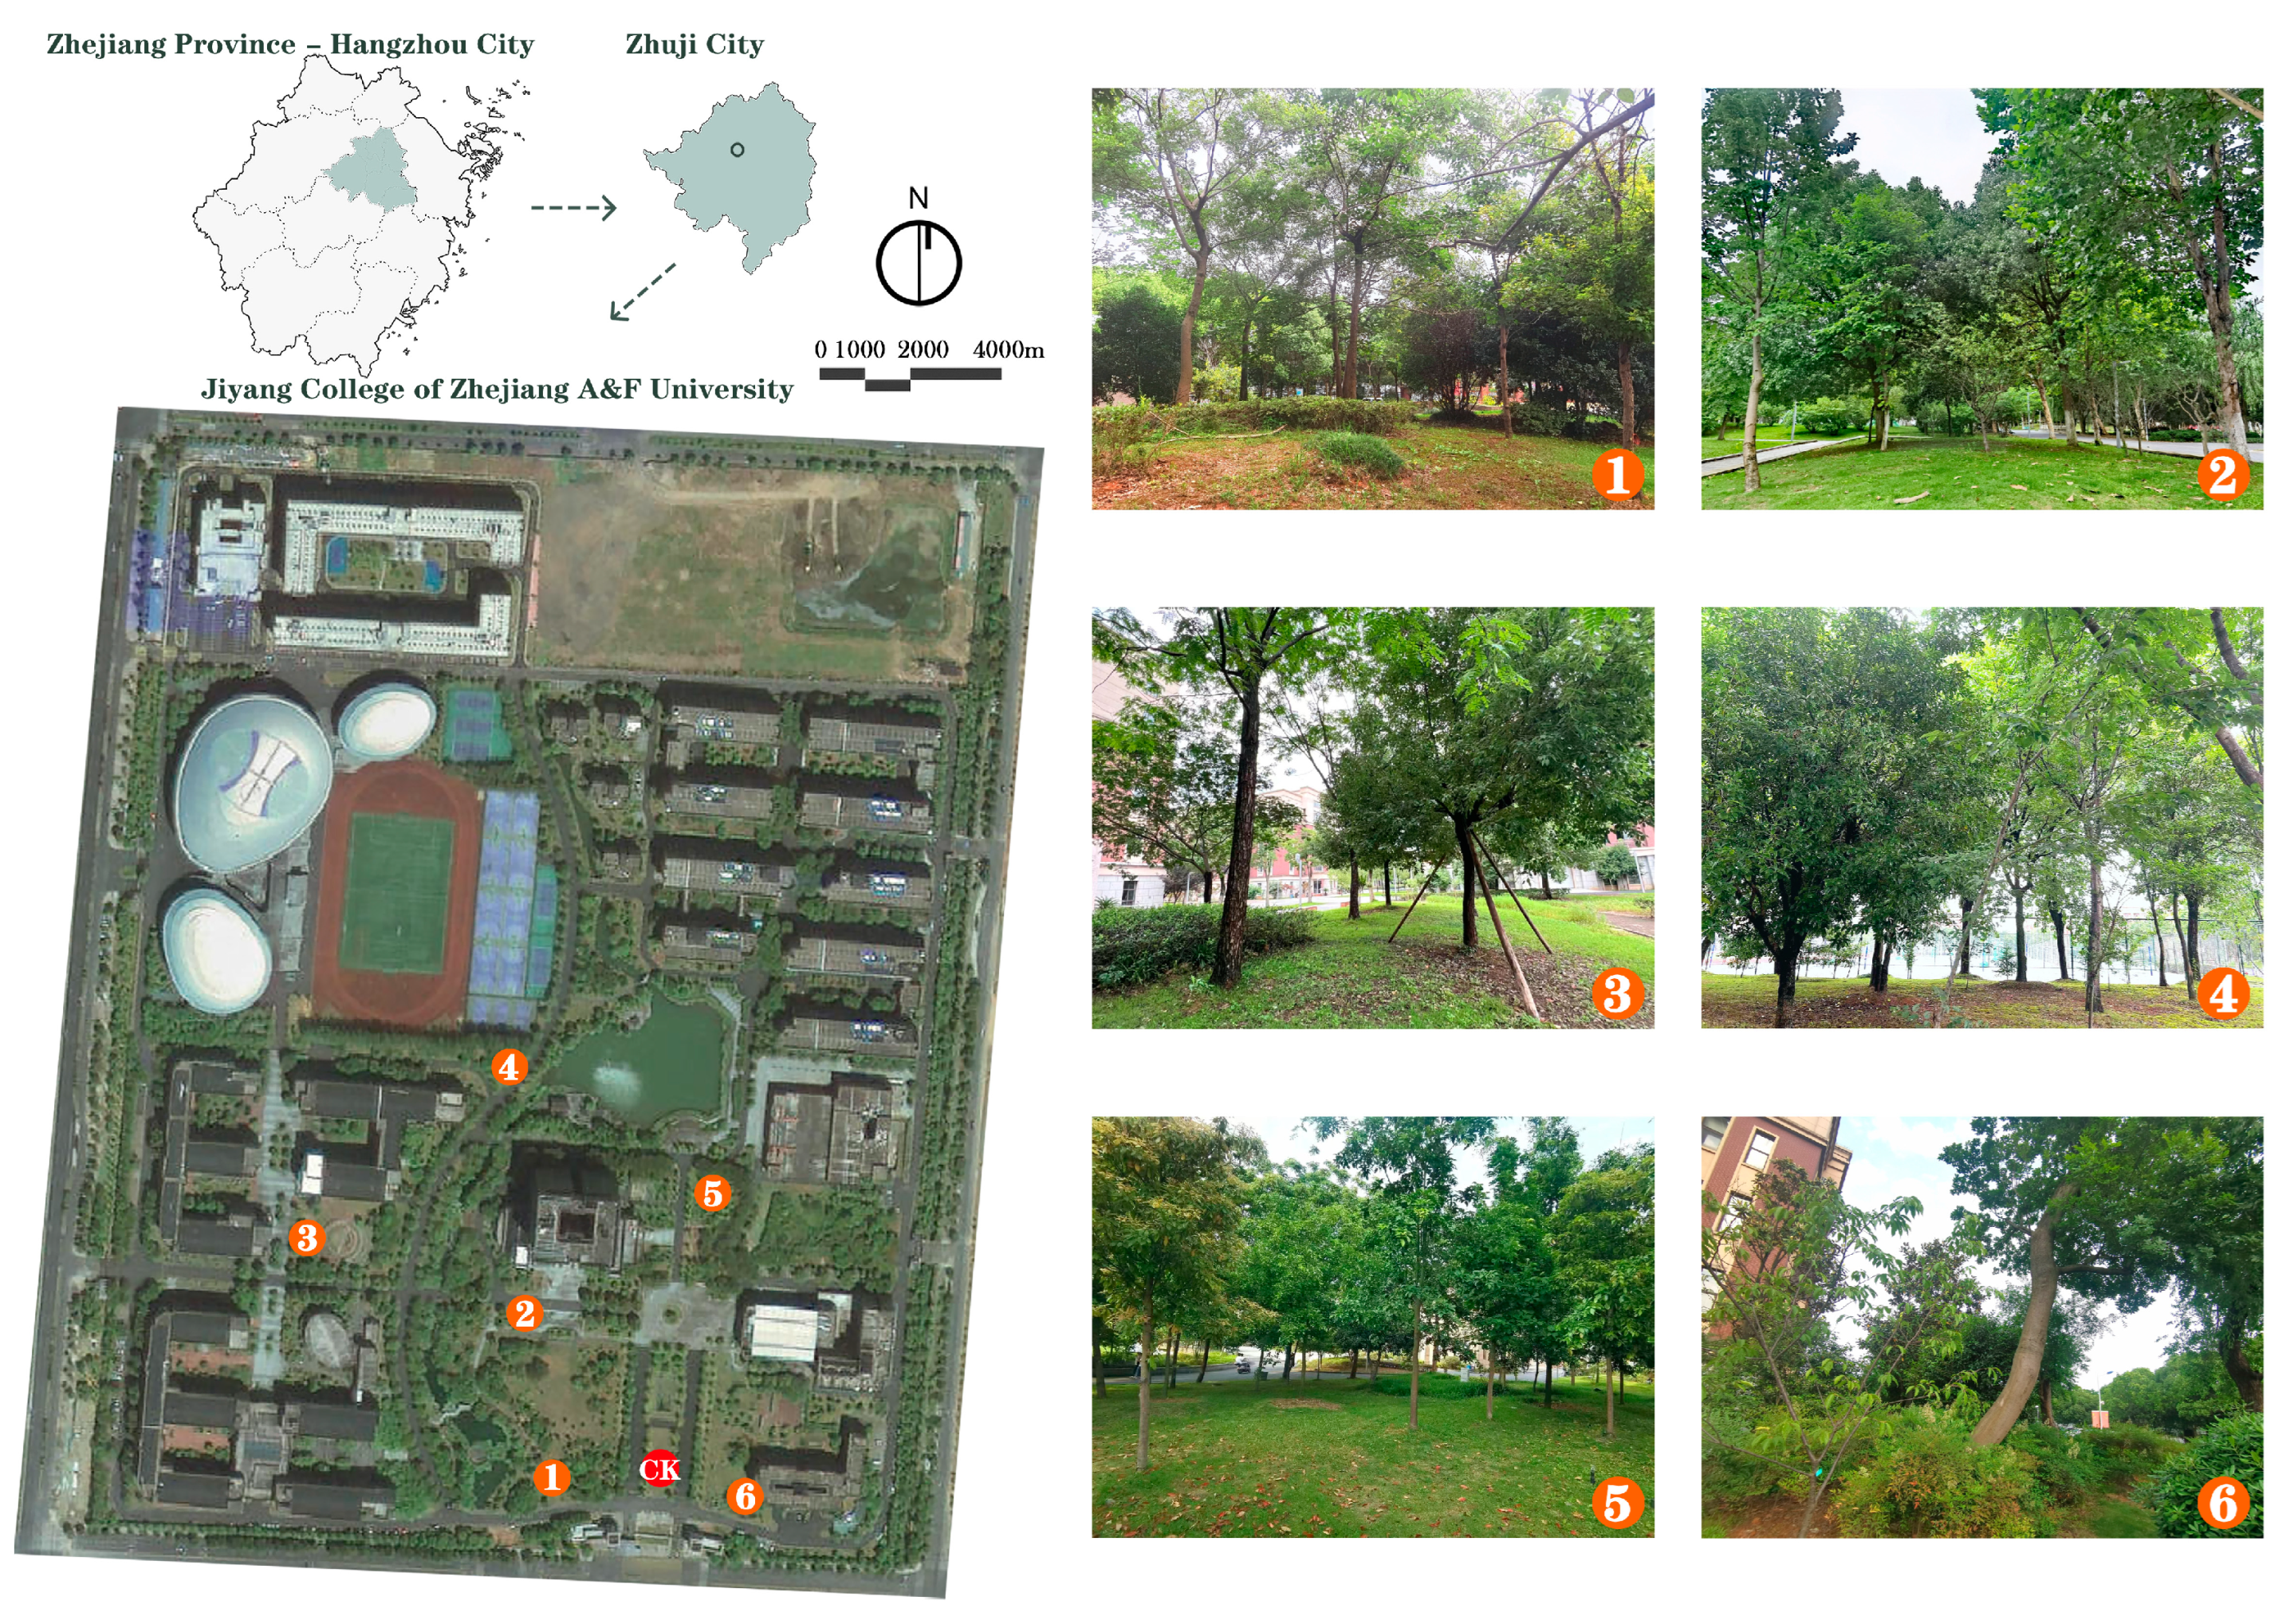
2.1. Study Area and Measurement Sites
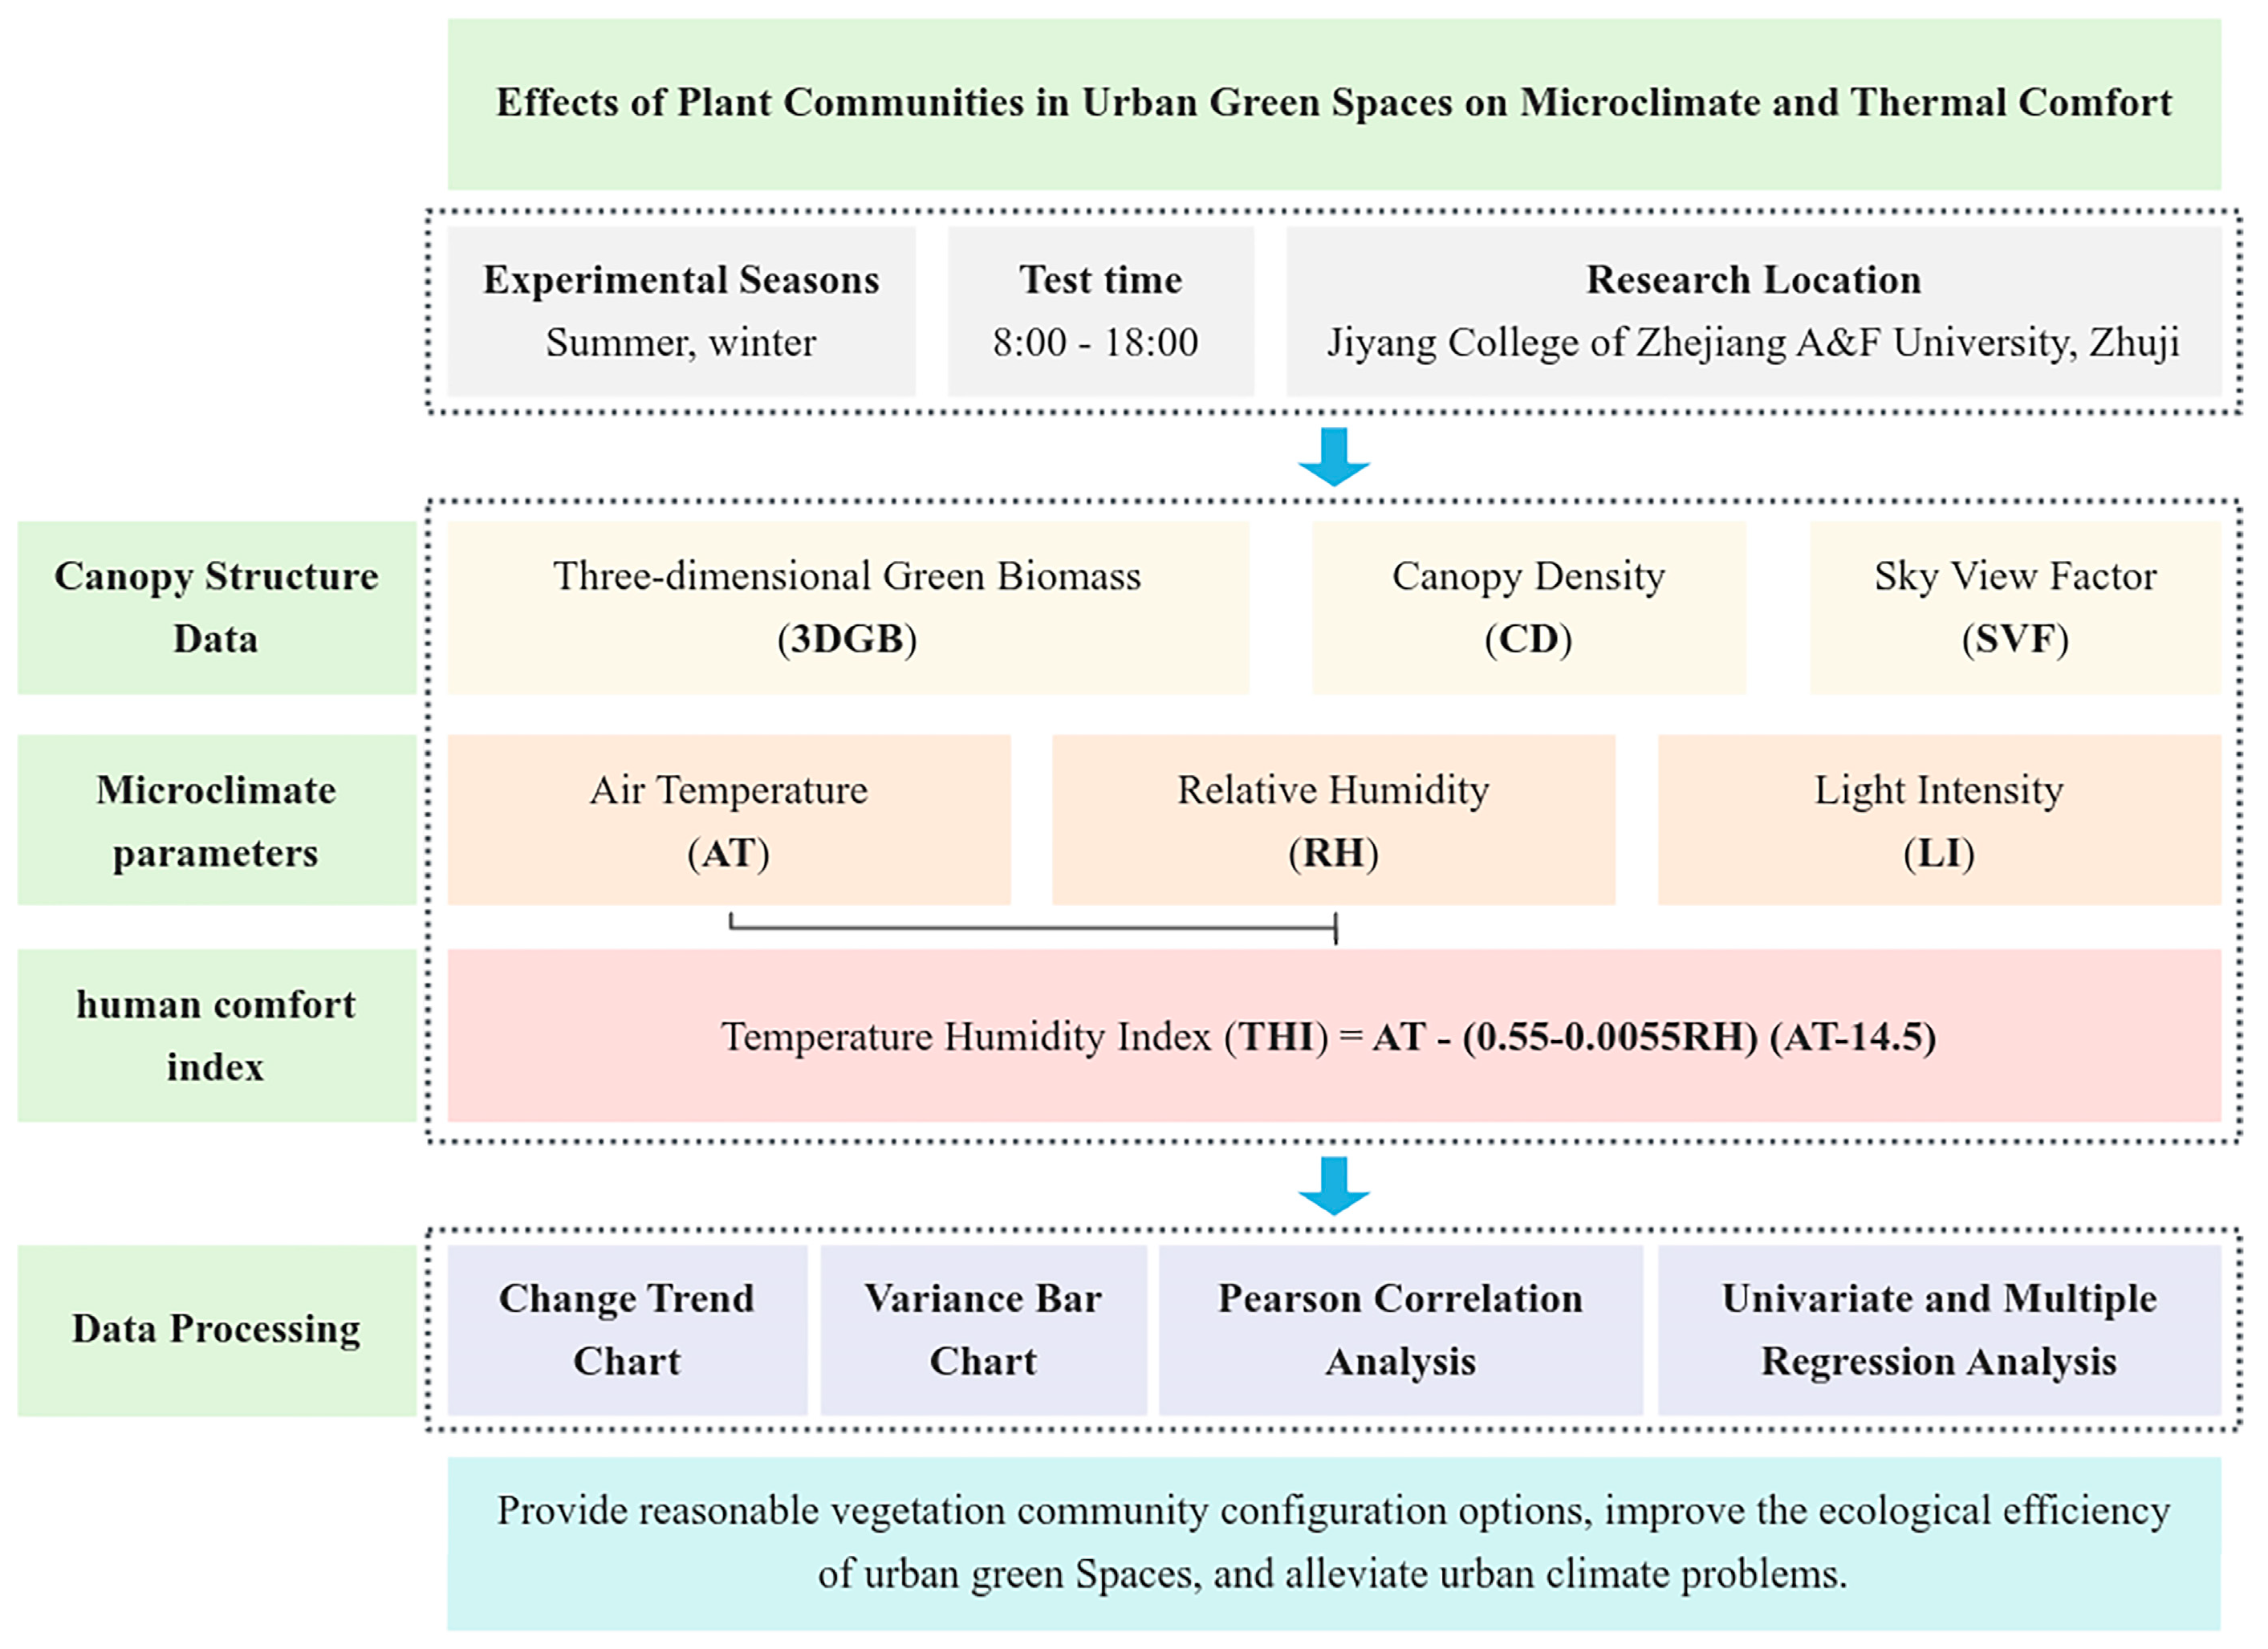
Zhuji City, Zhejiang Province (119°53′–120°32′ E, 29°21′–29°59′ N) is located in the central part of Zhejiang Province, with hills as the main terrain. It belongs to the subtropical humid monsoon climate, with cold winters and hot summers, four distinct seasons, and abundant annual precipitation. The average annual temperature is 16.3 °C, and the average annual precipitation is 1373.6 mm. July and August are the two hottest months of the year, with average lows of 25 °C and average highs of 34 °C, while December to January is the coldest time of the year, with average lows of 3 °C and average highs of 13 °C. The average low is 3 °C, and the average high is 13 °C.
This study was conducted on the campus of Jiyang College of Zhejiang A&F University in Zhuji City, Zhejiang Province. It is located in the North Education Park of Zhuji City, Zhejiang Province, covering an area of 350 hectares. The campus space is lushly green and dominated by trees, including sycamore, camphor, beech, and maple. A total of six groups of 10 m × 10 m-sized well-grown plant communities were selected, and the lawn of Ginkgo Avenue was used as the control point to carry out data observation of the microclimate meteorological factors (Figure 1).

2.2. Methods

This study aims to investigate the effects of plant community structure on microclimate and thermal comfort. Accurately obtain the canopy structure index, including 3DGB, CD, and SVF; Simultaneously monitor the microclimate parameters, including AT, RH, and LI. Based on the collected AT and RH data, the temperature and humidity index (THI) is obtained through scientific calculation, so as to quantitatively evaluate human comfort. In order to explore the internal relationship between canopy structure, microclimate, and human comfort, we used a variety of analysis methods. By drawing a change trend chart to visually present the data dynamics, using the variance column chart to compare the differences, using Pearson analysis to clarify the correlation of variables, and carrying out univariate/multivariate regression analyses to explore the potential laws, this study is committed to putting forward scientific and reasonable vegetation community configuration scheme based on the analysis results, optimizing the ecological function of urban green space, improving ecological efficiency, and providing strong support for effectively alleviating urban climate problems. The flowchart in Figure 2 illustrates the study procedures.

2.3. Measurement of Microclimatic Parameters and Canopy Structure Indices

The microclimate factors were monitored at 7 measurement points every 2 h from 8:00 to 18:00 on 28–30 December 2023 and 14–16 June 2024, voiding the potential impact of meteorological factors such as clouds, precipitation, and winds. Clear and windless (wind speed ≤ 2 m/s) weather was observed for observation on 3 consecutive days in every season. The monitored factors included air temperature (AT), relative humidity (RH), and light intensity (LI). AT and RH were measured at a height of 1.5 m above the ground using a temperature and humidity sensor (Tes-1365, Taipei, Taiwan; TA/RA accuracy = ±0.5 °C/±10%~95%), and LI was measured using a digital light meter (Tes-1332A, Taipei, Taiwan). The community at each sample site was surveyed and recorded, including basic data on species composition, configuration patterns, average tree height, average diameter at breast height, and canopy area.
In addition, we measured the canopy structure characteristics, including three-dimensional green biomass (3DGB), canopy density (CD), and sky-view factor (SVF) of the plant communities at the sampling and control points. Fisheye photographs of the community were taken through a fisheye lens combined with a digital camera (Canon EOS 6D Marked II, Sigma 8 mm circular fisheye lens, Sigma Ltd., Koriyama, Japan), and the photographs were imported into the HemiView 2.1 SR5 Sample Canopy Analysis System (Delta-T Devices Ltd., Burwell, UK) to calculate the results. Table 1 and Table 2 detail the vegetation characteristics of the seven plant communities in summer and winter.

2.4. Thermal Comfort Index

Human comfort is a biometeorological indicator based on the principle of heat balance between the human body and the surrounding environment, which evaluates the comfort degree of the person in different external environments from the meteorological environment viewpoint, and it is an important part of urban environmental meteorology. Human thermal comfort is defined as “the psychological state of satisfaction with the thermal environment” [41]. It is also influenced by various environmental factors, like AT, RH, WS, LI, etc., and individual factors, such as a person’s clothing and physical characteristics [42]. There are dozens of indicators for evaluating human comfort, and in this study, the temperature–humidity index (THI) from the National Weather Service in 1959, which is still widely used, was employed to evaluate the combined effect of air temperature and humidity on heat stress levels. The THI, which was proposed by Thom in 1959 as one of the models for evaluating human comfort [43], refers to the combination of temperature and humidity to reflect the heat exchange between the human body and the ambient conditions. In this study, the THI was used to evaluate each meteorological factor with the following formula, and the evaluation levels are shown in Table 3.
T H I = T ( 0.55 0.0055 R H ) / ( T 14.5 )
where THI is the temperature–humidity index, and the result retains a decimal. AT is the air temperature (°C). RH is the relative humidity (%).

2.5. Data Processing and Analysis

By calculating the changes in AT, RH, and LI in different plant communities during the observation time, the influence degree of different plant communities on the surrounding environment can be obtained. The corresponding calculation formula is as follows:
A T = A T c k A T b c
A T   r a t e = ( A T c k A T b c ) / A T c k × 100 %
R H = R H c k R H b c
R H   r a t e = ( R H c k R H b c ) / R H c k × 100 %
L I = L I c k L I b c
L I   r a t e = ( L I c k L I b c ) / L I c k × 100 %
T H I = T H I c k T H I b c
T H I   r a t e = ( T H I c k T H I b c ) / T H I c k × 100 %
where ck and bc represent the control site of the unshaded open space and the plant community, respectively.
Trends of AT, RH, and LI at each measurement point of the different plant communities during 8:00–16:00 were plotted using Origin. An analysis of variance was performed using SPSS 27.0 to analyze the change values and rate of change of the mean meteorological factors of the community types at different measurement points. A one-way ANOVA with Duncan’s method for multiple comparisons (p < 0.05) was used to analyze the variance values and rates of change of the mean meteorological factors of the community types at different measurement points using SPSS 27.0. Pearson’s correlation analysis (p < 0.05) served as the method to analyze the relationships and trends between 3DGB, CD, SVF, microclimate factors, and THI. The effects of different canopy structural features on microclimate factors and human comfort were further quantified using simple linear regression methods.

3. Results and Analysis

3.1. Quantitative Analysis of Microclimatic Characteristics

3.1.1. Air Temperature

The average AT of the six plant community sample sites and the CK in summer showed a unimodal trend, with an initial increase followed by a decrease (Figure 3a). The highest AT in summer occurred between 11:00 and 15:00, and the average AT of each vegetation community was lower than that of the CK. The mean AT of the CK was higher at 8:00, increased gradually, was higher than the AT of each sample site from 9:00 to 15:00, and then gradually decreased after sunset. The P4 plant community demonstrated the lowest average AT and the greatest deviation from the CK community compared to the other five plant communities. In contrast, the P5 plant community had the highest average AT and the smallest deviation from the CK.
Similar to summer, the average AT of the plant community at the measurement sites showed a single-peak trend in winter, with an initial increase followed by a decrease, with the highest AT occurring between the hours of 12:00 and 16:00. At 8:00, the average AT of the CK was relatively high, gradually increasing, and basically higher than the temperature of each site from 10:00 to 16:00. It then gradually decreased after 14:00, and the daily average temperature was slightly higher than that of each plant community. Among the various plant communities at each sample site, the P4 plant community demonstrated the smallest average AT and the greatest effect size, while the P6 plant community had the largest mean AT and the smallest effect value. A one-way ANOVA analysis of the daily average AT of the six plant communities and the CK lawn revealed significant differences in summer and non-significant differences in winter. The results showed that a considerable cooling effect occurred in the summer daytime, while the P2 and P4 sample site communities had a certain cooling effect in winter. Overall, the effect of plant communities on the AT was substantially greater in summer than in winter (Table 4).

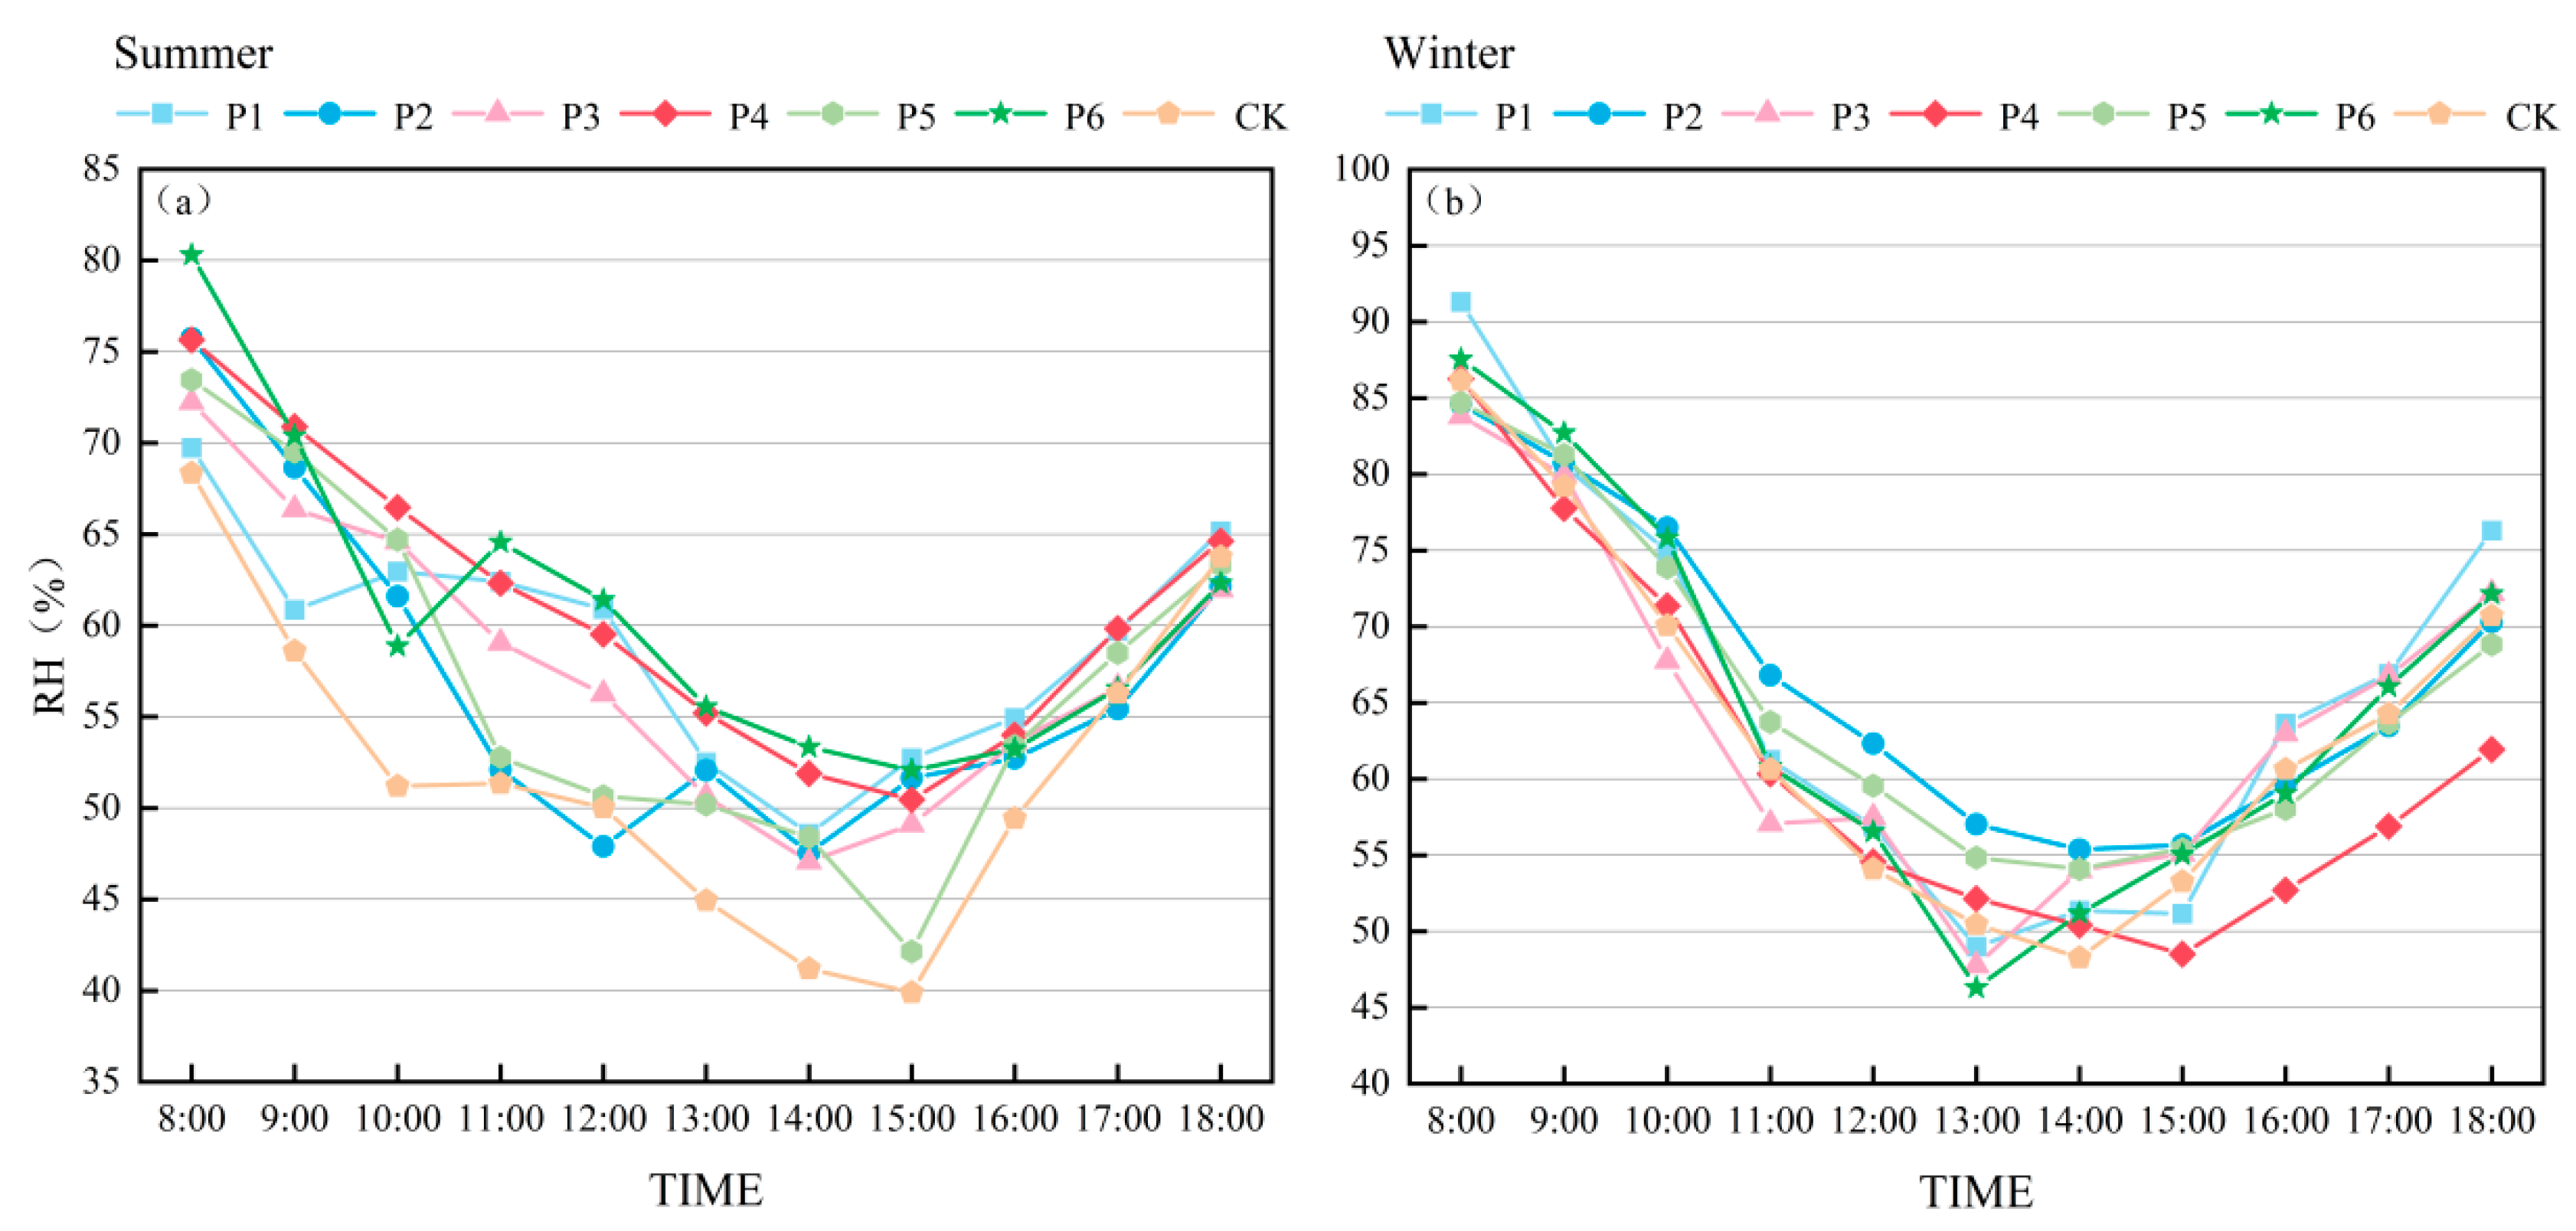
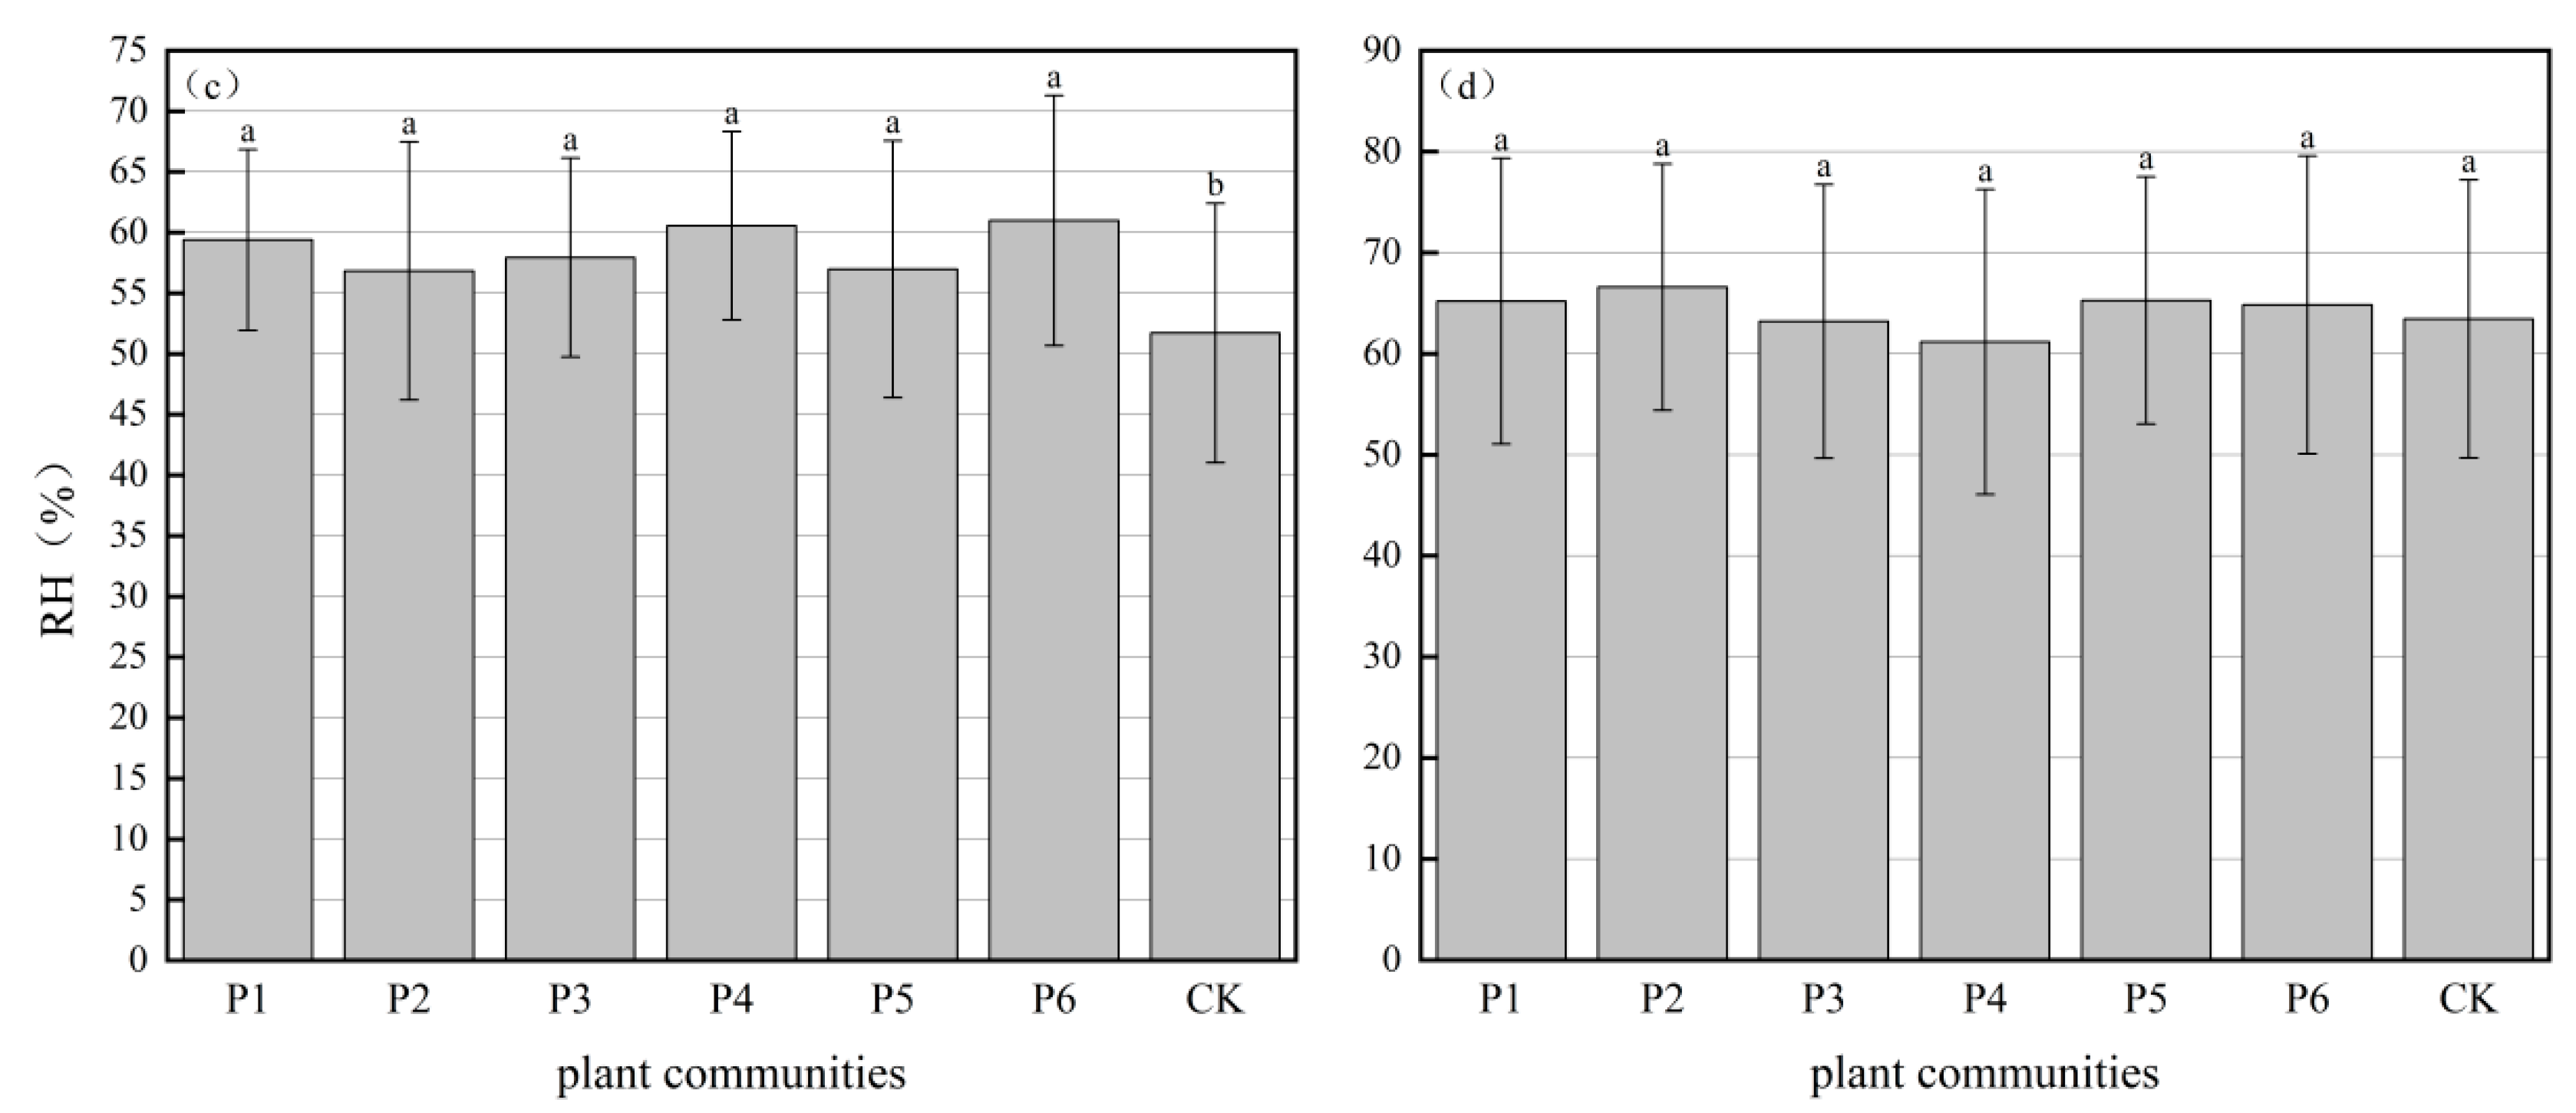
3.1.2. Relative Humidity

The daily trend of the average RH at the sample and the CK in summer was opposite to that of the AT, showing a trend of first decreasing and then increasing. The average daily RH in summer was highest at around 8:00 and lowest at 13:00–16:00. Compared to the sample site RH, the mean daily RH at the CK decreased considerably between 8:00 and 15:00 and increased rapidly around 15:00. During the experimental period, the mean daily RH and variability were lower in the P2 and P5 plant communities and higher in the P4 and P6 plant communities (Figure 4).
During wintertime, the daily average RH reached a maximum at around 8:00 and a minimum between 13:00 and 15:00. On the whole, the daily average RH pattern corresponds to the summer trend (except P3 and P4), and the CK had slightly lower daily mean RH than other plant communities. In the experimental process, the daily mean RH and variability were the greatest for the P2 plant community and the least for the P4 plant community.
A one-way ANOVA of the diurnal average RH between the sample site communities and the CK showed that the variability of each sample site was more significant than that of the CK in summer, and the variability was not significant in winter, indicating that the plant communities had a certain influence on RH. In addition, the differences between the different plant communities were more prominent in summer than in winter. Additionally, the variations among the different plant communities were more prominent in summer than in winter.

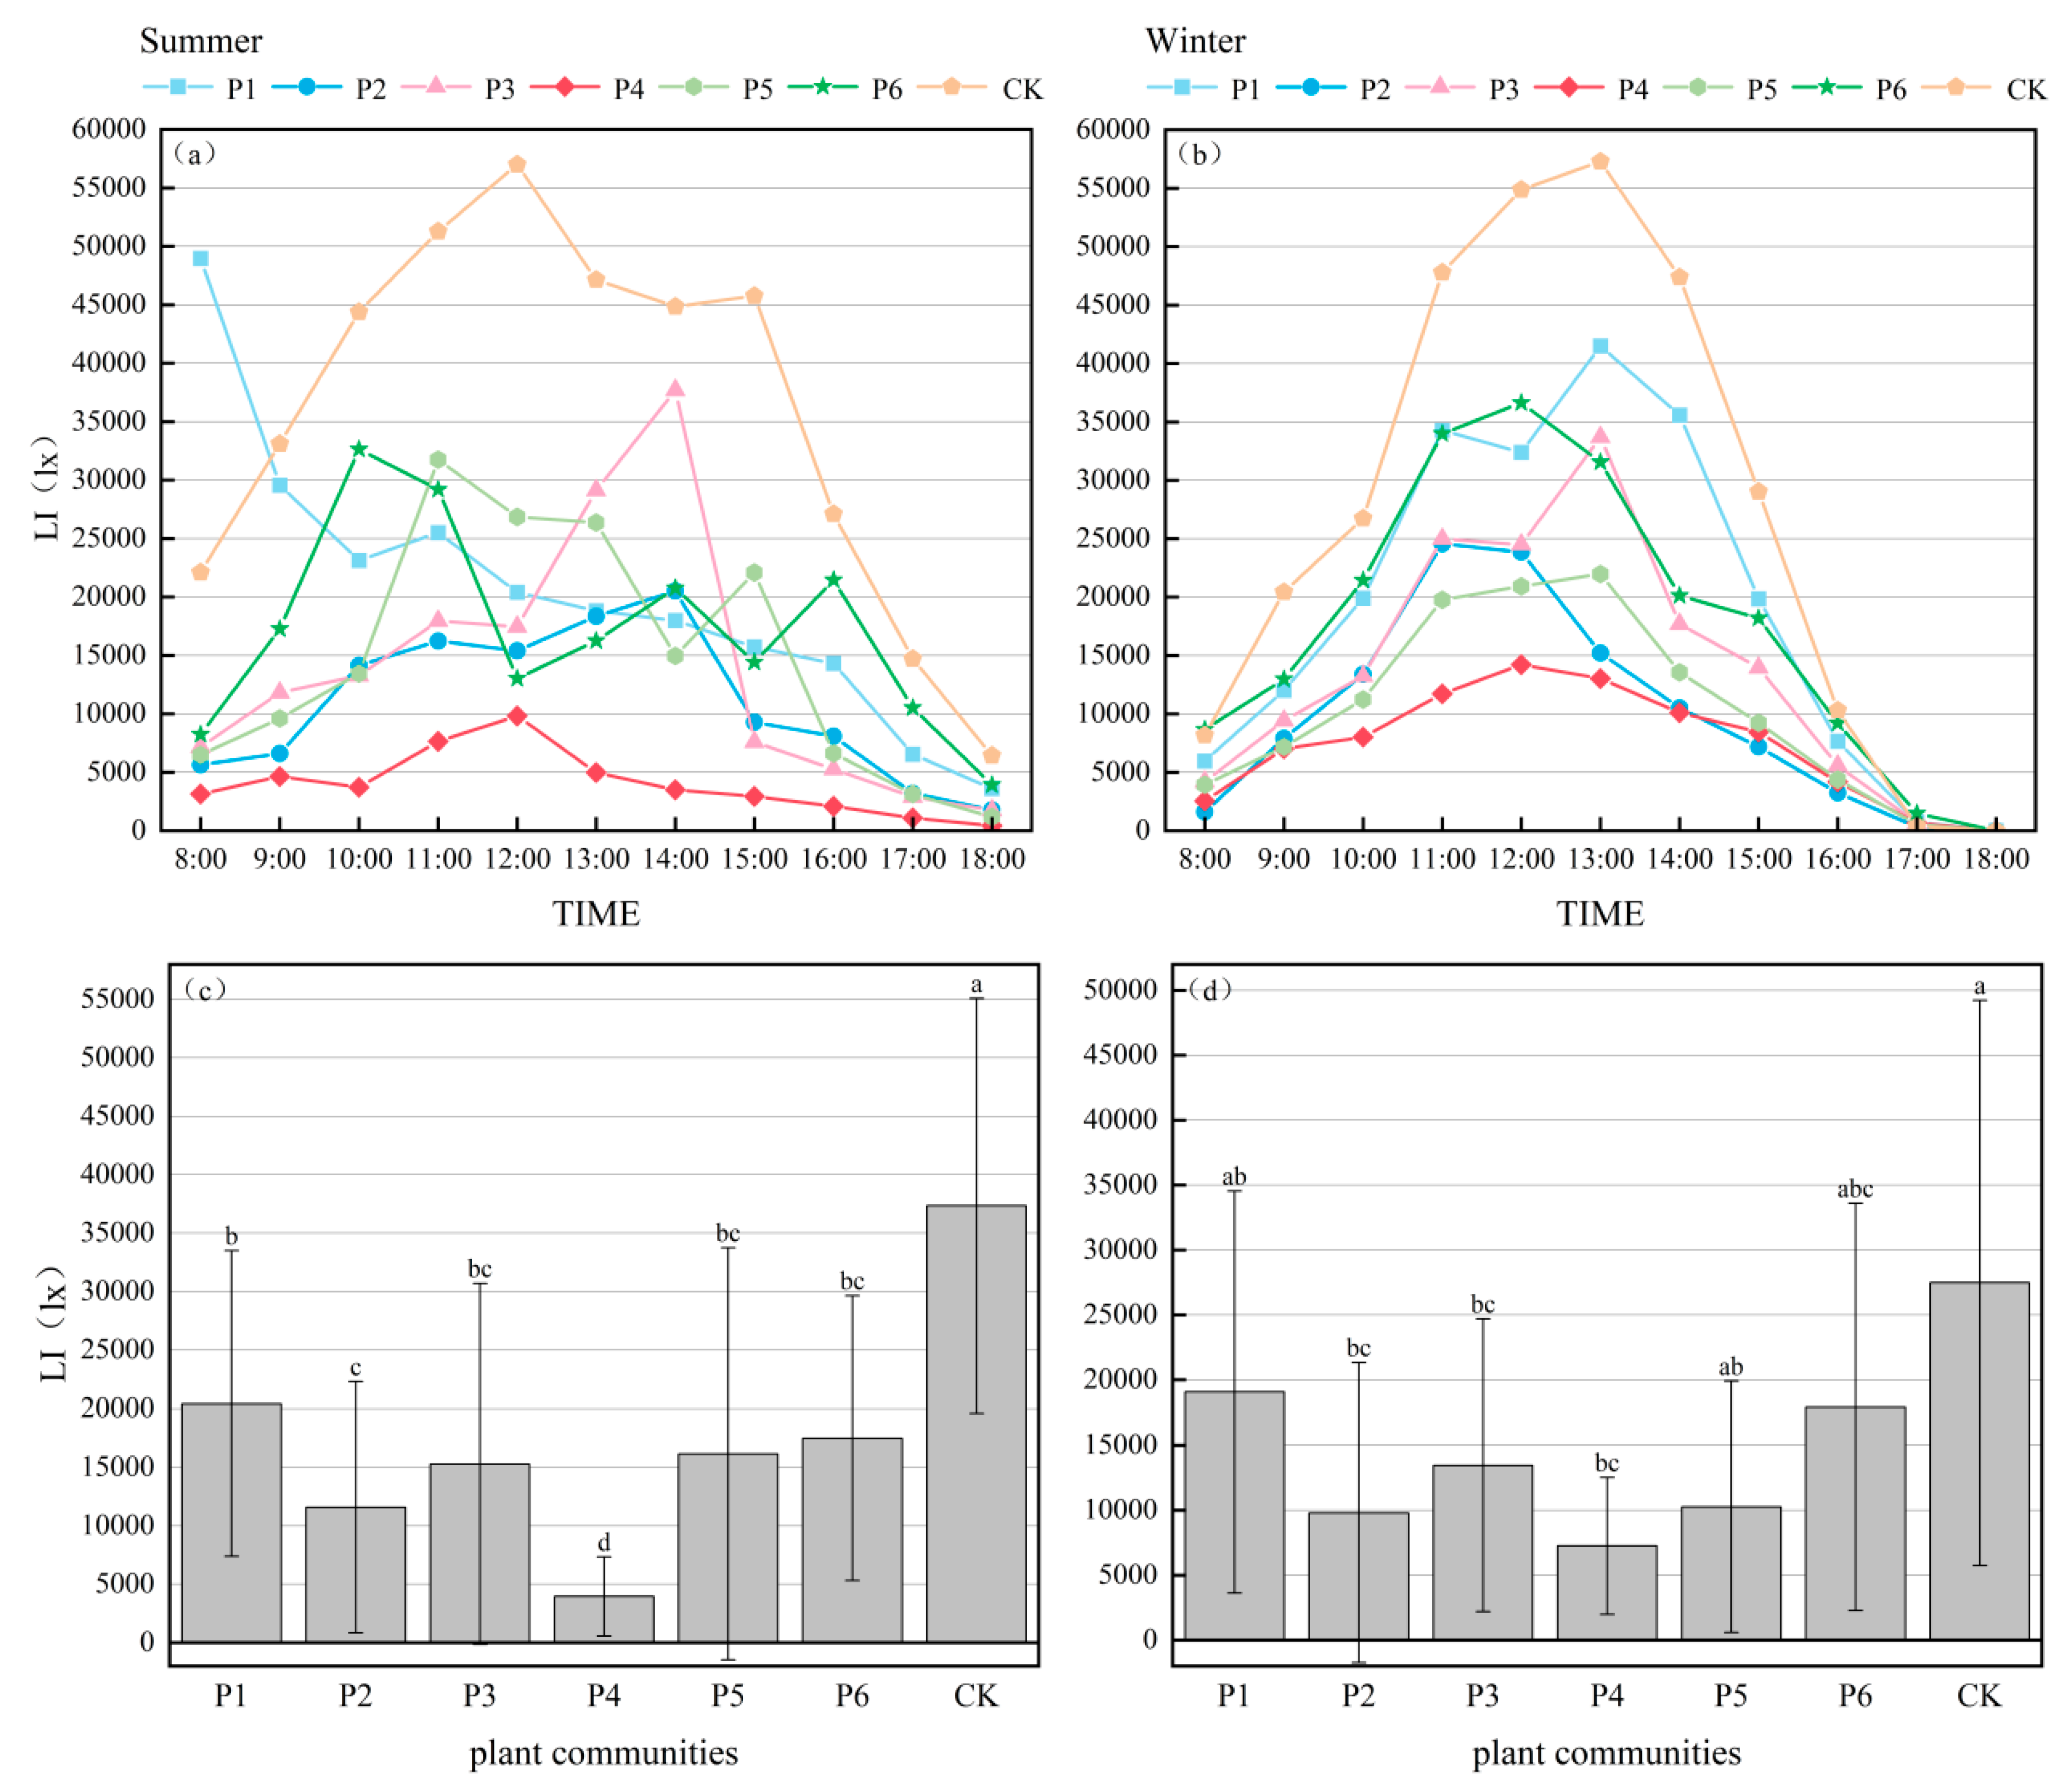
3.1.3. Light Intensity

The diurnal variation of the daily average LI in the vegetation community and the CK in summer was irregular, generally showing a single-peak pattern, with the peak usually occurring between 11:00 and 14:00 (Figure 5a). The CK’s LI was significantly larger than the other sample points, increasing more rapidly after 8:00, decreasing slowly from 12:00 to 15:00, and then declining rapidly thereafter. Significant differences were observed among plant communities at various locations. The P4 plant community had the minimum average daily LI and the maximum variability among them, while the P1 plant community had the maximum average daily LI and the minimum variability.
The diurnal variation of the daily average LI in the plant community and CK in winter was monomodal, with the highest point usually around 12:00. The LI at the CK was significantly higher than that at the sample points in winter, and increased faster after 8:00 a.m. During the period of 12:00–14:00, the LI of the CK decreased slowly, and then decreased sharply. At 18:00, the LI in all of the plant communities and the CK dropped to zero. Among the six plant communities, the average daily LI of the P2 and P4 plant communities was the smallest, with the greatest variability over the CK. The average daily LI of the P1 and P6 plant communities was larger, with less variability over the CK.
The one-way ANOVA results showed that the average daily LI of the plant communities in summer and winter differed from the CK, indicating that plant communities significantly reduced the LI. Moreover, the variation among the plant communities was more significant in summer than in winter.

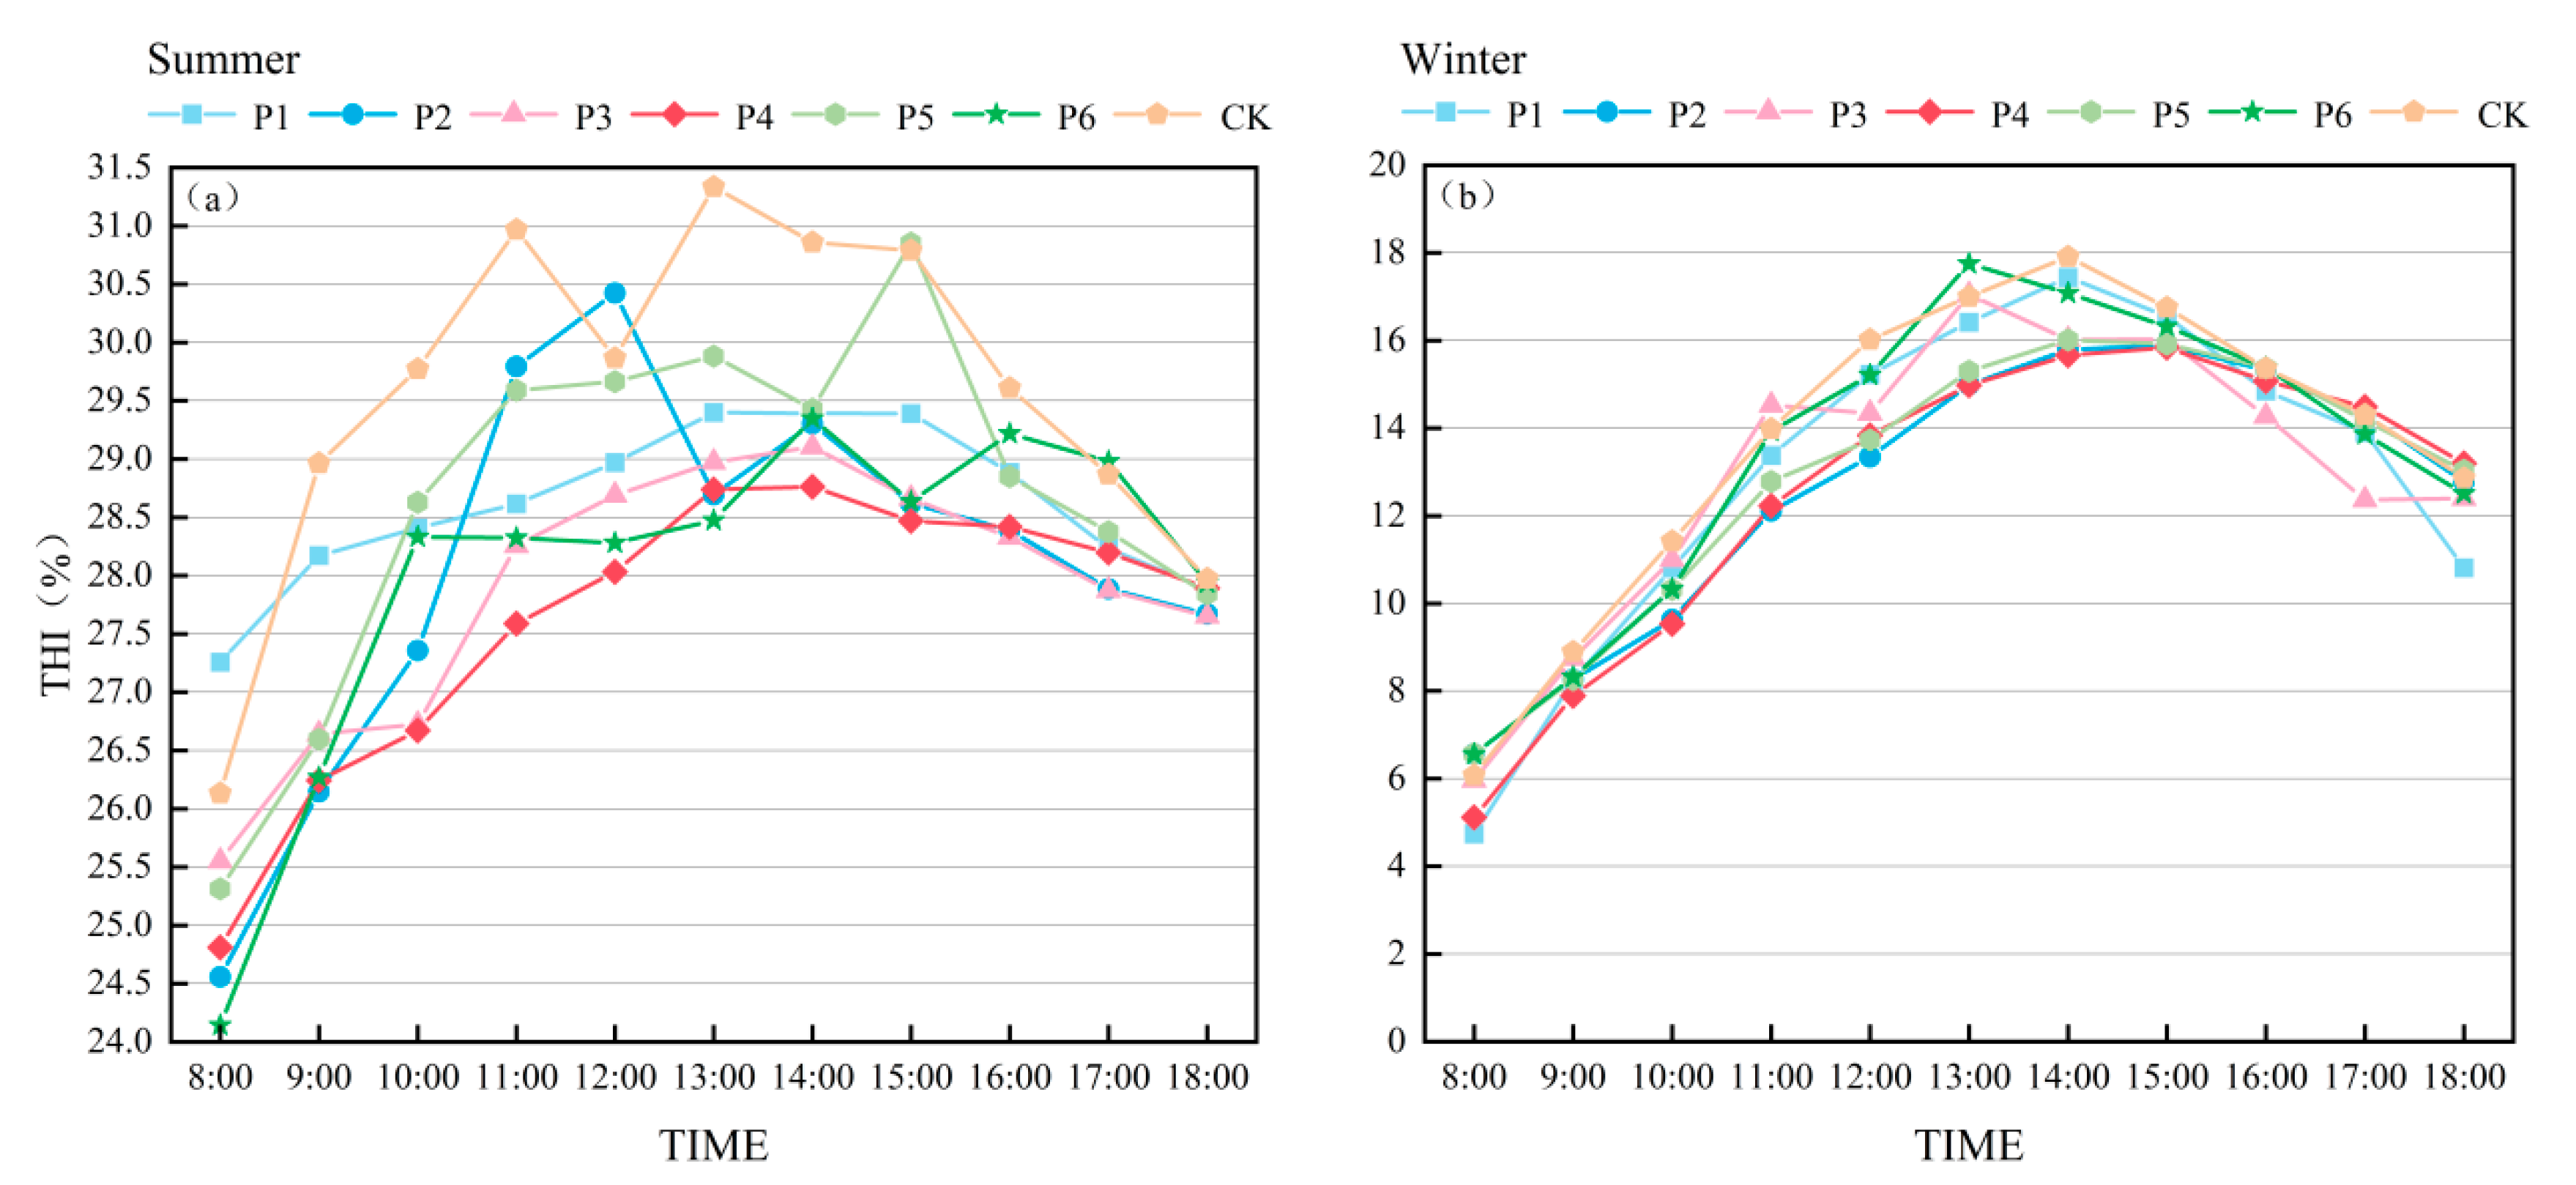
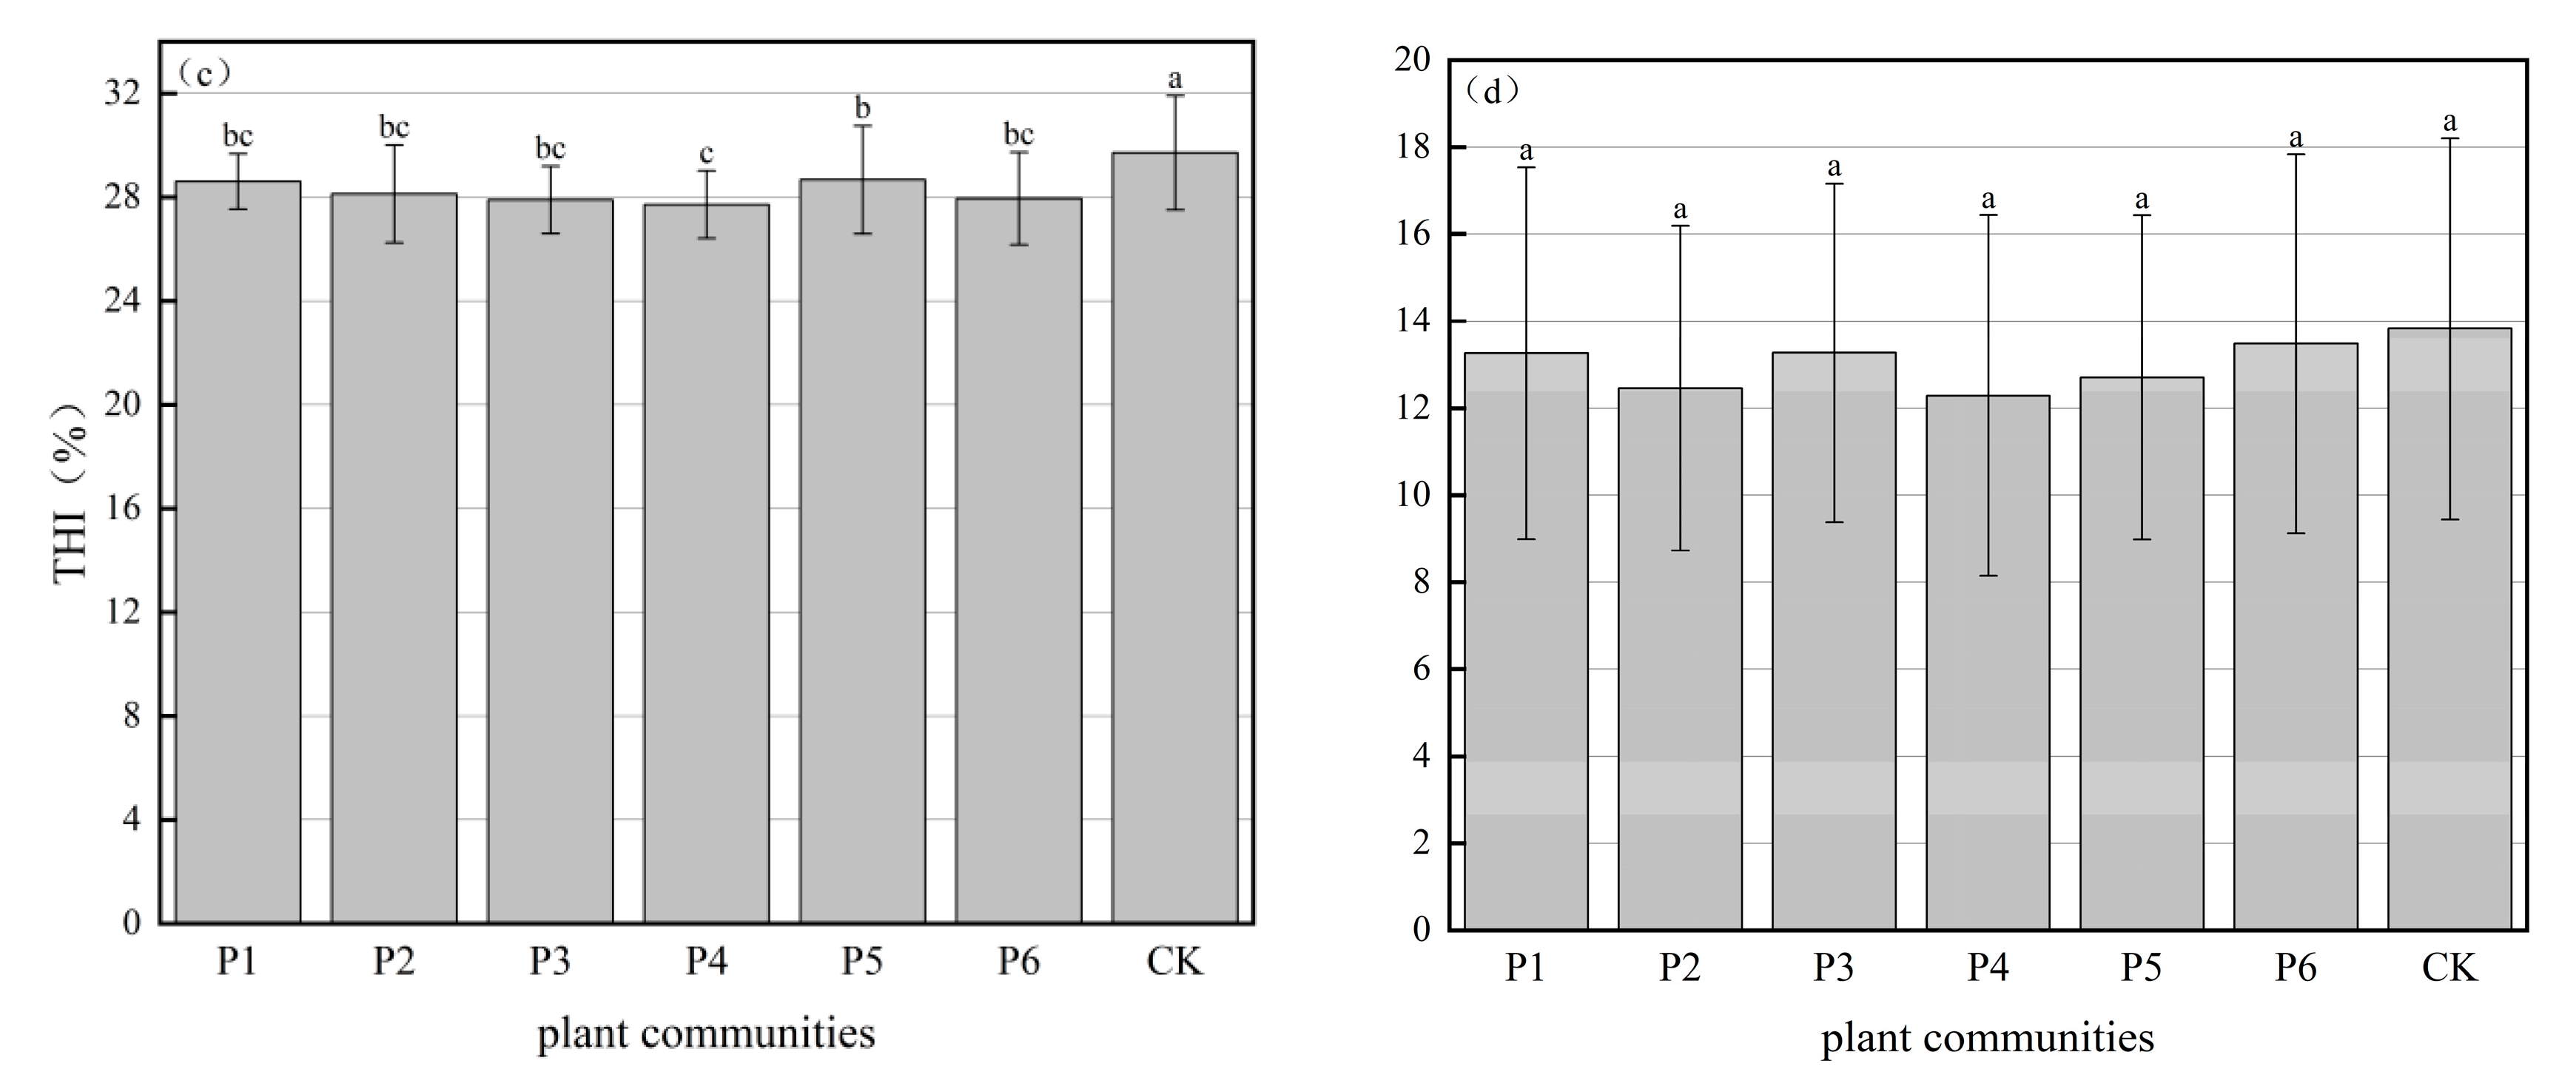
3.2. THI of Experimental Sample Sites

According to the formula of the THI, the human comfort degree of each phytocommunity and the CK were calculated at different times (Table 5), which showed an upward and then downward trend in summer and winter. In summer, the human comfort level of each plant community was at the level of “very hot”, but the daily average THI at the CK was higher than that at each site, which was close to the level of “stuffy”. At around 8:00 a.m., the human comfort level of each plant community and the CK were both at the “hot” level. During the experimental period, the average daily THI of the P1 plant community was the maximum, and the difference with the CK was the minimum. The average daily THI of the P4 community was the minimum, and the difference with the CK was the maximum.
As indicated in Table 5 and Figure 6, the average daily THI of the CK in winter was slightly greater than that of the plant communities, and the human body feeling was at the “cool” level. The average daily THIs of each sample site were lower than 13 °C, and the body comfort level was at the “cold” level. The human body feeling was at the “comfortable” level at around 14:00. Among the plant communities, the THI values were the maximum in the P6 and the minimum in the P4.
The ANOVA results showed that there was a statistically considerable variation in the average THI between the plant community and the CK in summer, and the difference in winter was small. In general, plant communities had a more prominent effect on improving environmental thermal comfort in summer.

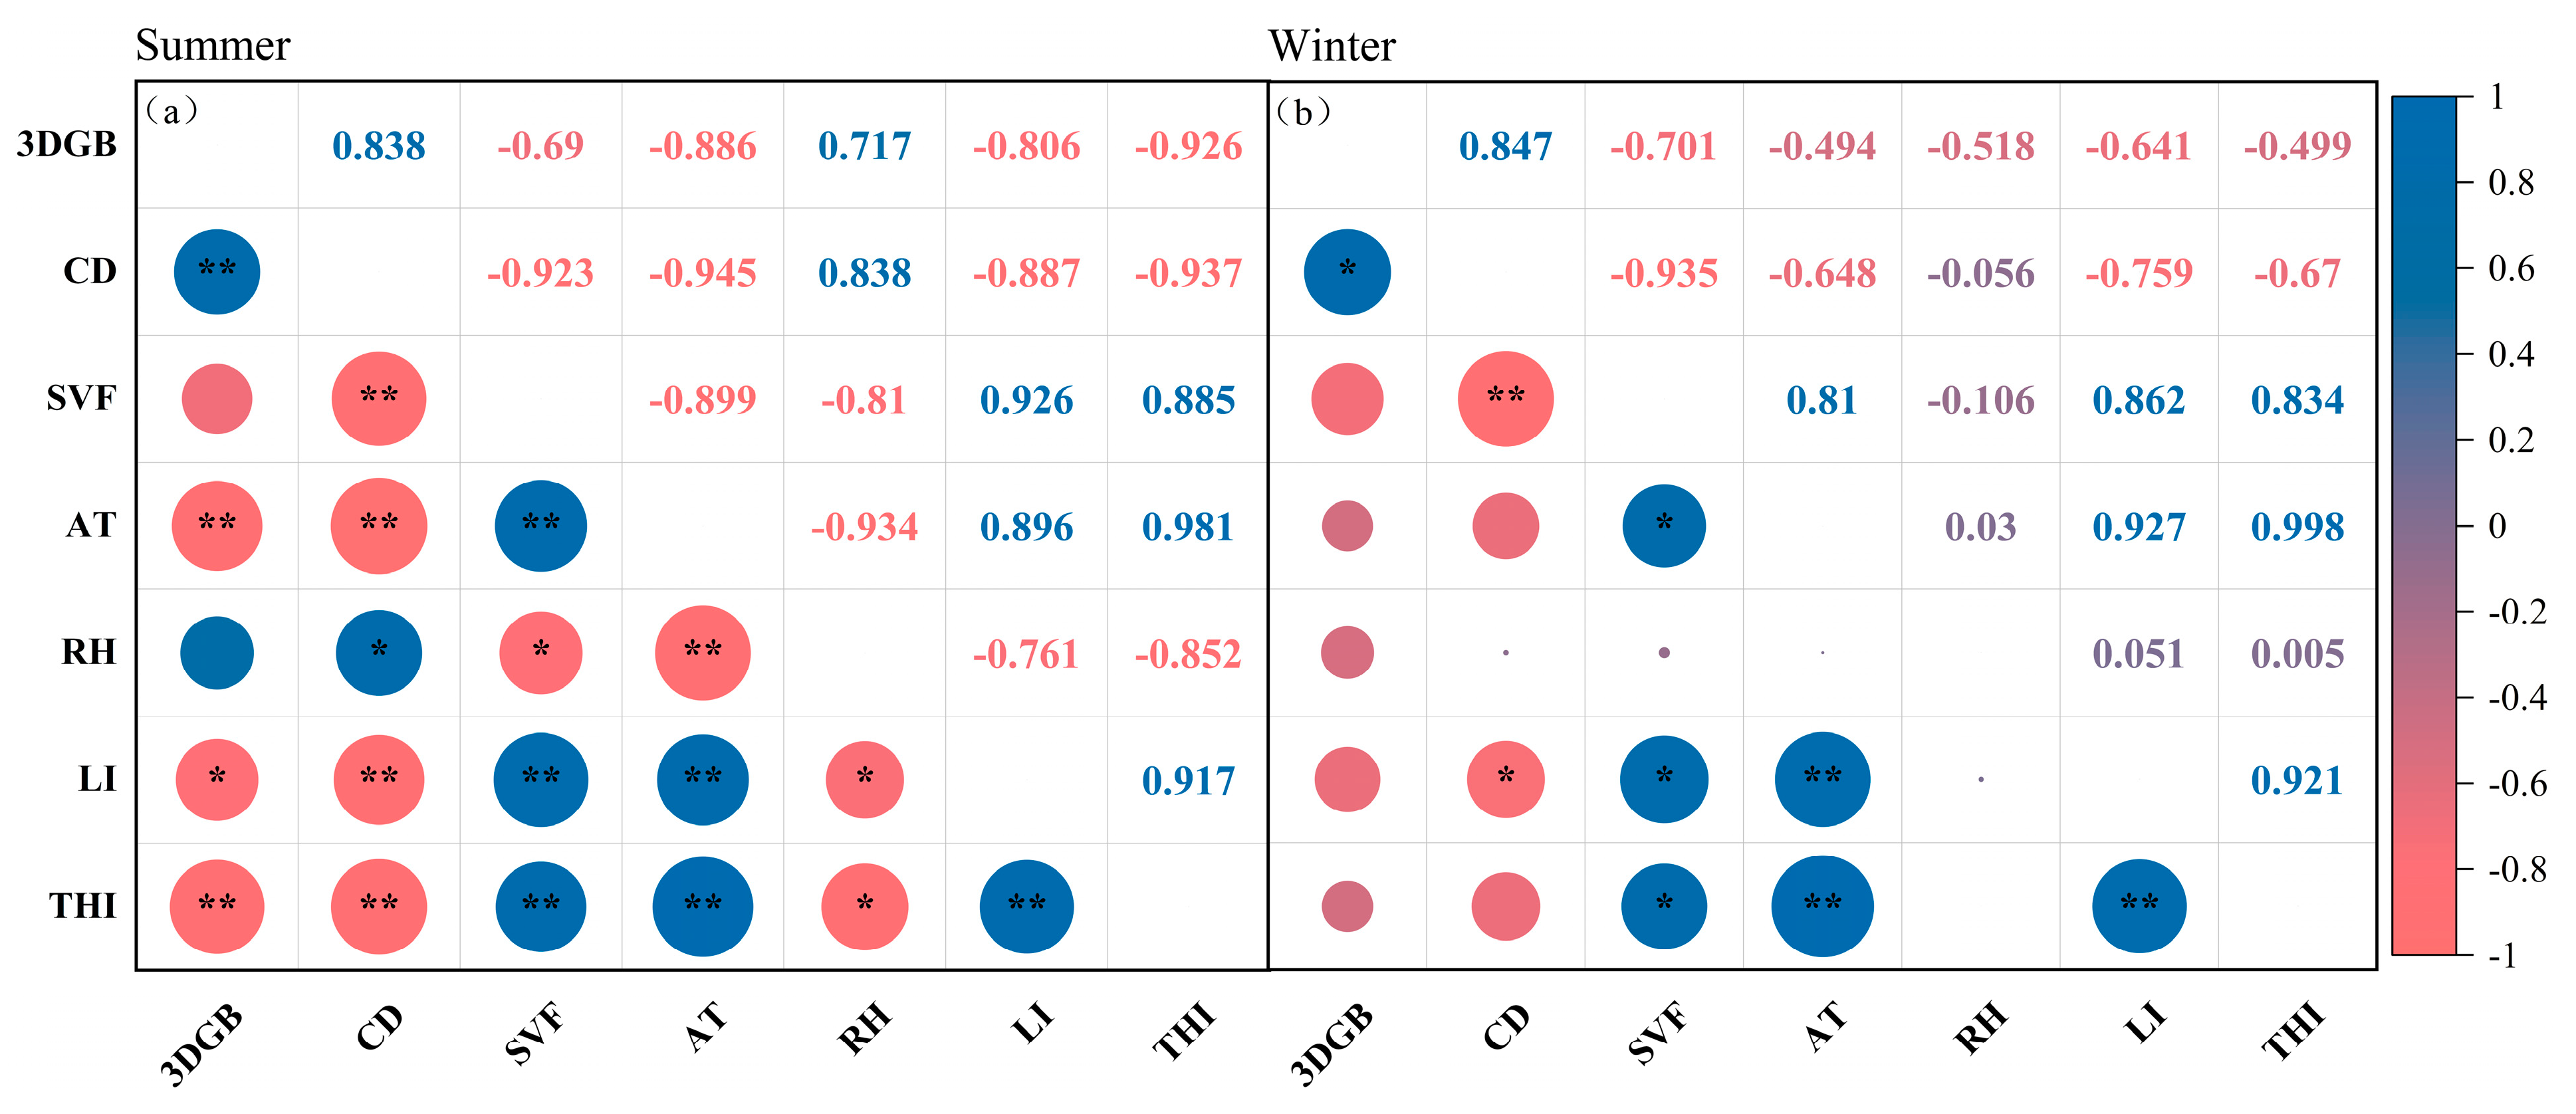
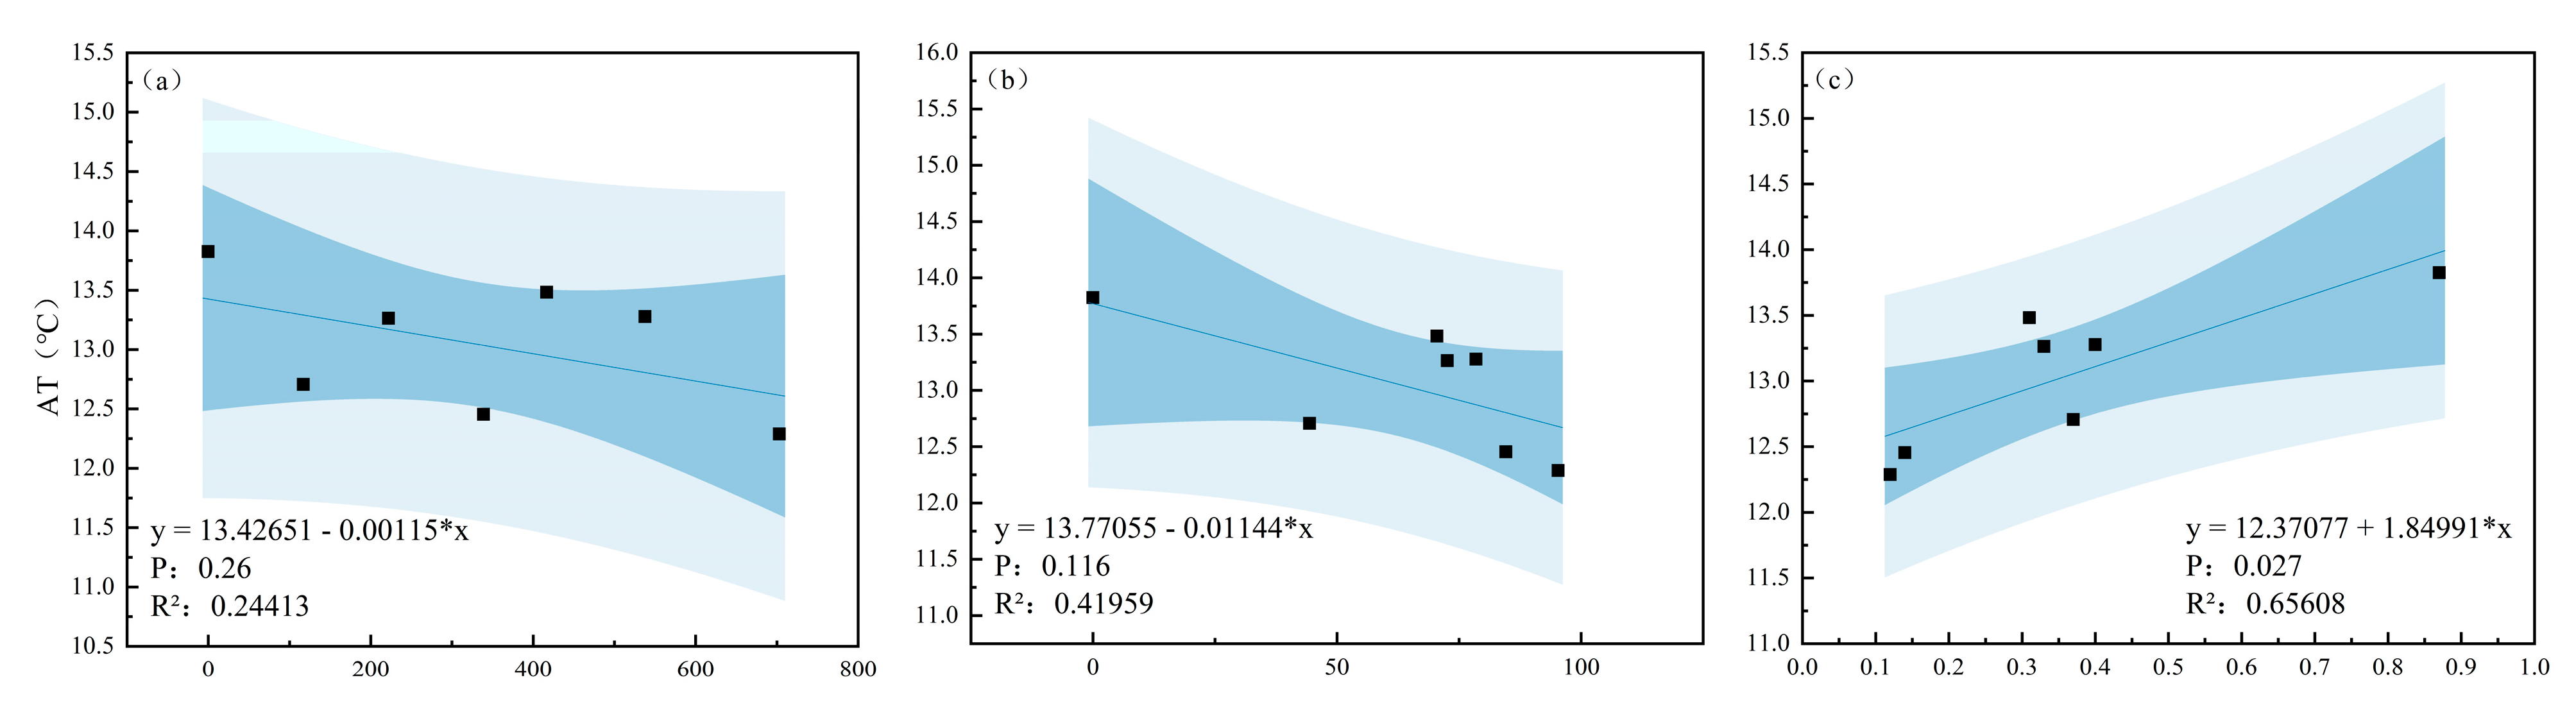
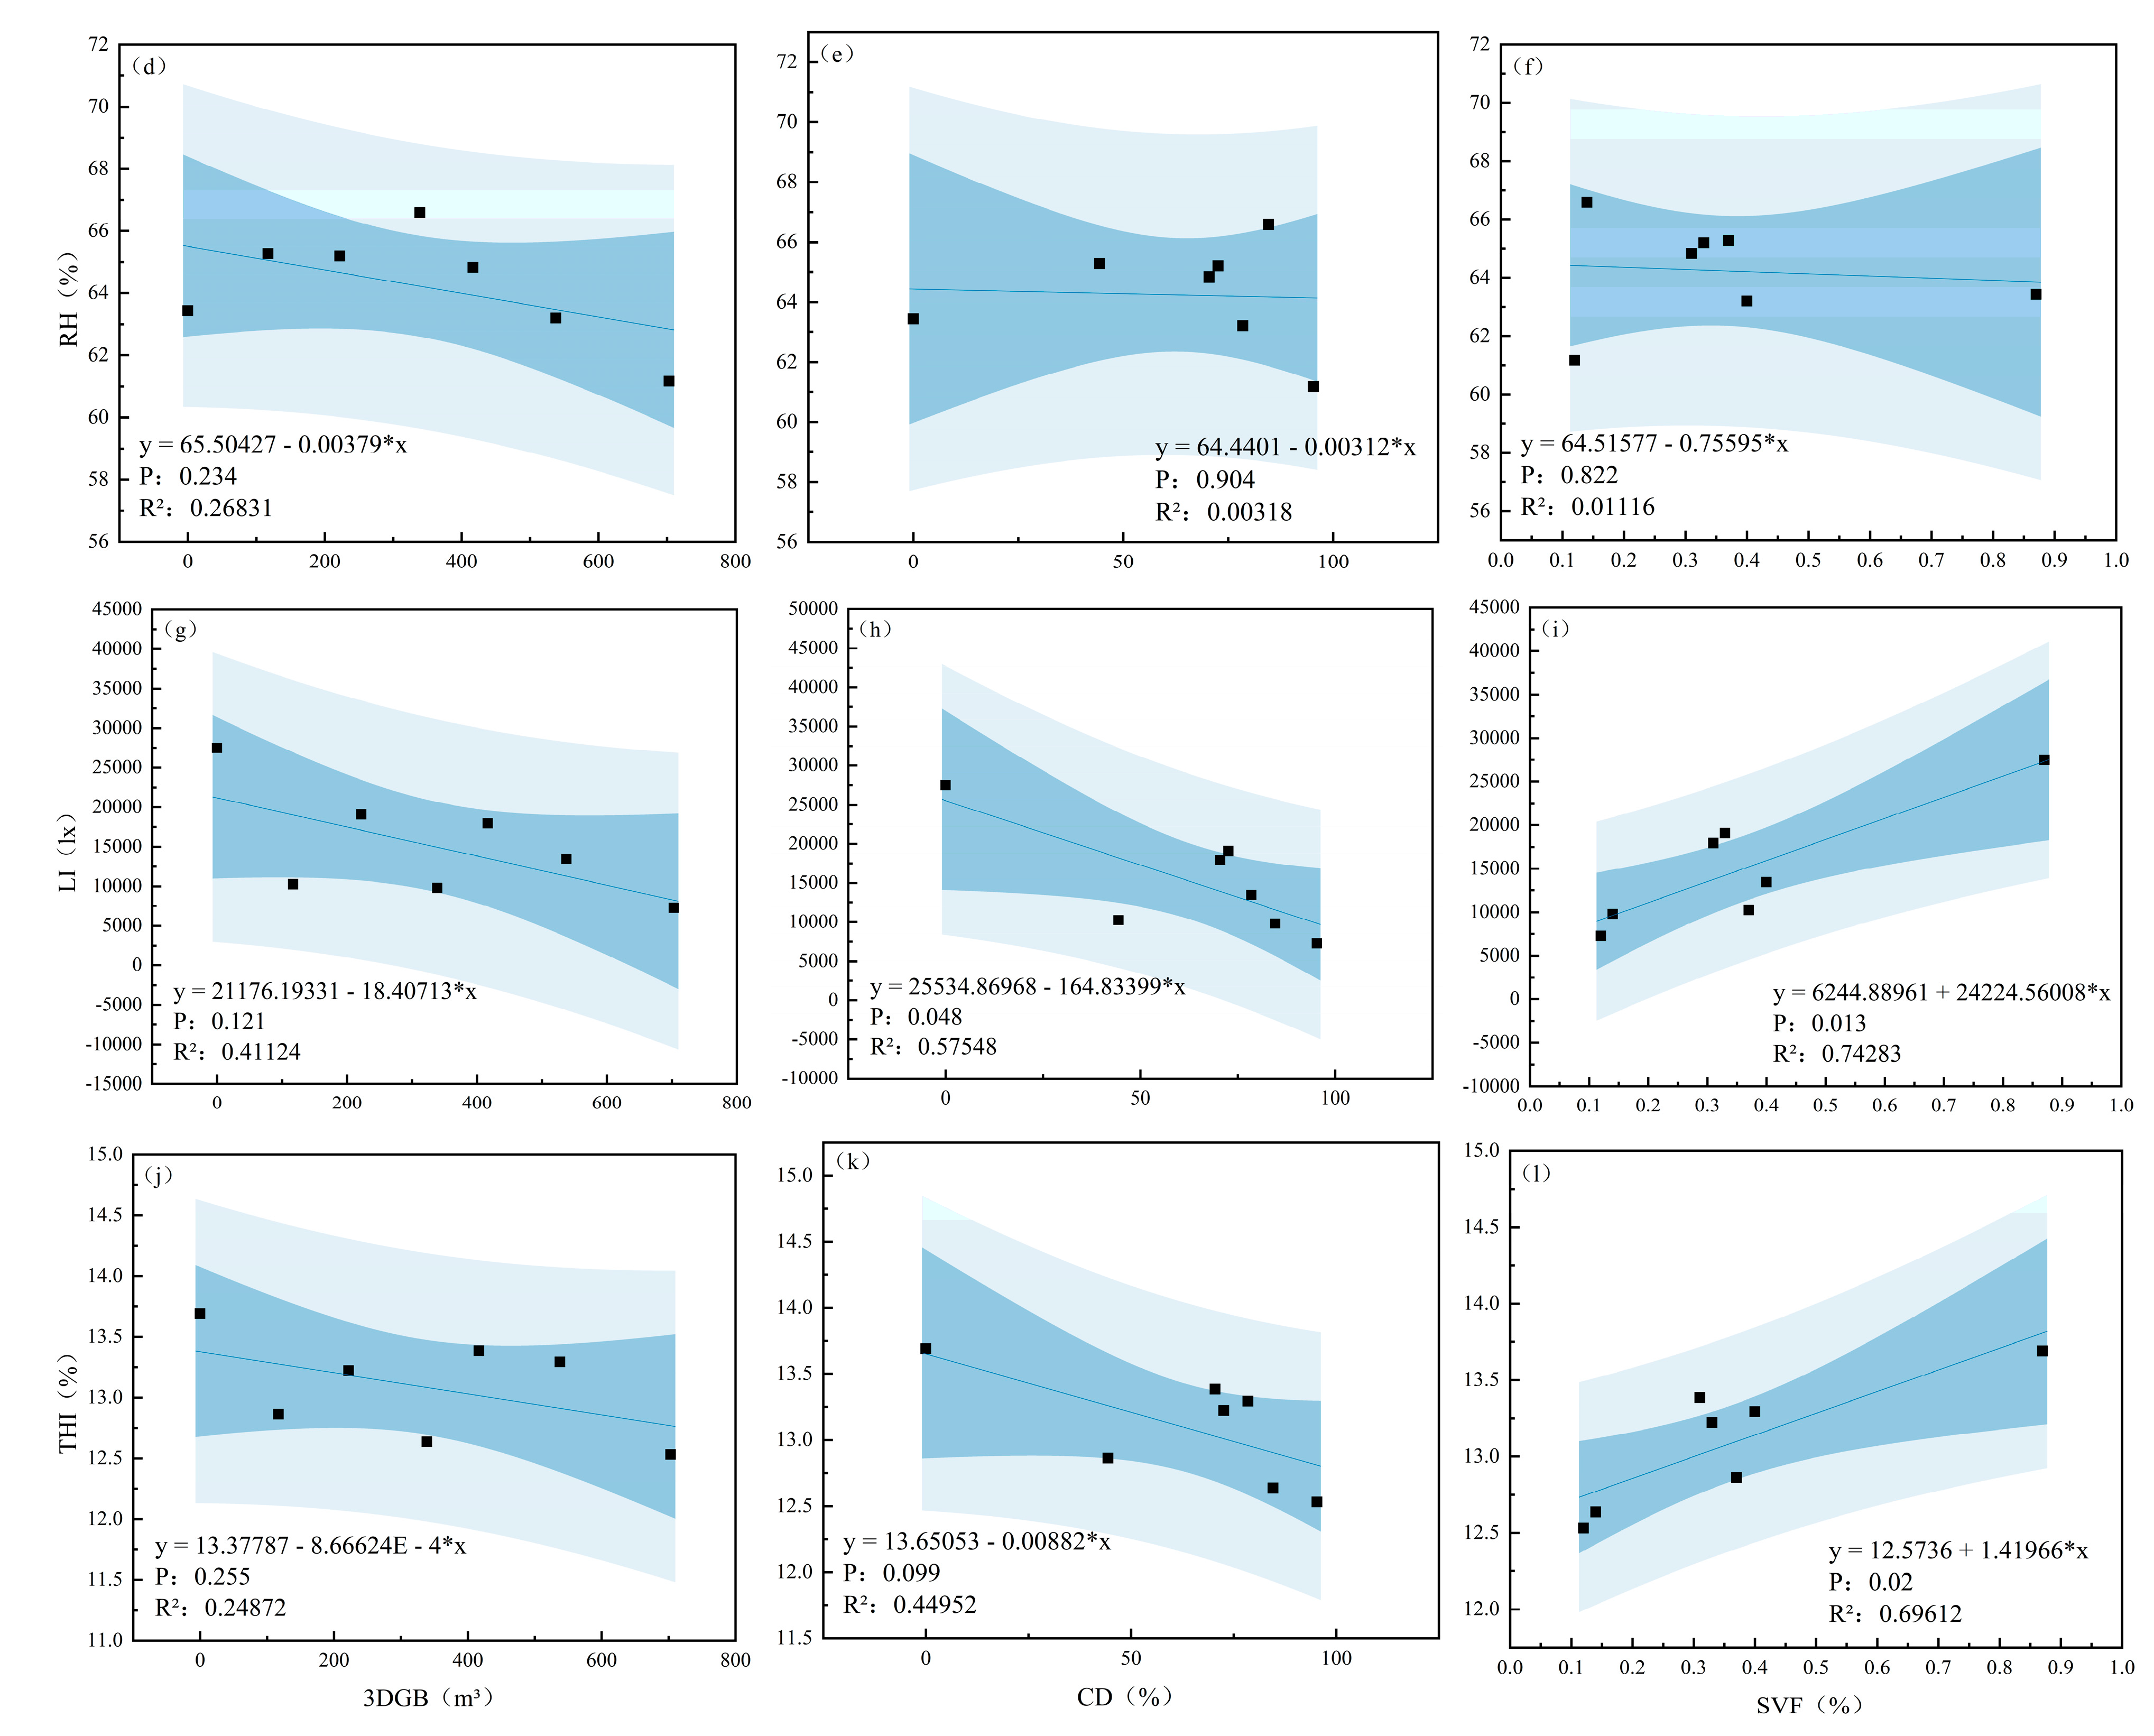
3.3. Relationships Between Microclimate Factors, THI, and Canopy Structural Indices

In summer, the daily average AT showed a negative correlation with 3DGB, a significant negative correlation with CD, and a significant positive correlation with SVF. There existed a positive relationship between the daily mean RH and CD and a negative trend of correspondence with SVF. In addition, the plant formation diurnal average LI was negatively related to CD and 3DGB. In contrast to summer, the day-average AT in winter did not display obvious associations with CD, 3DGB, and SVF, and the day-average RH in winter did not display obvious negative associations with CD, 3DGB, and SVF (Figure 7, Figure 8 and Figure 9).

4. Discussion

4.1. Microclimate Parameter Comparison

It has been widely demonstrated by researchers from different regions that there are notable discrepancies in AT and RH in planted and open lawn areas at daytime during the summer, mainly due to the canopy shade they provide [44]. In the present study, there were statistically important differences in AT and RH between the sample points and the CK (lawn) during the daytime in the summer. In comparison with the CK, the AT of the vegetation community at the sample site was lower, with the AT differences ranging from 2.3 °C to 4.1 °C (average 3.2 °C) and the effect values ranging from 6.3% to 11.5% (average 5.3%). As a contrast, the RH was generally higher, with the RH differences ranging from −9.3% to −5.1% (average −7.1%) and the effect values ranging from −71.5% to −59.8% (average 10.0%), indicating that the plant community had a significant cooling and humidifying effect during the daytime in summer. This result is consistent with the findings of numerous empirical studies. For example, Dong et al. noted that the average daily cooling intensity of arboreal plant communities in urban green spaces ranged from 1.6 to 2.5 °C, and the humidification intensity ranged from 2.9%–5.2% [45].
In winter, the average daily transpiration rates of the six experimental plant communities were generally lower, and RH was mostly slightly higher than that of the CK (except P3). The deltaAT for plant communities at the six sample sites ranged from −1.5 °C to −0.3 °C, with an average impact value of 6.6% compared to CK. Most of the plant communities, except for the P3 and P4 plant communities, had higher RHs than CKs, with the RH differences ranging from −3.2% to −2.2%, with a mean effect value of −365.7%. This indicates that the effect of plants on increasing the air temperature in winter is not obvious, and they even reduce the air temperature to a certain extent. This may be because the transpiration of plants weakens in winter, and the ability of plants to absorb and utilize solar energy decreases, resulting in a reduction in the heat dissipated through transpiration, and thus, they cannot effectively increase the temperature of the surrounding environment [46]. Except for the plant communities of P3 and P4, the relative humidity of other plant communities was mostly higher than that of the control, with the relative humidity difference ranging from −3.2% to −2.2%, and the average effect value being −365.7%. This shows that plants still have a certain humidifying effect in winter, but due to the low light intensity and weak transpiration [47], the humidifying effect is not as obvious as in other seasons.
There were significantly different LIs between the plant community and the CK in both summertime and wintertime. The average daily LI of the sample site plant community was lower than that of the unshaded lawn, with a difference in LI of 16,908.7 lx to 33,391.5 lx and 8408.5 lx to 20,224.7 lx, and the mean effect values of −39,095.7% and −93,647.0%, respectively, in summer and winter. These results showed that the plant community at the sample site had significant canopy-shading capacity relative to the CK. Trees affect the microclimate through shading, with larger CD and lower porosity equating to a wider canopy vertical surface area, which can provide a more effective blockage of sunlight. Indeed, about 50% of the incident horizontal light beam is visible light, and monolayer plant leaves can absorb 80% of visible light and reflect 10% of visible light through shading and backlighting effects [48].
In this study, we chose three consecutive days with sunny weather [49], which do not adequately represent the weather conditions throughout the entire season. In the whole season, not only sunny weather but also cloudy weather conditions may have different degrees of impact on the microclimate parameters of the sample points. For instance, overcast days may decrease the light intensity, subsequently impacting photosynthesis and transpiration in plants and, ultimately, altering the cooling and humidifying effects of plant communities [50]. In order to overcome the impact of weather change on microclimate, future research can select multiple time periods for measurement in each season, covering different weather conditions, and increase the number of measurement days, so as to more comprehensively capture the changes in meteorological conditions during the season.

4.2. Human Thermal Comfort Comparison

Numerous empirical studies have evidenced that vegetation pervasively has a regulatory role on human thermal comfort [51,52]. During the summer and winter, the univariate analysis of variance (ANOVA) results indicated that plant communities significantly increased thermal comfort, but the variability was less in winter compared to summer. According to the evaluation criteria of human comfort, the human feelings of the plant communities in summer were generally at the “hot” level in each time period. Meanwhile, the THI of the CK was higher, and the human feelings were close to the “stuffy” level, indicating that the plant communities in summer had an obvious improvement effect on human comfort. Suwanmanee et al. studied the outdoor thermal environment of pedestrian walkways and pedestrians’ thermal comfort perception in a university campus in Thailand and found that, through microclimate measurements to evaluate the Physiological Equivalent Temperature (PET) combined with on-site thermal sensation votes, the neutral PET was 25.2 °C, and the acceptable range was between 24.6 °C and 32.0 °C [53]. In winter, the human body’s feelings are at the “Cold” level. However, during the noon period (from 13:00 to 15:00), the THI increases, exceeding 15.0 °C at all sample sites. This makes the human body feel “Comfortable” under each plant community. This is mainly because the increased LI during this period in winter generates more heat, raising the AT, and, thus, enhances human thermal comfort to a certain extent. In this experiment, among the six plant communities, P3, P4, and P6 showed lower summer daily THI averages, being 1.8 °C to 2.0 °C units lower than that of the control point, which was more suitable for human body comfort levels. P1, P3, and P6 exhibited higher winter daily THI averages. The vertical structure of the “Tree-Shrub-Herb” and “Large tree-Small tree” communities was richer, and the canopy structure was more abundant. It was found that, when the height of the trees exceeded 10 m, the cooling effect of the tree group was improved, with an ideal canopy coverage of 30% [54]. The “Tree-Shrub-Herb” and “Large tree-Small tree” communities have richer vertical structures and obvious canopy characteristics, which have the best effectiveness in decreasing the temperature and increasing the humidity in summer [55] and have warming and humidifying properties in winter, contributing to the upgrading of the human comfort index to a certain extent [56].

4.3. Effect of Canopy Structure on Microclimate and Thermal Comfort

In this experiment, the effects of plant communities on AT, RH, and LI were different from the CK. In summer daytime, P4 and P6 had relatively evident effect values (deltaAT% were 11.5% and 10.5%, deltaRH% were −17.1% and −17.9%, and deltaLI% were 89.4% and 53.2%, respectively). Their 3DGBs were 734.36 m3 and 503.39 m3. The CDs were 100% and 79.6%. The SVFs were 0.05% and 0.18%, respectively. Therefore, GB, CD, and SVF saliently impacted deltaAT, deltaRH, and deltaLI. Resembling summer daytime, in winter, P4 and P2 had comparatively greater efficiencies (deltaAT% were 11.1% and 9.9%, deltaRH% were 3.6% and −0.5%, deltaLI% were 73.6% and 64.4%, respectively), their CD was 100% and 94.6%. The 3DGBs were 703.10 m3 and 338.82 m3, and the SVFs were 0.12% and 0.14%, respectively. In other words, the phytocommunity is characterized by higher GB, higher CD, and lower SVF, the higher the AT. De Abreu-Harbich et al. obtained similar conclusions in the study on the cultivation and tree species contribution to human body amenity, where canopy features affect ambient temperature by influencing the attenuation of the plant’s action on solar radiation, with smaller SVF and larger planting coverage indices yielding larger tree coverage areas and a stronger temperature reduction effect [57]. The plant formation canopy diminished most of the LI, and the unabsorbed portion leads to an increase in AT, which is typical of higher CDs and 3DGBs. The smaller the SVF, the weaker the radiation reaching the plant community. Therefore, the smaller the AT increase. Meanwhile, as the 3DGB of the phytocoenose increased, more moisture was produced by transpiration, whereas the increase in plant community CD results in difficulties in dissipation, increasing the RH of the plant community. This observation was attributed to the correspondingly weaker LI in winter, which produces less heat quantity. When the 3DGB is higher, plant leaves produce more available heat by absorbing LI, and the increase in CD provides a relatively stable and warm environment. The plant canopy reduces the temperature of the surroundings through shading and transpiration at midday when the LI is stronger, resulting in a slightly lower AT than CK. Furthermore, the enhanced absorption and reflection of LI by the vegetational type with a higher 3DGB and CD contributes to lower internal LI. In summary, the reflective and absorptive interactions of vegetation leaves on LI are mainly linked to foliage properties and canopy coverage rates.
The measured analysis also found that P4, a community composed of trees in summer and winter, had the maximum 3DGB index, the highest CD level, and the smallest SVF value among all the sample sites. In summer, the TCC of community P4 reaches 734.36 m3, and the CD reaches 100%. In comparison, for community P5, the TCC is 150.20 m3, and the CD is 46.9%. The temperature at sample point P4 is 1.8 °C lower, and the relative humidity is 15% higher than that at sample point P5. Sample site P4 has a plant community structure of “Tree”. Sample sites P1 and P3 have a plant community structure of “Tree-Shrub-Herb”, and sample site P6 has a plant community structure of “Large tree-Small tree”, which demonstrates a better temperature-lowering effect in summer and heating-up power in winter. In the community structure formed by trees, the TCC and CD were larger, making the cooling and humidifying effects more obvious [58,59]. The broad and dense canopy effectively reduces the AT below, which is an essential ingredient in the microclimatic adjustment impact of tree forests. The arbor height affects the spatial openness underneath the tree, which in turn, affects the ventilation environment [60]. As a consequence, a combination of broad canopies and the preponderance of tall trunks will help to create a better microclimate in the summer months if the species are selected.
The transpiration rates of evergreen and deciduous trees vary across seasons and impact the microclimate differently. Evergreens, with their thick, often needle-like or leathery leaves, low stomatal density, and thick cuticles, have slower water evaporation and lower transpiration rates than deciduous trees. This allows them to stably regulate the microclimate year-round. For instance, Ligustrum lucidum Ait has a summer transpiration rate of 1.29 kg/h and a winter rate of 0.15 kg/h [61], helping to reduce summer temperatures and increase humidity. Deciduous trees, with thin leaves and abundant stomata, have strong photosynthesis and high transpiration rates during the growing seasons of spring and summer. Examples include the Sapindus mukorossi Gaertn and Magnolia denudata [62]. The Yulania denudata has an average transpiration rate of 0.23 kg/h on sunny summer days [63], significantly lowering temperatures and adding moisture to the air. However, after shedding leaves in winter, transpiration stops, and their regulatory capacity decreases. In summary, evergreen trees provide stable year–round microclimate regulation, while deciduous trees play a significant regulatory role in spring and summer. This highlights the importance of the evergreen-to-deciduous ratio in a community. A higher proportion of evergreens ensures stable community transpiration and continuous microclimate regulation throughout the year, especially in winter. Conversely, a higher proportion of deciduous trees increases community transpiration rates in spring and summer, enhancing cooling and humidification but weakening winter regulation. In the experimental plots, sites P1 (ET:DT = 6:3) and P5 (ET:DT = 5:1) have a more stable impact on the microclimate than P2 (ET:DT = 2:7) and P3 (ET:DT = 2:5). Adjusting the evergreen-to-deciduous ratio can thus optimize the microclimate regulation to suit different environmental and seasonal needs.
A stepwise multiple regression showed that, in summer, the AT was negatively correlated with the CD (p < 0.01, R2 = 0.89), RH was negatively correlated with SVF (p < 0.05, R2 = 0.66), LI was positively correlated with SVF (p < 0.01, R2 = 0.86), and THI was negatively correlated with CD (p < 0.01, R2 = 0.91). In winter, AT was positively correlated with SVF (p < 0.05, R2 = 0.66), LI was negatively correlated with SVF (p < 0.05, R2 = 0.74), and THI was positively correlated with SVF (p < 0.05, R2 = 0.70). RH showed no significant correlation with the canopy structure indicators. Overall, higher R2 values in summer indicate that canopy structure indicators more strongly explain the microclimate factors and THI, with most associations significant at p < 0.05 (Table 6).

5. Conclusions

This study systematically quantified the comprehensive effects of canopy structural parameters on outdoor microclimate and thermal comfort by comparing six campus plant communities with an unshaded lawn control across both summer and winter. Theoretically, the study elucidates the pivotal role of three-dimensional gap fraction, canopy density, and sky-view factor in regulating local temperature, humidity, and light environment, and their combined impact on human thermal perception. In particular, it demonstrates that sky-view factor and canopy density are the dominant determinants of microclimate moderation, while air temperature is the primary factor influencing thermal comfort. These findings contribute to a refined understanding of the mechanisms underlying microclimate regulation in campus green spaces, enhance the theoretical insights into the link between urban green space structure and human perception, and offer empirical support for parameterizing urban microclimate models and predicting thermal comfort.
From a practical perspective, the study highlights the effectiveness of multi-layered and densely structured plant communities, such as the “Tree-Shrub-Herb” configuration and the “Large Tree + Small Tree” combination, in regulating microclimates and enhancing thermal comfort in outdoor environments. Urban greening efforts should prioritize these composite configurations to improve climate buffering and residents’ comfort. This research provides insights into the impact of community structure on microclimates and thermal comfort, offering theoretical foundations and practical recommendations for urban green space design. Future studies should focus on long-term monitoring in various climates and community types, considering factors like socioeconomic costs to deepen the understanding of the sustainable benefits and human-centered sensitivity of complex plant communities.

Author Contributions

Experimental conceptualization: W.L., P.P. and C.G.; data curation: W.L. and P.P.; data analysis: W.L. and C.G.; investigation: W.L. and P.P.; methodology: W.L. and C.G.; project administration: C.G.; software: W.L.; supervision: C.G. and D.F.; validation: C.G. and D.F.; visualization: W.L.; writing—original draft: W.L.; writing—review and editing: C.G. and D.F. All authors have read and agreed to the published version of the manuscript.

Funding

This research was supported by the National College Students’ Innovation and Entrepreneurship Training Program Project: 202313283010.

Data Availability Statement

Data are contained within the article.

Acknowledgments

The authors acknowledge the assistance of Yifan Zhang, Yan Lu, Yiyi Mao, Yuzhou Kang, Yuxuan Li, and Zhouyi Li during the on-campus field measurement processes.

Conflicts of Interest

The authors declare no conflicts of interest.

Abbreviations

The following abbreviations are used in this manuscript:
3DGBThree-dimensional Green Biomass
CDCanopy Density
SVFSky-View Factor
ATAir Temperature
RHRelative Humidity
LILight Intensity
THITemperature–Humidity Index
WSWind Speed
LAILeaf Area Index
ETEvergreen Tree
DTDeciduous Tree

References

  1. Shevchenko, O.; Snizhko, S.; Matzarakis, A. Recent trends on human thermal bioclimate conditions in Kyiv, Ukraine. Geogr. Pol. 2020, 93, 89–106. [Google Scholar] [CrossRef]
  2. Field, C.; Barros, V.; Mach, K.; Mastrandrea, M.; Yohe, G. Climate Change 2014: Impacts Adaptation & Vulnerability; Technical Summary of the IPCC Working Group II AR5 Report; Cambridge University Press: Cambridge, UK; New York, NY, USA, 2014. [Google Scholar]
  3. Akbari, H.; Pomerantz, M.; Taha, H. Cool surfaces and shade trees to reduce energy use and improve air quality in urban areas. Sol. Energy 2001, 70, 295–310. [Google Scholar] [CrossRef]
  4. Grimmond, S.U.E. Urbanization and global environmental change: Local effects of urban warming. Geogr. J. 2007, 173, 83–88. [Google Scholar] [CrossRef]
  5. Park, M.; Hagishima, A.; Tanimoto, J.; Narita, K.I. Effect of urban vegetation on outdoor thermal environment: Field measurement at a scale model site. Build. Environ. 2012, 56, 38–46. [Google Scholar] [CrossRef]
  6. Renterghem, T.V.; Botteldooren, D.; Verheyen, K. Road traffic noise shielding by vegetation belts of limited depth. J. Sound Vib. 2012, 331, 2404–2425. [Google Scholar] [CrossRef]
  7. Jim, C.Y.; Chen, W.Y. Assessing the ecosystem service of air pollutant removal by urban trees in Guangzhou (China)—Science Direct. J. Environ. Manag. 2008, 88, 665–676. [Google Scholar] [CrossRef] [PubMed]
  8. Armson, D.; Stringer, P.; Ennos, A.R. The effect of tree shade and grass on surface and globe temperatures in an urban area. Urban For. Urban Green. 2012, 11, 245–255. [Google Scholar] [CrossRef]
  9. Wu, Y.; Patuano, A.; Mashhoodi, B.; Lenzholzer, S.; Acred, A.; Zertuche, L.N. How small green spaces cool urban neighbourhoods: Optimising distribution, size and shape. Landsc. Urban Plan. 2025, 253, 105224. [Google Scholar] [CrossRef]
  10. Ariani, R.; Fitri, R.; Wisdianti, D. Designing Pocket Park at Dense Building Area with Micro Climate Approach. Sustain. Civ. Build. Manag. Eng. J. 2022, 1, 1–9. [Google Scholar] [CrossRef]
  11. Ma, D. Cooling Effect of Pocket Parks in Urban Areas. Environ. Sci. Pollut. Res. 2023, 30, 23135–23154. [Google Scholar] [CrossRef]
  12. Rui, L.; Buccolieri, R.; Gao, Z.; Gatto, E.; Ding, W. Study of the effect of green quantity and structure on thermal comfort and air quality in an urban-like residential district by ENVI-met modelling. Build. Simul. 2019, 12, 183–194. [Google Scholar] [CrossRef]
  13. Lu, F.; Gao, Y.; Jiang, L.; Chen, Y.; Hao, Z. The effect of greening layout on microclimate in urban residential areas in hot summer—Cold winter zones. Atmosphere 2023, 14, 1824. [Google Scholar] [CrossRef]
  14. Rasul, N.; Motesaddi, S.Z.; Mohammad, B.; Abdollah, A. Design a protocol to investigate the effects of climate change in vivo. Environ. Res. 2022, 212, 113482. [Google Scholar]
  15. Antoniadis, D.; Katsoulas, N.; Papanastasiou, D.; Christidou, V.; Kittas, C. Evaluation of thermal perception in schoolyards under Mediterranean climate conditions. Int. J. Biometeorol. 2016, 60, 319–334. [Google Scholar] [CrossRef]
  16. Öğüztürk, G.E.; Sünbül, S.; Alparslan, C. The effect of green areas on urban microclimate: A university campus model case. Appl. Sci. 2025, 15, 4358. [Google Scholar] [CrossRef]
  17. Antoniadis, D.; Katsoulas, N.; Papanastasiou, D.K. Thermal Environment of Urban Schoolyards: Current and Future Design with Respect to Children’s Thermal Comfort. Atmosphere 2020, 11, 1144. [Google Scholar] [CrossRef]
  18. Zhang, S.; Li, S.; Shu, L.; Xiao, T.; Shui, T. Landscape Configuration Effects on Outdoor Thermal Comfort across Campus—A Case Study. Atmosphere 2023, 14, 270. [Google Scholar] [CrossRef]
  19. Ghaffarianhoseini, A.; Berardi, U.; Ghaffarianhoseini, A.; Al-Obaidi, K. Analyzing the thermal comfort conditions of outdoor spaces in a university campus in Kuala Lumpur, Malaysia. Sci. Total Environ. 2019, 666, 1327–1345. [Google Scholar] [CrossRef]
  20. Nastos, P.T.; Polychroni, I.D. Modeling and in situ measurements of biometeorological conditions in microenvironments within the Athens University Campus, Greece. Int. J. Biometeorol. 2016, 8, 1137. [Google Scholar] [CrossRef]
  21. Singh, M.; Acharya, N.; Jamshidi, S.; Jiao, J.; Yang, Z.L.; Coudert, M.; Baumer, Z.; Niyogi, D. Urban precipitation downscaling using deep learning: A smart city application over Austin, Texas, USA. arXiv 2022, arXiv:2209.06848. [Google Scholar]
  22. Song, Y.; Newman, G.D.; Huang, A.; Ye, X. Factors influencing long-term city park visitations for mid-sized US cities: A big data study using smartphone user mobility. Sustain. Cities Soc. 2022, 80, 103815. [Google Scholar] [CrossRef]
  23. Yang, Y.; Gatto, E.; Gao, Z.; Buccolieri, R.; Morakinyo, T.E.; Lan, H. The ‘plant evaluation model’ for the assessment of the impact of vegetation on outdoor microclimate in the urban environment. Build. Environ. 2019, 159, 106151.1–106151.13. [Google Scholar] [CrossRef]
  24. Streiling, S.; Matzarakis, A. Influence of single and small clusters of trees on the bioclimate of a city: A case study. J. Arboric. 2003, 29, 309–316. [Google Scholar] [CrossRef]
  25. Lin, B.S.; Lin, Y.J. Cooling Effect of Shade Trees with Different Characteristics in a Subtropical Urban Park. HortScience 2010, 45, 83–86. [Google Scholar] [CrossRef]
  26. Yang, A.S.; Juan, Y.H.; Wen, C.Y.; Chang, C.J. Numerical simulation of cooling effect of vegetation enhancement in a subtropical urban park. Appl. Energy 2017, 192, 178–200. [Google Scholar] [CrossRef]
  27. Li, R.; Zeng, F.; Zhao, Y.; Wu, Y.; Niu, J.; Wang, L.L.; Gao, N.; Shi, X. CFD simulations of the tree effect on the outdoor microclimate by coupling the canopy energy balance model. Build. Environ. 2023, 230, 109995. [Google Scholar] [CrossRef]
  28. Kurn, D.M.; Bretz, S.E.; Huang, B.; Akbari, H. The Potential for Reducing Urban Air Temperatures and Energy Consumption Through Vegetative Cooling; Lawrence Berkeley National Laboratory (LBNL): Berkeley, CA, USA, 1994. [Google Scholar]
  29. Frenne, P.D.; Lenoir, J.; Luoto, M.; Scheffers, B.R.; Hylander, K. Forest microclimates and climate change: Importance, drivers and future research agenda. Glob. Change Biol. 2021, 27, 1109–1124. [Google Scholar] [CrossRef]
  30. Florian, Z.; Pieter, D.F.; Jonathan, L.; Pieter, V.; Kris, V.; Markus, B.R.; Lander, B.; Radim, H.; Imre, B.; Jrg, B. Forest microclimate dynamics drive plant responses to warming. Science 2020, 368, 772–775. [Google Scholar]
  31. Pieter, F.D.; Francisco, R.; Anthony, D.C.; Lander, B.; Gorik, V.; Mark, V.; Markus, B.; Brown, C.D.; Brunet, J.; Johnny, C. Microclimate moderates plant responses to macroclimate warming. Proc. Natl. Acad. Sci. USA 2013, 110, 18561–18565. [Google Scholar]
  32. Geiger, R. The Climate Near the Ground; Harvard University Press: Cambridge, MA, USA, 1957. [Google Scholar]
  33. Colter, K.R.; Middel, A.C.; Martin, C.A. Effects of natural and artificial shade on human thermal comfort in residential neighborhood parks of Phoenix, Arizona, USA. Urban For. Urban Green. 2019, 44, 126446. [Google Scholar] [CrossRef]
  34. Wang, R.; Chen, Q.; Wang, D.X. Effects of Altitude, Plant Communities, and Canopies on the Thermal Comfort, Negative Air Ions, and Airborne Particles of Mountain Forests in Summer. Sustainability 2022, 14, 3882. [Google Scholar] [CrossRef]
  35. Wu, H.; Yang, C.; Chen, J.; Yang, S.; Lu, T.; Lin, X. Effects of Green space landscape patterns on particulate matter in Zhejiang Province, China. Atmos. Pollut. Res. 2018, 9, 923–933. [Google Scholar] [CrossRef]
  36. Zaki, S.A.; Syahidah, S.W.; Shahidan, M.F.; Ahmad, M.I.; Yakub, F.; Hassan, M.Z.; Daud, M.Y.M. Assessment of Outdoor Air Temperature with Different Shaded Area within an Urban University Campus in Hot-Humid Climate. Sustainability 2020, 12, 5741. [Google Scholar] [CrossRef]
  37. Terschanski, J.; Nunes, H.M.; Aalto, I.; Pellikka, P.; Wekesa, C.; Maeda, E.E. The role of vegetation structural diversity in regulating the microclimate of human-modified tropical ecosystems. J. Environ. Manag. 2024, 360, 121128. [Google Scholar] [CrossRef] [PubMed]
  38. Teshnehdel, S.; Akbari, H.; Giuseppe, E.D.; Brown, R.D. Effect of tree cover and tree species on microclimate and pedestrian comfort in a residential district in Iran. Build. Environ. 2020, 178, 106899. [Google Scholar] [CrossRef]
  39. Fung, C.K.W.; Jim, C.Y. Microclimatic resilience of subtropical woodlands and urban-forest benefits—Science Direct. Urban For. Urban Green. 2019, 42, 100–112. [Google Scholar] [CrossRef]
  40. Speak, A.; Montagnani, L.; Wellstein, C.; Zerbe, S. The influence of tree traits on urban ground surface shade cooling. Landsc. Urban Plan. 2020, 197, 103748. [Google Scholar] [CrossRef]
  41. Potchter, O.; Cohen, P.; Lin, T.P.; Matzarakis, A. Outdoor human thermal perception in various climates: A comprehensive review of approaches, methods and quantification. Sci. Total Environ. 2018, 631–632, 390–406. [Google Scholar] [CrossRef] [PubMed]
  42. Webb, C.G. An Analysis of Some Observations of Thermal Comfort in an Equatorial Climate. Br. J. Ind. Med. 1959, 16, 297–310. [Google Scholar] [CrossRef]
  43. Thom, E.C. The Discomfort Index. Weatherwise 1959, 12, 57–60. [Google Scholar] [CrossRef]
  44. Sahar, S.; Huiwen, Z.; Xiaoli, C.; Felix, M.; Li, H. The influence of spatial configuration of green areas on microclimate and thermal comfort. Urban For. Urban Green. 2018, 34, 85–96. [Google Scholar]
  45. Dong, H.L. Study on the microclimatic characteristics and human comfort of park plant communities in summer. Procedia Environ. Sci. 2012, 13, 755–765. [Google Scholar]
  46. Wu, Z.; Zohner, C.M.; Zhou, Y.; Crowther, T.W.; Wang, H.; Wang, Y.; Peuelas, J.; Gong, Y.; Zhang, J.; Zou, Y. Tree species composition governs urban phenological responses to warming. Nat. Commun. 2025, 16, 1–10. [Google Scholar] [CrossRef] [PubMed]
  47. Gkatsopoulos, P. A methodology for calculating cooling from vegetation evapotranspiration for use in urban space microclimate simulations. Procedia Environ. Sci. 2017, 38, 477–484. [Google Scholar] [CrossRef]
  48. Kotzen, B. An investigation of shade under six different tree species of the Negev desert towards their potential use for enhancing micro-climatic conditions in landscape architectural development. J. Arid Environ. 2003, 55, 231–274. [Google Scholar] [CrossRef]
  49. Wei, R.; Xu, C.; Song, D.; Tong, H.; Chen, Z. Study on the Correlation Analysis between Urban Morphological Factors and Microclimate Based on Empirical Methods on a University Campus in a Hot-Summer–Cold-Winter Region. Buildings 2023, 13, 25. [Google Scholar] [CrossRef]
  50. Smith, W.K.; Vogelmann, T.C.; Schaberg, P.G. Clouds homogenize shoot temperatures, transpiration, and photosynthesis within crowns of Abies fraseri (Pursh.) Poiret. Oecologia 2017, 183, 673–683. [Google Scholar]
  51. Sun, S.; Xu, X.; Lao, Z.; Liu, W.; Li, Z.; Higueras Garcia, E.; He, L.; Zhu, J. Evaluating the impact of urban green space and landscape design parameters on thermal comfort in hot summer by numerical simulation. Build. Environ. 2017, 123, 277–288. [Google Scholar] [CrossRef]
  52. Zheng, S.L.; Guldmann, J.M.; Wang, Z.Y.; Qiu, Z.N.; He, C.W.; Wang, K. Experimental and theoretical study of urban tree instantaneous and hourly transpiration rates and their cooling effect in hot and humid area. Sustain. Cities Soc. 2021, 68, 102808. [Google Scholar] [CrossRef]
  53. Suwanmanee, N.; Kronprasert, N.; Sutheerakul, C.; Arunotayanun, K.; Rinchumphu, D. Investigation of outdoor thermal comfort for campus pedestrian walkways in Thailand. Sustainability 2023, 15, 12345. [Google Scholar] [CrossRef]
  54. Li, J.; Zhai, Z.; Ding, Y.; Ding, Y.; Deng, Y.; Ye, L.; Zhai, Z.; Li, H.; Chen, S. Effect of optimal allocation of urban trees on the outdoor thermal environment in hot and humid areas: A case study of a university campus in Guangzhou, China. Energy Build. 2023, 300, 113640. [Google Scholar] [CrossRef]
  55. Lin, W.; Zeng, C.C.; Nie, W.B.; Nan, X.G.; Shen, S.S.; Shi, Y.; Yan, H.; Yang, F.; Wu, R.W.; Bao, Z.Y. Study of the Vertical Structures, Thermal Comfort, Negative Air Ions, and Human Physiological Stress of Forest Walking Spaces in Summer. Forests 2022, 13, 335. [Google Scholar] [CrossRef]
  56. Fan, L.; Zhao, M.; Huo, J.; Sha, Y.; Zhou, Y. The Impact of Vegetation Layouts on Thermal Comfort in Urban Main Streets: A Case Study of Youth Street in Shenyang. Sustainability 2025, 17, 1755. [Google Scholar] [CrossRef]
  57. Abreu-Harbich, D.V.L.; Labaki, C.L.; Matzarakis, A. Effect of tree planting design and tree species on human thermal comfort in the tropics. Landsc. Urban Plan. 2015, 138, 99–109. [Google Scholar] [CrossRef]
  58. Yan, H.; Wu, F.; Dong, L. Influence of a large urban park on the local urban thermal environment. Sci. Total Environ. 2018, 622–623, 882–891. [Google Scholar] [CrossRef]
  59. Liu, Z.; Brown, R.D.; Zheng, S.; Jiang, Y.; Zhao, L. An In-Depth Analysis of the Effect of Trees on Human Energy Fluxes. Urban For. Urban Green. 2020, 50, 126646. [Google Scholar] [CrossRef]
  60. Karimi, A.; Sanaieian, H.; Farhadi, H.; Saeid, N.M. Evaluation of the thermal indices and thermal comfort improvement by different vegetation species and materials in a medium-sized urban park. Energy Rep. 2020, 6, 1670–1684. [Google Scholar] [CrossRef]
  61. Lu, T.R.; Jiang, Y.J.; Wu, Z.; Yan, M.; Qiu, J.; Wu, C. Transpiration characteristics of typical evergreen and deciduous tree species in the subtropical karst region and their responses to environmental factors. Acta Ecol. Sin. 2022, 42, 1047–1058. [Google Scholar]
  62. Shao, Y.C.; Li, J.J.; Fu, D.F.; Li, E.H.; Zhuang, J.R. Study on the Photosynthetic and Transpiration Characteristics of Eight Deciduous Broad-leaved Tree Species in Summer in Shanghai Area. J. Northwest For. Univ. 2015, 30, 30–38. [Google Scholar]
  63. Zhang, Y.P.; Zhou, G.M.; Zhou, Y.F.; Shi, Y.J.; Li, C.; Li, M.; Lv, Y.L.; He, Y. Photosynthetic Response Characteristics of Five Common Greening Tree Species to Extreme High Temperature. J. Zhejiang AF Univ. 2017, 34, 301–309. [Google Scholar]
Figure 1. The distribution of measuring points in the study area and the current situation of plant formations in the summer of 2024. No. 1–6 denote experimental sampling points, and CK stands for control points.
Forests 16 00799 g001
Figure 2. Research procedure.
Forests 16 00799 g002
Figure 3. Variational daily AT in summer (a) and winter (b) and comparisons of daily mean ATs in summer (c) and winter (d) for different plant communities and the CK. The lowercase letters above the daily mean AT represent multiple comparisons of different communities (Duncan’s method, p < 0.05; n = 3, for the number of experimental days).
Forests 16 00799 g003
Figure 4. Variational daily RH in summer (a) and winter (b) and comparisons of daily mean RH in summer (c) and winter (d) for different plant communities and the CK. The lowercase letters above the daily mean RH represent multiple comparisons of different communities (Duncan’s method, p < 0.05; n = 3, for the number of experimental days).
Forests 16 00799 g004aForests 16 00799 g004b
Figure 5. Variational daily LI in summer (a) and winter (b) and comparisons of daily mean LI in summer (c) and winter (d) for different plant communities and the CK. The lowercase letters above the daily mean LI represent multiple comparisons of different communities (Duncan’s method, p < 0.05; n = 3, for the number of experimental days).
Forests 16 00799 g005
Figure 6. Variational daily THI in summer (a) and winter (b) and comparisons of daily mean THI in summer (c) and winter (d) for different plant communities and the CK. The lowercase letters above the daily mean THI represent multiple comparisons of different communities (Duncan’s method, p < 0.05; n = 3, for the number of experimental days).
Forests 16 00799 g006aForests 16 00799 g006b
Figure 7. Correlation coefficients between microclimate factors, THI, and canopy structure indices in summer (a) and winter (b). * Significant (<0.05); ** Significant (<0.01).
Forests 16 00799 g007
Figure 8. Regression analysis between microclimate factors, THI, and the indices of plant community canopy structure in summer. (a) 3DGB, (b) CD, (c) SVF and AT; (d) 3DGB, (e) CD, (f) SVF and RH; (g) 3DGB, (h) CD, (i) SVF and LI; (j) 3DGB, (k) CD, and (l) SVF and THI.
Forests 16 00799 g008
Figure 9. Regression analysis between microclimate factors, THI, and the indices of plant community canopy structure in winter. (a) 3DGB, (b) CD, (c) SVF and AT; (d) 3DGB, (e) CD, (f) SVF and RH; (g) 3DGB, (h) CD, (i) SVF and LI; (j) 3DGB, (k) CD, and (l) SVF and THI.
Forests 16 00799 g009aForests 16 00799 g009b
Table 1. Plant community composition, canopy structure data, and photographs in summer 2024.
No.Community CompositionCommunity Structure3DGB/m3CD
/%
SVF/%Fisheye Photograph
P1Hovenia acerba × 2,
Machilus thunbergia × 1,
Ligustrum vulgare × 1,
Ligustrum japonicum ‘Howardii’, Loropetalum chinense, Pittosporum tobira,
Rhododendron simsii,
Ophiopogon japonicus
(ET:DT = 6:3)
Tree-
Shrub-
Herb
247.1981.90.14Forests 16 00799 i001
P2Malus halliana × 4,
Camphora officinarum × 2,
Yulania denudata × 2,
Platanus × acerifolia × 1
(ET:DT = 2:7)
Tree401.8993.50.05Forests 16 00799 i002
P3Albizia julibrissin × 4,
Camphora officinarum × 1,
Chaenomeles japonica, Ophiopogon japonicus
(ET:DT = 2:5)
Tree-
Shrub-
Herb
685.0289.60.10Forests 16 00799 i003
P4Camphora officinarum × 1,
Osmanthus × 2, Ligustrum × 1,
Sapindus saponaria × 1,
PopulusL × 2 (ET:DT = 4:3)
Tree734.36100.00.05Forests 16 00799 i004
P5Ormosia hosiei × 1,
Elaeocarpus sylvestris × 2,
Phoebe chekiangensis × 2,
Yulania denudata × 1
(ET:DT = 5:1)
Tree150.2046.90.15Forests 16 00799 i005
P6magnolia grandiflora × 2,
Camellia japonica × 2,
Celtis L. × 1,
Ulmus parvifolia × 1,
Ostrya rehderiana × 1,
Prunus campanulata × 1,
Nandina domestica (ET:DT = 5:4)
Large tree-
Small tree
503.3979.60.18Forests 16 00799 i006
CKlawn/000.76Forests 16 00799 i007
Table 2. Plant community composition, canopy structure data, and photographs in winter 2023.
No.Community CompositionCommunity Structure3DGB/m3CD
/%
SVF/%Fisheye Photograph
P1Hovenia acerba × 2,
Machilus thunbergii × 1,
Ligustrum vulgare × 1,
Ligustrum japonicum ‘Howardii’, Loropetalum chinense, Pittosporum tobira,
Rhododendron simsii,
Ophiopogon japonicus
(ET:DT = 6:3)
Tree-
Shrub-
Herb
221.8772.60.33Forests 16 00799 i008
P2Malus halliana × 4,
Camphora officinarum × 2,
Yulania denudata × 2,
Platanus × acerifolia × 1
(ET:DT = 2:7)
Tree338.8284.60.14Forests 16 00799 i009
P3Albizia julibrissin × 4,
Camphora officinarum × 1,
Chaenomeles japonica, Ophiopogon japonicus
(ET:DT = 2:5)
Tree-
Shrub-
Herb
537.8578.50.40Forests 16 00799 i010
P4Camphora officinarum × 1,
Osmanthus × 2, Ligustrum × 1,
Sapindus saponaria × 1,
PopulusL × 2 (ET:DT = 4:3)
Tree703.1095.30.12Forests 16 00799 i011
P5Ormosia hosiei × 1,
Elaeocarpus sylvestris × 2,
Phoebe chekiangensis × 2,
Yulania denudata × 1
(ET:DT = 5:1)
Tree117.0444.40.37Forests 16 00799 i012
P6magnolia grandiflora × 2,
Camellia japonica × 2,
Celtis L. × 1,
Ulmus parvifolia × 1,
Ostrya rehderiana × 1,
Prunus campanulata × 1,
Nandina domestica (ET:DT = 5:4)
Large tree-
Small tree
416.7670.50.31Forests 16 00799 i013
CKlawn/000.87Forests 16 00799 i014
Table 3. Classification table of human comfort index.
LevelPerceptionTHI
1Excessive cold<−10
2Very cold−10–−1.8
3Cold−1.8–13
4Cool13–15
5Comfortable15–20
6Hot20–26.5
7Very hot26.5–30
8Stuffy>30
Table 4. The microclimate factors in different communities in summer and winter.
SeasonCommunityAT/°CRH/%LI/lx
αβγαβγαβγ
SummerP132.836.57.959.476.4−14.820,437.456,656.045.3
P232.641.98.256.881.8−9.911,569.439,175.069.0
P332.035.39.957.980.1−12.014,036.054,083.062.4
P431.534.711.560.676.4−17.13954.718,762.089.4
P533.341.26.357.074.9−10.216,134.361,373.056.8
P631.838.010.561.085.8−17.917,479.655,517.053.2
CK35.648.4/51.769.6/37,346.163,127.0/
WinterP113.320.04.165.291.9−2.819,077.350,832.030.6
P212.518.69.966.690.4−5.09793.545,769.064.4
P313.319.44.063.291.70.413,445.338,943.051.1
P412.318.311.161.293.33.67261.018,395.073.6
P512.718.58.165.389.6−2.910,242.537,538.072.7
P613.520.12.564.891.0−2.217,939.158,668.034.7
CK13.820.9/63.488.8/27,485.861,359.0/
AT: air temperature (°C); RH: relative humidity (%); LI: light intensity (lx); α: diurnal average value; β: maximum value; γ: effect value (deltaAT%; deltaRH%; deltaLI%).
Table 5. THI at different times and in different communities in summer and winter.
SeasonCommunity8:009:0010:0011:0012:0013:0014:0015:0016:0017:0018:00Average
SummerP127.328.228.428.629.029.429.429.428.928.227.928.6 bc
P224.626.127.429.830.428.729.328.628.427.927.728.1 bc
P325.626.626.728.328.729.029.128.728.327.927.727.9 bc
P424.826.226.727.628.028.728.828.528.428.227.927.7 c
P525.326.628.629.629.729.929.430.928.828.427.828.7 b
P624.126.328.328.328.328.529.328.629.229.027.927.9 bc
CK26.129.029.831.029.931.330.930.829.628.928.029.7 a
WinterP14.88.310.813.415.216.417.416.614.913.910.813.2 a
P26.68.39.612.113.315.015.815.915.314.312.812.6 a
P36.08.711.014.514.317.016.016.014.312.412.413.3 a
P45.17.99.512.313.815.015.715.815.114.513.212.5 a
P56.68.310.312.813.715.316.016.015.414.213.012.9 a
P66.68.310.313.915.217.817.116.315.413.912.513.4 a
CK6.18.911.414.016.017.017.916.815.414.312.913.7 a
The lowercase letter behind the average value represents multiple comparisons of the different communities (Duncan’s method, p < 0.05).
Table 6. Stepwise multiple regression analysis of individual microclimate factors (AT, RH, and LI) and THl (dependent variables) with 3DGB, CD, and SVF as predictors.
SeasonDependent VariablePr > FR2Independent VariableParameter Estimation
SummerAT0.0010.893CD−0.035
RH0.0270.656SVF−10.155
LI0.0030.857SVF38,084.694
THI<0.0010.910CD−0.018
WinterAT0.0270.656SVF1.270
RH No variables enter the equation
LI0.0130.743SVF24,224.560
THI0.0200.696SVF1.420
Disclaimer/Publisher’s Note: The statements, opinions and data contained in all publications are solely those of the individual author(s) and contributor(s) and not of MDPI and/or the editor(s). MDPI and/or the editor(s) disclaim responsibility for any injury to people or property resulting from any ideas, methods, instructions or products referred to in the content.

