
Tree Trunk Curvature Extraction Based on Terrestrial Laser Scanning Point Clouds


Abstract
1. Introduction
2. Materials and Methods
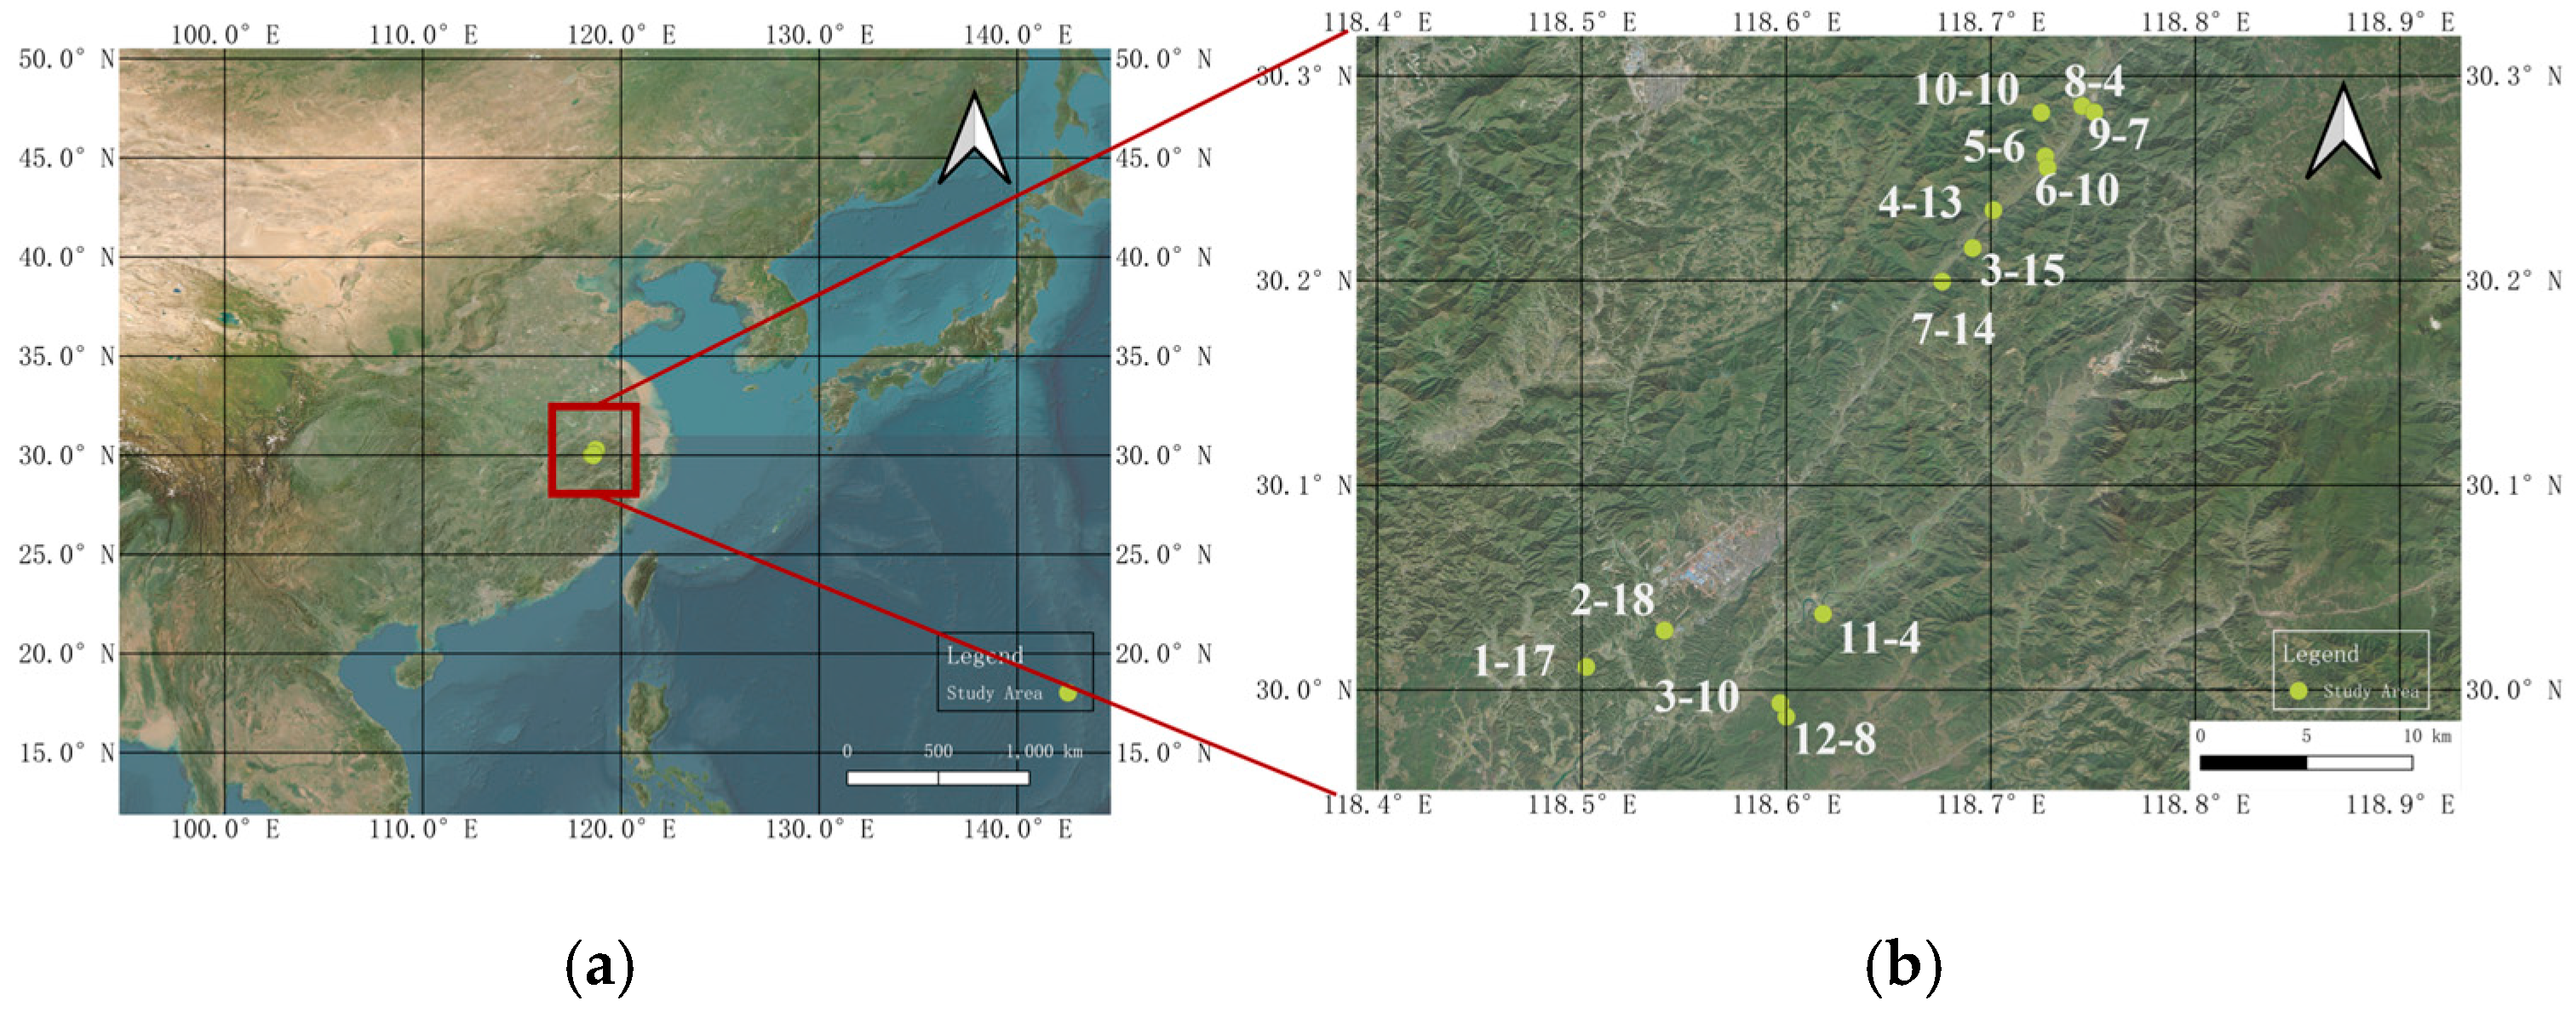
2.1. Study Area
2.2. TLS Measurements
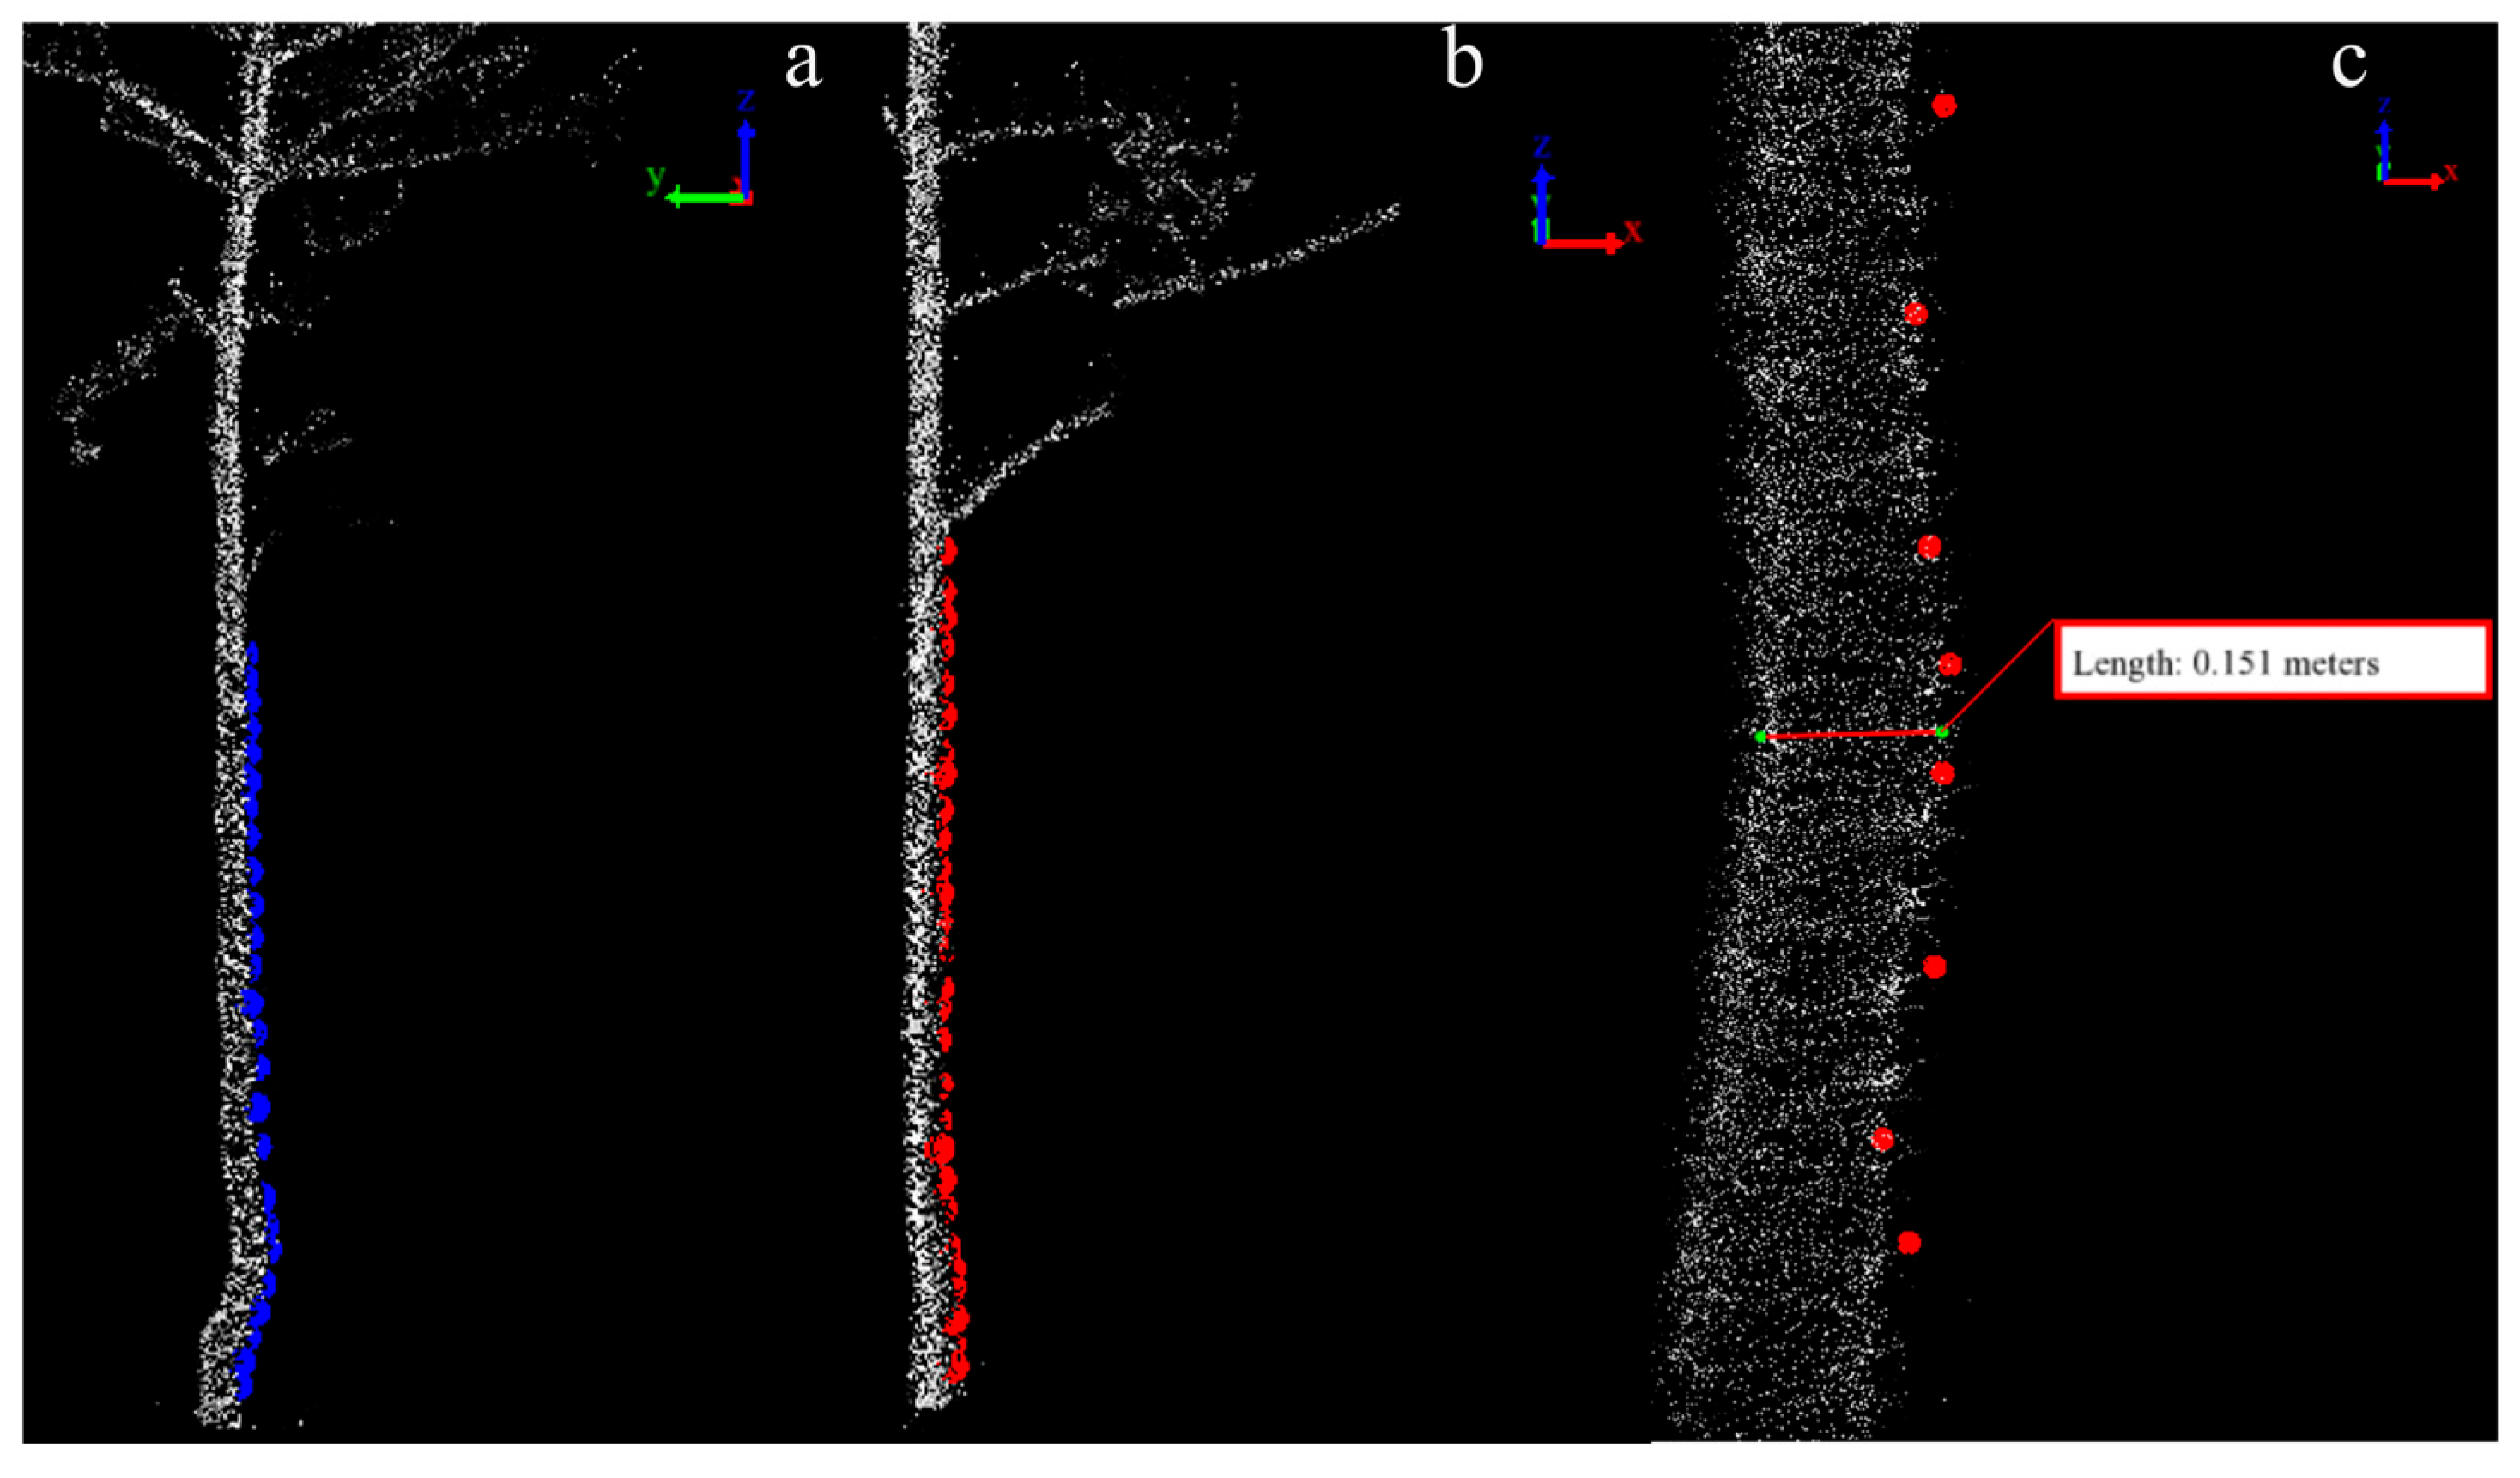
2.3. Data Preprocessing
2.4. Quantitative Structure Modeling (QSM) Algorithm Based on a Single Zoom Factor
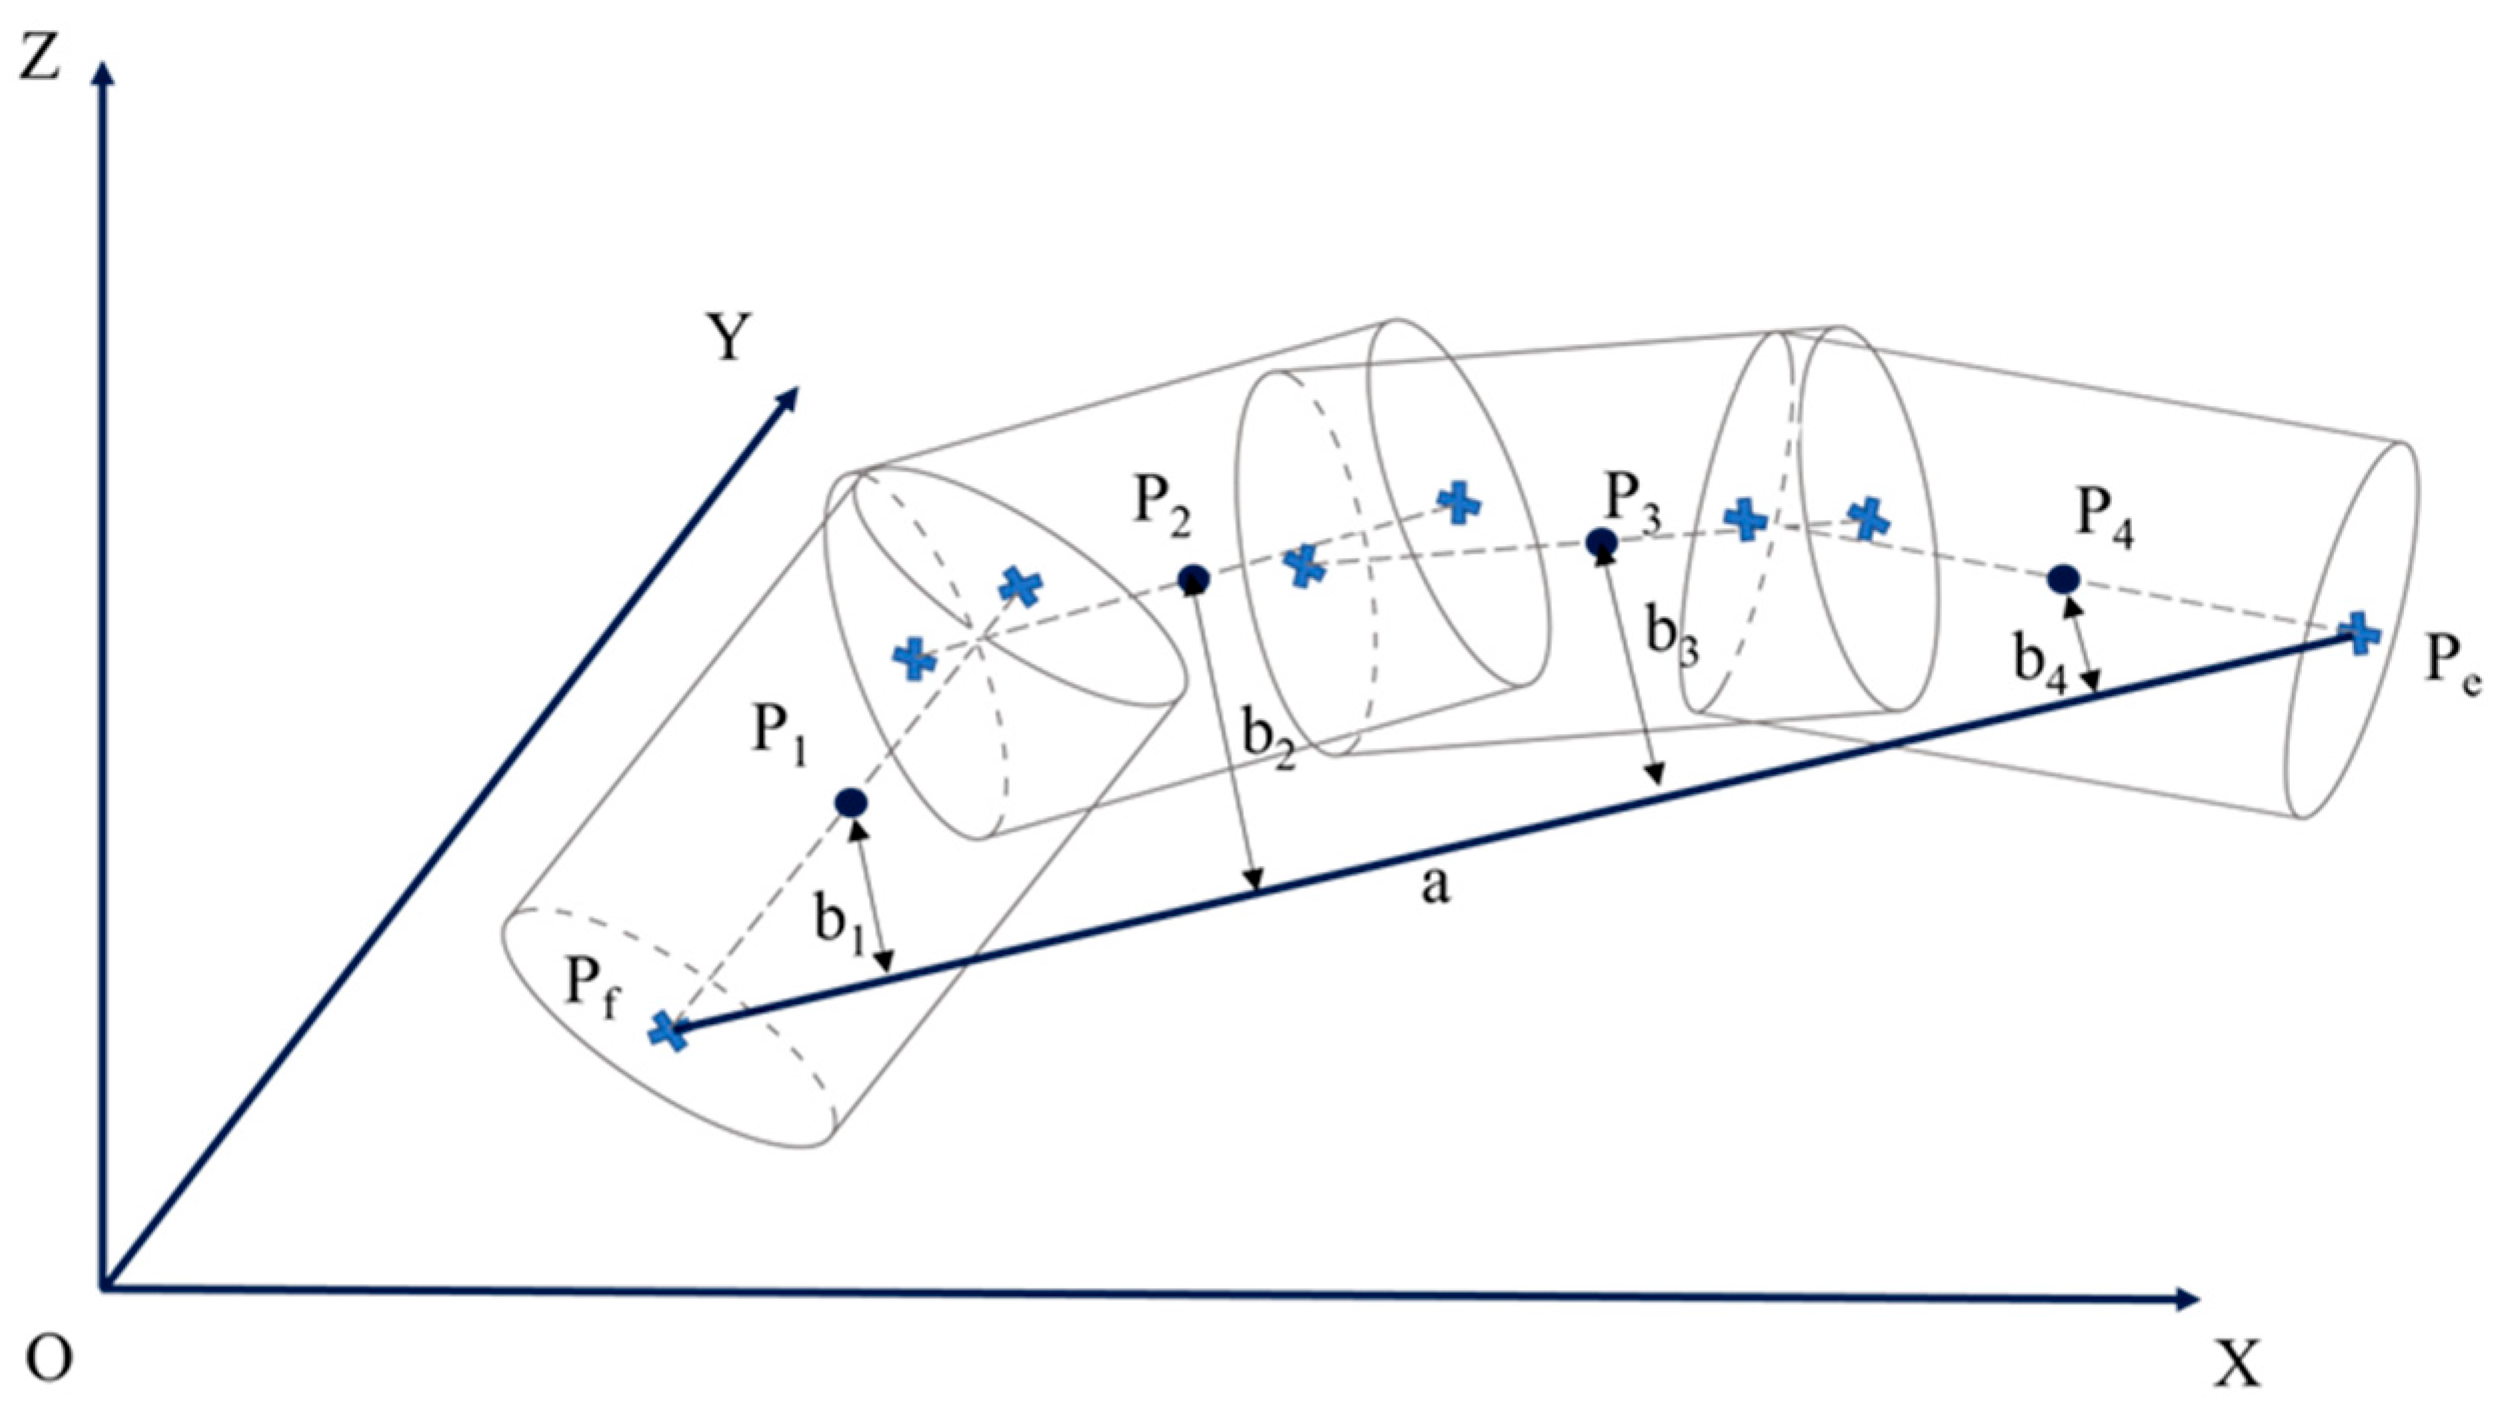
2.5. QSM Trunk Curvature Inversion Algorithm Based on Dual Zoom Factors
2.6. Trunk Bending Calculations
3. Results
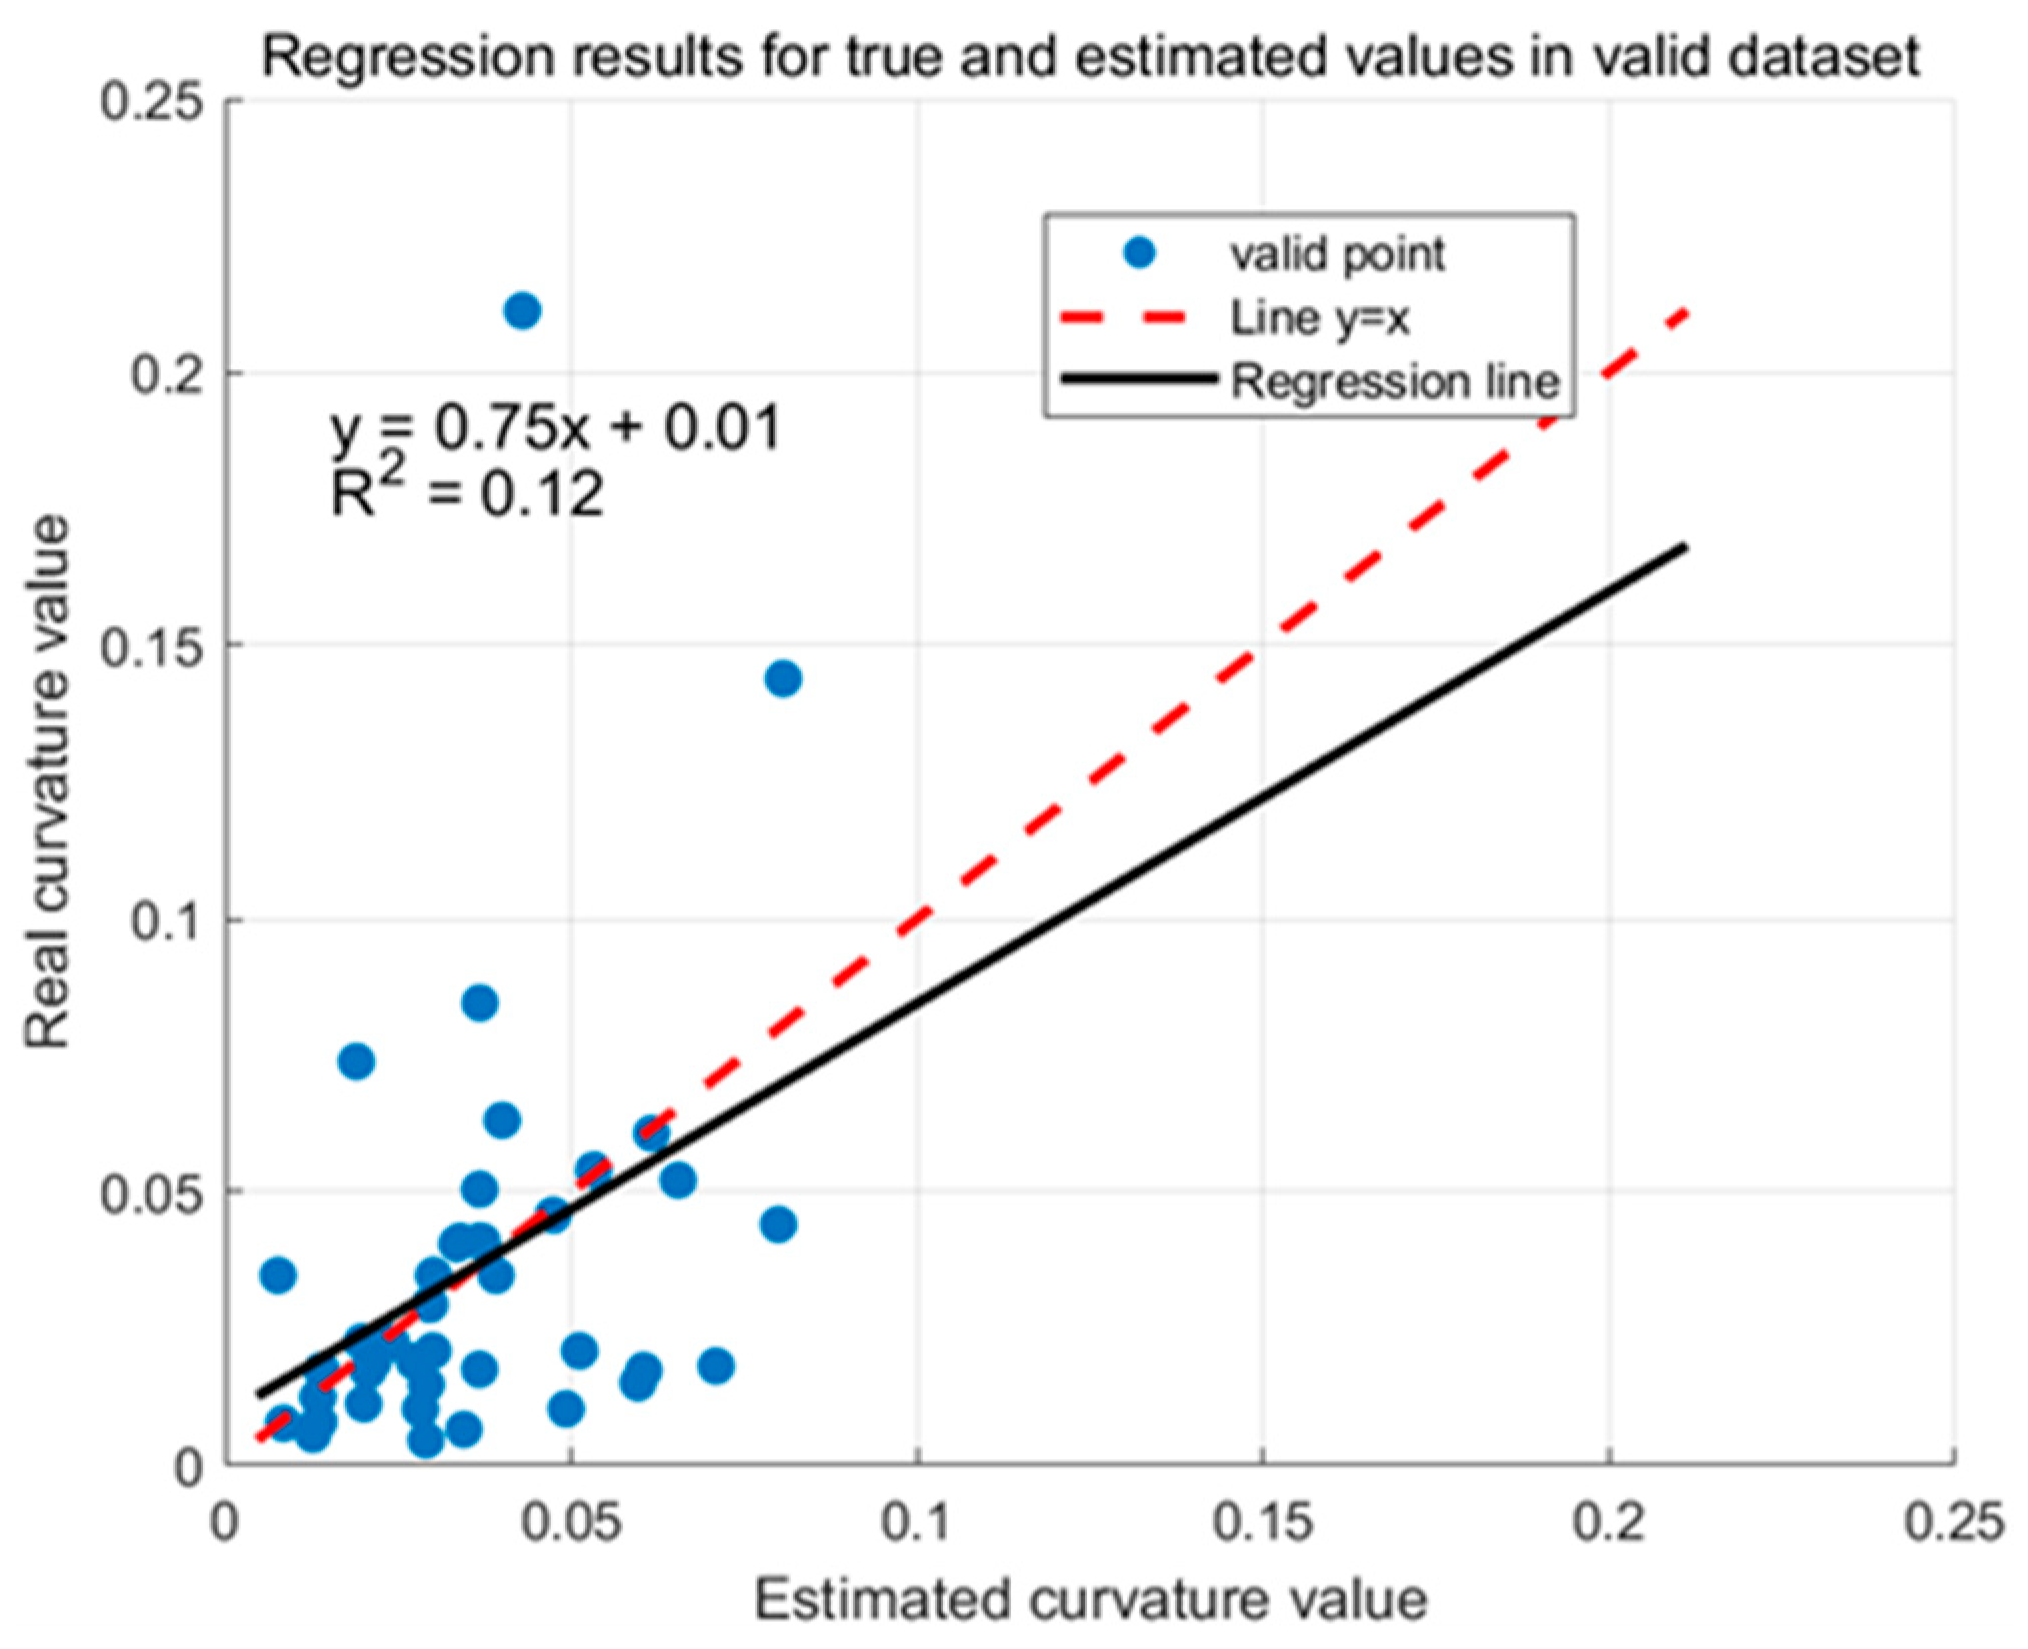
3.1. QSM-Based Inverse Algorithm for Trunk Curvature
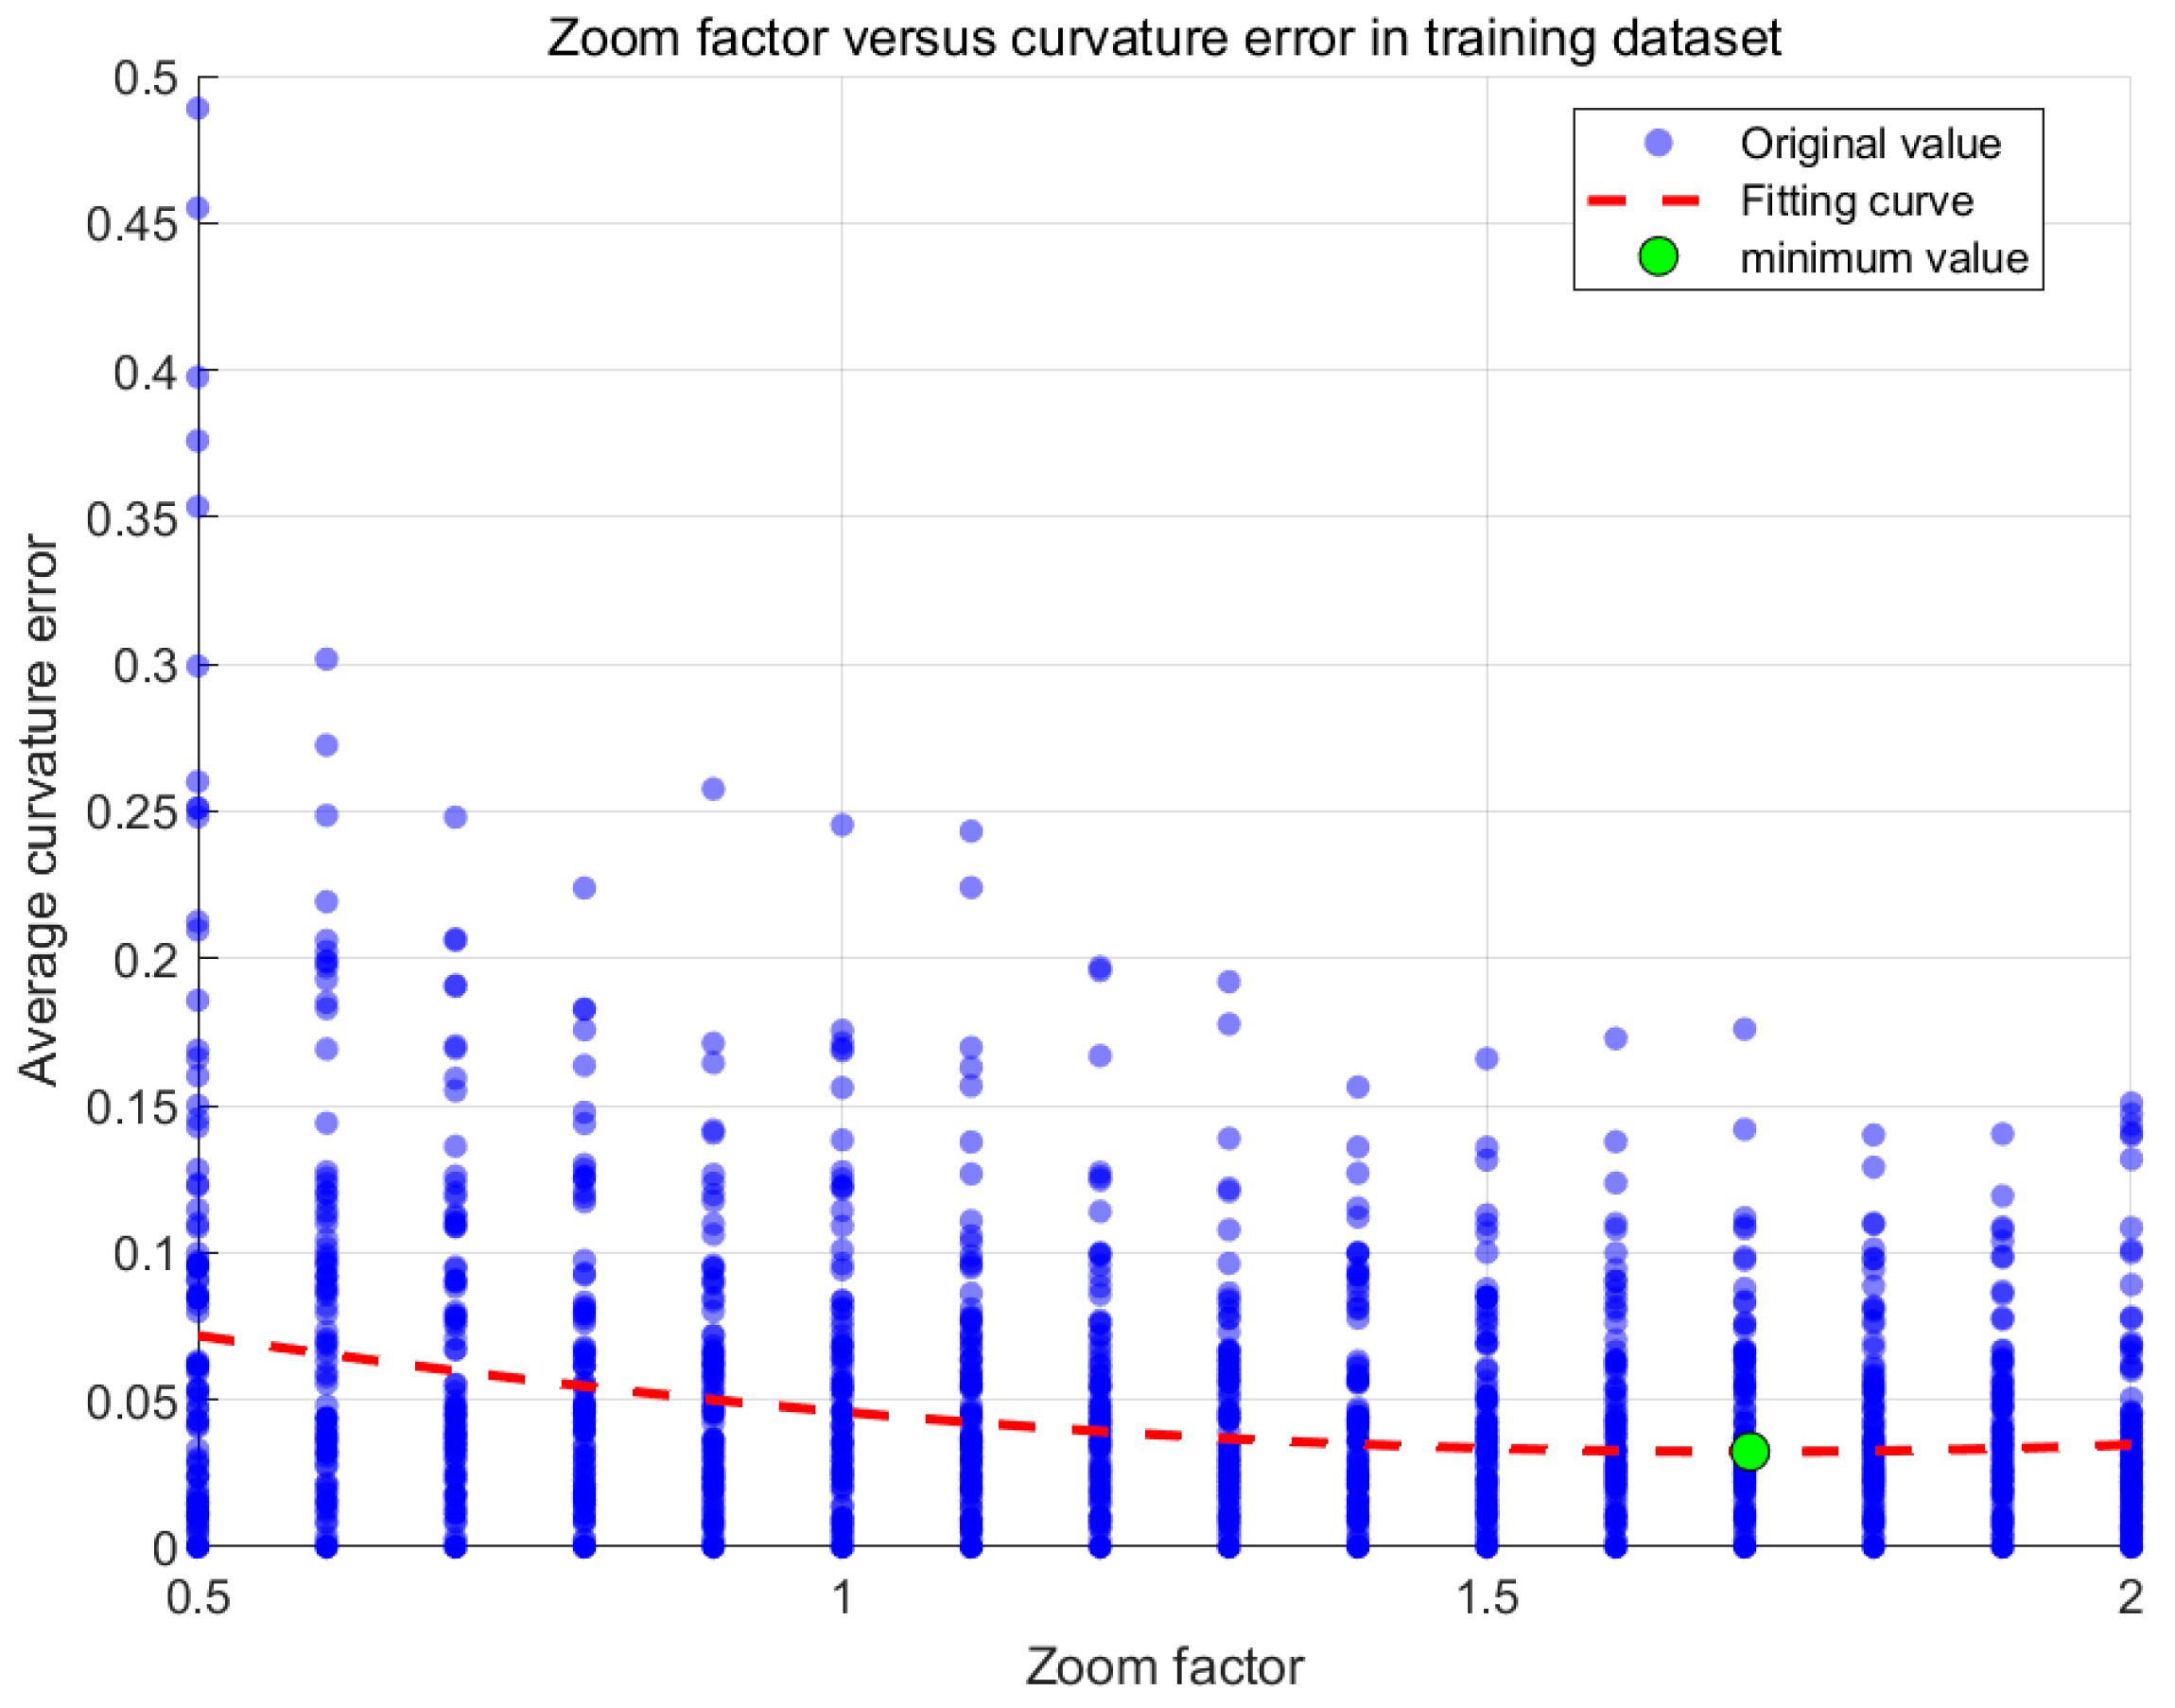
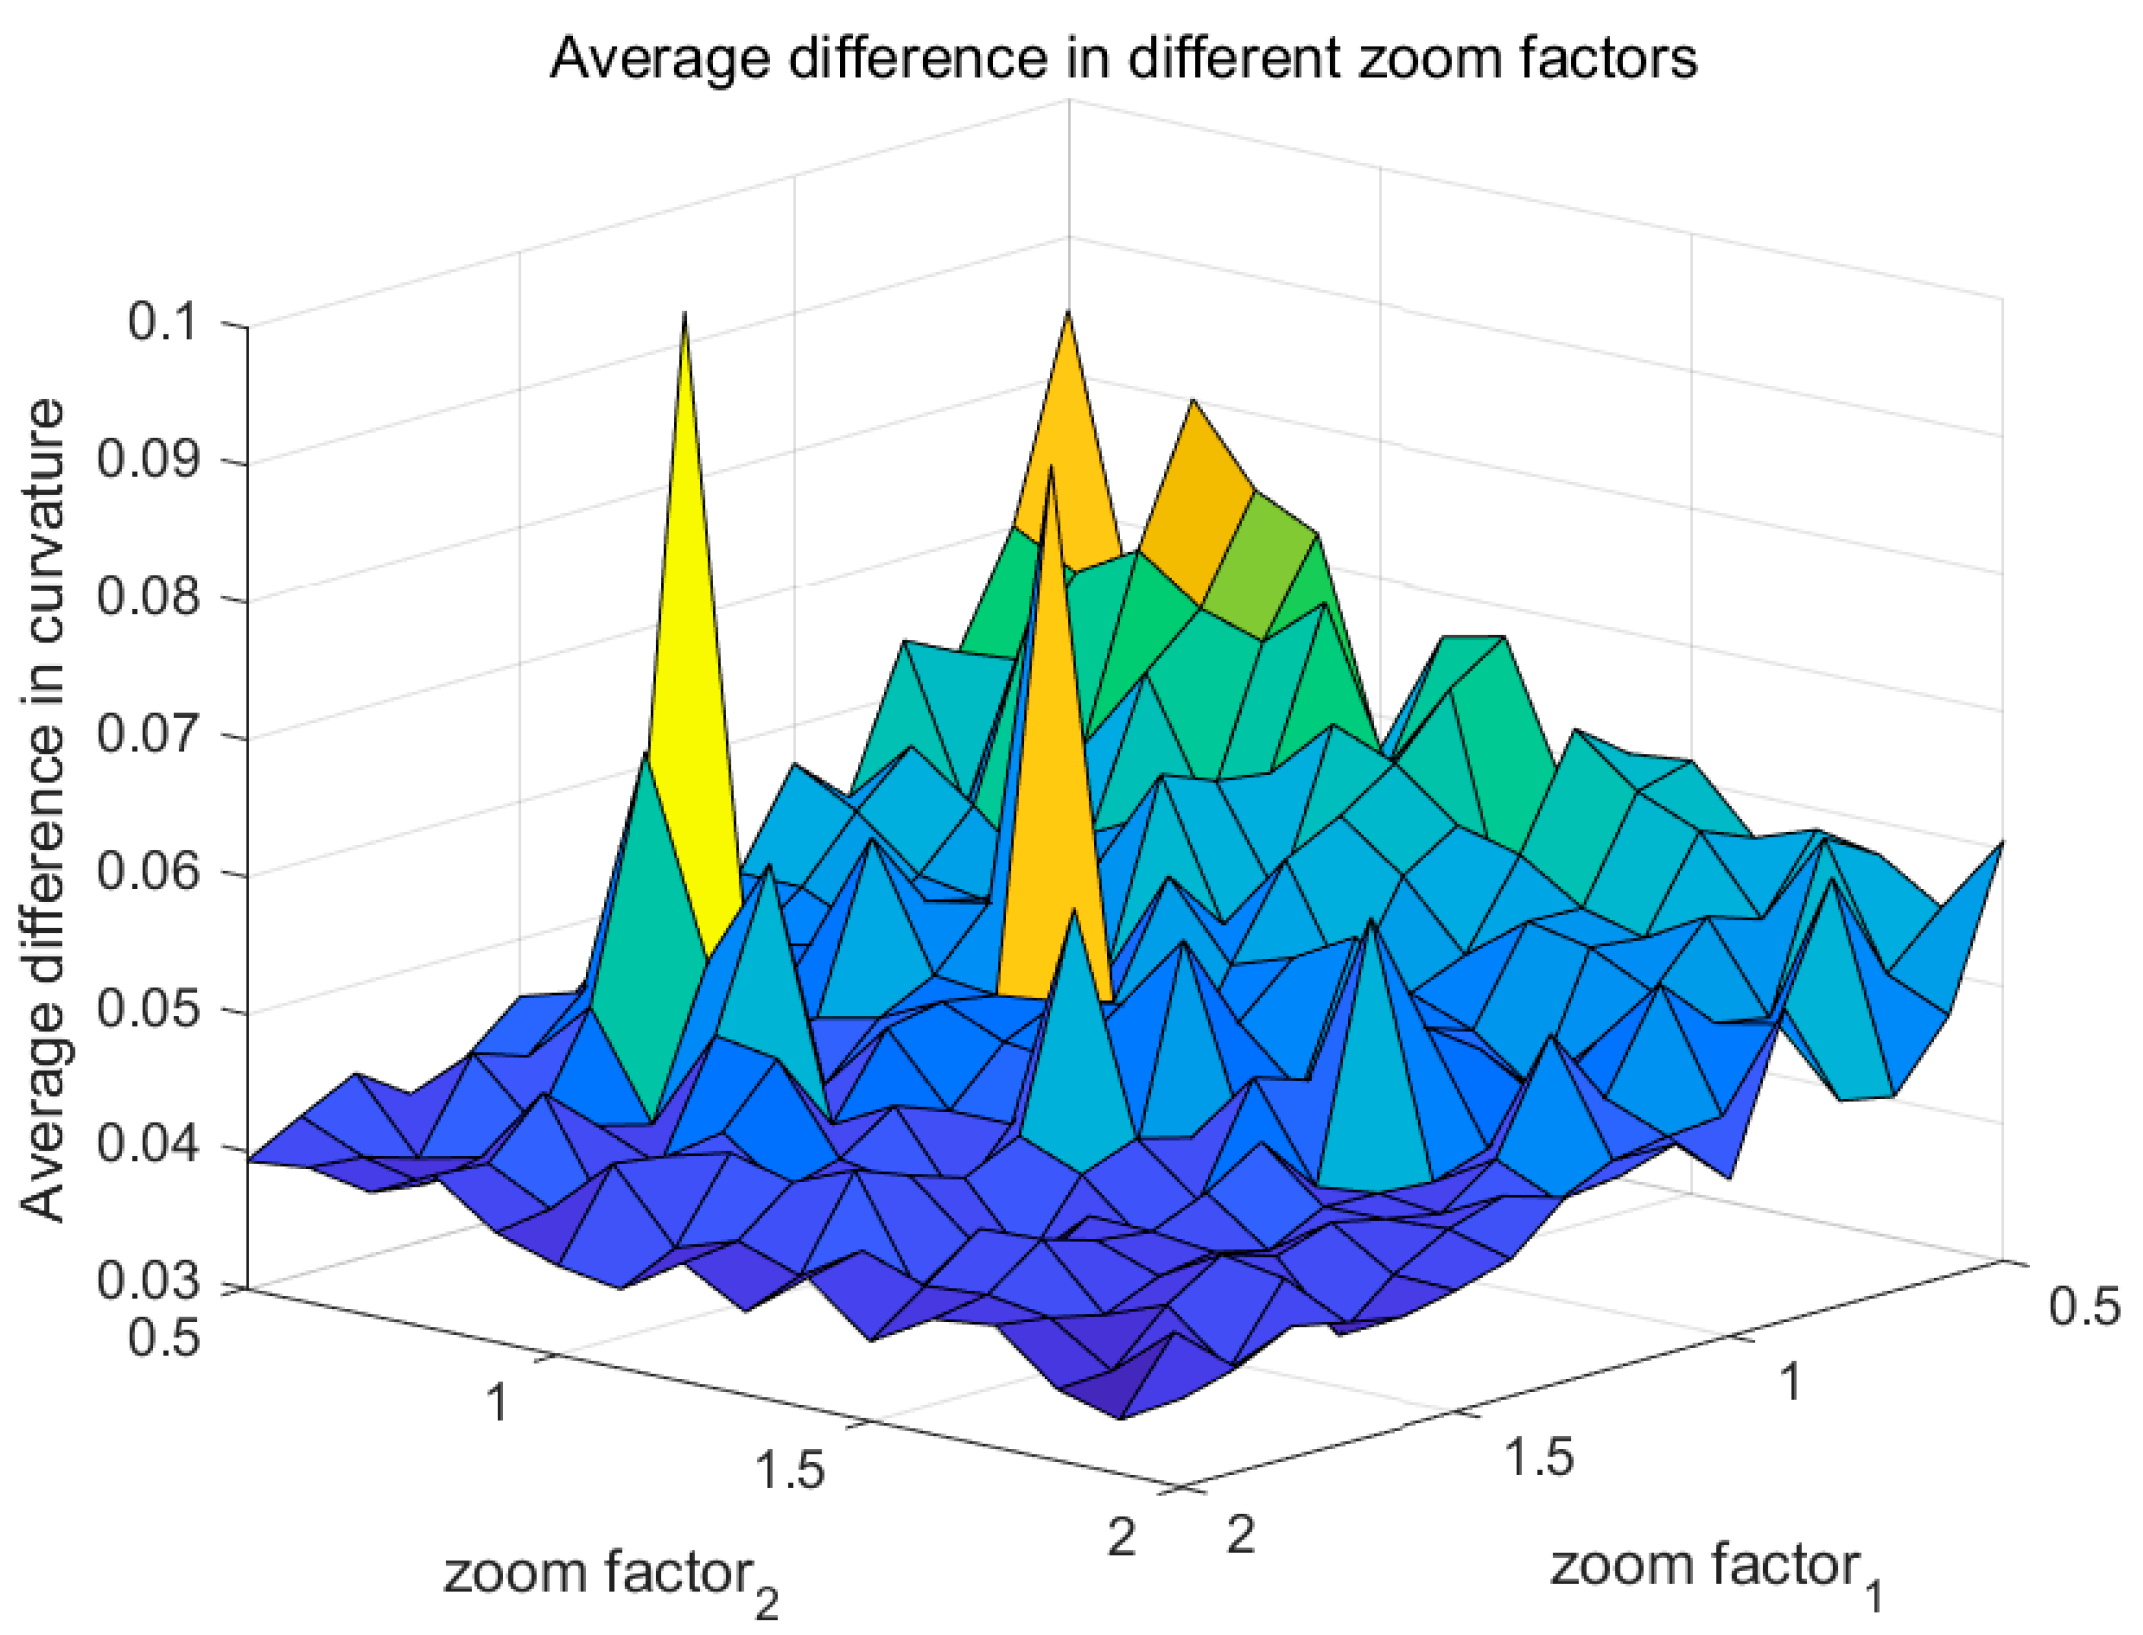
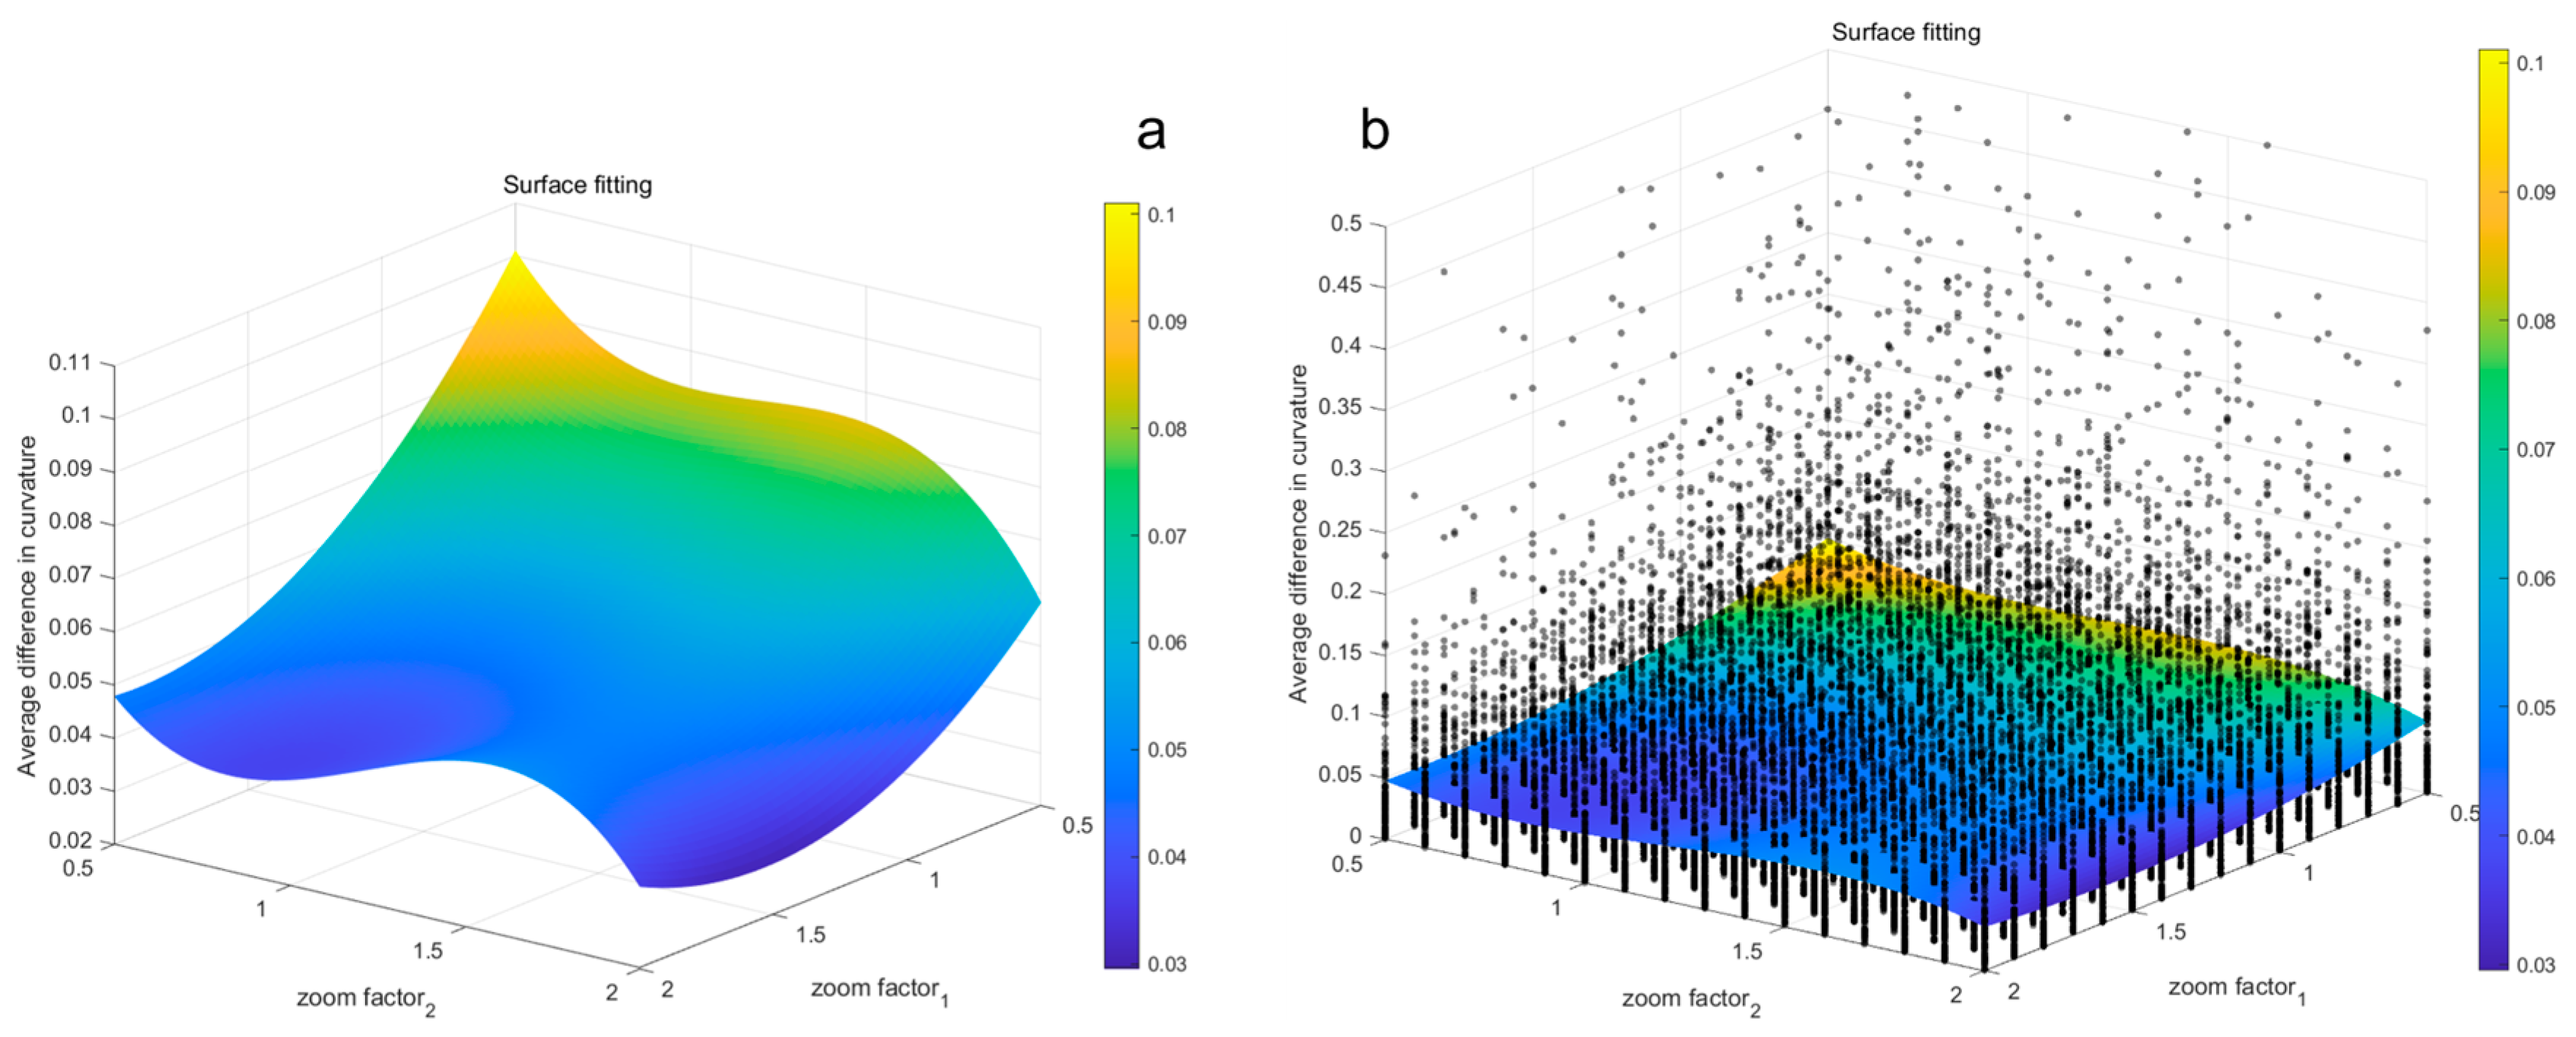
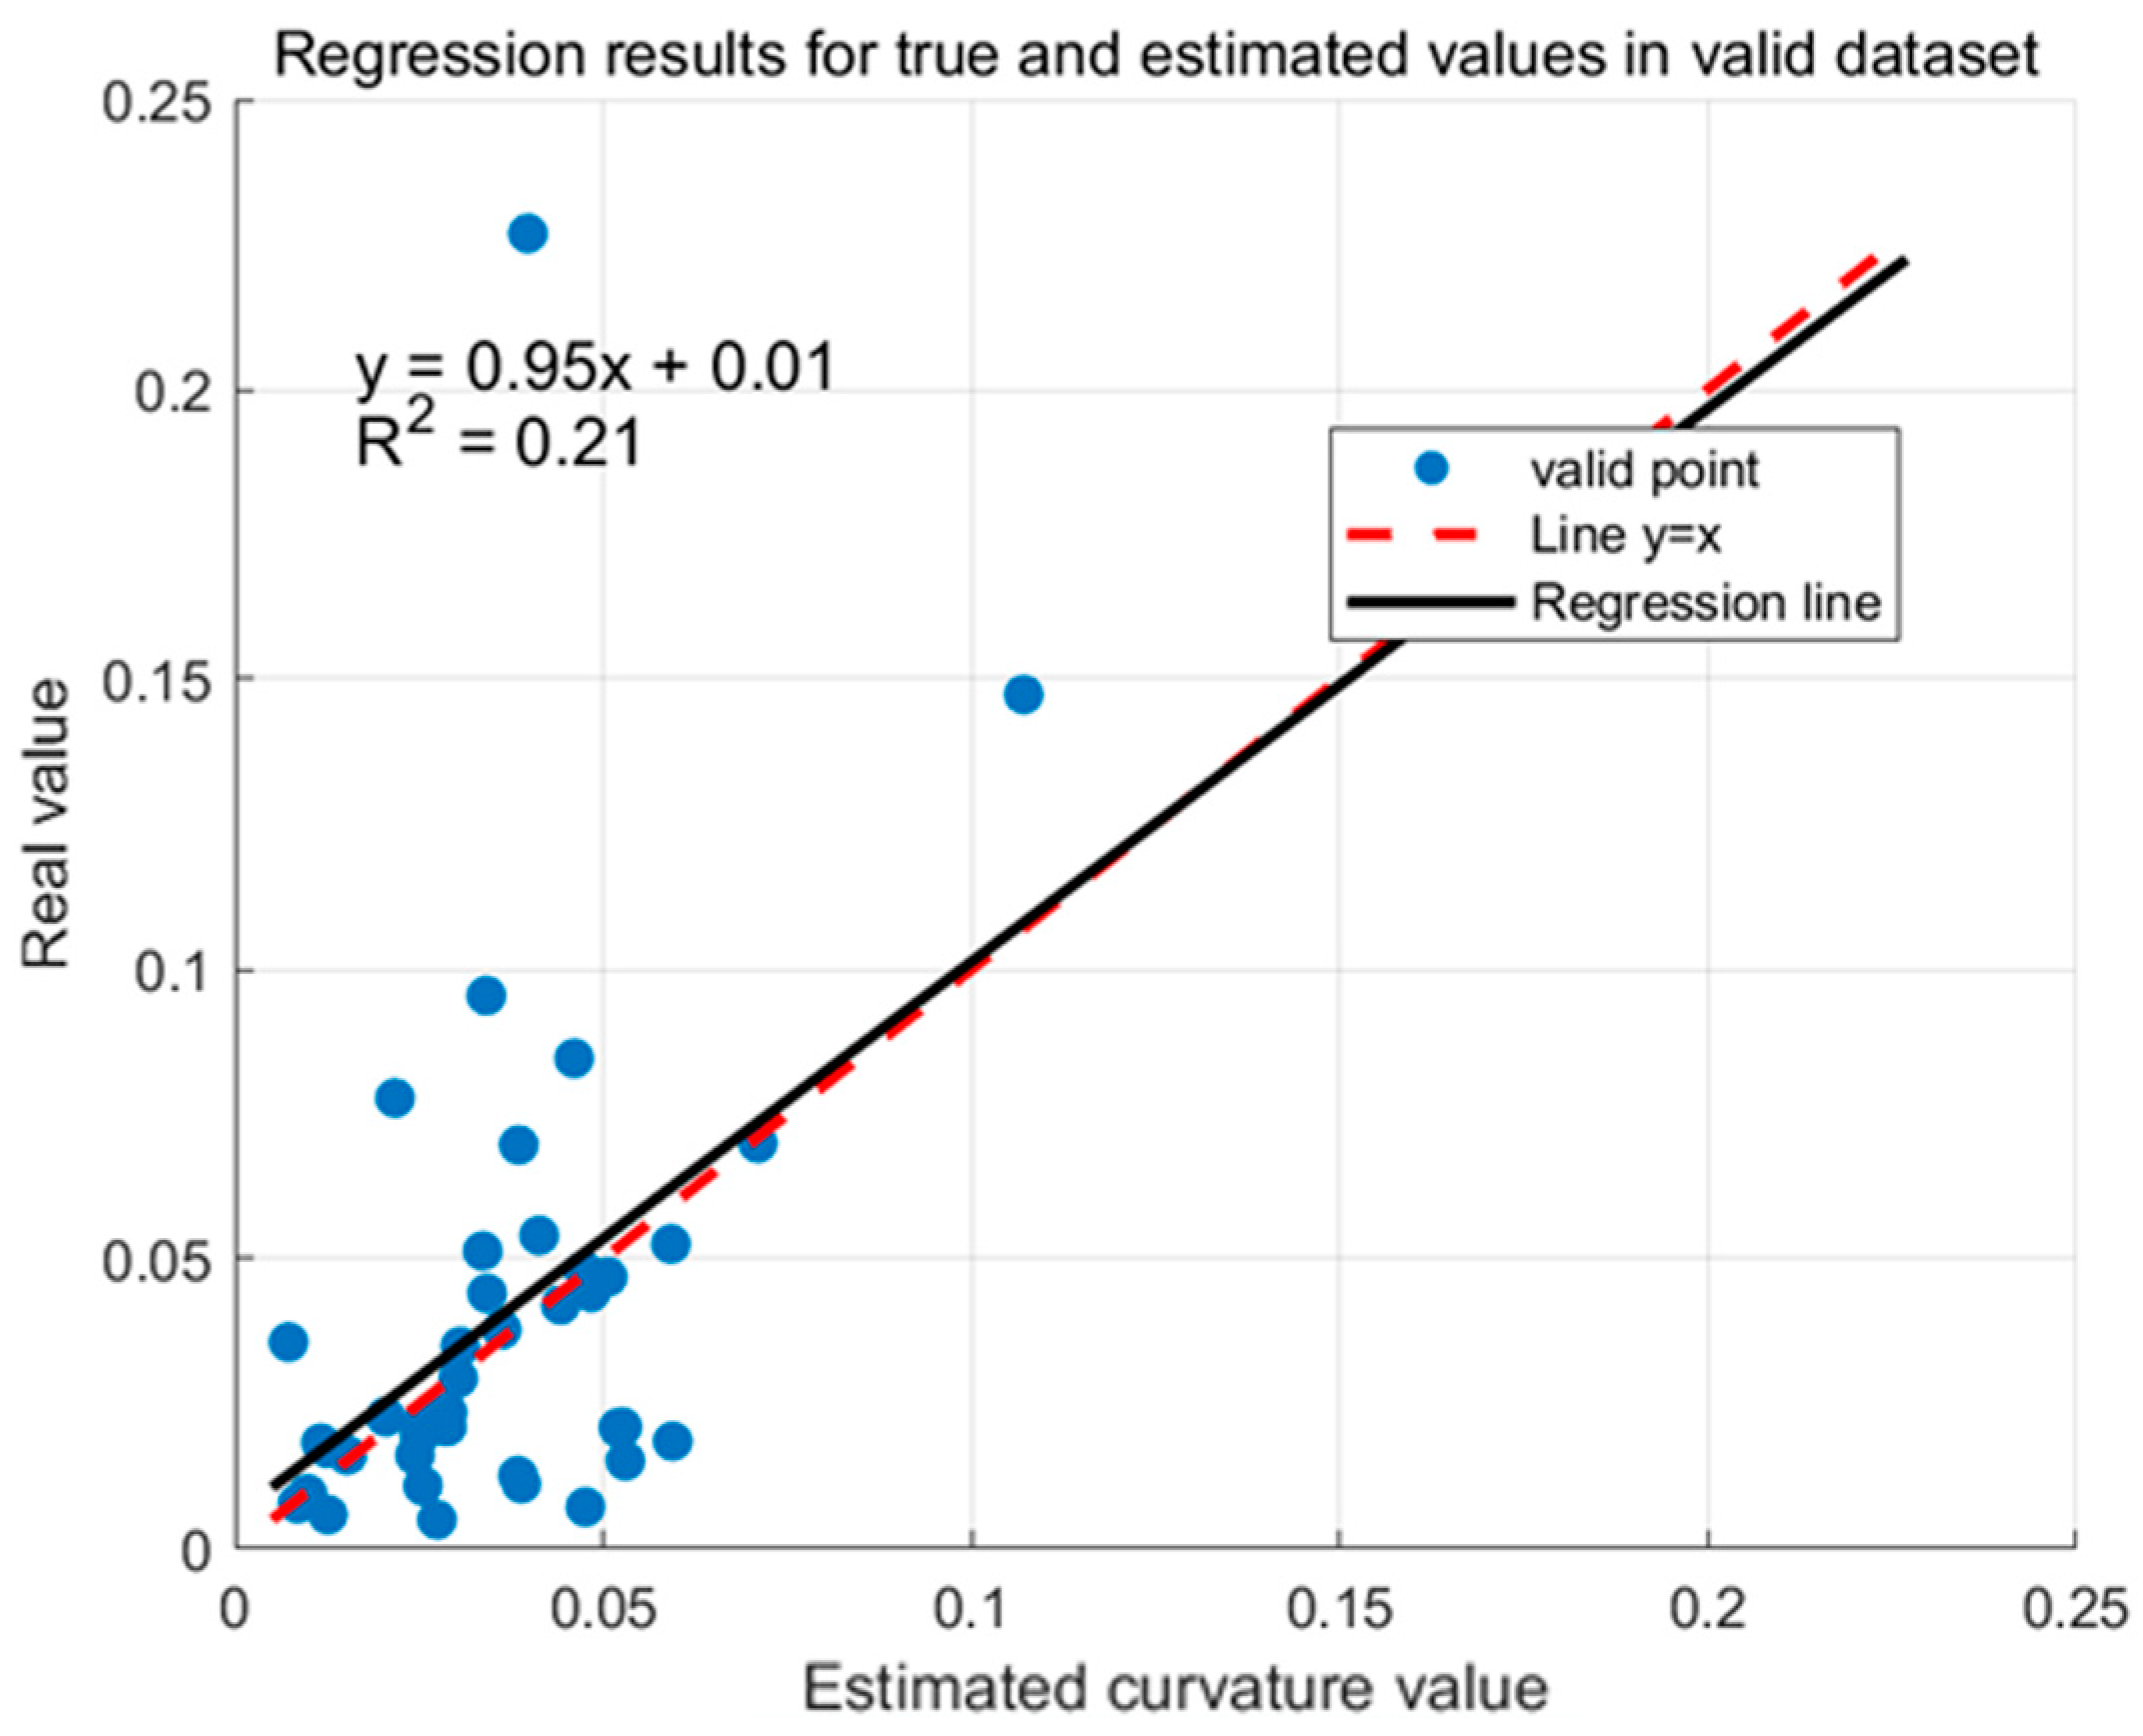
3.2. Optimized QSM-Based Inverse Algorithm for Trunk Curvature
4. Discussion
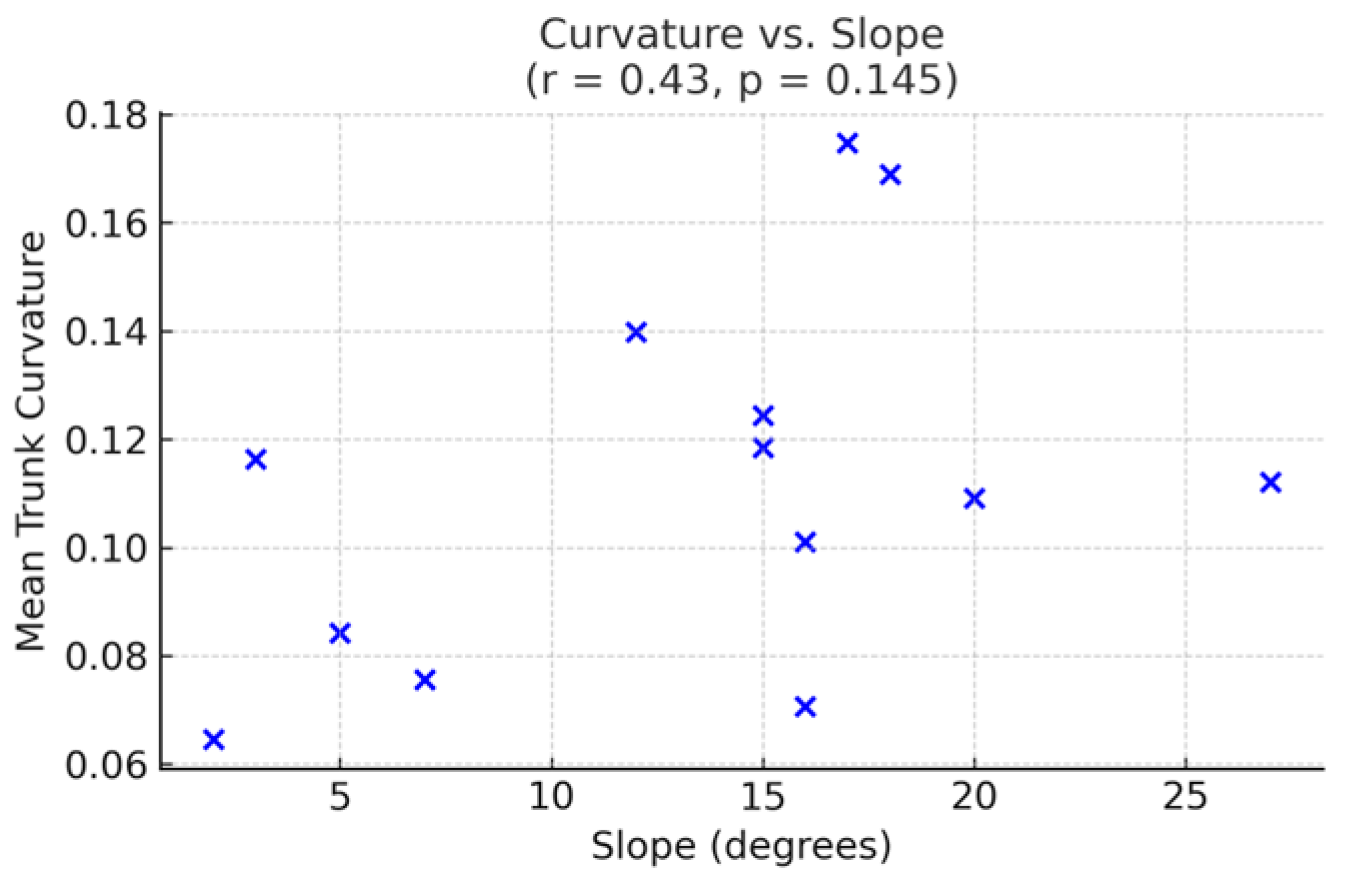
4.1. Regional Differences in Trunk Curvature
4.2. Explanation of Results
4.3. Limitations and Prospects
5. Conclusions
Supplementary Materials
Author Contributions
Funding
Data Availability Statement
Conflicts of Interest
References
- Campbell, A.D.; Fatoyinbo, T.; Charles, S.P.; Bourgeau-Chavez, L.L.; Goes, J.; Gomes, H.; Halabisky, M.; Holmquist, J.; Lohrenz, S.; Mitchell, C. A review of carbon monitoring in wet carbon systems using remote sensing. Environ. Res. Lett. 2022, 17, 025009. [Google Scholar] [CrossRef]
- Mao, X. Integrating Forest Ecosystem Services into Health Strategies to Improve Human Well-Being. Forests 2024, 15, 1872. [Google Scholar] [CrossRef]
- Hurteau, M.D. The role of forests in the carbon cycle and in climate change. In Climate Change; Elsevier: Amsterdam, The Netherlands, 2021; pp. 561–579. [Google Scholar] [CrossRef]
- Carle, M.A.; D’Amours, S.; Azouzi, R.; Rönnqvist, M. A strategic forest management model for optimizing timber yield and carbon sequestration. For. Sci. 2021, 67, 205–218. [Google Scholar] [CrossRef]
- Ahola, J.M.; Heikkilä, T.; Raitila, J.; Sipola, T.; Tenhunen, J. Estimation of breast height diameter and trunk curvature with linear and single-photon LiDARs. Ann. For. Sci. 2021, 78, 79. [Google Scholar] [CrossRef]
- Kükenbrink, D.; Schneider, F.D.; Leiterer, R.; Schaepman, M.E.; Morsdorf, F. Quantification of hidden canopy volume of airborne laser scanning data using a voxel traversal algorithm. Remote Sens. Environ. Interdiscip. J. 2017, 194, 424–436. [Google Scholar] [CrossRef]
- Kunz, M.; Hess, C.; Raumonen, P.; Bienert, A.; Hackenberg, J.; Maas, H.G.; Härdtle, W.; Fichtner, A.; Oheimb, G.V. Comparison of wood volume estimates of young trees from terrestrial laser scan data. Iforest Biogeosci. For. 2017, 10, 451–458. [Google Scholar] [CrossRef]
- Åkerblom, M.; Kaitaniemi, P. Terrestrial laser scanning: A new standard of forest measuring and modelling? Ann. Bot. 2021, 128, 653–662. [Google Scholar] [CrossRef]
- Arrizza, S.; Marras, S.; Ferrara, R.; Pellizzaro, G. Terrestrial Laser Scanning (TLS) for tree structure studies: A review of methods for wood-leaf classifications from 3D point clouds. Remote Sens. Appl. Soc. Environ. 2024, 36, 101364. [Google Scholar] [CrossRef]
- Chen, S.; Liu, H.; Feng, Z.; Shen, C.; Chen, P. Applicability of personal laser scanning in forestry inventory. PLoS ONE 2019, 14, e0211392. [Google Scholar] [CrossRef]
- Shruthi, S.; Sorin, P.; Marian, E.; Ryan, S.; Nian-Wei, K. Terrestrial laser scanning as an effective tool to retrieve tree level height, crown width, and stem diameter. Remote Sens. 2015, 7, 1877–1896. [Google Scholar] [CrossRef]
- West, P.W. Tree and Forest Measurement; Springer: Berlin/Heidelberg, Germany, 2009. [Google Scholar] [CrossRef]
- You, L. Stem Form Measurement Based on Point Cloud Data. Ph.D. Thesis, Chinese Academy of Forestry, Beijing, China, 2017. (In Chinese). [Google Scholar]
- Wu, R.; Chen, Y.; Wang, C.; Li, J. Estimation of Forest Trees Diameter from Terrestrial Laser Scanning Point Clouds Based on aCircle Fitting Method. In Proceedings of the IGARSS 2018—2018 IEEE International Geoscience and Remote Sensing Symposium, Valencia, Spain, 22–27 July 2018; pp. 2813–2816. [Google Scholar]
- Compeán-Aguirre, J.L.; López-Serrano, P.M.; Silván-Cárdenas, J.L. Evaluation of Two-Dimensional DBH Estimation Algorithms Using TLS. Forests 2024, 15, 1964. [Google Scholar] [CrossRef]
- Pueschel, P.; Newnham, G.; Rock, G.; Udelhoven, T.; Werner, W.; Hill, J. The influence of scan mode and circle fitting on tree stem detection, stem diameter and volume extraction from terrestrial laser scans. ISPRS J. Photogramm. Remote Sens. 2013, 77, 44–56. [Google Scholar] [CrossRef]
- Fekry, R.; Yao, W.; Cao, L.; Shen, X. Ground-based/UAV-LiDAR data fusion for quantitative structure modeling and tree parameter retrieval in subtropical planted forest. For. Ecosyst. 2022, 9, 674–691. [Google Scholar] [CrossRef]
- De Tanago, J.G.; Lau, A.; Bartholomeus, H.; Herold, M.; Avitabile, V.; Raumonen, P.; Martius, C.; Goodman, R.C.; Disney, M.; Manuri, S. Estimation of above-ground biomass of large tropical trees with terrestrial LiDAR. Methods Ecol. Evol. 2018, 9, 223–234. [Google Scholar] [CrossRef]
- Muumbe, T.P.; Tagwireyi, P.; Mafuratidze, P.; Hussin, Y.; Leeuwen, L.V. Estimating above-ground biomass of individual trees with terrestrial laser scanner and 3D quantitative structure modelling. South. For. A J. For. Sci. 2021, 83, 56–68. [Google Scholar] [CrossRef]
- Sheppard, J.; Morhart, C.; Hackenberg, J.; Spiecker, H. Terrestrial laser scanning as a tool for assessing tree growth. Iforest—Biogeosci. For. 2016, 10, 172–179. [Google Scholar] [CrossRef]
- Vandendaele, B.; Martin-Ducup, O.; Fournier, R.A.; Pelletier, G. Evaluation of mobile laser scanning acquisition scenarios for automated wood volume estimation in a temperate hardwood forest using quantitative structural models. Can. J. For. Res. 2024, 54, 774–792. [Google Scholar] [CrossRef]
- Wang, D.; Takoudjou, S.M.; Casella, E. LeWoS: A universal leaf-wood classification method to facilitate the 3D modelling of large tropical trees using terrestrial LiDAR. Methods Ecol. Evol. 2020, 11, 376–389. [Google Scholar] [CrossRef]
- Delagrange, S.; Jauvin, C.; Rochon, P. PypeTree: A Tool for Reconstructing Tree Perennial Tissues from Point Clouds. Sensors 2014, 14, 4271–4289. [Google Scholar] [CrossRef]
- Koreň, M.; Mokroš, M.; Bucha, T. Accuracy of Tree Diameter Estimation from Terrestrial Laser Scanning by Circle-Fitting Methods. Int. J. Appl. Earth Obs. Geoinf. 2017, 63, 122–128. [Google Scholar] [CrossRef]
- Shen, X.; Huang, Q.; Wang, X.; Li, J.; Xi, B. A Deep Learning-Based Method for Extracting Standing Wood Feature Parameters from Terrestrial Laser Scanning Point Clouds of Artificially Planted Forest. Remote Sens. 2022, 14, 3842. [Google Scholar] [CrossRef]
- Guzmán, N.; Moya, R.; Murillo, O. Evaluation of Bent Trees in Juvenile Teak (Tectona grandis L.f.) Plantations in Costa Rica: Effects on Tree Morphology and Wood Properties. Forests 2017, 8, 79. [Google Scholar] [CrossRef]
- Wang, J.; Jing, L.; Wang, Z.; Shi, S.; Liu, S. Study on quantitative detection of fruit tree branch bending effect based on SURF algorithm. In Proceedings of the 2019 14th IEEE International Conference on Electronic Measurement & Instruments (ICEMI), Changsha, China, 1–3 November 2019; pp. 413–424. [Google Scholar]
- Paradis, N.; Murphy, G.E. Effects of curvature in hybrid poplar on acoustic velocity at the tree level. N. Z. J. For. Sci. 2013, 43, 7. [Google Scholar] [CrossRef]
- Tao, S.L.; Wu, F.; Guo, Q.H.; Wang, Y.C.; Li, W.; Xue, B.L. Segmenting tree crowns from terrestrial and mobile LiDAR data by exploring ecological theories. ISPRS J. Photogramm. Remote Sens. 2015, 110, 66–76. [Google Scholar] [CrossRef]
- Raumonen, P.; Kaasalainen, M.; Åkerblom, M.; Sanna, K.; Harri, V. Fast automatic precision tree models from terrestrial laser scanner data. Remote Sens. 2013, 5, 491–520. [Google Scholar] [CrossRef]
- BS EN 1310:1997; Round and Sawn Timber–Method of Measurement of Features. British Standards Institution: London, UK, 1997. [CrossRef]
- Thies, M.; Pfeifer, N.; Winterhalder, D.; Gorte, B.G.H. Three-dimensional reconstruction of stems for assessment of taper, sweep and lean based on laser scanning of standing trees. Scand. J. For. Res. 2004, 19, 571–581. [Google Scholar] [CrossRef]
- Chidi, E.; Ebenezer, M.; Kenneth, E.U. Tree crown architecture: Approach to tree form, structure and performance: A review. Int. J. Sci. Res. Publ. 2015, 5, 1–6. [Google Scholar]
- Pfeifer, N.; Gorte, B.; Winterhalder, D. Automatic reconstruction of single trees from terrestrial laser scanner data. Int. Arch. Photogramm. Rem. Sens 2004, 35, 114–119. [Google Scholar]
- Wang, Z.; Zhang, L.; Fang, T.; Mathiopoulos, T.P.; Qu, H.; Chen, D.; Wang, Y. A structure-aware global optimization method for reconstructing 3-D tree models from terrestrial laser scanning data. IEEE Trans. Geosci. Remote Sens. 2014, 52, 5653–5669. [Google Scholar] [CrossRef]
- Lee, Y.S. Accuracy Assessment of Advanced Laser Scanner Technologies for Forest Survey Based on Three-Dimensional Point Cloud Data. Sustainability 2024, 16, 636. [Google Scholar] [CrossRef]
- Zhu, Y.; Jeon, S.; Sung, H.; Kim, Y.; Park, C.; Cha, S.; Jo, H.-w.; Lee, W.-k. Developing UAV-Based Forest Spatial Information and Evaluation Technology for Efficient Forest Management. Sustainability 2020, 12, 10150. [Google Scholar] [CrossRef]
- Wołk, K.; Niklewski, J.; Tatara, M.S.; Kopczyński, M.; Żero, O. Forestry Segmentation Using Depth Information: A Method for Cost Saving, Preservation, and Accuracy. Forests 2025, 16, 431. [Google Scholar] [CrossRef]
- Kolić, J.; Pernar, R.; Seletković, A.; Ančić, M. Determining the Accuracy of Structural Parameters Measured from LiDAR Images in Lowland Oak Forests. Forests 2025, 16, 340. [Google Scholar] [CrossRef]
- Ko, C.; Kang, J.; Park, J.; Lee, M. Assessing Forest Resources with Terrestrial and Backpack LiDAR: A Case Study on Leaf-On and Leaf-Off Conditions in Gari Mountain, Hongcheon, Republic of Korea. Forests 2024, 15, 2230. [Google Scholar] [CrossRef]

| Plot_ID | Aspect | Elevation | Average Treeheight | Slope |
|---|---|---|---|---|
| Plot01 | 229 | 167 | 13.55 | 3 |
| Plot02 | 113 | 194 | 8.25 | 5 |
| Plot03 | 155 | 254 | 13.51 | 20 |
| Plot04 | 247 | 202 | 8.86 | 2 |
| Plot05 | 62 | 194 | 13.44 | 27 |
| Plot06 | 342 | 204 | 8.95 | 7 |
| Plot07 | 23 | 270 | 8.84 | 16 |
| Plot08 | 203 | 176 | 9.89 | 16 |
| Plot09 | 328 | 252 | 15.77 | 12 |
| Plot10 | 69 | 209 | 10.83 | 18 |
| Plot11 | 234 | 253 | 17.25 | 15 |
| Plot12 | 242 | 424 | 15.24 | 15 |
| Plot13 | 335 | 196 | 13.67 | 17 |
| Sensor | GoSlam | Faro |
|---|---|---|
| Scanning range | 360° × 285° | 360° × 150° |
| Beam divergence angle | - | 0.3 mrad |
| Wavelength | - | 1550 nm |
| Beam diameter | - | 2.12 mm |
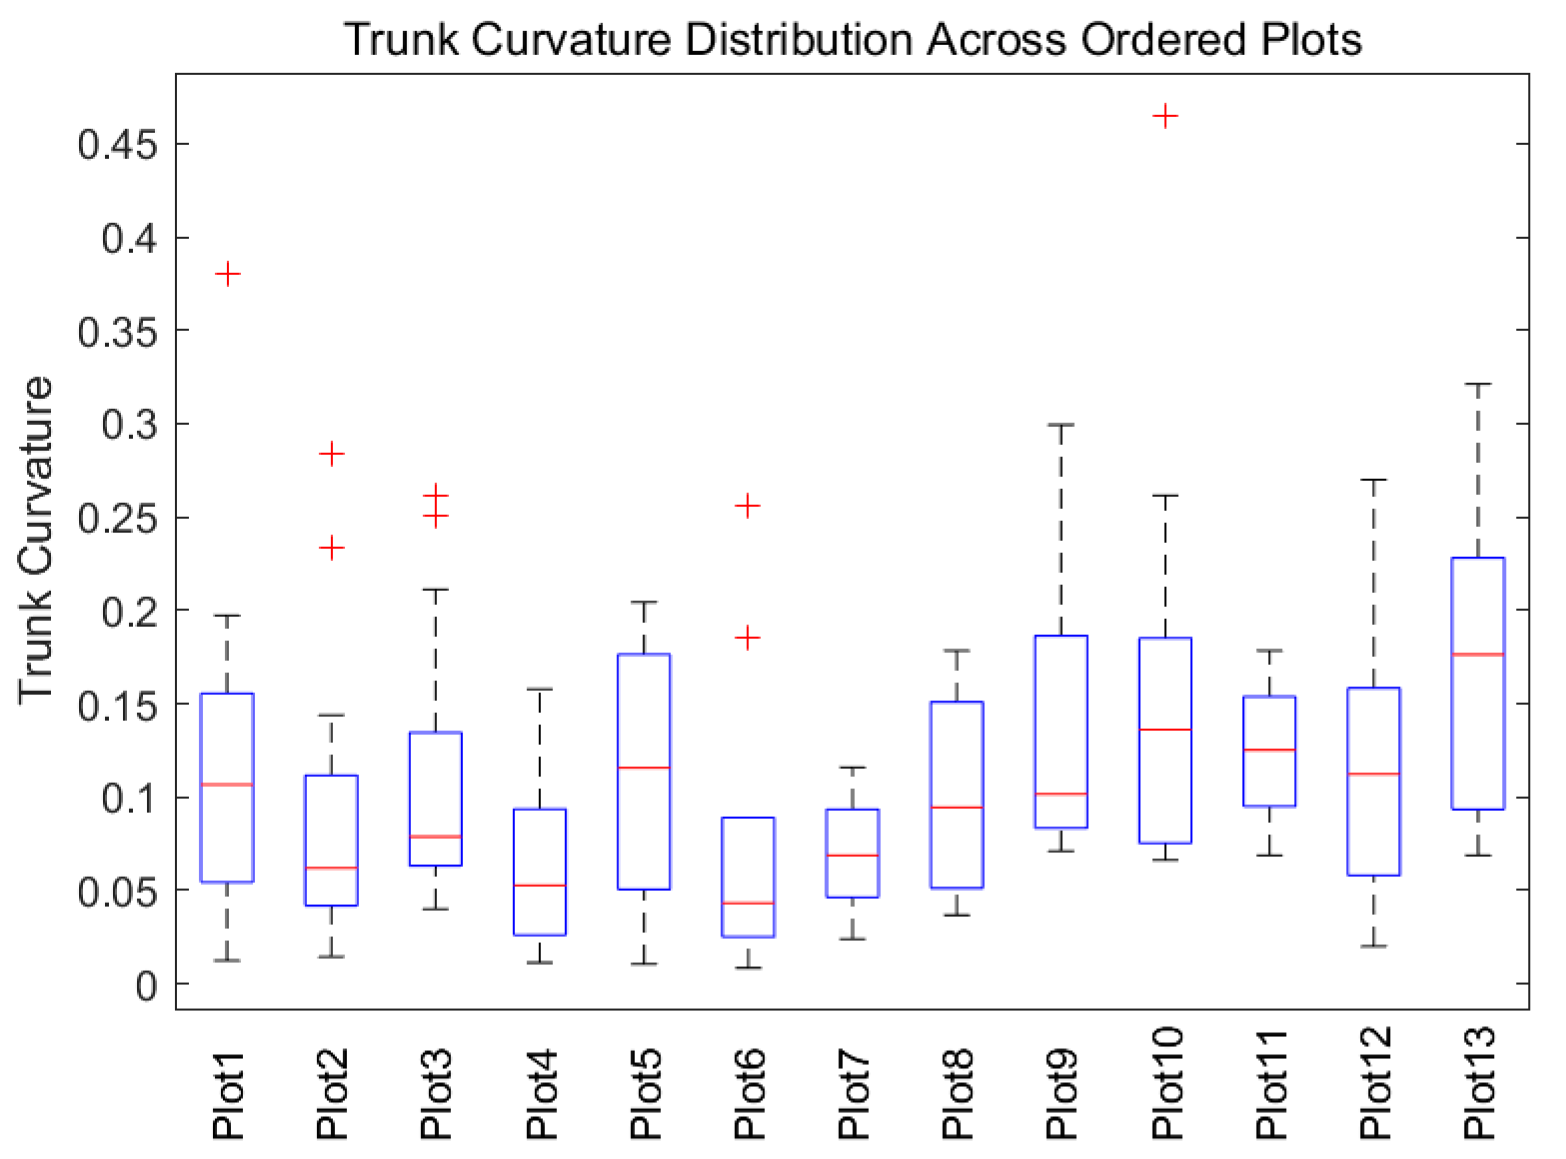
| Plot | Tree Count | Mean Curvature | Std. Deviation | Max Curvature |
|---|---|---|---|---|
| Plot1 | 17 | 0.12 | 0.08 | 0.38 |
| Plot2 | 28 | 0.08 | 0.06 | 0.28 |
| Plot3 | 15 | 0.11 | 0.07 | 0.26 |
| Plot4 | 13 | 0.06 | 0.05 | 0.16 |
| Plot5 | 6 | 0.11 | 0.07 | 0.20 |
| Plot6 | 10 | 0.06 | 0.08 | 0.26 |
| Plot7 | 14 | 0.07 | 0.03 | 0.11 |
| Plot8 | 4 | 0.10 | 0.06 | 0.18 |
| Plot9 | 7 | 0.14 | 0.08 | 0.30 |
| Plot10 | 10 | 0.17 | 0.12 | 0.46 |
| Plot11 | 4 | 0.12 | 0.04 | 0.17 |
| Plot12 | 8 | 0.12 | 0.08 | 0.27 |
| Plot13 | 10 | 0.17 | 0.08 | 0.32 |
Disclaimer/Publisher’s Note: The statements, opinions and data contained in all publications are solely those of the individual author(s) and contributor(s) and not of MDPI and/or the editor(s). MDPI and/or the editor(s) disclaim responsibility for any injury to people or property resulting from any ideas, methods, instructions or products referred to in the content. |
© 2025 by the authors. Licensee MDPI, Basel, Switzerland. This article is an open access article distributed under the terms and conditions of the Creative Commons Attribution (CC BY) license (https://creativecommons.org/licenses/by/4.0/).
Share and Cite
Fan, C.; Lan, Y.; Zhang, F. Tree Trunk Curvature Extraction Based on Terrestrial Laser Scanning Point Clouds. Forests 2025, 16, 797. https://doi.org/10.3390/f16050797
Fan C, Lan Y, Zhang F. Tree Trunk Curvature Extraction Based on Terrestrial Laser Scanning Point Clouds. Forests. 2025; 16(5):797. https://doi.org/10.3390/f16050797
Chicago/Turabian StyleFan, Chenxin, Yizhou Lan, and Feizhou Zhang. 2025. "Tree Trunk Curvature Extraction Based on Terrestrial Laser Scanning Point Clouds" Forests 16, no. 5: 797. https://doi.org/10.3390/f16050797
APA StyleFan, C., Lan, Y., & Zhang, F. (2025). Tree Trunk Curvature Extraction Based on Terrestrial Laser Scanning Point Clouds. Forests, 16(5), 797. https://doi.org/10.3390/f16050797