Article

Optimisation of CO2 Laser Technological Parameters and Their Impact on the Surface Quality of Cut Wood

Faculty of Wood Sciences and Technology, Technical University in Zvolen, T.G. Masaryka 24, 96001 Zvolen, Slovakia
*
Author to whom correspondence should be addressed.
Forests 2025, 16(5), 785; https://doi.org/10.3390/f16050785
Submission received: 3 April 2025 / Revised: 30 April 2025 / Accepted: 6 May 2025 / Published: 7 May 2025

Abstract

:
This paper discusses cutting beech wood (Fagus sylvatica L.) using a CO2 laser and optimising its feed speed and laser power concerning the roughness of the cut surface and the kerf width. The roughness, defined by the parameters Ra, Rz, Rv, and Rp, and the kerf width changed with varying technological parameters of the CO2 laser—feed speed and laser power. The lowest roughness was achieved at 50% laser power and a 15 mm·s−1 feed speed, while the highest roughness was reached at 50% and 30 mm·s−1. The lowest kerf width was achieved at 50% laser power and a feed speed of 15 mm·s−1 on both the upper and lower sides and vice versa. The result of the experiment was the creation of second-degree polynomial regression models, from which the optimal values of the technological parameters of the CO2 laser for cutting wood were determined for surface roughness and kerf width. The achieved accuracy of the models was 98.01% for the kerf width on the upper side, 95.95% for the kerf width on the lower side, 82.71% for the Ra parameter and 85.44% for the Rz parameter.

1. Introduction

Surface roughness and kerf width are properties that are largely influenced by the technological parameters of the CO2 laser (i.e., laser type, feed speed, laser power, focal length…) and by the properties of the wood itself (i.e., type of wood, dimensions, density). CO2 laser cutting uses the movement of a focused laser beam perpendicular to the surface to be machined [1]. Due to the absorption of the energy of the laser beam by the surface of the material, there is a sharp increase in temperature, because of which the material melts and partially evaporates. When cutting wood with a laser, the mutual bonds, such as hydrogen bonds and lignin-based connections, between individual fibres are disrupted due to the intense heat. Laser cutting of wood is accomplished by the degradation of chemical bonds due to the thermal effect [2]. This process is accompanied by combustion [3]. The laser’s ability to cut wood depends on surface absorbance and thermal conductivity. The CO2 laser can be used for straight or curvilinear cutting, engraving [4,5], or surface modification [6]. As a result of the beam’s interaction with the wood’s cellular elements, the formation of a burnt machined surface occurs. The high temperature around the cutting kerf creates a heat-affected zone, characterised by a different colour [7]. Due to the heterogeneity of wood as a material, the burn is not uniform, and extensive unevenness is created on the surface. In general, however, there are several aspects within which it is possible to define the effects acting on surface unevenness. In terms of wood structure and properties, a common source of unevenness is the difference in density between lower-density earlywood and higher-density latewood, which is also apparent from this study [8,9]. These height differences are also defined by the authors as anatomical waviness [10]. Studies show that the laser beam burns earlywood more compared to latewood [11]. The structure of earlywood is mostly made up of cell elements with wide lumens and thin cell walls (which burn quickly when interacting with the laser beam). Latewood is predominantly made up of cellular elements with smaller lumens and a thicker cell wall. As a result, the lignin contained in the cell walls softens and melts, creating spots with burns on the surface of the wood. To some extent, this melt can penetrate the lumens of cellular elements, which may seem like a locally smoother spot when measuring roughness [12]. However, even these melts on the surface are most often another cause of unevenness of the laser-machined surface. According to the study of [13], CO2 laser-cut wood is characterised by roughness due to a greater degree of lignin burning, while the cell walls formed mainly by cellulose become charred. The second aspect is the set parameters of the CO2 laser, especially the cutting speed, laser power [14], and focal point [15,16]. Increasing laser power according to the study of [17] results in a cleaner cut with a smoother final surface of phenolic resin boards. The same measurements are apparent on MDF board in the work of the authors [18]. On the contrary, according to [14], as the laser power increases, the surface roughness parameters Ra and Rz also increase. A higher laser power delivers more heat per unit of time, which leads to the evaporation of certain chemical components of the wood, such as extractives. This leads to the evaporation of some chemical components of the wood (e.g., extractive substances). Another parameter that significantly affects the roughness of the surface is the feed speed. In [14], a feed speed in the range of 100 to 300 mm·s−1 significantly reduces the roughness of the surface, then the roughness does not change significantly as the speed increases. Also, according to [5,19], the surface is rougher when the feed speed is lower. The findings correlate with the theory that the roughness of the surface decreases with a higher feed speed. In [15], the increase in feed speed did not cause a statistically significant increase in roughness. From the study [18,20], on the contrary, it follows that, in some cases, with a lower speed, the surface roughness decreases, and vice versa. In addition to the quality of the created surface, this research also focuses on the kerf width after laser cutting. This can change due to the heterogeneity of the wood. However, its width can be essential for more complex curvilinear cutting models, especially when cutting more complex parts. The absorption of laser radiation on the surface of the wood is uneven, resulting in multiple repeated absorptions and reflections in the cutting kerf [21]. When analysing the shape of the kerf, several authors report a conical V-shape of the kerf, with a decreasing kerf width along the depth of cut [22]. According to [21], the cause of the V-shape of the kerf is the orientation of the focal point on the surface of the wood, where the greatest concentration of energy is. However, the burnt material, fume, as well as the side walls of the cut absorb some of this energy, so there is less energy supplied on the underside of the cut. At the same time, the research shows that the kerf width is variable depending on the passage of the laser beam through earlywood and latewood. The kerf width is usually smaller in the zone of latewood, which is denser, and more energy is therefore needed to burn it. According to a study by [21], as the CO2 laser power increases, the width of the cutting kerf also increases. The increase in the amount of energy supplied per unit of time causes a sharp increase in the temperature and more efficient evaporation of wood as a material. In contrast to the increase in laser power, the increase in feed speed is reflected in a decrease in the width of the cutting kerf, due to the shorter interaction of the laser beam with the wood [21].
Due to a lack of mathematical models that comprehensively consider laser power and feed speed together (as one of the most important technological parameters), the novelty of this work lies in the development of a regression model specifically for predicting surface roughness and kerf width as a function of varying feed speed and laser power in CO2 laser cutting of wood.
For the above reasons, to achieve a high-quality machined surface, it is necessary to deal with optimising the laser cutting process. This paper aims to comprehensively assess the interaction of the laser beam with the wood surface and to create a mathematical regression model based on which it would be possible to determine the future quality (surface roughness) and kerf width after CO2 laser cutting. The following sub-tasks are carried out as part of the experiment:
  • Microscopic analysis of the cut surface at selected values of feed speed and laser power.
  • Analysis of the effect of basic CO2 cutting parameters on the surface roughness and kerf width.
  • Creation of mathematical regression models for determining the feed speed and laser power concerning surface roughness and kerf width.

2. Materials and Methods

2.1. Preparation of Samples

For the experiment, 3 larger pieces of radial board made of beech wood (Fagus sylvatica L.) were used. Beech wood is one of the most-used types of wood in the production of furniture, small wooden objects, and is also suitable for engraving. At the same time, beech wood is suitable for researching wood roughness, as its smaller diameter vessels do not affect measurements as much as, for example, oak wood. From this point of view, beech wood is suitable for the early stages of research into optimising the technological parameters of the CO2 laser. The samples were stored indoors under constant conditions. Their moisture content was determined by the gravimetric method (oven-drying) in the laboratory oven at a temperature of 103 ± 2 °C. The samples reached a moisture content of 8% ± 2% after acclimatisation. Moisture content was chosen as the most common value corresponding to the production and operating conditions (equilibrium moisture content in the interior ranges from 8% to 10%). In the experiment, this moisture content value was maintained all the time, as the effect of moisture content on the surface morphology was not investigated. However, according to a study of [23], changes in wood moisture content do not have a discernible effect on surface roughness. However, in the case of waviness, a very-high moisture content (greenwood) can lead to reduction in surface waviness of CO2 laser-cut surface [24]. Therefore, the moisture content was controlled only according to production conditions.
The samples were sawn first, then milled using a planer, and then equalised in thickness using a thicknessing milling machine with a spiral cutter head. The final dimensions of the samples were determined at 6 mm × 70 mm × 150 mm (thickness × width × length) (from the previous experiments, it was seen that 6 mm was the maximum thickness that this 135 W laser could cut through). These samples were then cut using a CO2 laser (CM-1309, Shenzhen Reliable Laser Tech, Shenzhen, China).

2.2. Sample Cutting Using a CO2 Laser

In AutoCAD 2023 software (Autodesk, Inc.; San Francisco, CA, USA), a program was created to simplify the programming of the CO2 laser cutting path and the setting of laser power and feed speed values. For one sample of beech wood, the program included 9 cuts, spaced apart by 5 mm. Each sample was cut by laser along the fibres. The cut surface was the tangential surface of the beech wood. The total number of combinations was 9—3 laser power values and 3 feed speed values. Three cuts were made for one combination of parameters. The samples were then cut using a CO2 laser (CM-1309, Shenzhen Reliable Laser Tech, Shenzhen, China) with a maximum laser power of 135 W. The specimen distance from the lens was 17 mm. The following powers were set for the first group of cuts: 100% (135 W), 75% (101.25 W), and 50% (67.5 W). The selected parameters of the CO2 laser were to obtain broader and more detailed information about the effect of the laser on beech wood. The feed speed for this group of cuts was 30 mm·s−1. These parameters were determined based on previous experimental experience. The feed speed of 30 mm·s−1 was defined as the maximum feed speed of the laser, which can still cut through 6 mm-thick growth wood. The same power setting was used for the second and third groups of cuts, sequentially, with different feed speeds of 22.5 mm·s−1 and 15 mm·s−1. The 15 mm·s−1 feed speed was set as a technological 50% of the maximum speed. At the same time, it was determined by previous experiments that, at a lower feed speed of the laser, the burn was already large, and the surface quality was very low. A feed speed of 22.5 mm·s−1 was determined as the midpoint between the maximum and minimum feed speeds. These parameters were chosen for the experiment to monitor the development of the dependence of the surface quality and the width of the cutting kerf on the parameters of the CO2 laser. The selected cutting parameters were determined to achieve optimal cut and wood surface quality. The beam’s focal point was centred within the material’s thickness.

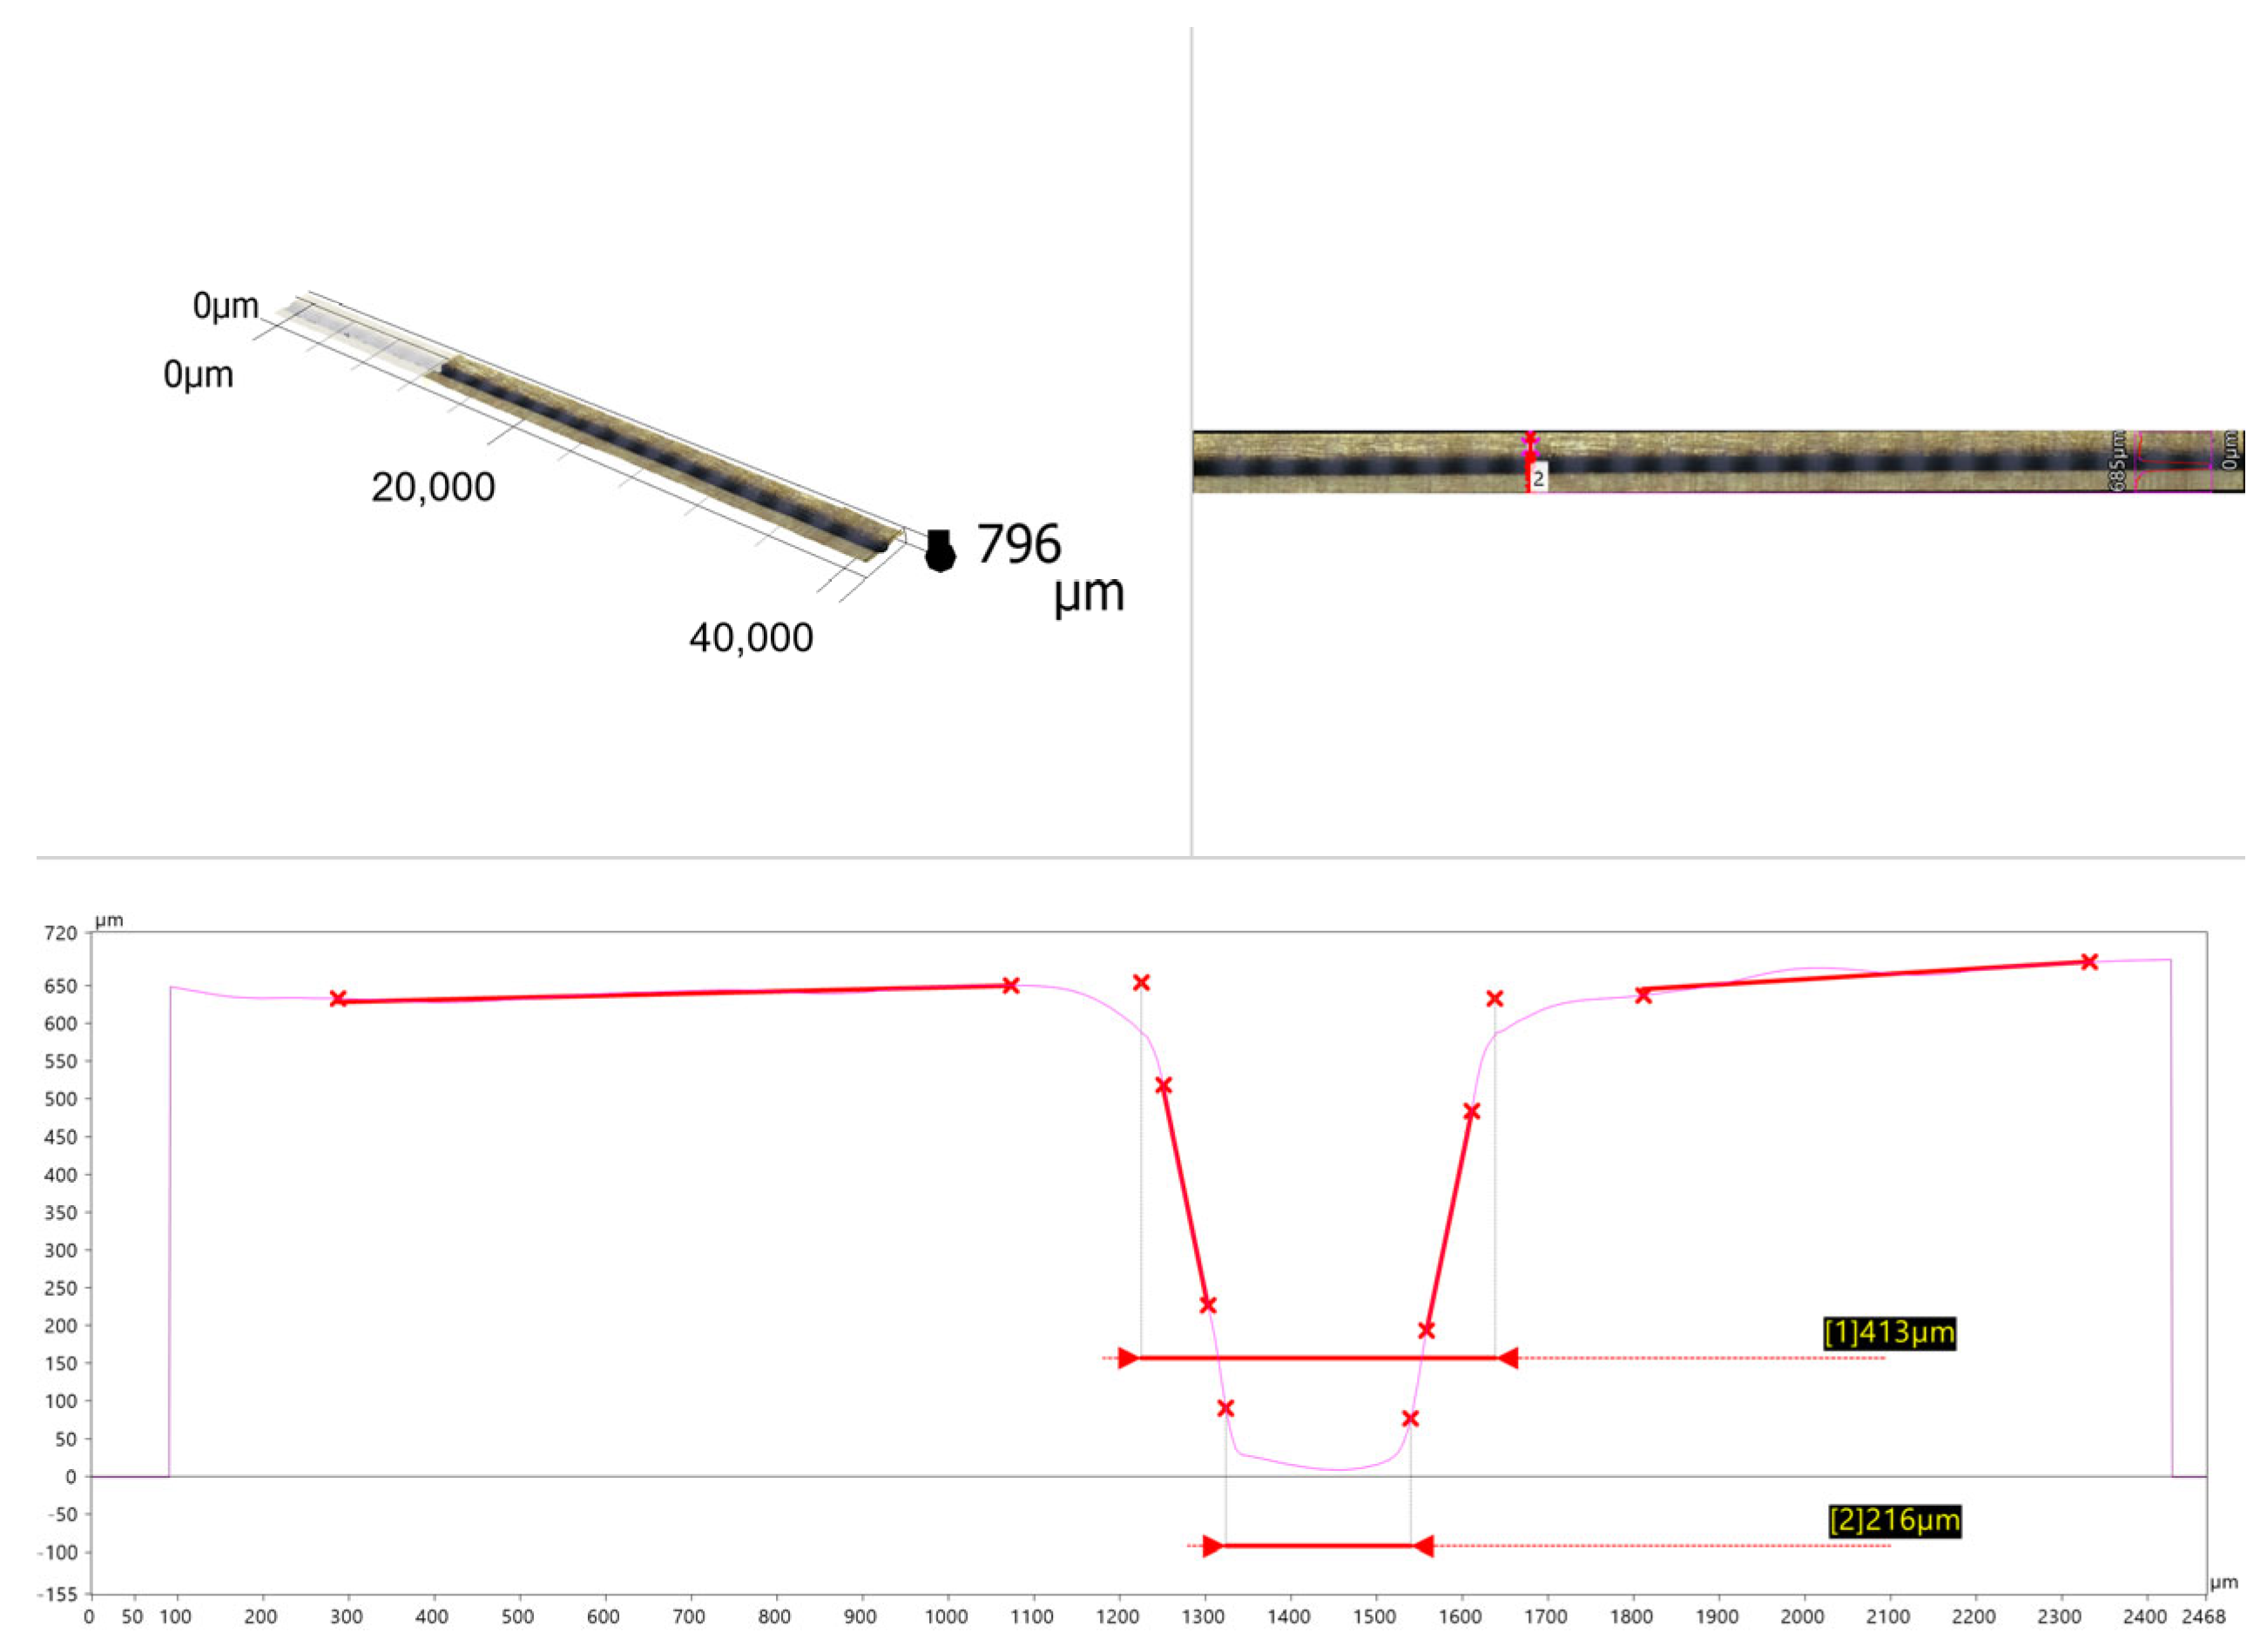
2.3. Measurement of the Kerf Width, Surface Roughness, and Microscopic Analysis

After creating 27 kerfs with a length of 70 mm, the kerfs were scanned with a Keyence VHX-7000 digital microscope (Keyence Corporation, Osaka, Japan). The length of the scan was 3 mm × 30 mm (considering the total sample thickness and length of the scan). A scan length of 30 mm was placed in the centre of each 70 mm-long cutting kerf. The reason for this placement was to exclude edge points where the laser beam entered and exits the sample and where there could potentially be fluctuations in the width of the cutting kerf. For each scan, 10 values were measured, which in total created a set of 30 measurements for each kerf (for each combination of CO2 laser technological parameter). The kerf width was measured by VHX-H5M software (Keyence Corporation, Osaka, Japan), which included a 3D profile measurement tool. The measuring line (line) was taken perpendicular to the kerf. Based on the measuring line, the software created a cross-section of the surface and a cross-section of the kerf, which created a 3D topography of the scanned surface as well as a measurable profile. Then it was possible to measure dimensions on the profile, such as the kerf width. The digital profile was interlaced with straight lines, from which the software calculated the intersection. The kerf width on the upper side was defined as the distance between these intersections (Figure 1). This method eliminated the influence of rounding of different sizes, which were created when the laser penetrated the surface of the sample. This resulted in more objective and relevant results. The measurement of the width of the cutting kerf on the underside can be seen in Figure 1.
After scanning the kerf widths, the kerfs were then sawn across. This opened the kerfs so that the laser-cut surface could be scanned. The cut thus created 54 surfaces. The surface quality after CO2 laser cutting was expressed through the roughness of the wood. Surface roughness was measured following a published series of technical standards [25]. The quality itself was expressed by measuring roughness parameters Ra (arithmetic mean height—arithmetic mean of the absolute values of the ordinate values), Rz (maximum height—the mean value, from all section lengths, of the per section sum of the largest peak height and largest pit depth), Rv (mean pit depth—the mean value, from all section lengths, of the largest pit depth of each section length), Rp (mean peak height—the mean values, from all section lengths, of the largest peak heigh of each section length), and Rsk (skewness—the quotient of the mean cube values of the ordinate values and the cube of Rq). The Ra parameter was chosen as a more stable parameter and, at the same time, the most used parameter. It was used to compare the results with the results of other studies. The disadvantage is that multiple profiles of different shapes can have the same parameter value, Ra. Therefore, to determine the height of individual depressions or elevations, the parameters Rz, Rv, Rp, and Rsk were added to the analysis. The disadvantage of these parameters is that they are largely influenced by the anatomical structure of the wood. An L-filter (λc) with a value of 2.5 mm and an S-filter (λs) with a value of 8 μm were used according to ISO 21920:3 [25]. The evaluation (le) length was 12.5 mm, and the total scanned length was 17.5 mm. The accuracy of the roughness measurement using a digital microscope was ensured by a 0.1 μm lateral resolution. A total of 10 values were obtained from 1 sample. The higher number of profile traces aimed to capture the mean surface roughness value as accurately as possible. The individual profile traces were evenly distributed in the sample. This procedure made it possible to better define the surface in terms of the heterogeneity of wood as a material. The longer wavelength associated with the waviness was filtered out from the shorter wavelength associated with the roughness by using a double Gaussian filter. The robust Gaussian regression filter, which is considered the most suitable for separating waviness and roughness on the surface of wood, is not included in the Keyence VHX-7000 digital microscope (Keyence Corporation, Osaka, Japan) and was therefore not used. A double Gaussian filter is less prone to profile distortion than a Gaussian filter, especially in the case of a 2.5 mm L filter, however some distortion may still occur.

2.4. Statistical Methods

All data were evaluated after measurement using the statistical program STATISTICA 14 (TIBCO Software Inc., Palo Alto, CA, USA). As part of the inductive statistics, a two-factor analysis of variance (ANOVA) was subsequently performed. ANOVA is conditional on the fulfilment of the basic conditions. The first condition is the normality of the distribution of random variable values for all groups. This assumption was tested by the Shapiro–Wilk test for all data sets. The results of the test show that, in most groups, the data have a Gaussian distribution of values. The second condition for ANOVA is the equality of variances at individual factor levels. This assumption was tested by the Leven’s test. The result of the Leven’s test does not confirm the null hypothesis of equality of variances. This is probably related to the natural heterogeneity of the structure of wood. Despite not meeting this condition, ANOVA can be used. This is because ANOVA is a robust statistical method, so the assumptions can be violated to a certain extent, and the technique can be applied. The last and, at the same time, the most important assumption for the use of ANOVA is the independence of the values of the measured quantity, which in this case is sufficient to be evaluated by a logical assessment.

3. Results and Discussion

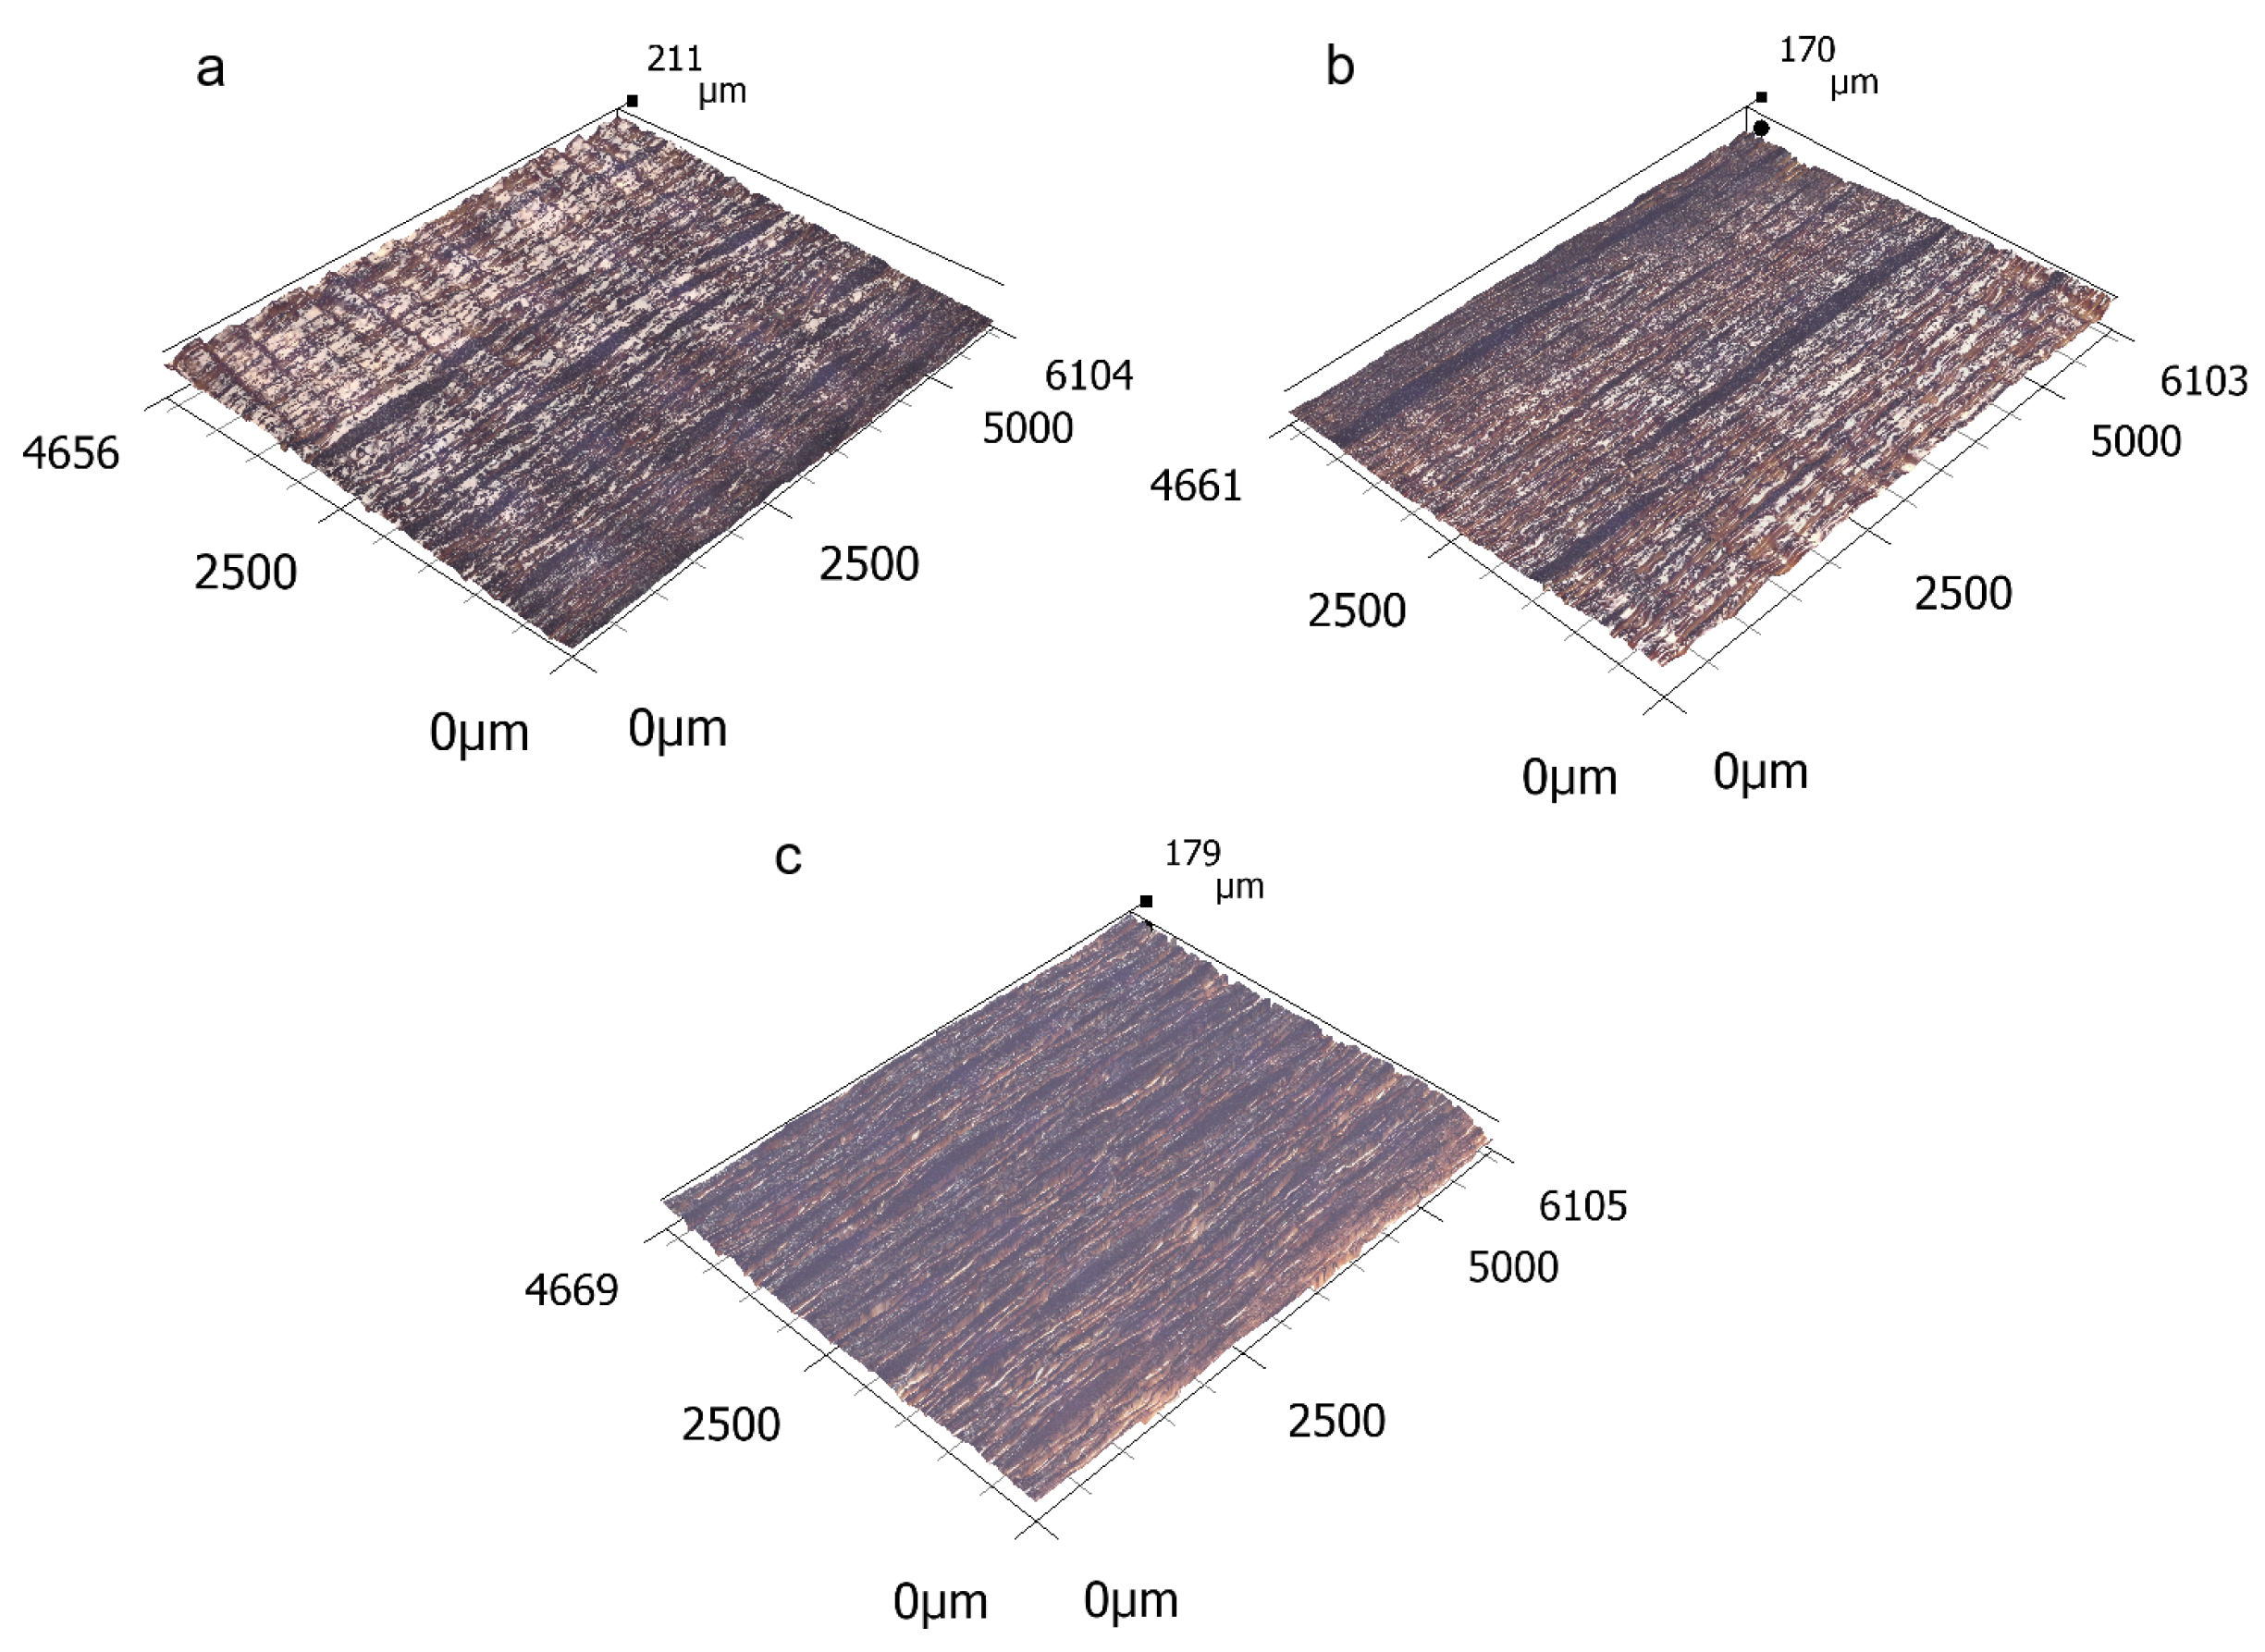
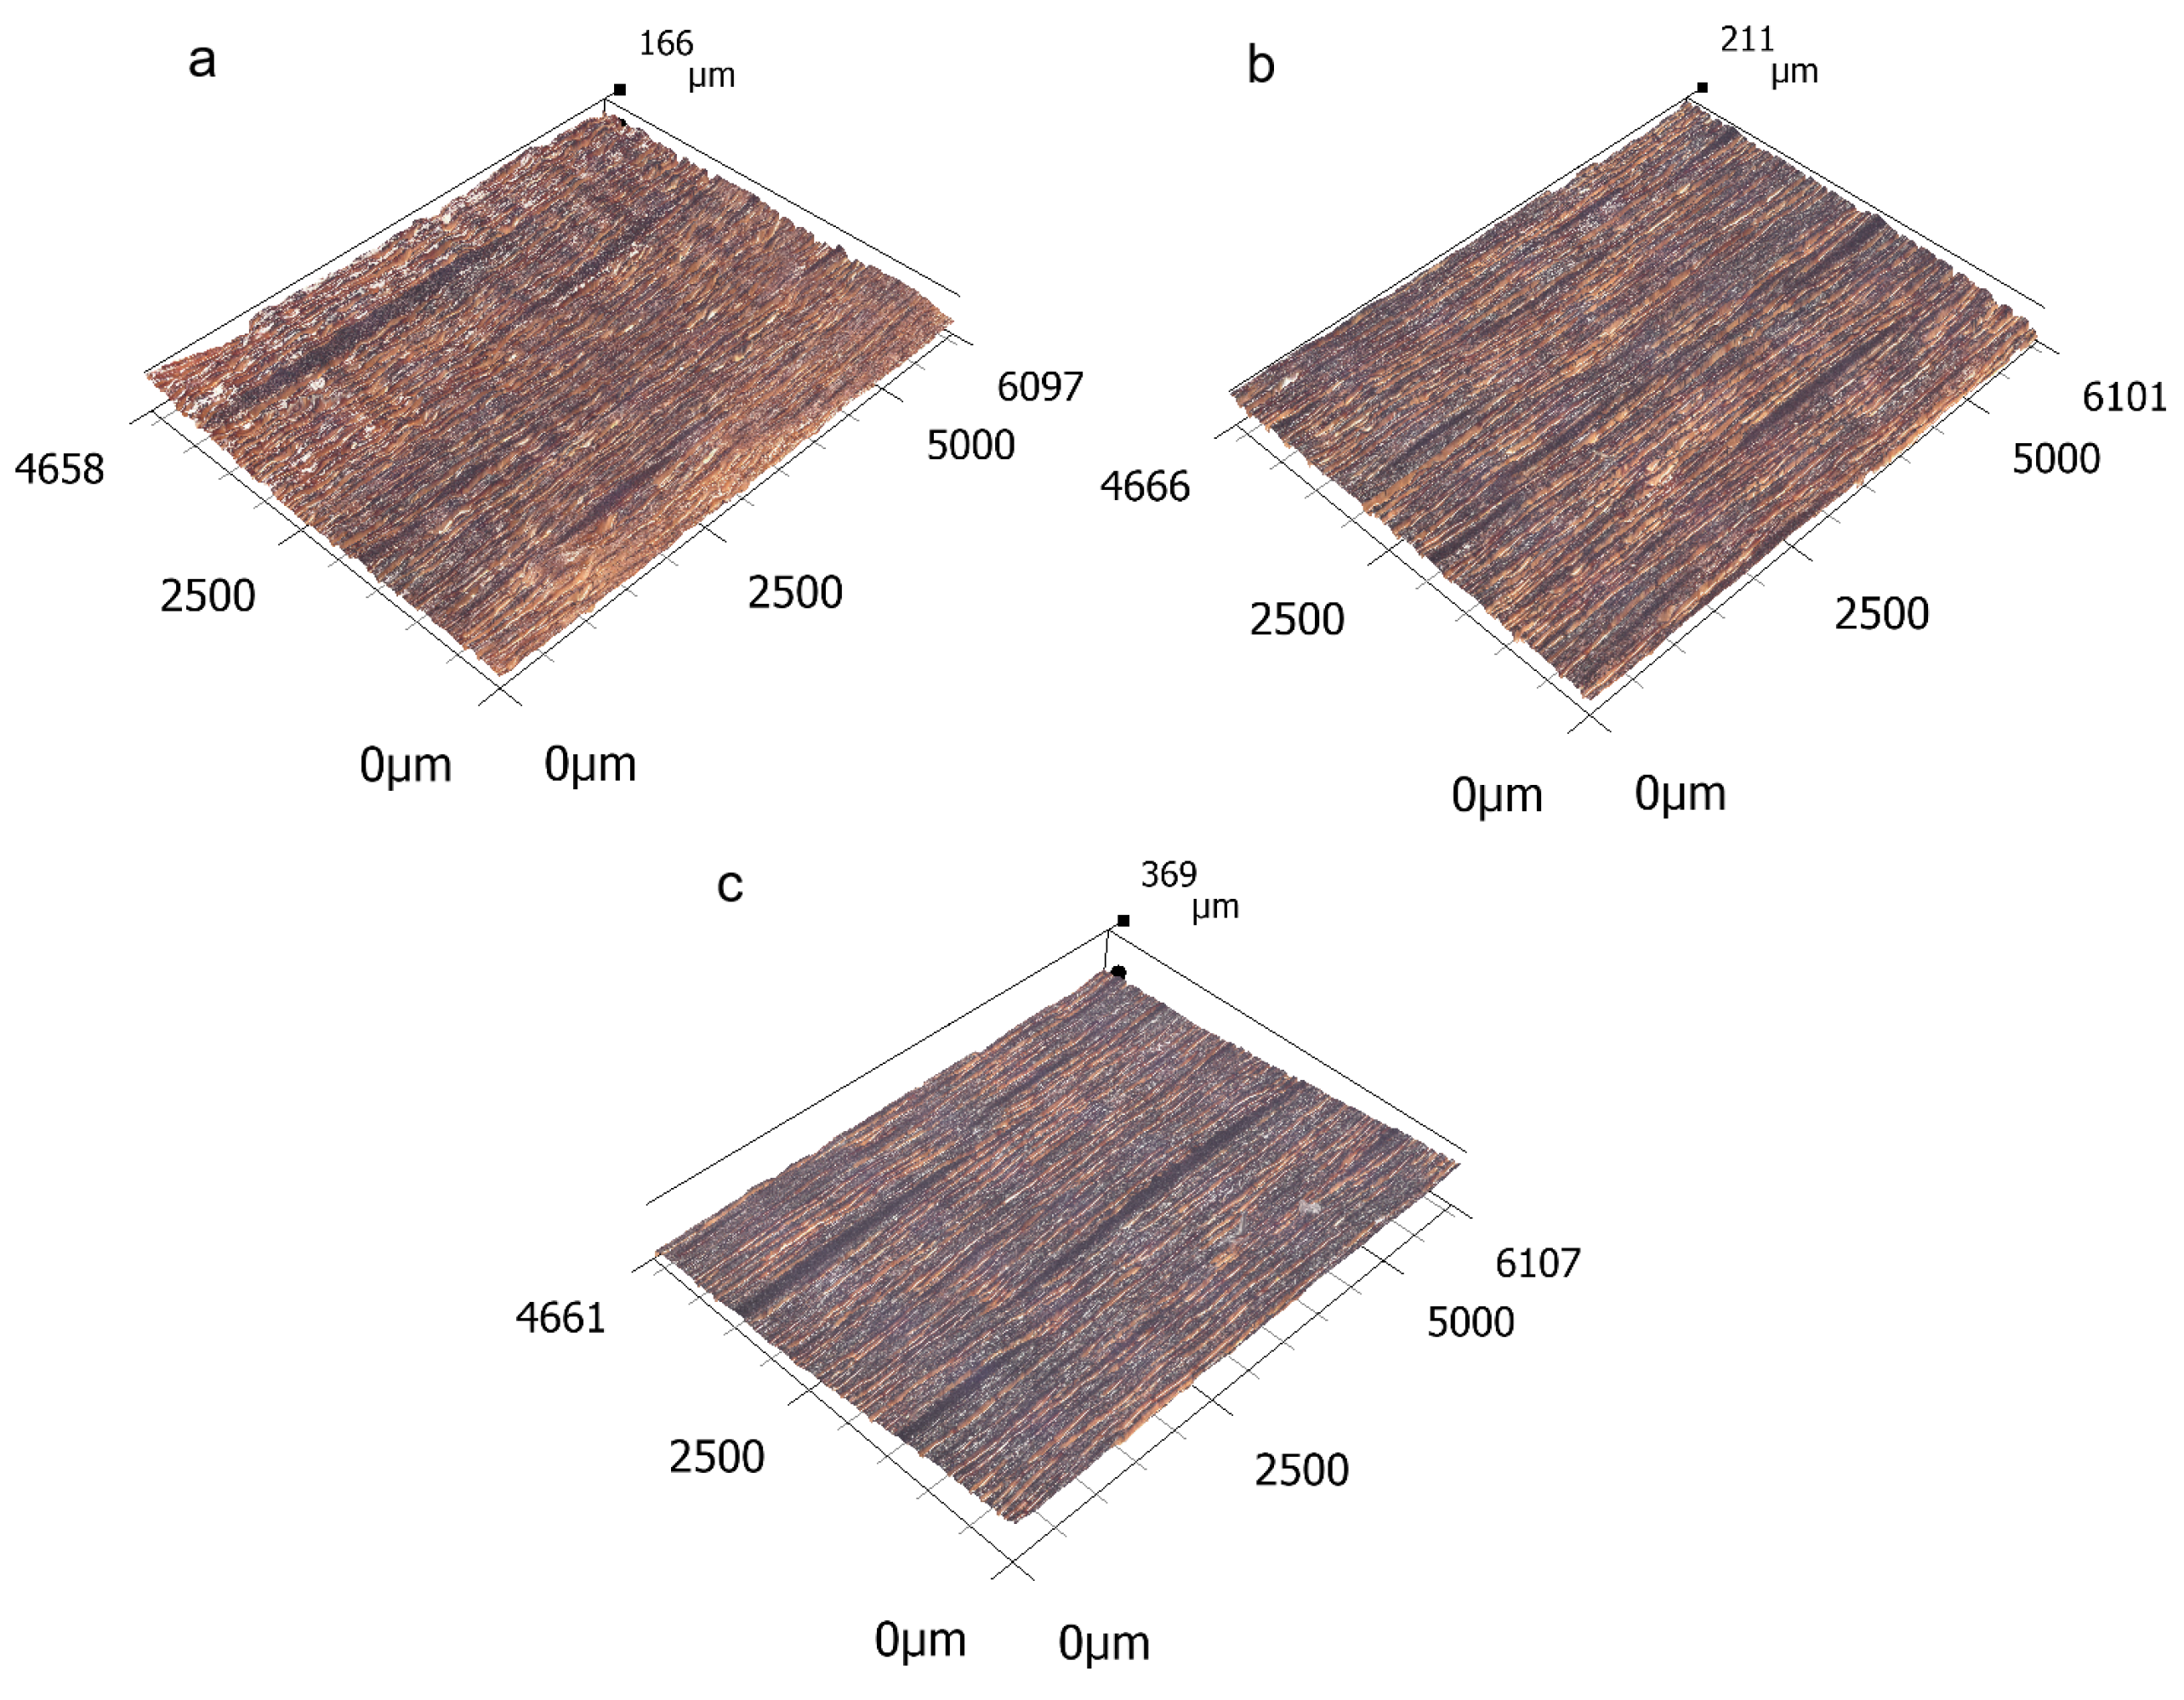
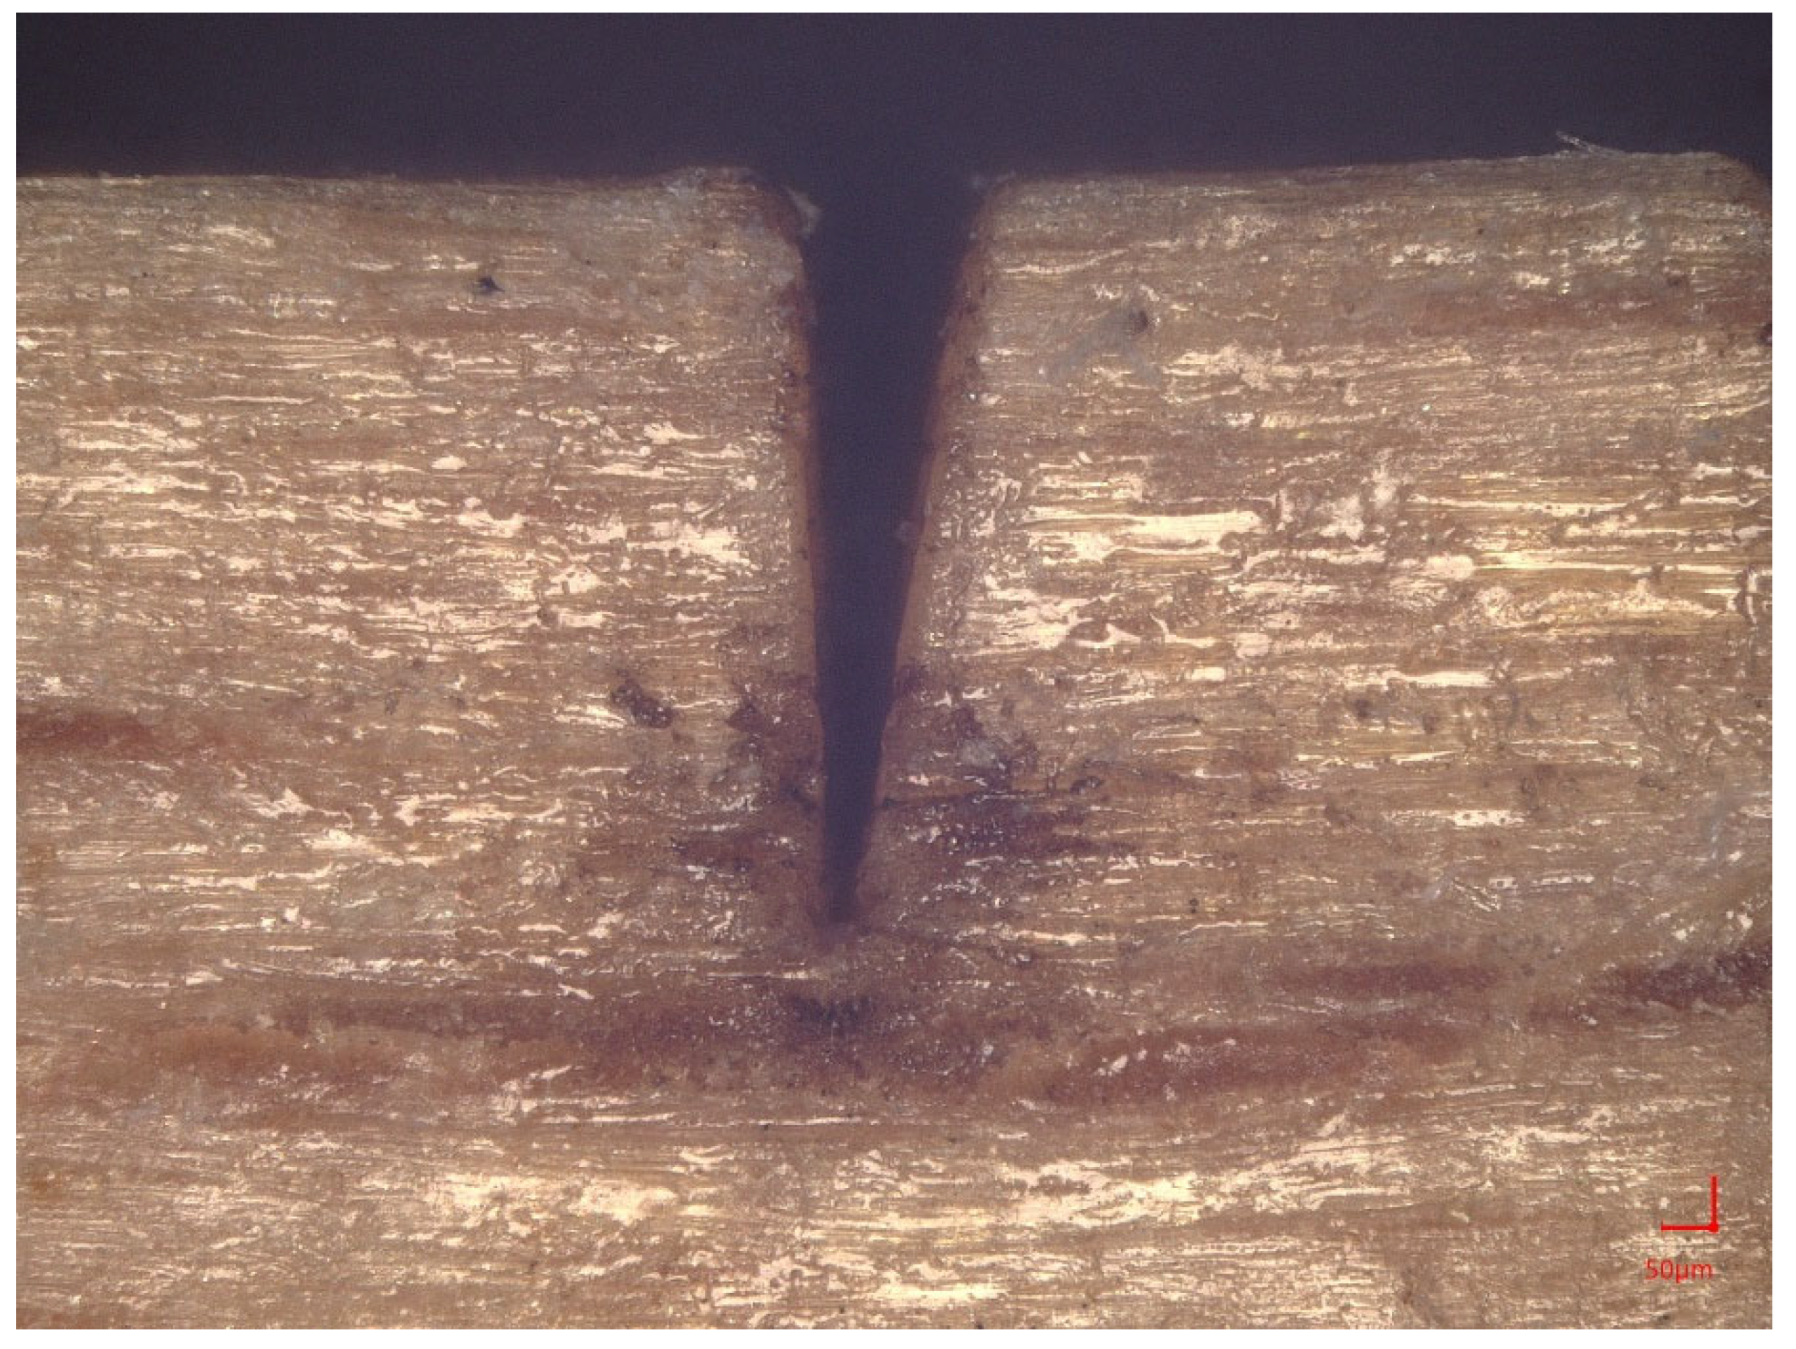
3.1. Microscopic Surface Analysis After Laser Cutting

The first step was to perform a microscopic analysis using the Keyence VHX-7000 digital microscope (Keyence Corporation, Osaka, Japan). From Figure 2, Figure 3 and Figure 4, it is possible to see a greater burning of the wood surface, especially at lower feed speeds (Figure 2c, Figure 3c and Figure 4c), which is in line with other works [21]. This was probably due to the higher dose of radiation. The heat-affected zone was created by the pyrolysis of chemical components in wood, especially lignin and cellulose. The laser beam often leaves a solidified burn on the surface. Figure 2, Figure 3 and Figure 4 further show that fundamental surface unevenness is created mainly by increasing the feed speed. By increasing it, waves (or even stripes) appear on the surface after the laser beam has passed (Figure 2a, Figure 3a and Figure 4a). At high speeds, it does not burn the material enough due to the lower dose of radiation. A possible explanation for the formation of these regular waves may also be the vibrations of the laser head. In [21], these waves should gradually disappear with increasing the feed speed, but in the case of this experiment, they were the largest at the lowest laser power and the highest feed speed. The stripes were on the burnt surface at a certain inclination, which is caused by the action of the gas stream and the removal of some of the energy from the laser beam. From Figure 2, Figure 3 and Figure 4, it can be observed that, with a low laser power (and therefore a low dose of energy) and a high feed speed, this inclination is the greatest (Figure 2a). The explanation may be the greater action of the gas flow at a low energy. With the higher laser power, this slope was almost eliminated, which may have been due to a sufficient dose of energy to cut through the wood (Figure 3a and Figure 4a).
The highest surface irregularities can be seen in Figure 2a, and the lowest irregularities in Figure 2c. Three-dimensional surface analysis in Figure 2b, Figure 3b and Figure 4b confirmed that the increasing the feed speed causes an increase in the surface roughness due to the formation of waves. Waves as surface depressions are the largest at a laser power of 50% (Figure 2). Reducing the feed speed at this laser power caused the irregularities to be reduced to a minimum. At higher laser powers, waves are also produced at the highest feed speed (Figure 3a and Figure 4a). However, as the laser power increases, their depth decreases, and the layer of material from the cut is burned away more completely (Figure 4a). At 75% and 100% laser powers and a low feed speed, groove-like depressions could be observed on the surface. A similar condition of the surface can be found in the research of other authors [16]. Different burned-out grooves could have been created by different effects of high temperature on wood, the density of which fluctuates within one sample. A negative phenomenon at higher laser powers is the formation of cracks. Cracks were possibly formed by the high temperatures of a laser beam, which could create strong stresses inside the wood. If the stresses exceed the strength of the wood, they form cracks. Proof of this hypothesis would be their greater presence in laser power at 100% and a feed speed of 15 mm·s−1, i.e., at the maximum dose of radiation (maximum temperature effect of the laser beam). With a further reduction in the feed speed and an increase in laser power, there is therefore a presumption that the surface irregularities will increase again due to crack formation.

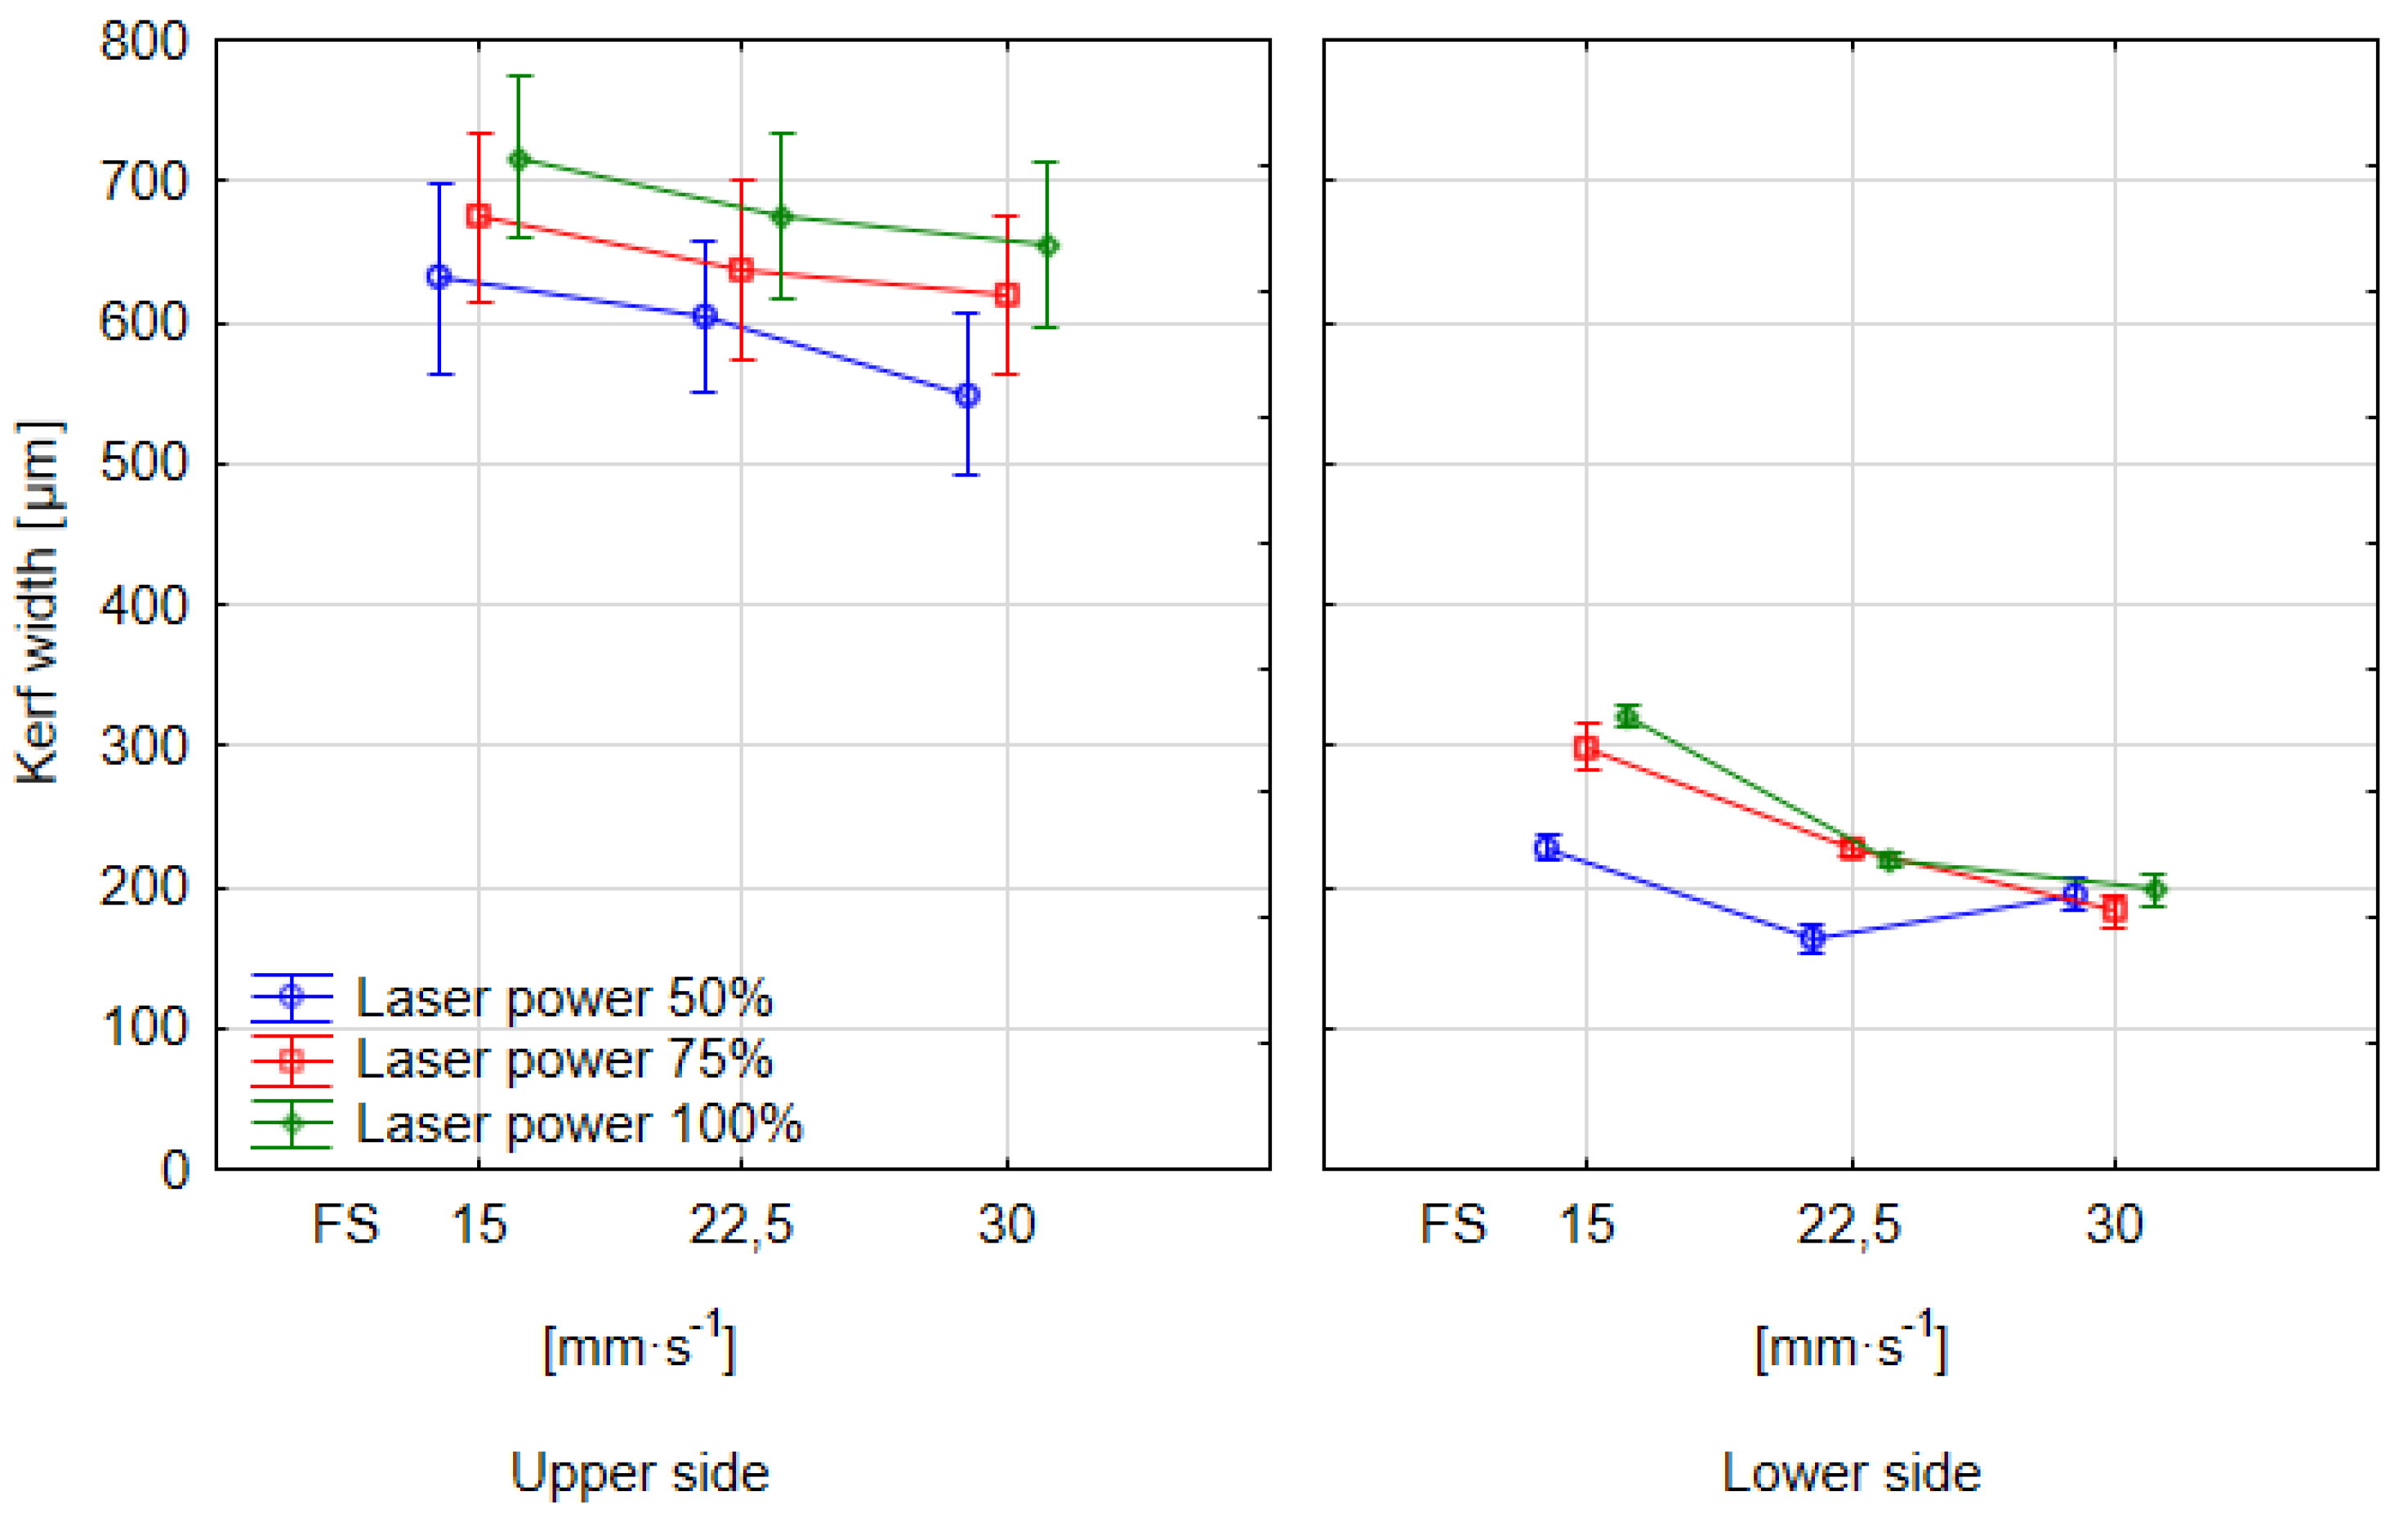
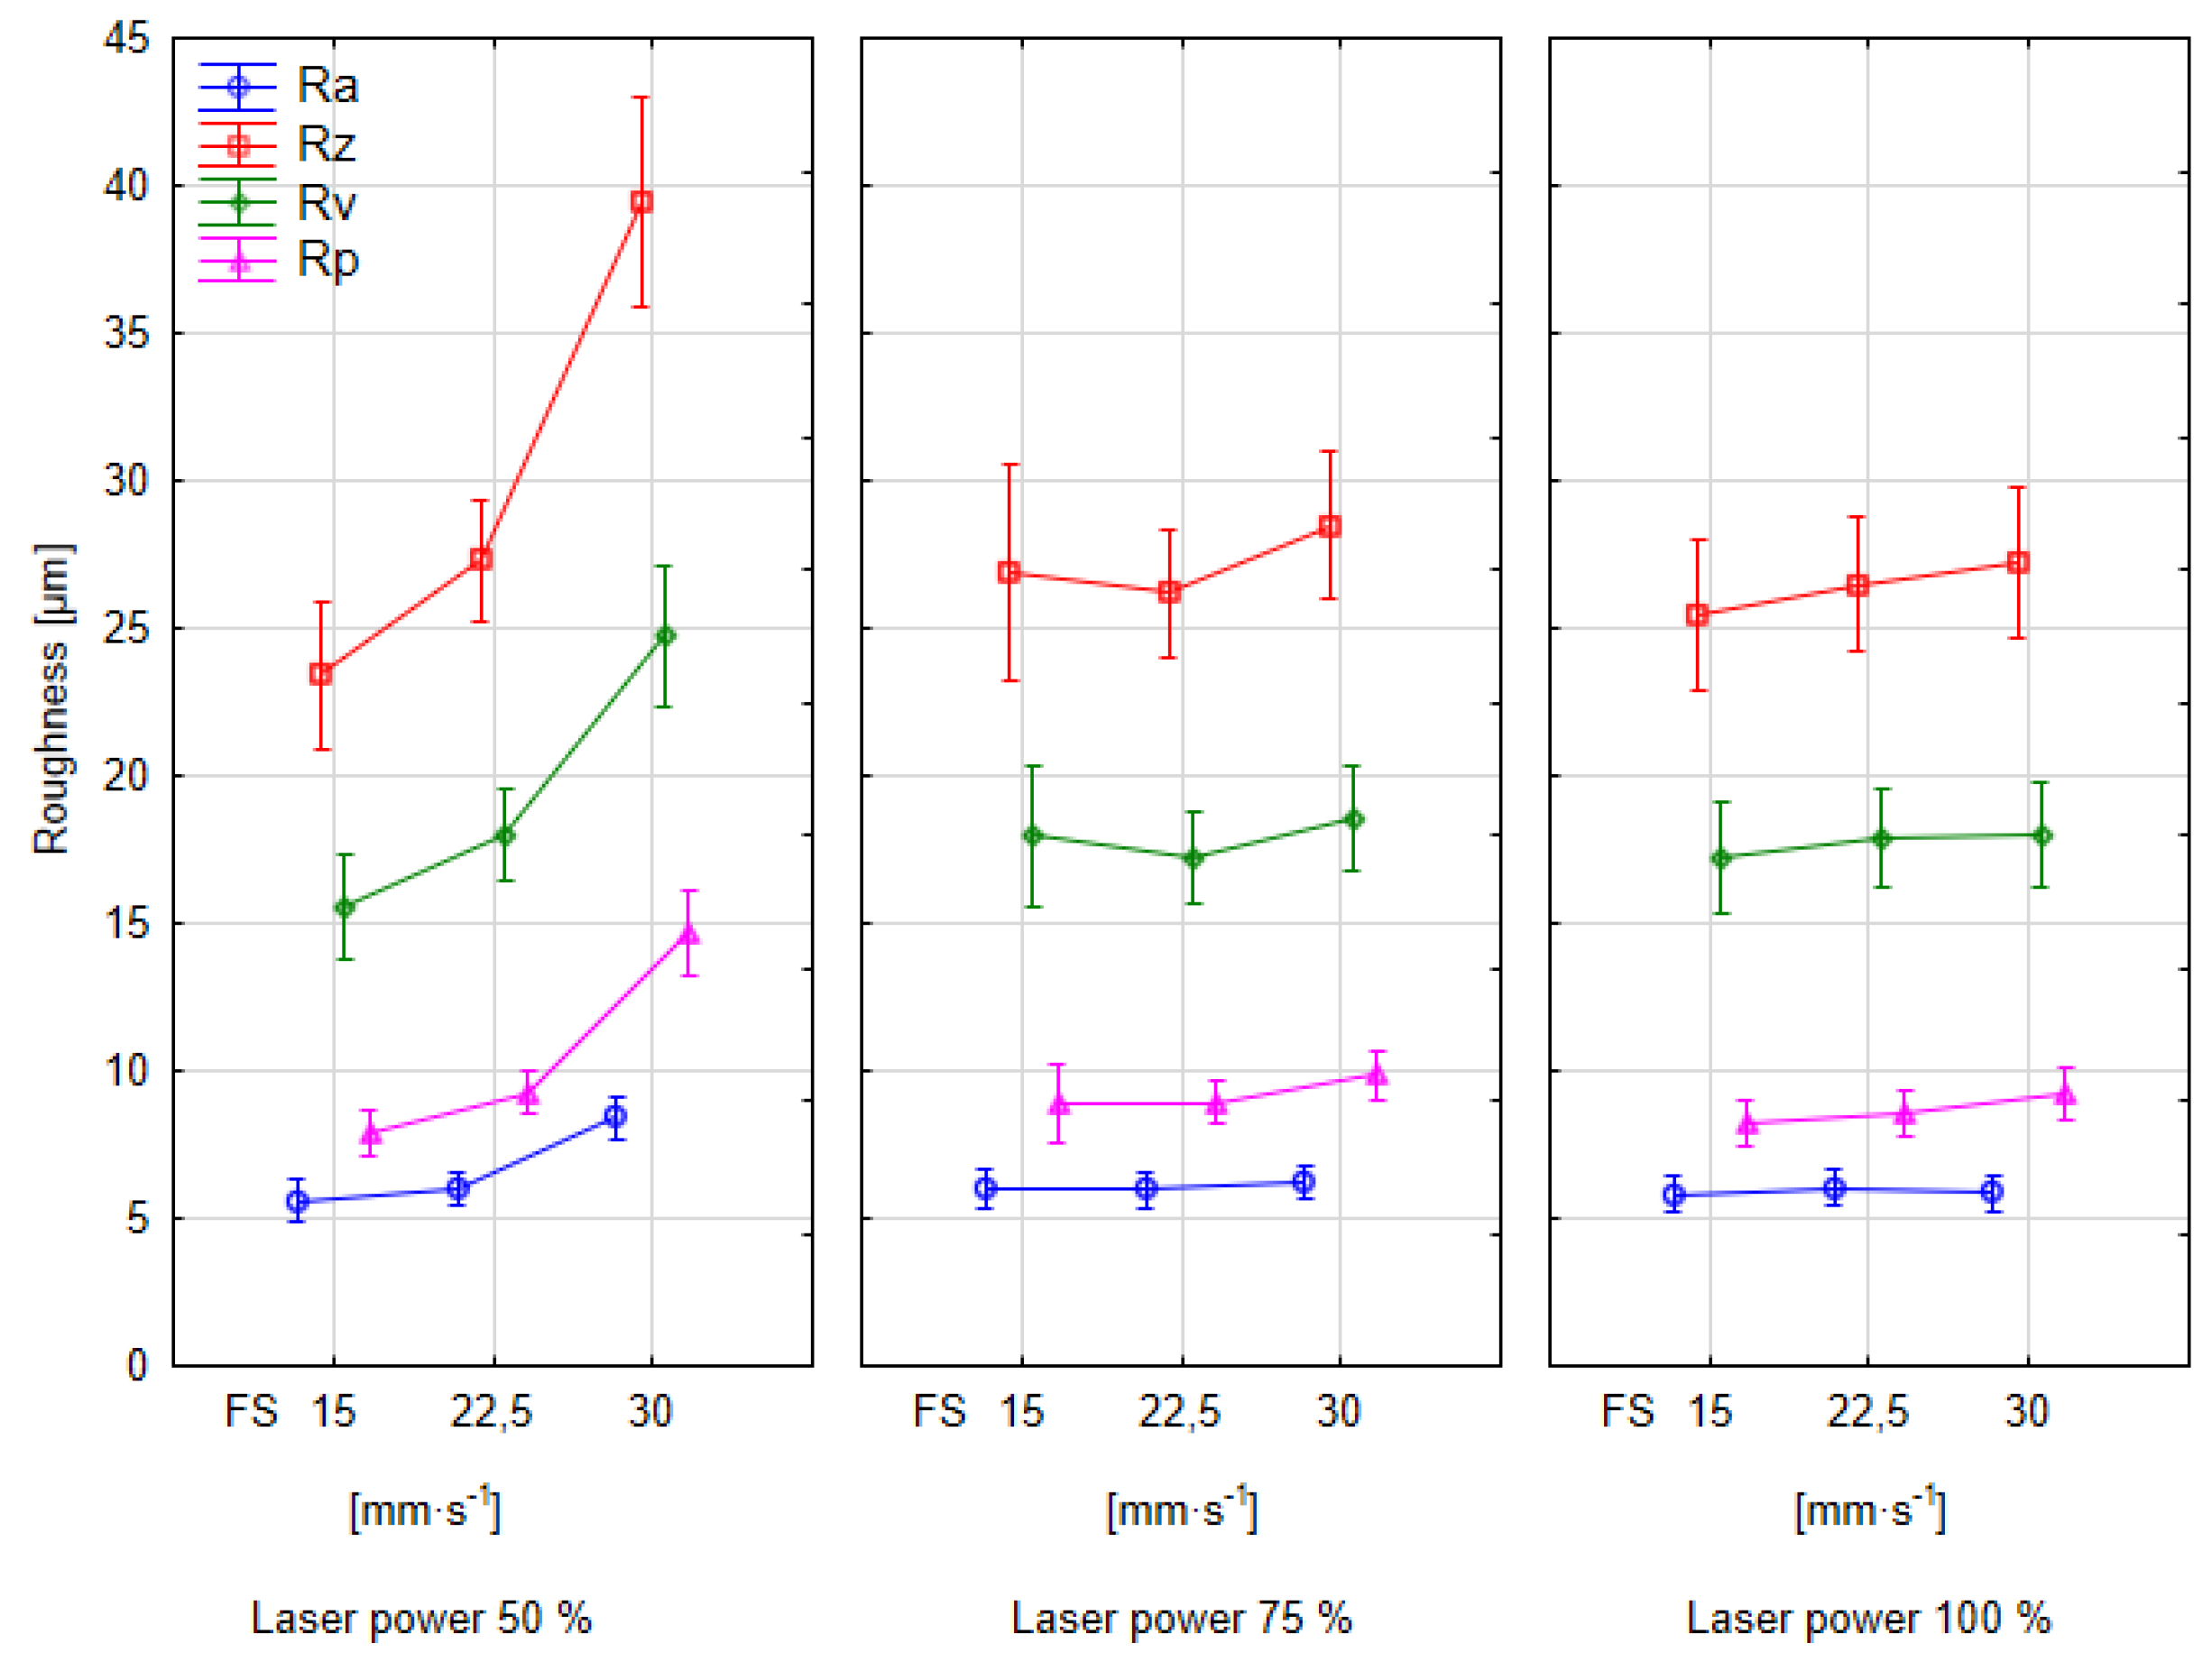
3.2. Measurement of Kerf Width and Surface Roughness

Based on Table 1, it can be argued that the feed speed and laser power of the laser have a statistically significant effect on the measured R-parameters, except for the parameter Rsk. The feed speed as well as the laser power act statistically significantly, both independently and in an interaction. The results of the analysis of variances in Table 2 show that, in the case of the kerf width, these parameters act statistically significantly independently, but not in a mutual interaction. Nevertheless, Duncan’s post hoc test revealed statistically significant changes between some groups. Statistically significant is also the independent influence of the side, i.e., the different kerf width on the upper and lower sides of the sample. This is in line with the theory that the kerf width is a technological parameter dependent on several parameters, such as the cutting speed, laser power, and focal position [26].
A total of 540 measurements of the kerf width and 270 measurements of surface roughness were carried out under the changing technological parameters of laser cutting wood. The measured data show that there is a significant difference in the kerf width between the upper and lower sides (Figure 5). This confirmed the conclusions [21,27] about the conical V-shape of the cutting kerf. The kerf width on the underside was significantly lower, which meant that the material absorbed some of the laser beam energy after thickness. As proof of this claim, a microscopic analysis was carried out on cutting kerfs that did not cut through the beech wood along its entire thickness. From Figure 6, it can then be observed that as the depth of the cutting kerf increases, the kerf width decreases in direct proportion due to the absorption of beam energy.
The analysis of the standard deviation of the kerf width on the upper side showed that the measurements are significantly deviated from each other. This may be mainly due to the passage through denser latewood when the kerf width drops significantly. This would be consistent with the theory [21]. From Figure 5, it can be observed that the kerf width increases with the decreasing feed speed. This is due to the delivery of more energy to the surface of the wood per unit of time, which also causes more material to burn and therefore widen the cutting kerf. On the lower side, the kerf width decreased with increasing feed speed (Figure 5), which was also confirmed by [28]. As the laser power increased, the kerf widened, again demonstrating the greater amount of energy supplied to the cut per unit of time. Similar conclusions were reached by [2,28,29]. If we proceed from the calculation of the energy supplied per 1 mm length of the cutting kerf from work [13], then, at the specified technological parameters, the amount of energy supplied correlates with the kerf width with the value of R2 = 0.88 on the upper side and R2 = 0.82 on the lower side.
Surface roughness also shows changes in changing technological parameters. With an increase in the feed speed, the roughness of the surface increases, which is consistent with the theory [20]. On the other hand, statistically insignificant changes at changing feed speeds were measured by the authors [15,16]. In the work of [30], the authors came to the opposite conclusion. The authors measured that with an increase in the feed speed, there is a decrease in surface roughness because the laser beam caused the greatest wood burning at the lowest speed. In the case of this experiment, the obvious cause could be the insufficient burning of the material in the cutting kerf. At the lowest feed speed, the amount of energy delivered to the area was greater. This caused a perfect combustion of the wood and its particles in the vicinity of the laser beam. However, at higher speeds, the laser beam left significant waves after passing through, which was probably caused by insufficient wood burning. This was also confirmed by microscopic analysis (Figure 2, Figure 3 and Figure 4). With longer exposure to the laser, melts formed from chemical components of wood, especially lignin, were burned. At the same time, the slower-moving laser created a more uniform surface without waves than traces of laser passage.
With the change in laser power, there were statistically significant changes in R-parameters, but their development varied (Figure 7). Increasing the feed speed generally leads to higher surface roughness values (Ra, Rz, Rp) across all laser power levels. The lowest laser power (50%) resulted in the most significant increase in surface roughness with an increasing feed speed. Higher laser powers (75% and 100%) provided more stable surface roughness characteristics across the tested range of feed speeds, with less sensitivity to changes in the feed speed. The trend for the Rv parameter is less consistent across the different power levels and feed speeds compared to the other roughness parameters. According to Figure 7, the feed speed plays a crucial role in determining the surface finish during the CO2 laser processing. At the lowest power setting, the increase in Ra, Rz, and Rp with feed speed appears to be the most significant. Rv shows a notable increase from 15 to 30 mm·s−1. At the 75% laser power, the increase in Ra, Rz, and Rp with feed speed is less pronounced compared to the 50% laser power. Rv shows a slight increase from 15 to 22.5 mm·s−1. At the highest laser power setting, the trends for Ra, Rz, and Rp show the least sensitivity to changes in the feed speed within the tested range. The values remain relatively stable as the feed speed increases.
The results of the research by other authors show that the surface roughness increases with increasing laser power [30]. The results can be supported by the research of [31], who measured the correlation between the amount of energy delivered and the roughness of the surface in the case of beech wood veneer. As the amount of energy increased, the surface roughness increased. According to the studies of [2,32], a higher laser power creates a more uniform surface, with lower roughness. Like a low feed speed, with a higher laser power, the amount of energy delivered from the laser is higher. This again causes the wood to burn better and create a smoother surface.

3.3. Optimisation of Selected CO2 Laser Parameters

After analysing the data from ANOVA, polynomial regression models of the second degree were created from the measured data for the upper and lower sides of the cutting kerf. Both models are statistically significant (p = 0.000) at the significance level of α = 5%. The model describes the development of the kerf width on the upper side with an accuracy of 98.01% and on the lower side with an accuracy of 95.95%. In both cases, it was proven that the development of the kerf width is most affected by the feed speed. The theory in this case is confirmed by the magnitude of the regression coefficients for the feed speed in Equations (1) and (2). At the same time, the equations show an inverse proportionality between the kerf width and the feed speed and a direct proportionality between the kerf width and the laser power. Figure 8 shows that the development of the kerf width at the same CO2 laser parameters is different on the upper side and lower side of the sample. While on the upper side, the growth of the kerf width is close to linear growth, on the lower side, the absorption of radiation has caused a significant reduction in the kerf width. By comparison of both graphs in Figure 8, it can be argued that the lower dose of energy was delivered, especially when combining higher laser power and high feed speed. In both cases, the largest kerf width was measured at a low feed speed and the highest laser power, which also corresponds to the highest energy delivered per unit area (9 J·mm−1). This is consistent with the theory [18,22,33]. The lowest kerf width was measured at the lowest laser power and the highest feed speed, which also corresponds to the lowest amount of energy delivered per 1 mm of the kerf length (2.25 J·mm−1).
WKU = 631.180 − 8.111vf + 2.285P + 0.037vf2 − 0.008P2 + 0.027vfP
WKL = 247.168 − 24.706vf + 7.317P + 0.613vf2 − 0.024P2 − 0.119vfP
  • vf = Feed speed [mm·s−1].
  • P = Laser power [W].
Polynomial regression models of the second degree were also created for the development of roughness parameters Ra and Rz. Both models are statistically significant (p = 0.000) at the significance level of α = 5%. Polynomial models represented the most suitable method by which it was possible to capture the nonlinear development of roughness concerning the selected technological parameters. Equations (3) and (4) show that the feed speed regression coefficients carry more weight than the power coefficients. Thus, the change in feed speed affected the roughness of the surface more than the change in laser power. This is consistent with the findings from microscopic analysis. At the same time, both Ra and Rz have a direct proportionality between the surface roughness and the feed speed, as well as a direct proportionality between the surface roughness and the laser power. This is in line with the findings of other authors [34]. The polynomial regression model describes the development of Ra with precision R2 = 0.8271 and Rz development with precision R2 = 0.8544. From the research of [34], it follows that higher roughness after laser cutting can be measured at a low laser power and high feed speed. On the other hand, low roughness can be measured at a high laser power and lower feed speed. From Figure 9, it can be concluded that the roughness defined by the parameters Ra and Rz is highest at the highest feed speed and low laser power, which follows the study of [34]. According to the works of other authors, a possible explanation for the higher roughness at a higher feed speed is an increase in vibration [35]. At the same time, Figure 9 shows that Ra and Rz rise sharply with the increasing feed speed. The reason for this is the formation of deep waves after the passage of the laser beam, which is shown by microscopic analysis in Figure 2, Figure 3 and Figure 4. The waves also significantly increased the values of the Rp and Rv parameters, which are the highest in this combination of laser power and feed speed (Figure 7). Logically, the Rz parameter was also increased, so the total height of roughness due to waves increased. The lowest roughness was created at the lowest laser power and the lowest feed speed. Microscopic analysis showed that these surfaces were more burned by the action of the laser beam, which burned the wood more evenly than the material and removed the waves. In this case, the amplitude parameters Rp, Rv, and Rz also decreased (Figure 7. At the same time, the models for Ra and Rz show that at the lowest feed speed, the surface roughness increases again as the laser power increases. This is due to microcracks on the cut surface, which can be observed in Figure 3 and Figure 4. Based on these models, it is possible to determine the optimal values of laser power and feed speed regarding the roughness of the created surface.
Ra = 4.386 + 0.069vf + 0.012P + 0.006vf2 + 0.000P2 − 0.004vfP
Rz = 17.554 + 0.193vf + 0.101P + 0.036vf2 + 0.002P2 − 0.019vfP
Figure 10 shows the height map of surfaces cut with a CO2 laser at the most optimal and least optimal values of laser power and feed speed according to the created polynomial regression models. As follows from the regression model as well as from the microscopic analysis, at the least optimal values, the laser beam created significant waves on the surface over the entire cut area. With the decrease in this feed speed, the extent of wave formation also decreased, but these were not completely removed. At the same time, by optimising the technological parameters of the CO2 laser, the number of cracks on the surface decreased. Figure 10 shows that the red zone in the graph of the regression model (Figure 9) is characterised by waves on the surface and a significantly uneven surface. The dark-green zone is a less-burnt surface, without waves after the laser beam has passed, and without microcracks that have disturbed the surface.

4. Conclusions

Surface roughness and kerf width were measured at all combinations of laser power and feed speed, and the results were supported by microscopic surface analysis. The following findings result from the experiment:
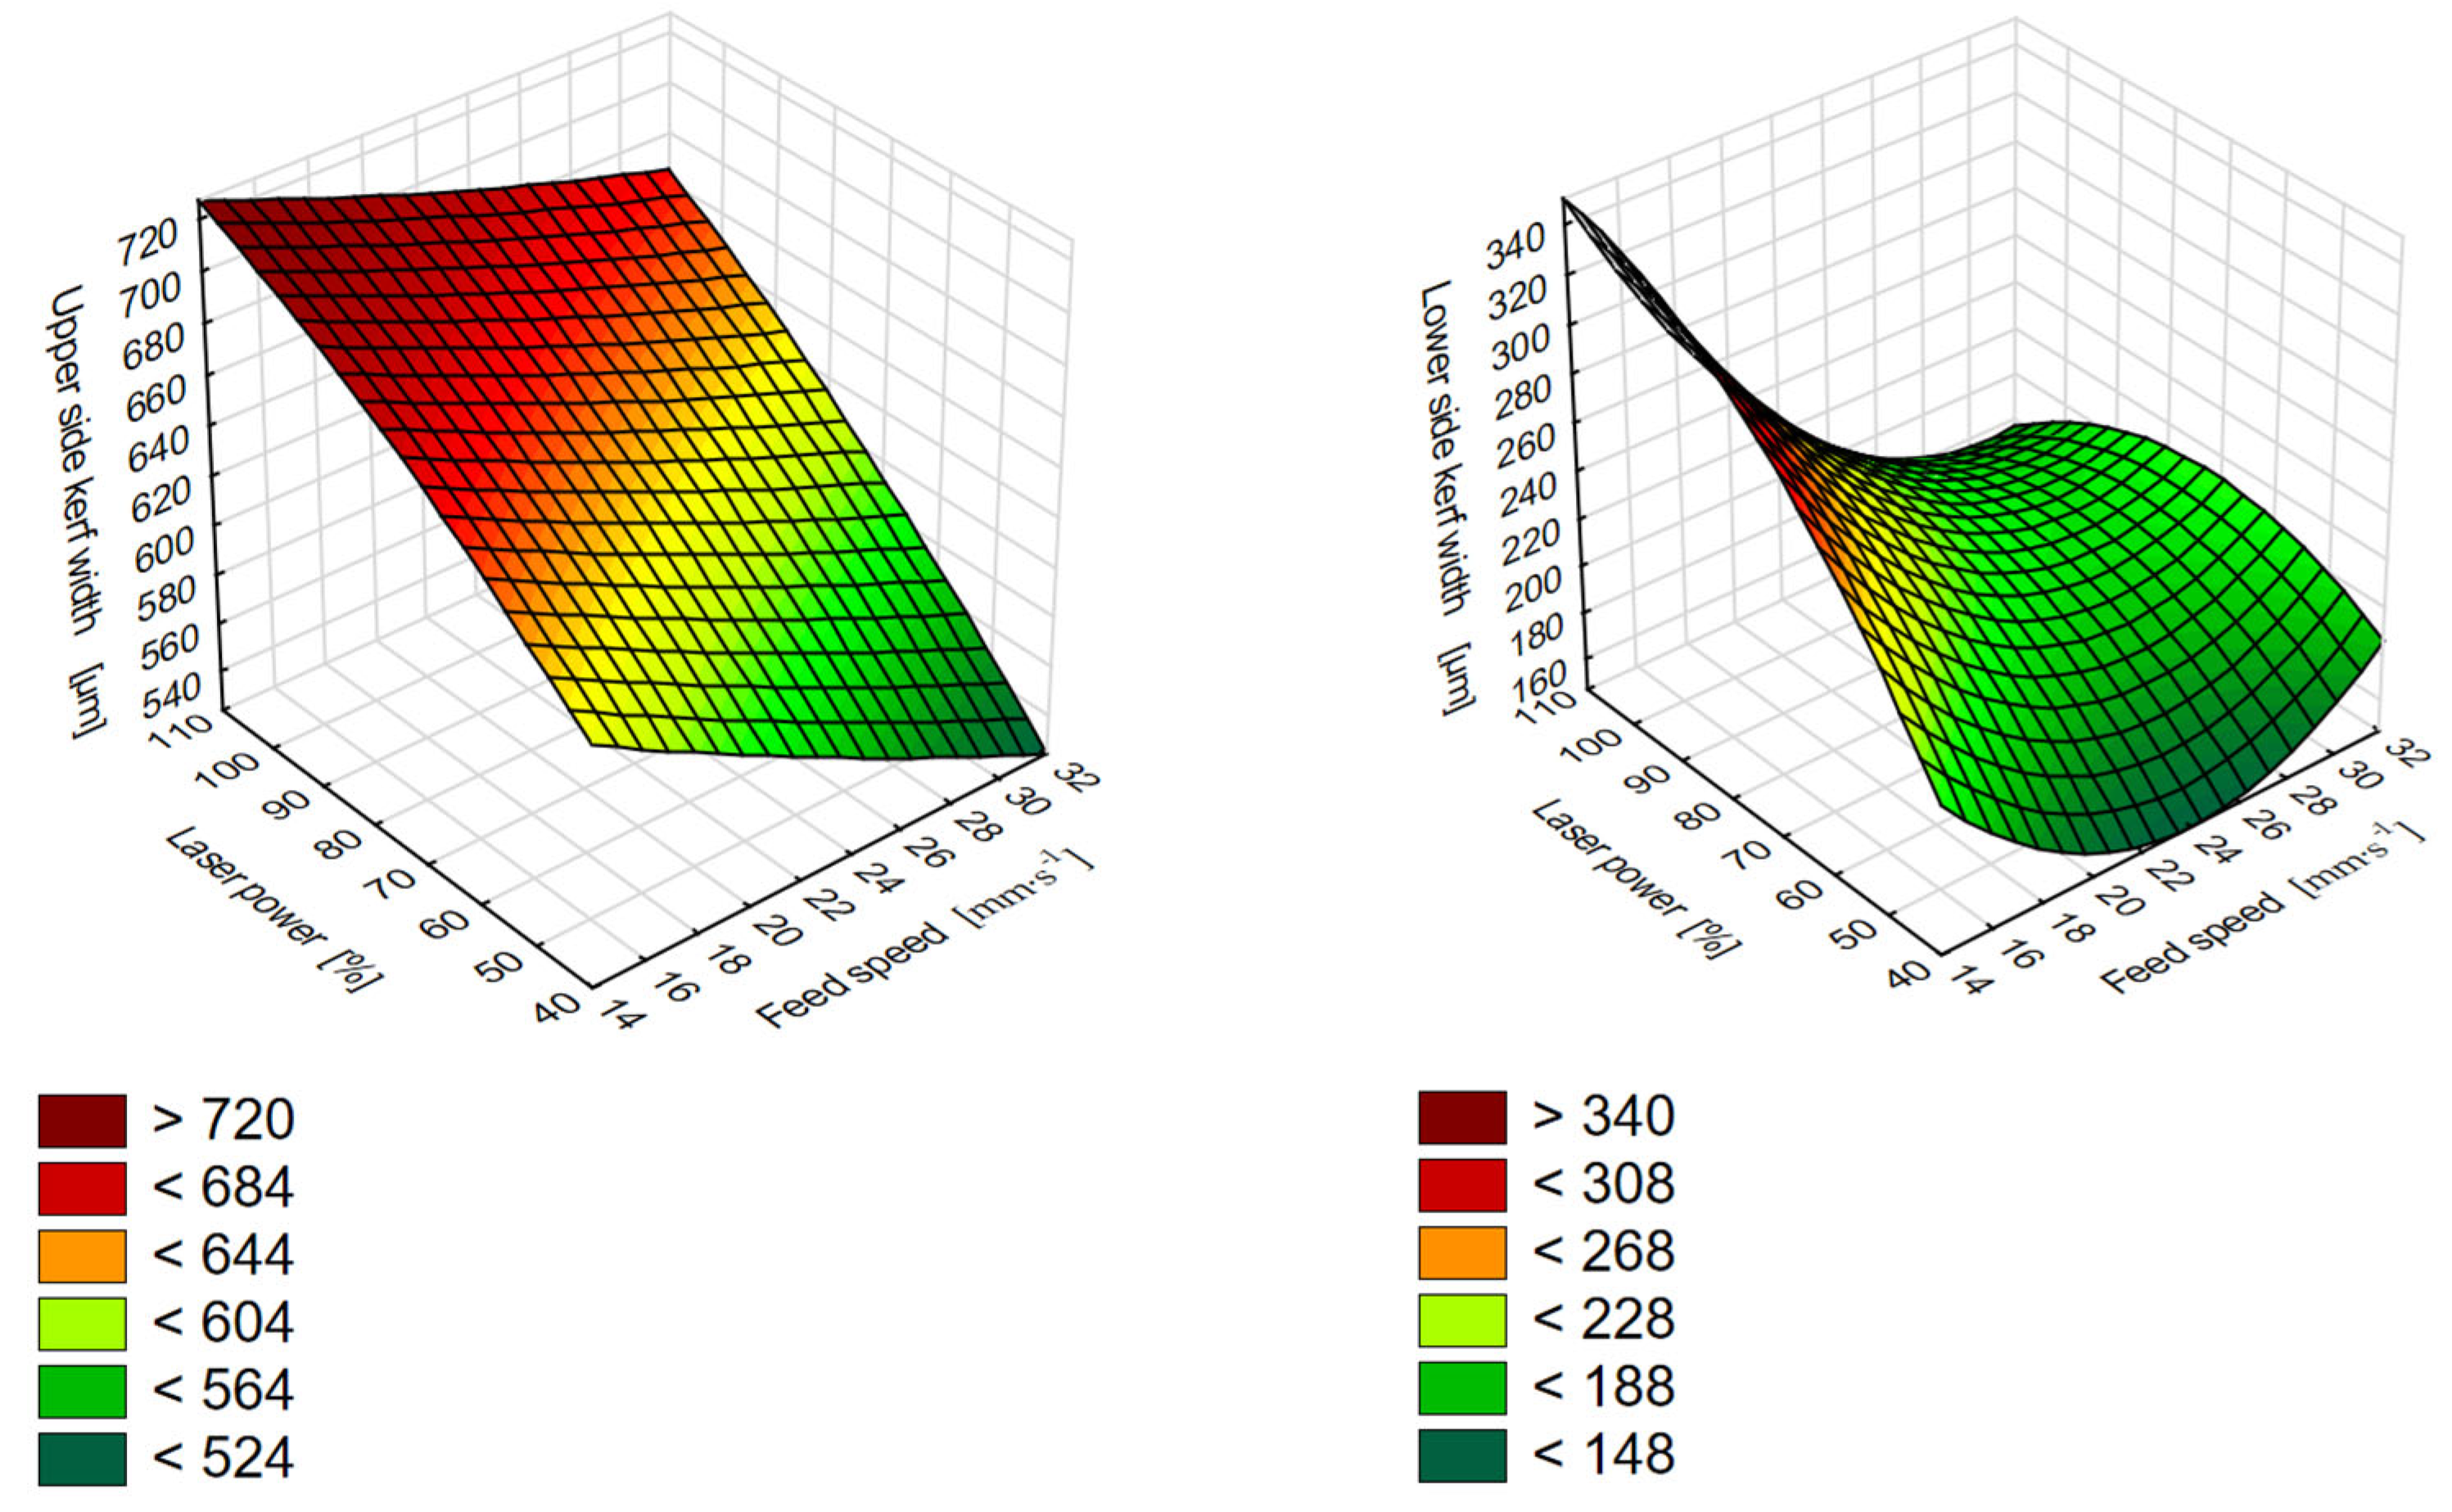
  • The kerf width on the upper and lower sides increases as the laser power increases: The kerf width increases with a higher laser power and higher feed speed on the upper side. The reason was the higher dose of energy delivered to the surface of the wood by the laser beam. This caused more significant burning of the wood. These results were also measured on the lower side. The measured results also show that the kerf width on the lower side is significantly smaller than on the upper side. The reason was the absorption of the laser beam energy by the wood itself.
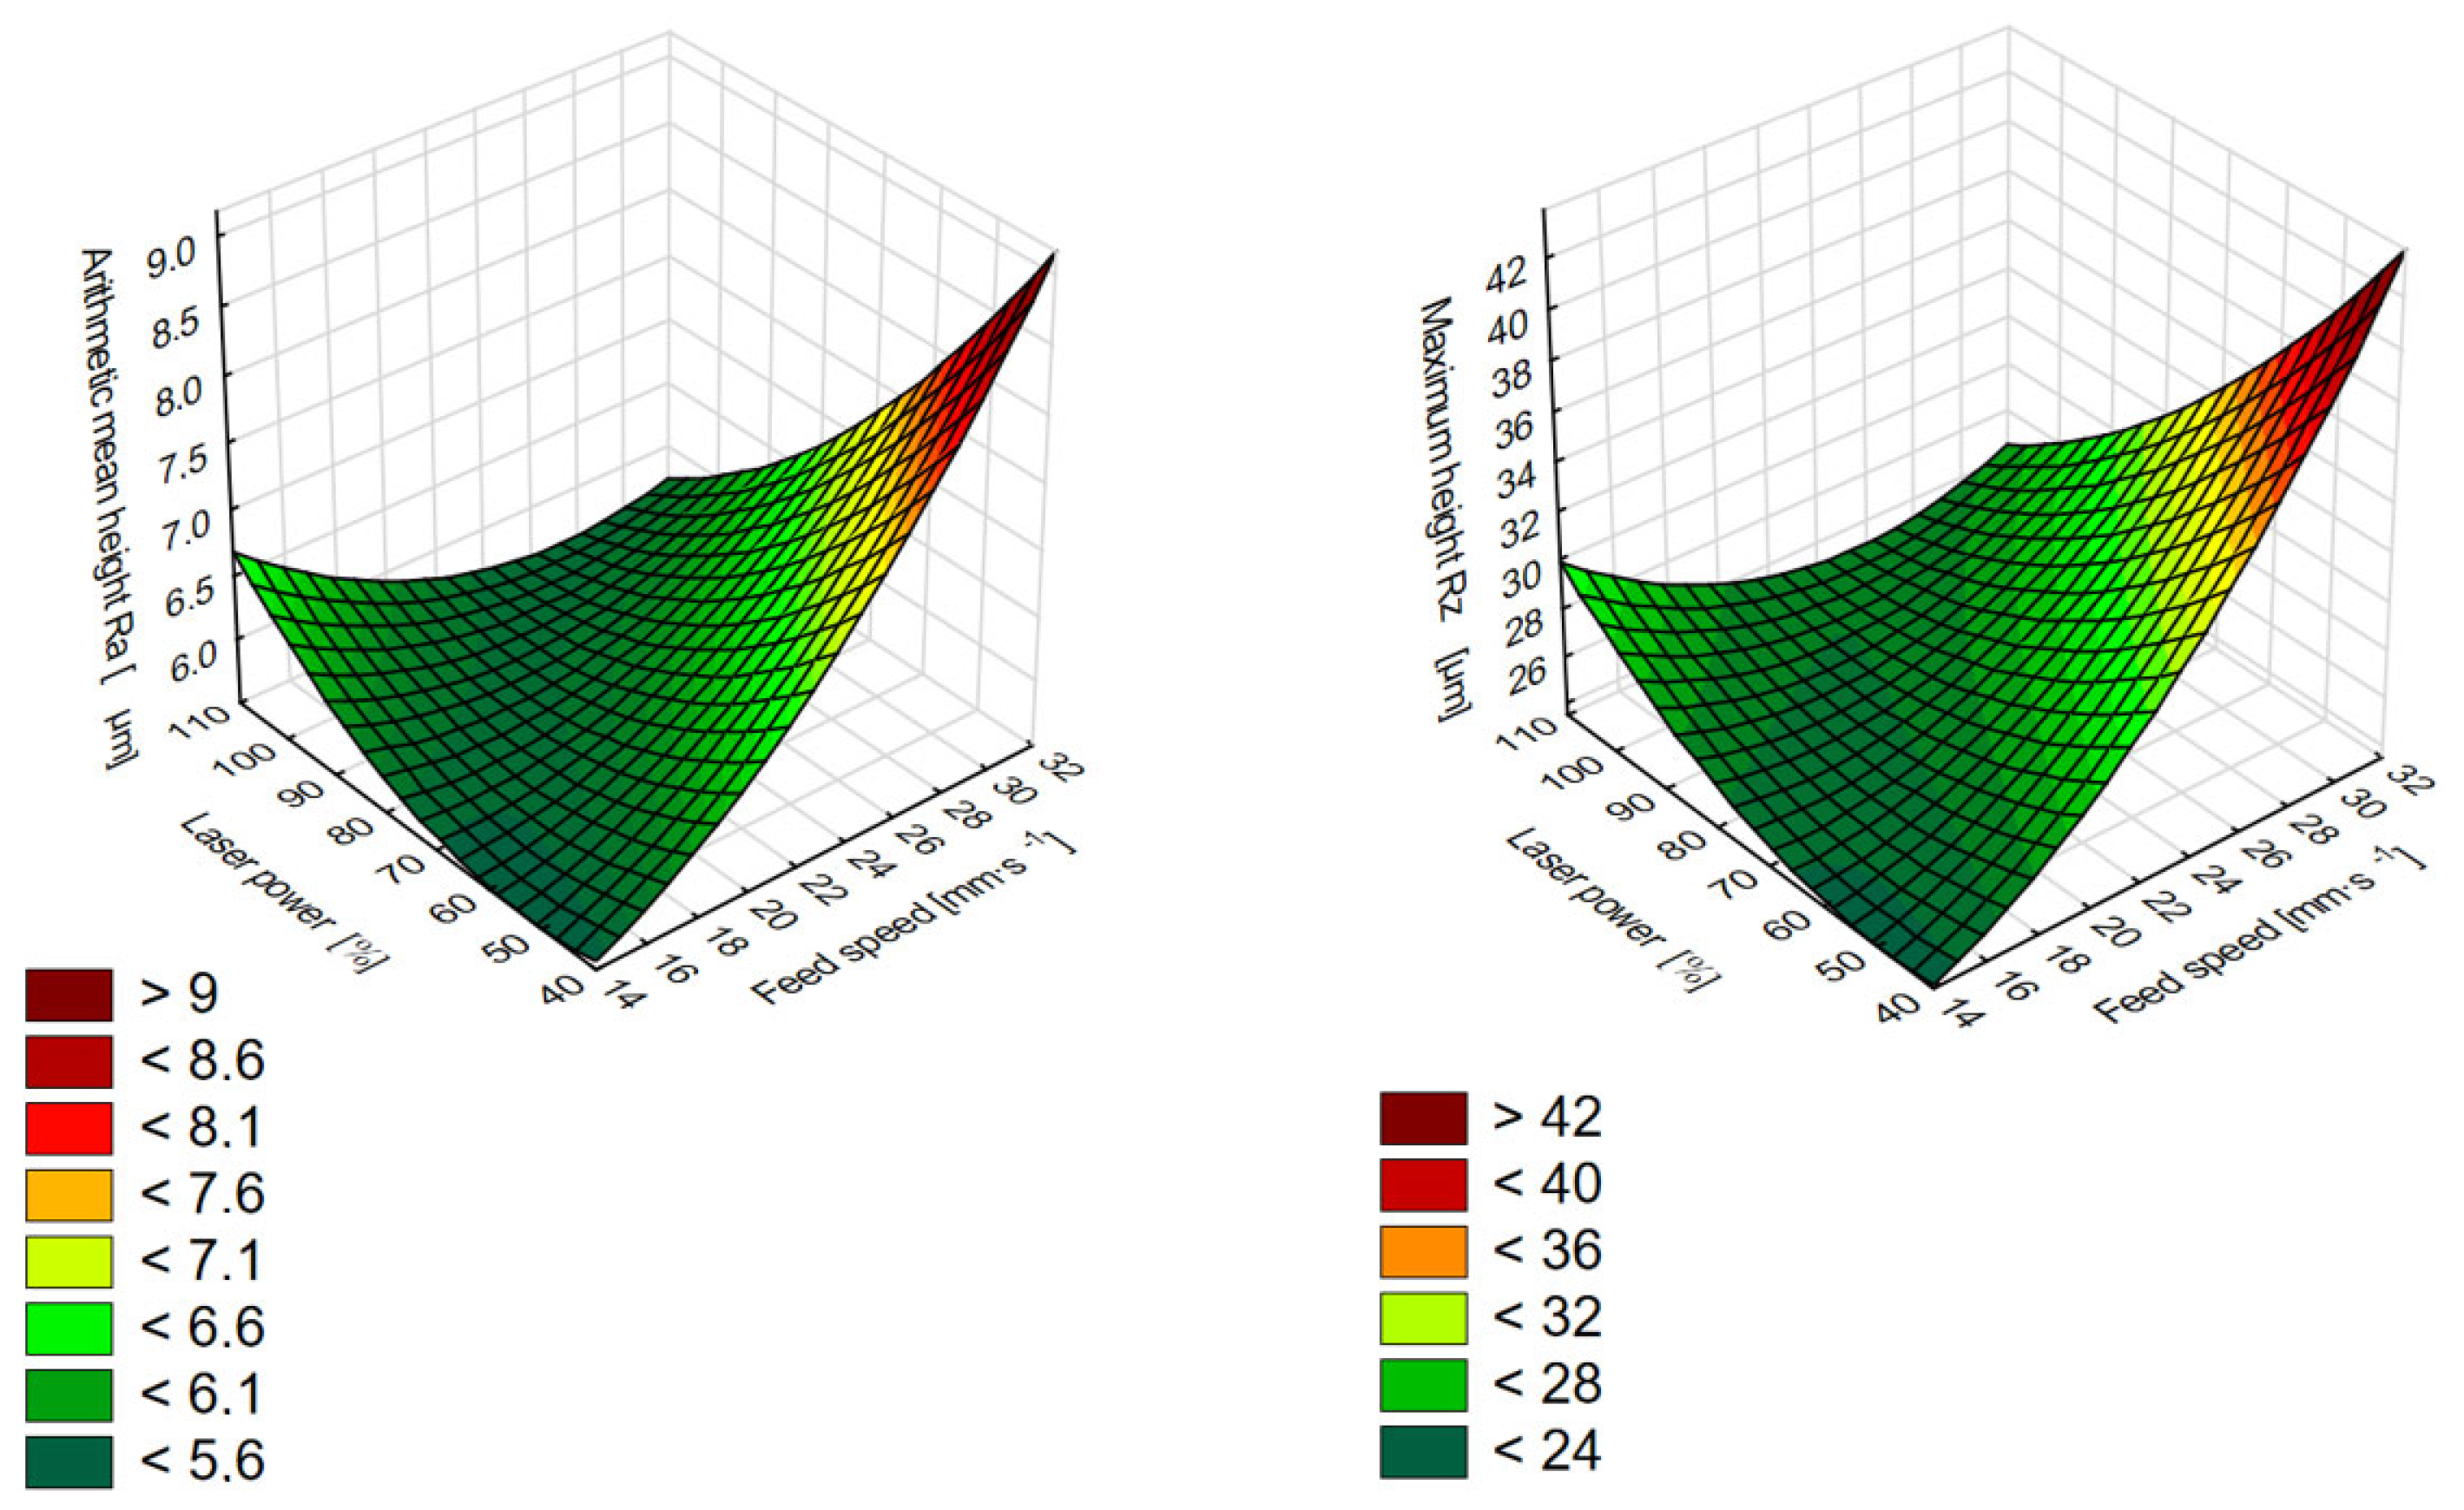
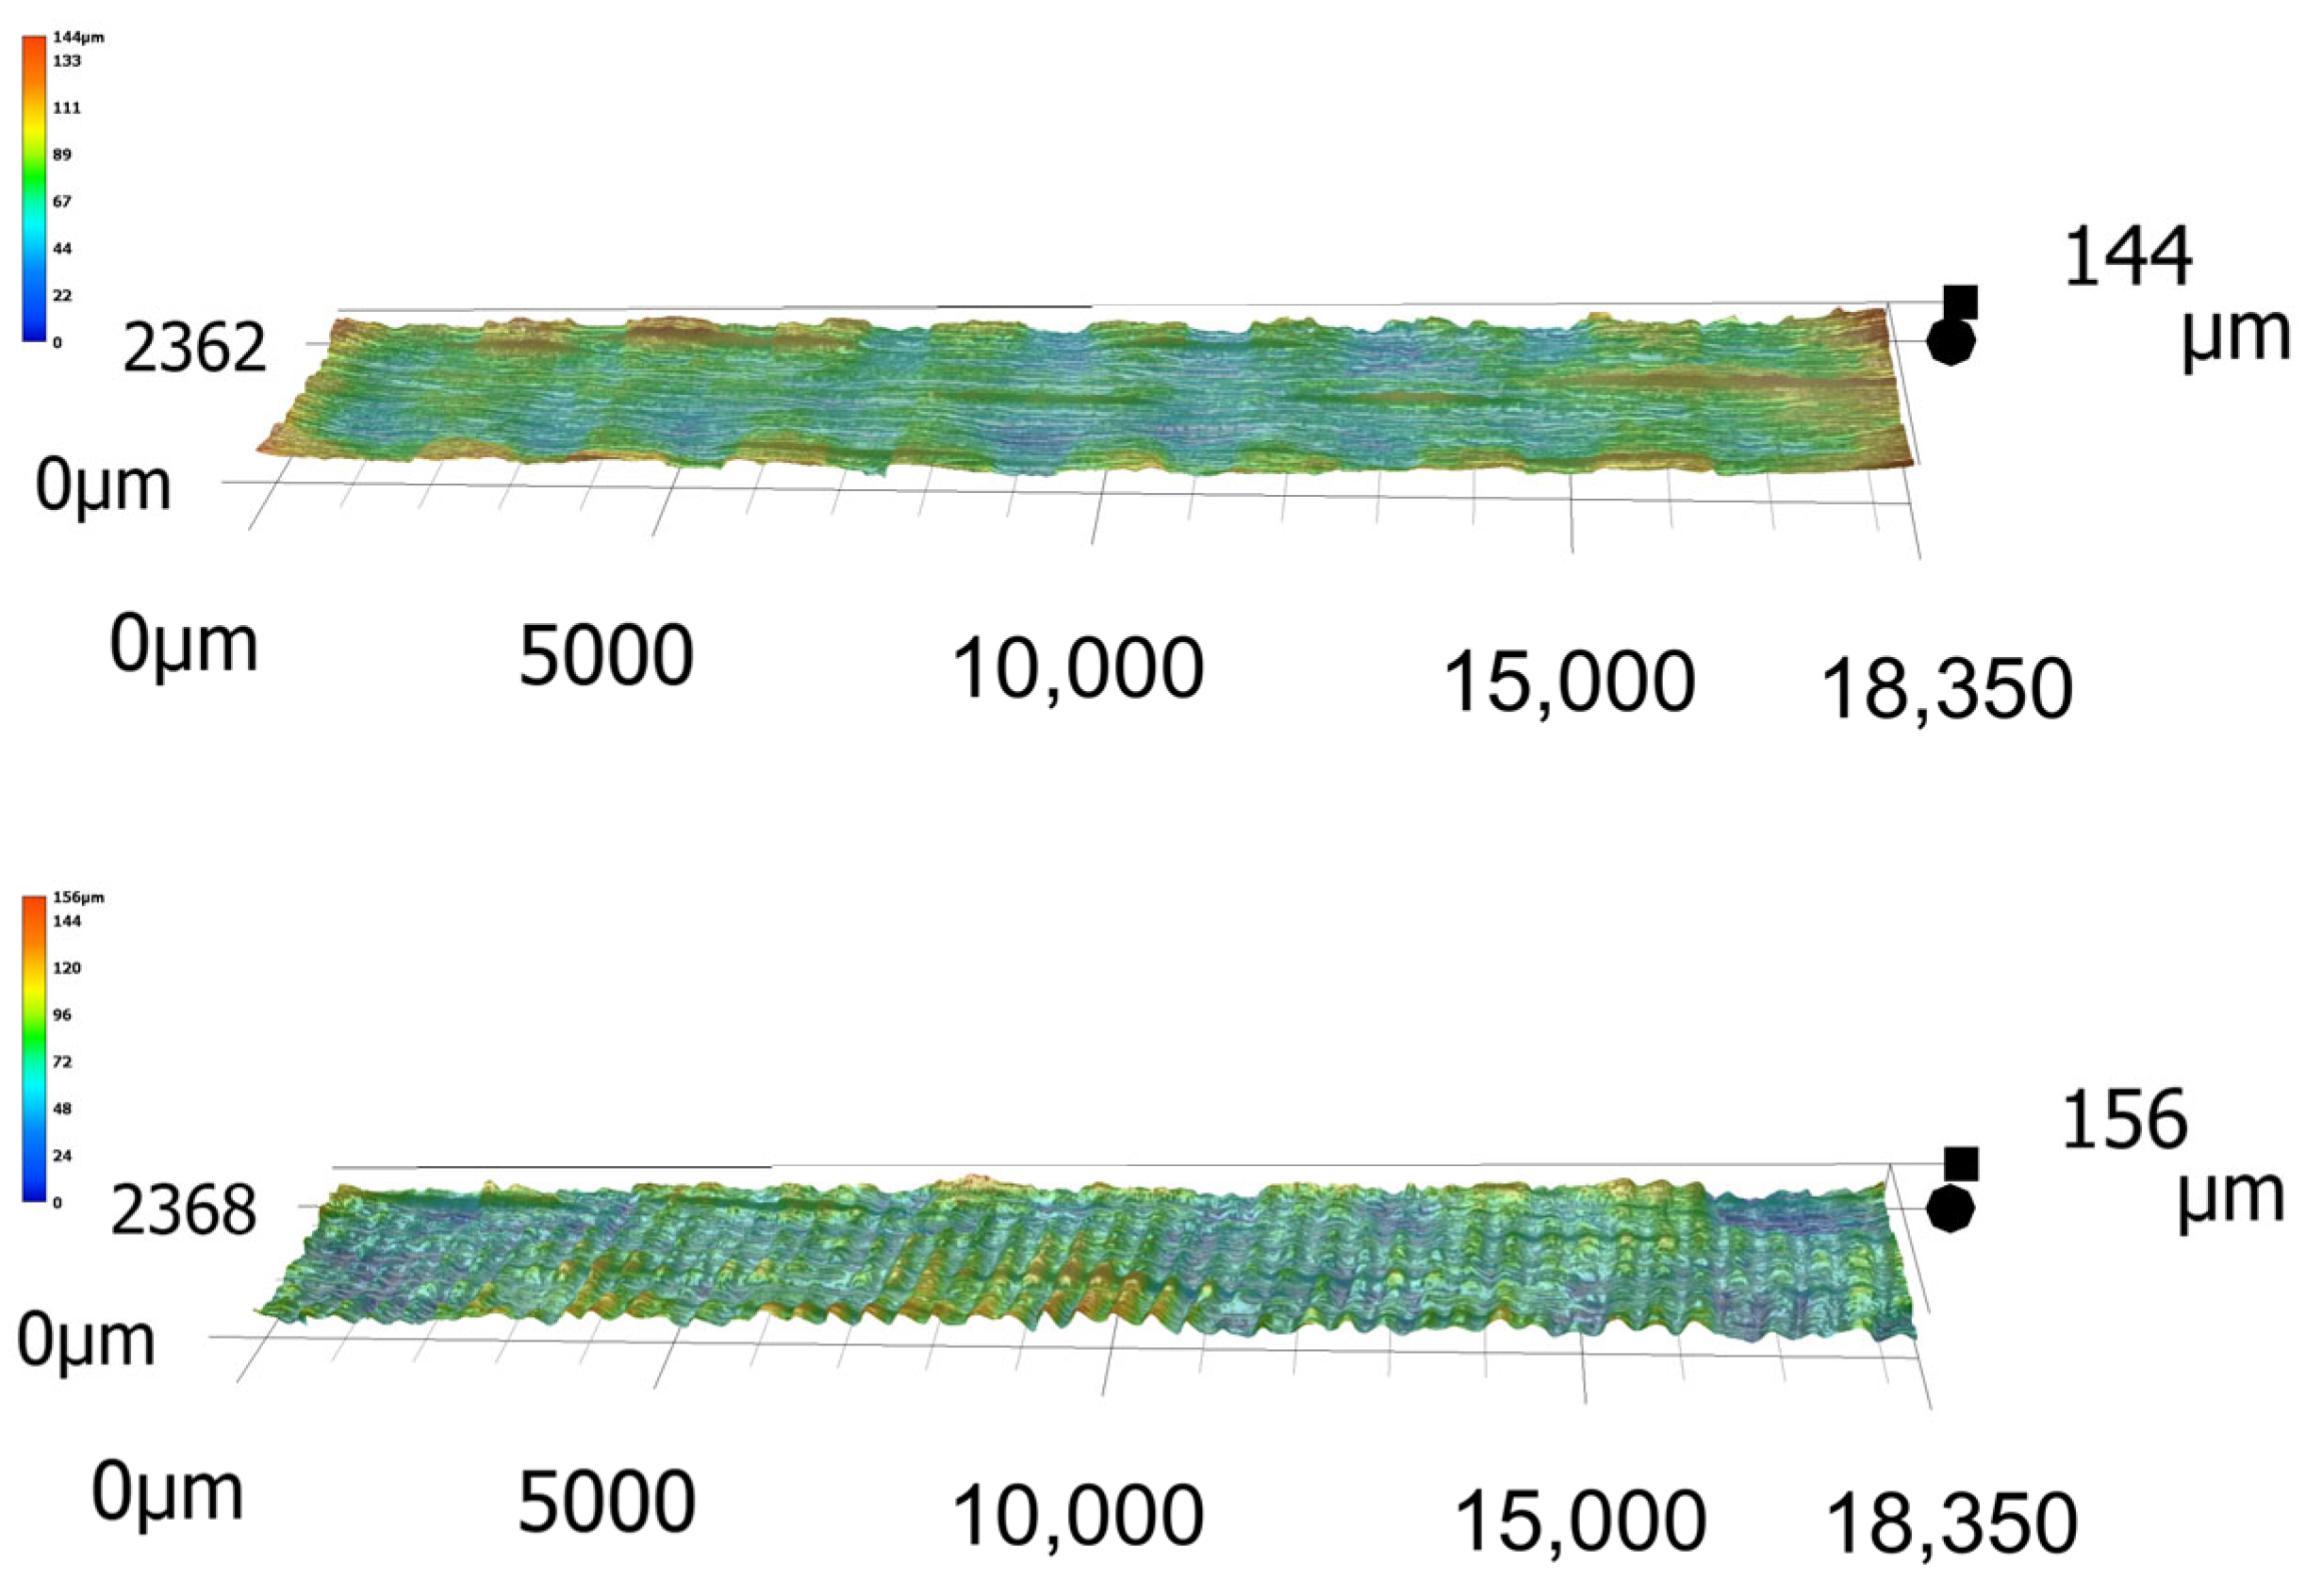
  • By increasing the feed speed of the laser beam, the surface roughness of laser-cut wood can increase significantly. Microscopic analysis showed the presence of waves on the surface of the wood, which were formed by the incomplete combustion of wood particles at a high feed speed. When cutting wood with a CO2 laser, it is therefore recommended to reduce the feed speed, which will reduce the surface roughness. In addition, feed speeds that are too high may not cut the material through its entire thickness due to incomplete burning of the wood.
  • The increasing laser power at a low feed speed caused an increase in surface roughness. The surface of the cutting kerf was superheated by the action of the laser beam, and pyrolysis occurred at low feed speeds. Probable high temperatures and the formation of internal stresses caused the formation of microcracks, which were observed in the microscopic analysis. These increased the roughness of the created surface.
  • Polynomial regression models of the second degree were created for the action of changing values of laser power and feed speed on the kerf width on the upper and lower sides and the roughness of the surface. The achieved accuracy of the models was 98.01% for the kerf width on the upper side, 95.95% for the kerf width on the lower side, 82.71% for the Ra parameter, and 85.44% for the Rz parameter. Models for determining the kerf width have proven that the most optimal values (the lowest kerf width) are at 50% laser power and 30 mm·s−1 feed speed on both sides. On the other hand, models for determining surface roughness determined the highest roughness values for this combination. The optimum result regarding surface roughness was achieved with the 50% laser power and the 15 mm·s−1 feed speed.
  • Using the created mathematical models and verification by microscopic analysis, it was found that in the red zone of the graph, the surface was formed by a significant undulation of the surface. In the dark-green zone with optimal laser technological parameters, the surface was smoother and more uniform. As part of the experiment, regression equations were created from the models, based on which it is possible to calculate the value of the kerf width on both sides of the sample and the value of the parameters Ra and Rz. This can help in setting up the CO2 laser in production. The results from the regression models can also be interpreted into production practice. If the lowest surface roughness is required, then 50% laser power and the 15 mm·s−1 feed speed are most suitable. If the thinnest cutting gap is required in terms of the yield or cutting accuracy, then 50% laser power and 30 mm·s−1 are most suitable. In both cases, a lower laser power will not cause such surface charring or the formation of microcracks on the surface.
In the future, the research will focus on optimising the CO2 laser cutting of other wood species important to the woodworking industry.

Author Contributions

L.A. set the main objectives of the research and conceptualised and wrote the manuscript. R.K. created the experiment design, performed the supervision, and provided an overview of the latest literature. K.K. performed the measurement of the roughness and kerf width and the statistical analysis of the data. R.I. performed the translation, edited the original draft into the template, and together with R.K. wrote the introduction of the paper. I.K. ensured the project administration and funding acquisition. All authors have read and agreed to the published version of the manuscript.

Funding

This work was supported by the Slovak Research and Development Agency under the Contract no. APVV-20-0159 (80%) and by the VEGA Agency of Ministry of Education, Science, Research, and Sport of the Slovak Republic and the Slovak Academy of Sciences (Grant no. 1/0577/22 (20%)).

Data Availability Statement

The data presented in this study are available upon request from the corresponding author.

Conflicts of Interest

The authors declare no conflicts of interest.

References

  1. Kubovský, I.; Krišťák, Ľ.; Suja, J.; Gajtanska, M.; Igaz, R.; Ružiak, I.; Réh, R. Optimization of Parameters for the Cutting of Wood-Based Materials by a CO2 Laser. Appl. Sci. 2020, 10, 8113. [Google Scholar] [CrossRef]
  2. Martínez-Conde, A.; Krenke, T.; Frybort, S.; Müller, U. Review: Comparative Analysis of CO2 Laser and Conventional Sawing for Cutting of Lumber and Wood-Based Materials. Wood Sci. Technol. 2017, 51, 943–966. [Google Scholar] [CrossRef]
  3. Açık, C. Investigation of Microscopic Properties of Some Industrial Wood Species as a Result of Laser Cutting. Int. Conf. Pioneer Innov. Stud. 2023, 1, 451–454. [Google Scholar] [CrossRef]
  4. Hasan, S.M.; Hubeatir, K.A.; Abd, D.S. Effect of CO2 Laser Parameters on Redwood Engraving Process Complemented by Taguchi Method. Mater. Today Proc. 2021, 42, 2566–2572. [Google Scholar] [CrossRef]
  5. Gochev, Z.; Vitchev, P. The Effect of the Focal Length Position of the Focusing Lens on the Discoloration Roughness of Plywood under Different CO2 Laser Engraving Modes. Acta Fac. Xylologiae Zvolen 2024, 66, 75–88. [Google Scholar]
  6. Kúdela, J.; Kubovský, I.; Andrejko, M. Influence of Irradiation Parameters on Structure and Properties of Oak Wood Surface Engraved with a CO2 Laser. Materials 2022, 15, 8384. [Google Scholar] [CrossRef] [PubMed]
  7. Li, R.; He, C.; Chen, Y.; Wang, X. Effects of Laser Parameters on the Width of Color Change Area of Poplar Wood Surface during a Single Irradiation. Eur. J. Wood Prod. 2021, 79, 1109–1116. [Google Scholar] [CrossRef]
  8. Krauss, A.; Moliński, W.; Kúdela, J.; Čunderlík, I. Differences in the Mechanical Properties of Early and Latewood within Individual Annual Rings in Dominant Pine Tree (Pinus sylvestris L.). Wood Res. 2011, 56, 1–12. [Google Scholar]
  9. Moliński, W.; Roszyk, E.; Puszyński, J. Variation in Mechanical Properties within Individual Annual Rings in the Resonance Spruce Wood (Picea abies (L.) Karst.). Drv. Ind. 2014, 65, 215–223. [Google Scholar] [CrossRef]
  10. Gurău, L.; Coșereanu, C.; Timar, M.C.; Lungu, A.; Condoroţeanu, C.D. Comparative Surface Quality of Maple (Acer pseudoplatanus) Cut through by CNC Routing and by CO2 Laser at Different Angles as Related to the Wood Grain. Coatings 2022, 12, 1982. [Google Scholar] [CrossRef]
  11. Gurau, L.; Angelescu, A.-M.; Timar, M.C. Surface Morphology and Chemical Changes of Maple and Beech Cut Through by CO2 Laser Under Different Angles Relative to the Wood Grain. Forests 2024, 15, 1767. [Google Scholar] [CrossRef]
  12. Gurău, L.; Coşereanu, C.; Paiu, I. Comparative Surface Quality of Larch (Larix decidua Mill.) Fretwork Patterns Cut through by CNC Routing and by Laser. Appl. Sci. 2021, 11, 6875. [Google Scholar] [CrossRef]
  13. Maciak, A.; Aniszewska, M.; Zychowicz, W.; Zowczak, W.; Danielewski, H. Effects of Beam Power and Feed Rate in the Process of Cutting Fresh Wood with a CO2 Laser on Water Contact Angle on the Cut Surface. Eur. J. Wood Prod. 2024, 82, 1369–1379. [Google Scholar] [CrossRef]
  14. Gurau, L.; Petru, A. The Influence of CO2 Laser Beam Power Output and Scanning Speed on Surface Quality of Norway Maple (Acer platanoides). BioResources 2018, 13, 8168–8183. [Google Scholar] [CrossRef]
  15. Corleto, R.; Gaff, M.; Sethy, A.K.; Kelkar, B.U.; Nemeth, R.; Ditommaso, G.; Kamboj, G.; Todaro, L.; Rezaei, F. Effects of CO2 Laser Parameters on Quality of Laser Cut Beech Wood (Fagus sylvatica L.) Surface and Extent of Heat Affect Zone. J. Indian Acad. Wood Sci. 2024. [Google Scholar] [CrossRef]
  16. Rezaei, F.; Wimmer, R.; Gaff, M.; Gusenbauer, C.; Frybort, S.; Sethy, A.; Corleto, R.; Ditommaso, G.; Niemz, P. Anatomical and Morphological Characteristics of Beech Wood after CO2-Laser Cutting. Wood Mater. Sci. Eng. 2022, 17, 459–468. [Google Scholar] [CrossRef]
  17. Quintero, F.; Riveiro, A.; Lusquiños, F.; Comesaña, R.; Pou, J. CO2 Laser Cutting of Phenolic Resin Boards. J. Mater. Process. Technol. 2011, 211, 1710–1718. [Google Scholar] [CrossRef]
  18. Eltawahni, H.A.; Olabi, A.G.; Benyounis, K.Y. Investigating the CO2 Laser Cutting Parameters of MDF Wood Composite Material. Opt. Laser Technol. 2011, 43, 648–659. [Google Scholar] [CrossRef]
  19. Li, R.; He, C.; Xu, W.; Wang, X.A.; Li, R.; He, C.; Xu, W.; Wang, X.A. Prediction of Surface Roughness of CO2 Laser Modified Poplar Wood via Response Surface Methodology. Maderas. Cienc. Y Tecnol. 2022, 24, 1–11. [Google Scholar] [CrossRef]
  20. Açık, C.; Tutuş, A. The Effect of Traditional and Laser Cutting on Surface Roughness of Wood Materials Used in Furrniture Industry. WIE 2020, 2, 45–50. [Google Scholar]
  21. Guo, X.; Deng, M.; Hu, Y.; Wang, Y.; Ye, T. Morphology, Mechanism and Kerf Variation during CO2 Laser Cutting Pine Wood. J. Manuf. Process. 2021, 68, 13–22. [Google Scholar] [CrossRef]
  22. Assyifa, U.; Nugraha, D.; Febryano, I.G.; Duryat, D.; Hidayat, W. Effect of CO2 Laser Speed on Kerf Width and Cutting Depth of Acacia Mangium Wood. Pros. Semin. Nas. Masy. Biodiversitas Indones. 2023, 9, 133–136. [Google Scholar]
  23. Corleto, R.; Gaff, M.; Rezaei, F.; Sethy, A.K.; Nemeth, R.; Valente, F.; Todaro, L. Effect of Moisture Content Levels on the Quality of Beech Wood Cut by CO2 Laser. Int. J. Adv. Manuf. Technol. 2024, 134, 159–169. [Google Scholar] [CrossRef]
  24. Gaff, M.; Rezaei, F.; Sikora, A.; Hýsek, Š.; Sedlecký, M.; Ditommaso, G.; Corleto, R.; Kamboj, G.; Sethy, A.; Vališ, M.; et al. Interactions of Monitored Factors upon Tensile Glue Shear Strength on Laser Cut Wood. Compos. Struct. 2020, 234, 111679. [Google Scholar] [CrossRef]
  25. ISO 21920-3; Geometrical Product Specifications (GPS)—Surface Texture: Profile. Part 3: Specification Operators. International Organization for Standardization (ISO): Geneva, Switzerland, 2022.
  26. Madić, M.; Girdu, C.C.; Marinković, D.; Janković, P.; Trifunović, M. Analysis of Kerf Width and Its Variation in CO2 Laser Cutting of Straight and Curved Cut Profiles. Teh. Vjesn. 2024, 31, 1884–1891. [Google Scholar] [CrossRef]
  27. Açık, C. Research of Computerized Numerical Control Laser Processing Qualities of Some Wood Species Used In the Furniture Industry. Maderas. Cienc. Y Tecnol. 2023, 25, 1–12. [Google Scholar] [CrossRef]
  28. Li, R.; Guo, X.; Cao, P.; Wang, X. Optimization of Laser Cutting Parameters for Recombinant Bamboo Based on Response Surface Methodology. Wood Res. 2016, 61, 275–286. [Google Scholar]
  29. Yusoff, N.; Ismail, S.; Mamat, A.; Ahmad-Yazid, A. Selected Malaysian Wood CO2-Laser Cutting Parameters And Cut Quality. Am. J. Appl. Sci. 2008, 5, 990–996. [Google Scholar] [CrossRef]
  30. Gurau, L.; Petru, A.; Varodi, A.; Timar, M.C. The Influence of CO2 Laser Beam Power Output and Scanning Speed on Surface Roughness and Colour Changes of Beech (Fagus sylvatica). BioRes 2017, 12, 7395–7412. [Google Scholar] [CrossRef]
  31. Doğan, G.A.; Wascher, R.; Avramidis, G.; Viöl, W.; Gerhard, C. Influence of Wood Modification on Parameter Settings and Treatment Results in CO2 Laser Structuring of Beech Veneers. J Mater. Sci. Mater Eng. 2024, 19, 41. [Google Scholar] [CrossRef]
  32. Quintero, F.; Riveiro, A.; Lusquiños, F.; Comesaña, R.; Pou, J. Feasibility Study on Laser Cutting of Phenolic Resin Boards. Phys. Procedia 2011, 12, 578–583. [Google Scholar] [CrossRef]
  33. Uslan, I. CO2 Laser Cutting: Kerf Width Variation during Cutting. Proc. Inst. Mech. Eng. Part B J. Eng. Manuf. 2005, 219, 571–577. [Google Scholar] [CrossRef]
  34. Nugraha, M.D.; Iswandaru, D.; Duryat; Hidayat, W. Optimization of CO2 Laser Cutting Variables of Sengon Plywood (Paraserianthes falcataria) Using Response Surface Methodology. J. Sylva Indones. 2024, 7, 97–109. [Google Scholar] [CrossRef]
  35. Ninikas, K.; Kechagias, J.; Salonitis, K. The Impact of Process Parameters on Surface Roughness and Dimensional Accuracy during CO2 Laser Cutting of PMMA Thin Sheets. J. Manuf. Mater. Process. 2021, 5, 74. [Google Scholar] [CrossRef]
Figure 1. Methodology for measuring the kerf width on the upper and lower sides of the sample (combination of parameters: 75% laser power, 15 mm·s−1, and lens magnification: ×200); axes: y = profile length, x = profile height.
Forests 16 00785 g001
Figure 2. At 50% laser power: (a) feed speed: 30 mm·s−1; (b) feed speed: 22.5 mm·s−1; (c) feed speed: 15 mm·s−1; (lens magnification: ×200).
Forests 16 00785 g002
Figure 3. At 75% laser power: (a) feed speed: 30 mm·s−1; (b) feed speed: 22.5 mm·s−1; (c) feed speed: 15 mm·s−1; (lens magnification: ×200).
Forests 16 00785 g003
Figure 4. At 100% laser power: (a) feed speed: 30 mm·s−1; (b) feed speed: 22.5 mm·s−1; (c) feed speed: 15 mm·s−1; (lens magnification: ×200).
Forests 16 00785 g004
Figure 5. Kerf width varying with feed speed and laser power (vertical bars denote confidence interval). FS = Feed speed.
Forests 16 00785 g005
Figure 6. Conical V-shape of the kerf when the material is incompletely cut (combination of parameters: 75% laser power, 15 mm·s−1, and lens magnification: ×200).
Forests 16 00785 g006
Figure 7. R-parameters varying with feed speed and laser power (vertical bars denote the confidence interval). FS = Feed speed.
Forests 16 00785 g007
Figure 8. Surface plots of upper-side kerf width (left) and lower-side kerf width (right).
Forests 16 00785 g008
Figure 9. Surface plots of R-parameters.
Forests 16 00785 g009
Figure 10. Top image: surface with the lowest roughness at a combination of 50% laser power and a feed speed of 15 mm·s−1; bottom image: surface with the highest roughness at a combination of 50% laser power and a feed speed of 30 mm·s−1 (lens magnification: ×200).
Forests 16 00785 g010
Table 1. p-levels from two-factor variance analysis (ANOVA) in the case of surface roughness.
RaRzRvRpRsk
Feed speed0.0000.0000.0000.0000.669
Laser Power0.0060.0010.0310.0000.079
Feed speed × Laser Power0.0000.0000.0000.0000.355
Table 2. p-levels of R-parameters from two-factor variance analysis (ANOVA) in the case of kerf width.
p-Level
Side0
Feed speed0
Laser Power0
Side × Feed Speed × Laser Power0.202
Disclaimer/Publisher’s Note: The statements, opinions and data contained in all publications are solely those of the individual author(s) and contributor(s) and not of MDPI and/or the editor(s). MDPI and/or the editor(s) disclaim responsibility for any injury to people or property resulting from any ideas, methods, instructions or products referred to in the content.

