Article

Reconstructing Hydroclimatic Variability (1657 AD) Using Tree-Ring Time Series and Observed and Gridded Precipitation Data in Central Greece

by
Vasileios D. Sakalis
1 and
Aristeidis Kastridis
2,*
1
Northern Kynouria Municipal Water Supply and Sewerage Company, 220 01 Astros Arcadia, Greece
2
Laboratory of Mountainous Water Management and Control, School of Forestry and Natural Environment, Aristotle University of Thessaloniki, 541 24 Thessaloniki, Greece
*
Author to whom correspondence should be addressed.
Forests 2025, 16(5), 773; https://doi.org/10.3390/f16050773 (registering DOI)
Submission received: 4 April 2025 / Revised: 27 April 2025 / Accepted: 30 April 2025 / Published: 1 May 2025
(This article belongs to the Section Forest Hydrology)

Abstract

:
This study evaluated the long-term hydroclimatic trend through a reconstruction procedure of precipitation variability in central Greece (1657–2020), using eight tree-ring chronologies (Pinus sp. and Abies sp.). Through the combination of gridded climate datasets with tree-ring width (TRW) and earlywood width (EWW) chronologies, we created three precipitation reconstructions, (1) April–August (AMJJA) and (2) May–June (MJ) using TRW and (3) EWW chronologies, utilizing both measured and gridded precipitation data. Chronologies were standardized using ARSTAN, while principal component analysis (PCA) was used for the development of the reconstructions. Verification and calibration of the derived time series (split-period tests, RE > 0, R = 0.62–0.67) confirmed a strong reconstruction that explained 15%–45% of the variability in precipitation. The results revealed strong growth–precipitation relationships throughout spring–summer (AMJJA/MJ). Multi-decadal variability is captured by TRW chronologies, while higher-frequency signals are reflected by EWW. Significant time intervals (19.6-, 12.5-, and 2.2-year cycles) were found by spectral analysis, indicating climatic impacts on tree-ring chronologies. Extremely wet (e.g., 1885, 1913) and dry (e.g., 1894–1895) episodes were confirmed against regional paleoclimate data and were consistent among previous reconstructions (72%–92% agreement). Despite the fact that sample depth reduced after 1978, the EPS was constantly higher than the threshold (EPS > 0.85 post-1746), showing the reliability of the reconstruction. This study expanded the hydroclimatic record of the southeast Mediterranean and highlighted that tree-ring chronologies are reliable variables to predict the historical precipitation.

1. Introduction

Our understanding of historical causes for climatic variability and their effects on human existence can be improved by dendrochronology studies of the links between climate and tree development [1]. Several dendrochronology studies have been implemented dealing with conifer tree species grown in the Balkan Peninsula and Eastern Mediterranean [2,3,4,5,6,7,8,9,10,11,12,13,14,15,16,17,18,19,20,21,22,23,24,25]. Most of these studies deal with the precipitation reconstruction, except for the following studies, which deal with summer sunshine reconstruction [2], streamflow reconstruction [12], standardized precipitation index (SPI) [8,26], Palmer drought severity index (PDSI) [22,25], and standardizes precipitation and evapotranspiration index (SPEI) [23]. The tree-ring width (TRW) was the primary proxy parameter used by the cited performed research; however, in few instances, the maximum density (MXD) [10,27] or the MXD and latewood width (LWW) were also employed [11].
Existing tree-ring chronology studies were based either on a single tree-ring site [3,11,17,23] or on several tree-ring sites, spatially distributed over a wider area [2,6,8,20]. The reconstruction of the climate conditions based on tree-ring proxy data or the investigation of the climate impact on the tree-ring growth is based either on gridded meteorological parameters (i.e., temperature, precipitation, standardized precipitation index (SPI), Palmer drought severity index (PDSI), etc.) provided by several available datasets or on single ground-based weather station data in close proximity with the tree-ring site. Gridded data mainly covers variances of precipitation in large scale, since they are in relation to the spatial interpolation between multiple rain-gauges data in the reference cell center of a broader area [28], whereas single weather station data represent more accurately the precipitation of a specified location. Microclimate conditions, which might be a crucial aspect of the climatic data at a weather station, are not reflected in the mean climatic record of the gridded dataset throughout the study area; rather, it is indicative of the regional climatic conditions according to [29], who have already discussed the characteristics of regional climatic average values. The climate record of the closest single weather station may not share as much variation with tree-ring data as a regionally averaged climate record [30]. Despite several other parameters that influence the reliability of the reconstruction development (tree orientation and type, site elevation, de-trending and cross-dating procedures, etc.), an appropriate combination of chronologies (dense proxy network of many various archives) spatially averaged over a larger area which lead to an increased sample size may reduce several difficulties [6] and finally may lead to an increasing accuracy and robust quality estimation of the analysis [31,32]. This is based on the fact that there is often adequate monthly climatic variance in common between sites of medium or high elevation [27] over a wider area with almost similar characteristics (i.e., Eastern Mediterranean/Balkan Peninsula, Central Europe, Western Europe, etc.).
The aim of the present study is multifaceted. This study combined existing and newer chronologies to develop one of the most recent reconstructions of central Greece (end-year 2020), dated back to 1657 AD. The three developed tree-ring reconstructions cover an extended (April till August) or a shorter (May till June) monthly period and are based on different proxies (TRW or EWW) and gridded data. Additionally, we utilized the recent dataset of the 20th Century Reanalysis Project 20CRv3 [33], which is utilized for the first time in tree-ring studies in the Eastern Mediterranean area. The comparisons between different proxy data (tree-ring width or earlywood width) of the same neighboring area within a common monthly period were also analyzed. Earlywood width (EWW) is introduced for the first time as proxy data in paleoenvironmental studies within the Eastern Mediterranean, as well.

2. Materials and Methods
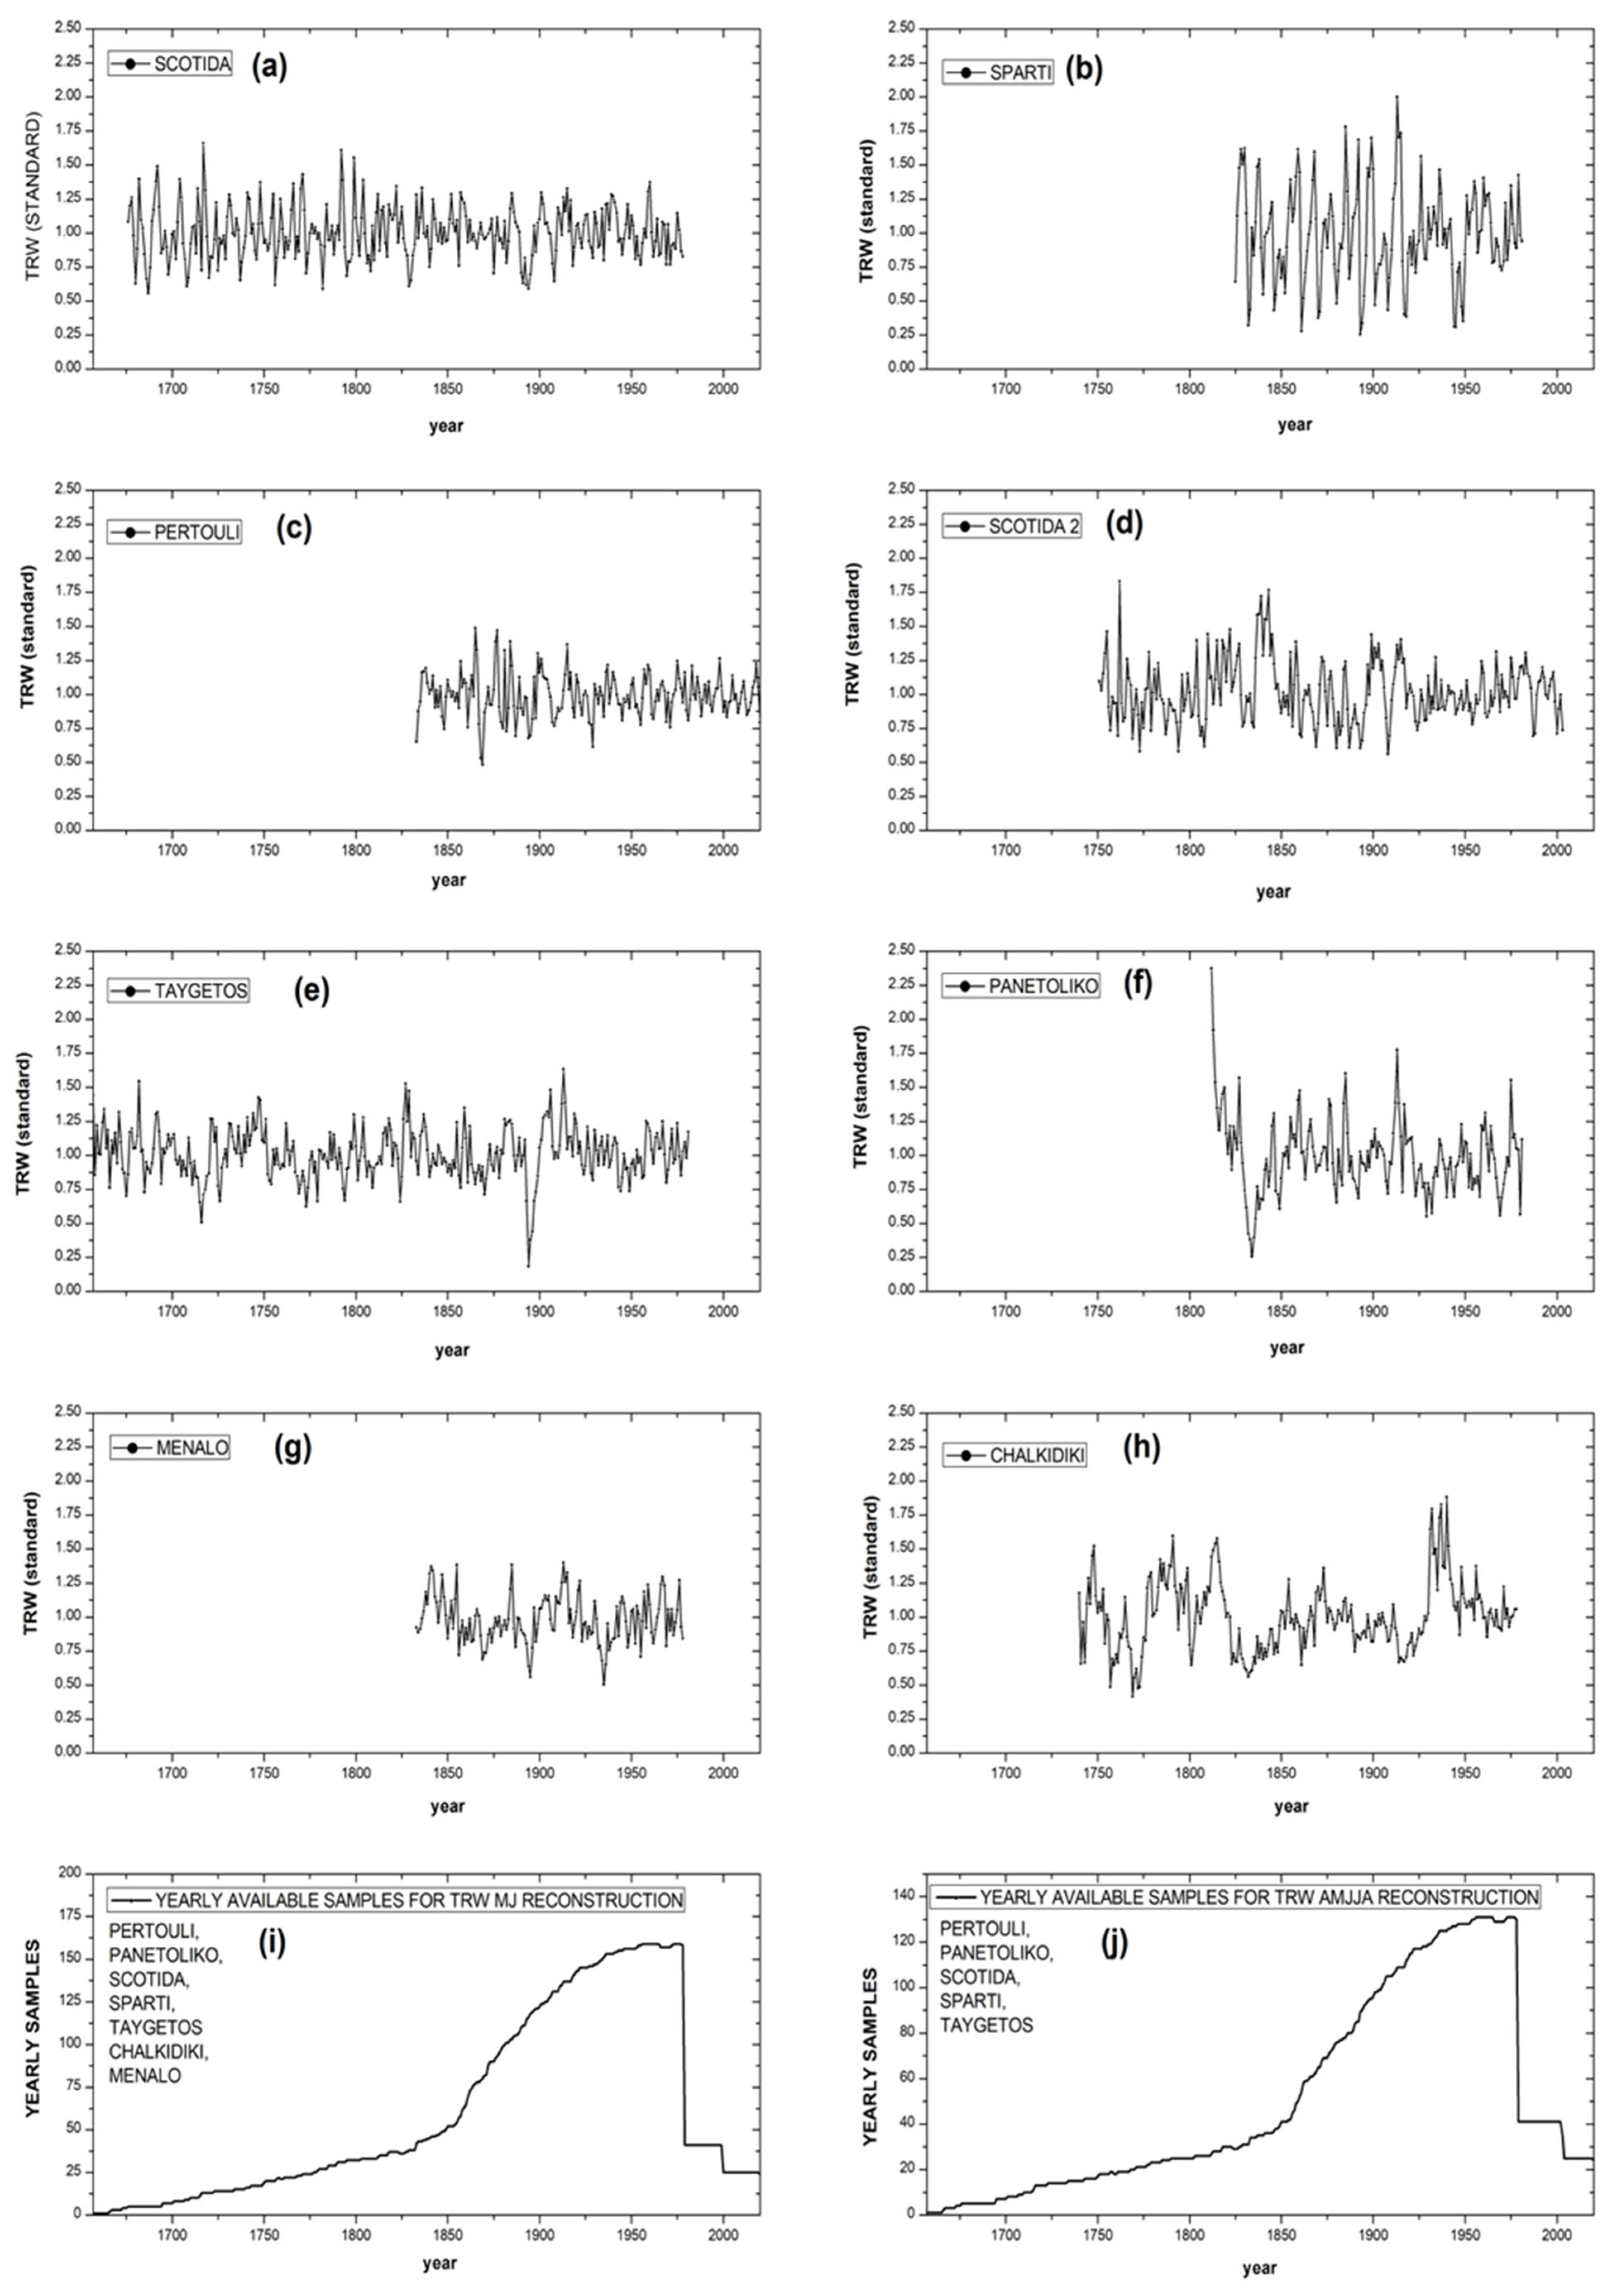
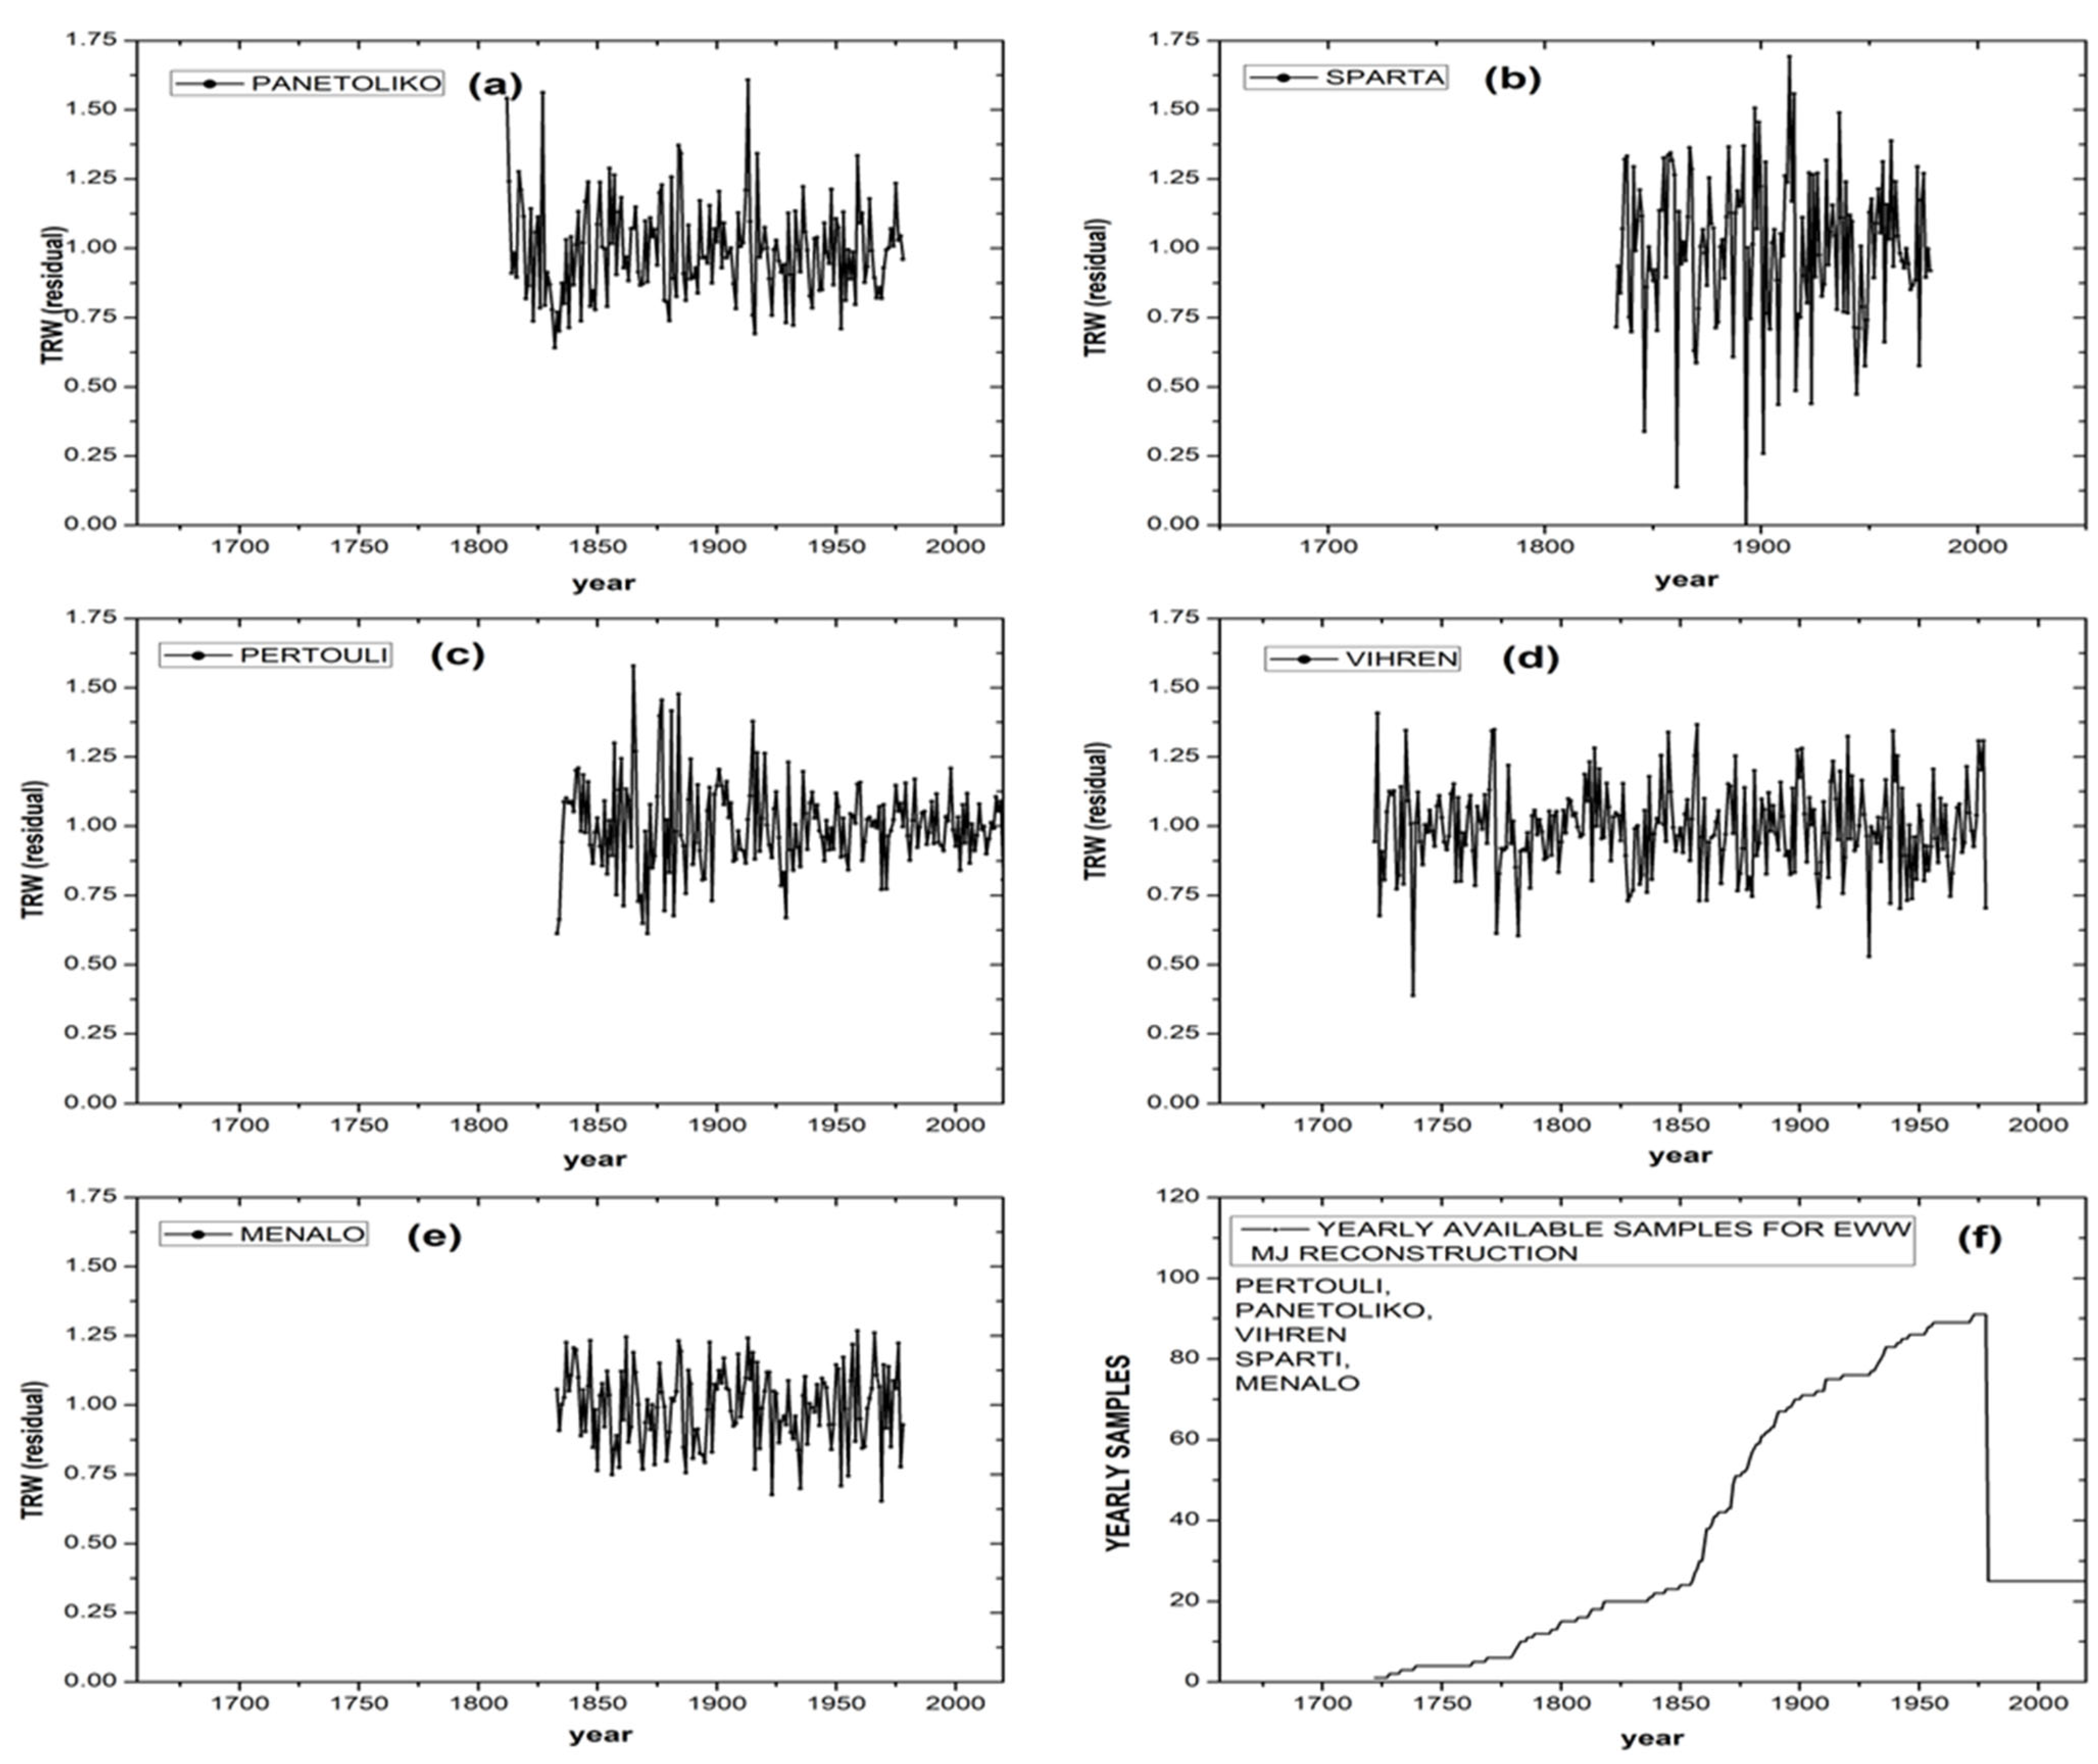
2.1. Tree-Ring Data

Most of the tree-ring sites are located in Greece and they are evenly distributed (Figure 1) across the mainland. In the current research, eight dendrochronology time series of pines (Pinus sp.) and fir (Abies sp.) species, ranging from 1657 to 2020 (Table 1, Figure 2 and Figure 3), were employed to create the regional reconstructions of central Greece (Figure 1). The dendrochronology site elevation ranged between 1.100 and 2.100 m. All dendrochronology time series, except for the Pertouli forest [23], were downloaded from the National Oceanic and Atmospheric Administration (NOAA) databank (https://www.ncei.noaa.gov/products/paleoclimatology/tree-ring, accessed on 14 October 2024).
The Pertouli forest chronology (valid between 1833 and 2020) is the most recent among the others that were used in the present study. The eight available chronologies were truncated appropriately to formulate the common principal components for the development of the reconstructions (Table 2, Section 3.2). The longest period of tree-ring time-series chronology (Taygetos forest) was valid between 1657 and 1999. A statistical evaluation has been conducted using the COFECHA program [34,35] to validate the cross-dating. ARSTAN soft was used to standardize the chronologies [36]. To eliminate the non-climatic trends caused by age, size, and stand dynamics, a double de-trending procedure was followed applying firstly a negative exponential smoothing or linear regression and then splines with a frequency response of 50% at a wavelength of two-thirds of each series’ length [37]. After de-trending and indexing (standardizing) the tree-ring time series, the program ARSTAN applies a bi-weight robust estimation of the mean value function to eliminate the impact of endogenous stand disturbances and create chronologies. Three time-series versions are generated by the ARSTAN program: the standard, the ARSTAN, and the residual. In the current research, the tree-ring width (TRW) and earlywood width (EWW) chronologies derived from the ARSTAN standard and residual method were chosen as the main parameters which were affected by the climatic variable. The highest correlation coefficients had appeared between the TRW and EWW chronologies with the gridded climatic data (See the following section). More information concerning the procedure of the creation of the dendrochronologies can be accessed on the site of NOAA databank.
The running value of the express population signal (EPS) value (Equation (1), Figure 4) is calculated with a 25-year overlapping period, using a 50-year window, and the formula is as follows:
E P S = t r b ¯ t r b ¯ + 1 r b ¯
where t is the total number of the tree-series averaged (one core per tree) and r b   the mean between series correlations [12].

2.2. Climatic Data

The reconstruction of the precipitation time series is depended on gridded monthly CRU TS 4.07 (Climate Research Unit, East Anglia, UK [28]), GPCC v2020 (Global Precipitation Climatology Centre [38,39], and 20CRv3 weather data (20th century reanalysis V3 [33,40]). Gridded data also provides a more regional signal than ground-based weather station data [12]. Three different reconstructions were developed, based on each one of the referred monthly gridded data. These data were averaged within the area between latitude 39–40° and longitude 21–23°, situated at the central part of mainland Greece. This area is chosen because of the increased correlation between proxy data and monthly gridded precipitation sets. Chronologies used in the present study are almost evenly distributed away from the area under consideration so as this area may become a representative geometric center of the tree-ring sites. It must be noted that Pearson’s R is the main criteria to choose the reconstruction proxy and gridded data. Our iterative procedure included several tryouts between proxy data (TRW or EWW), periods (i.e., AMJJA, MJ, etc.) and gridded precipitation data, in order to improve the Pearson R.
A common period between 1928 and 1978 is used to examine the growth climate response patterns between the time series and the conditions of the environment (precipitation). Previous studies [3,6,7,8,26,41] revealed that the period near the mid-19th century till recent years was accurate and reliable enough, because of the increased available rain gauge data which could be utilized in the interpolation procedure. Especially for the case of 20CRv3 data, an increased accuracy is introduced after the year 1930 owing to the availability of 5% more observations per assimilation cycle [33]. All data used in the present study were downloaded from the Royal Netherlands Meteorological Institute (KNMI) climate explorer portal (https://climexp.knmi.nl/, accessed 22 November 2024).

2.3. Statistical Analysis

A split calibration–verification procedure was employed to test the reliability of the precipitation reconstructions (Table 2 [42]). The period from 1928 to 1953 was used for calibration and the period from 1954 to 1978 for verification. This process was then reversed. Principal components analysis (PCA) was used in the current study. The PCA method’s primary benefit is its ability to enhance the correlation coefficient between the reference period of the climate variables and the final time series by appropriately combining the available chronologies. A nested regression procedure [43] was used to optimize the reconstruction length. This procedure involves a combined synthesis of the available nests (Table 2). After adjusting each one nest to the more recent and better-replicated nest (referred to as the calibration period 1928–1978) [12] using multiple linear regression analysis, the nested reconstructions were spliced together. The nest that had the strongest relationship with the meteorological factors—which is frequently the one closest to the reference period (1928–1978) nest—is incorporated together with the total of the best-replicated nests in the final reconstructions. This spliced procedure was implemented twice, one for the nests before the reference period and another for the nests after the reference period (the more recent nests). When a nest fails to satisfy the splitting calibration–verification criteria, as shown below (i.e., RE > 0), the number of contributing nests was lowered from the maximum allowed.
The statistics used to test the reliability of the reconstruction models included the reduction of error (RE), the Pearson correlation coefficient (R), the coefficient of determination (R2), and the F-test [37,42]. To validate the results of the analysis, the RE statistic was used. The RE statistic’s theoretical bounds go from negative infinity to a maximum of one, which denotes complete agreement. Any positive RE value suggests that there is some valuable information in the reconstruction, which is a very rigorous statistic [44].

3. Results

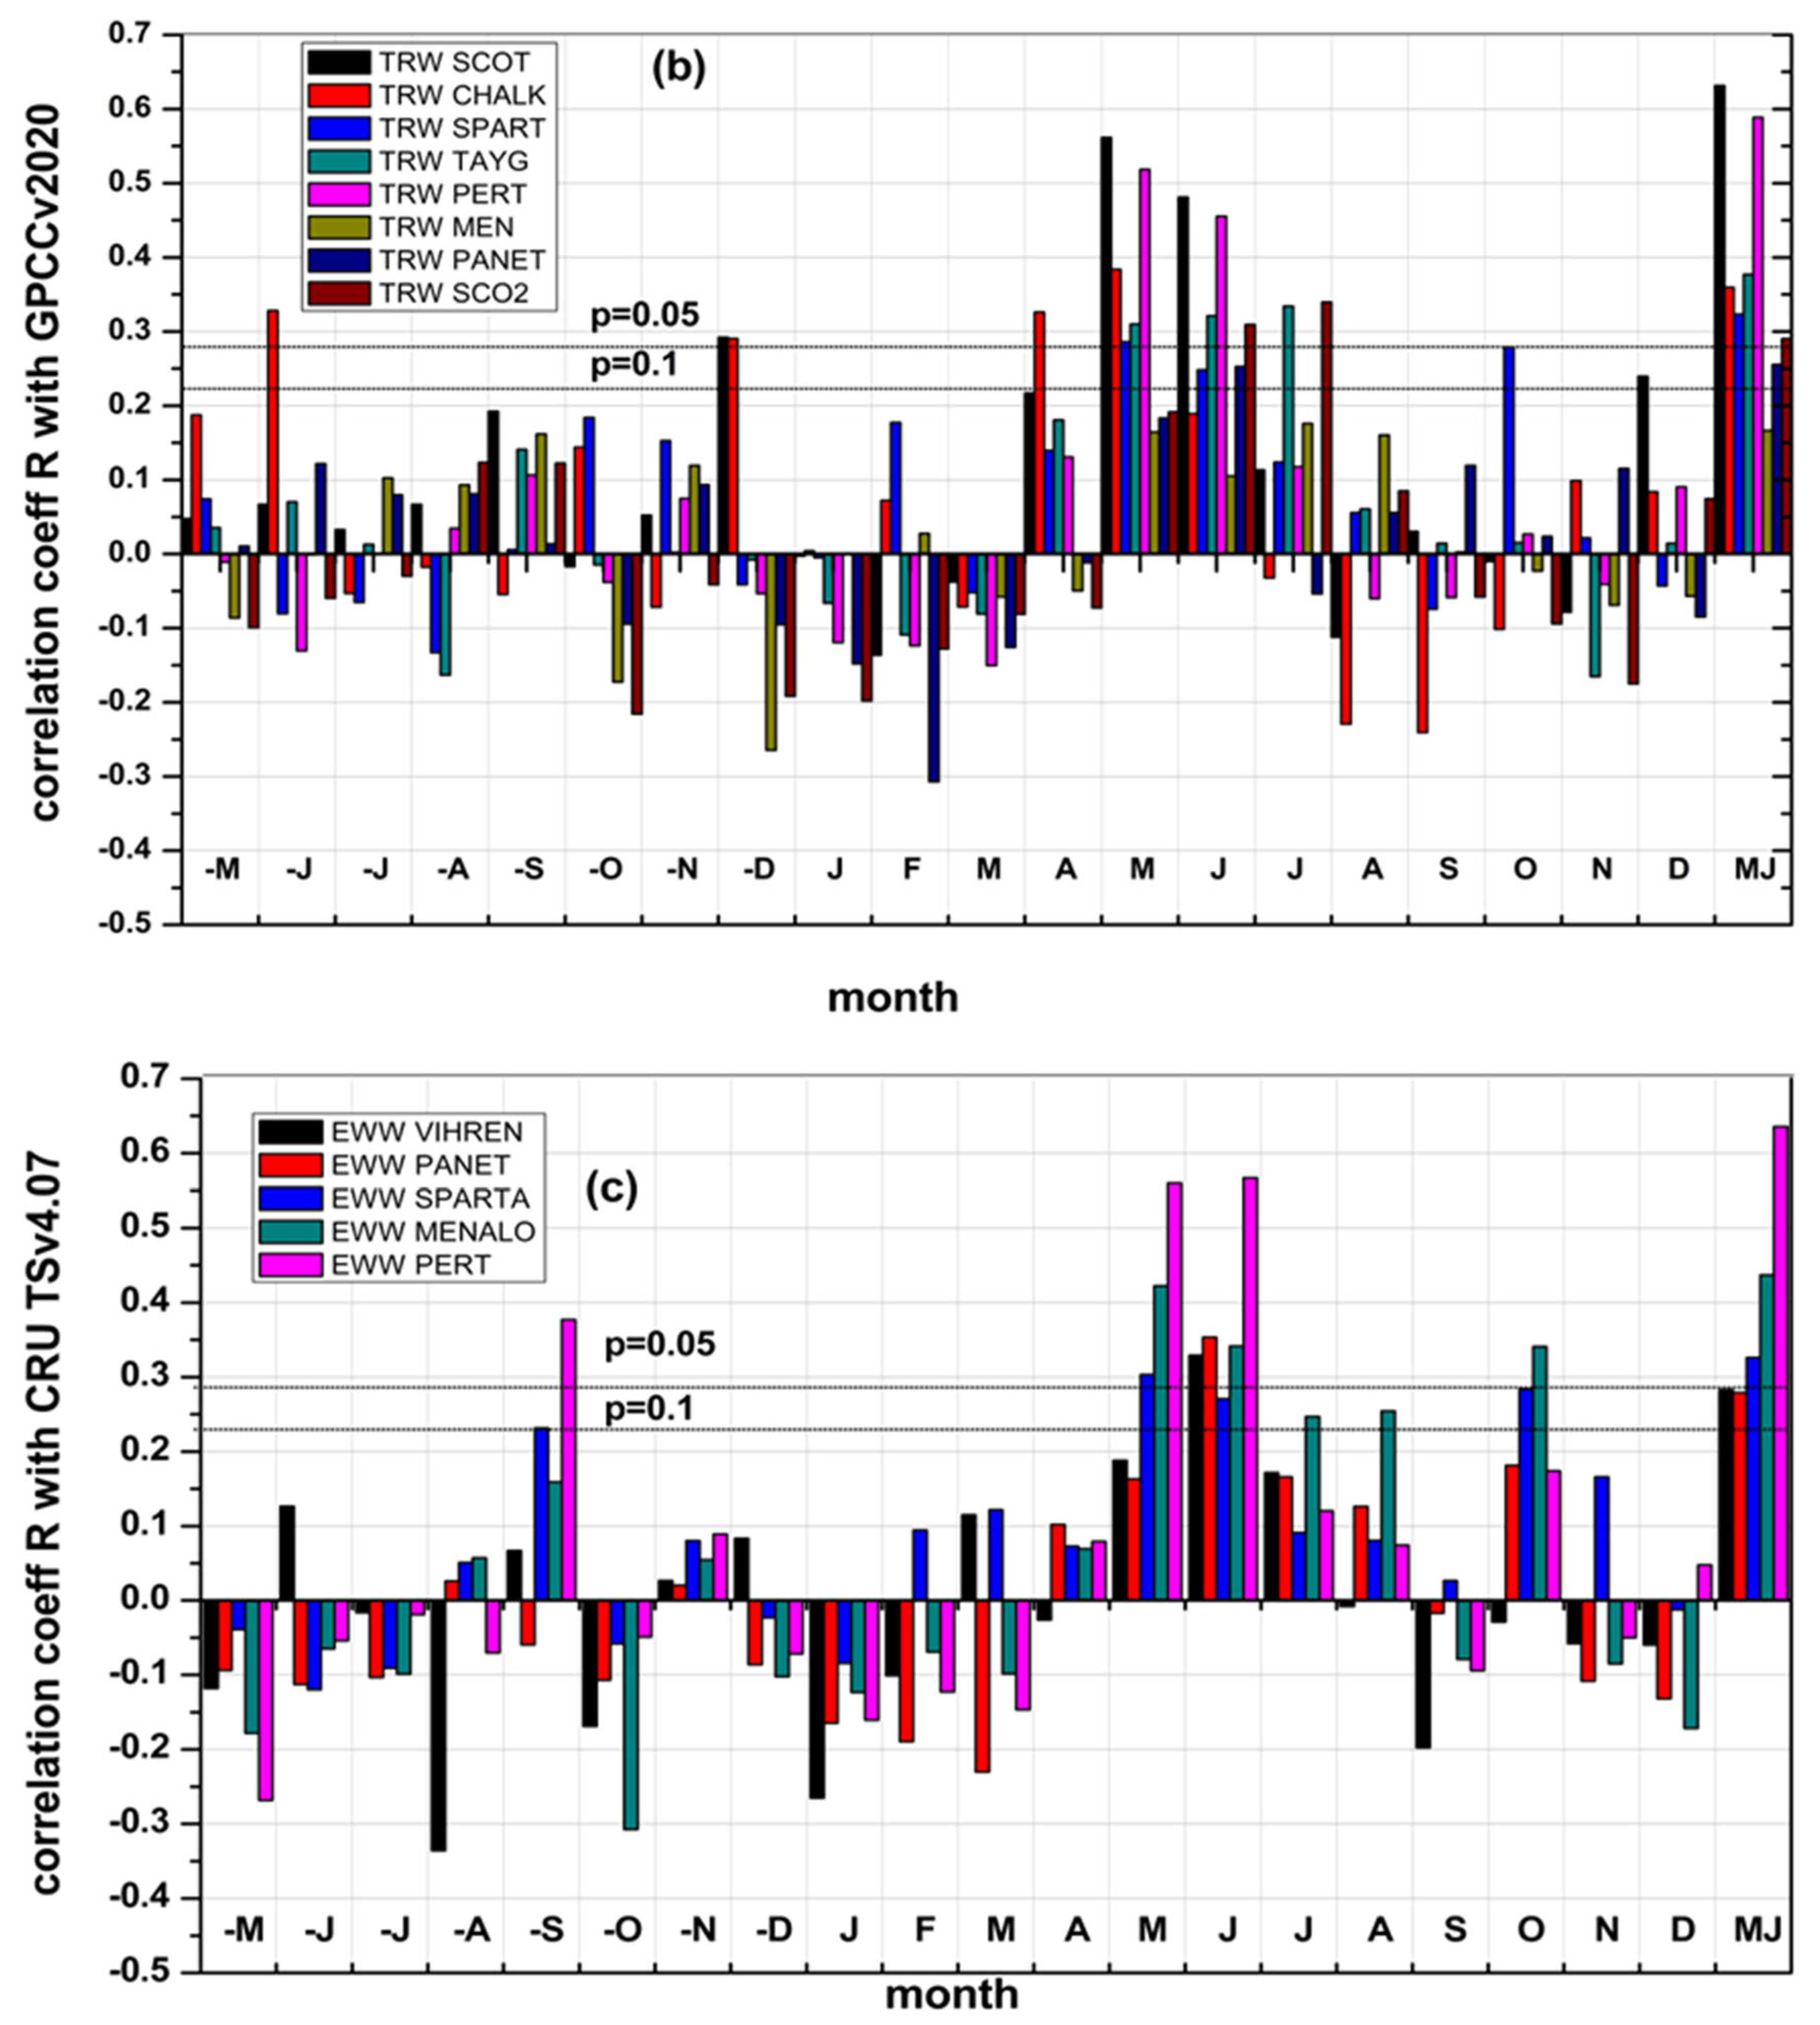
3.1. Climate and Tree-Ring Data Relationship

In the south-east Mediterranean environment, drought stress during extremely warm times typically results in low growth rates; the most common cause is water deficit observed throughout the growing season [45,46,47]. Restoring water availability results in a restoration of cambium zone activity [48]. In Mediterranean locations, the growing season typically begins in late April and lasts until September [49,50,51,52,53]. Consequently, among several other parameters, the monthly precipitation during spring and summer may be some of the major driving factors of the conifer tree growth rate in a medium- to high-elevation Mediterranean forests.
Figure 5 represents the Pearson correlation coefficient between the standard TRW (Figure 5a,b) and residual EWW (Figure 5c) chronologies with different gridded monthly precipitation data (20CRv3, GPCC v2020, and CRU TS v4.07), during the period from 1928 to 1978 within the reference area (lat. 39–40°, long. 21–23°, Figure 1). From May of the prior year to December of the current year, the Pearson correlation coefficients were generated.
In Figure 5a, it is observed that TRW (std) chronologies are strongly positive with the April to August (AMJJA) 20CRv3 precipitation data. The same influence continues to be weaker and almost non-significant during October and November. An almost negative and weak correlation is observed in precipitation during January to March (JFM), September, and December, respectively. This result indicates that the precipitation during the late spring and summer months increases the tree-ring width, while the January to March precipitation decreases the TRW.
In the case of Figure 5b (TRW std), observations relative to the AMJJA period are different. The number of the TRW chronologies with strong positive correlation with the complete (AMJJA) GPCC v2020 precipitation data period is reduced, resulting only to significant influence in May and June. An almost negative and weak correlation is observed during January to March (JFM), whereas during August to December the precipitation influence on chronologies is mostly weaker with sign changes.
Almost the same observations can be made in the influence between EWW (res) and CRU TS v4.07 gridded data (Figure 5c) in the study area, with the most notable difference being the strong positive correlation with October precipitation. Although the different precipitation datasets used for the calculation of the EWW and TRW growth influences (Figure 5b,c), there is a quite common notable environmental performance of both proxy values.
No remarkable correlations are observed during the previous year’s months, except for some single significant positive/negative correlations.
Finally, Figure 5a–c show that the higher correlations between the time series and the climatic data are the TRW (std) AMJJA period for the 20CRv3 data and the TRW (std) and EWW (res) MJ periods for the GPCC v2020 and CRU TS 4.07, as well.

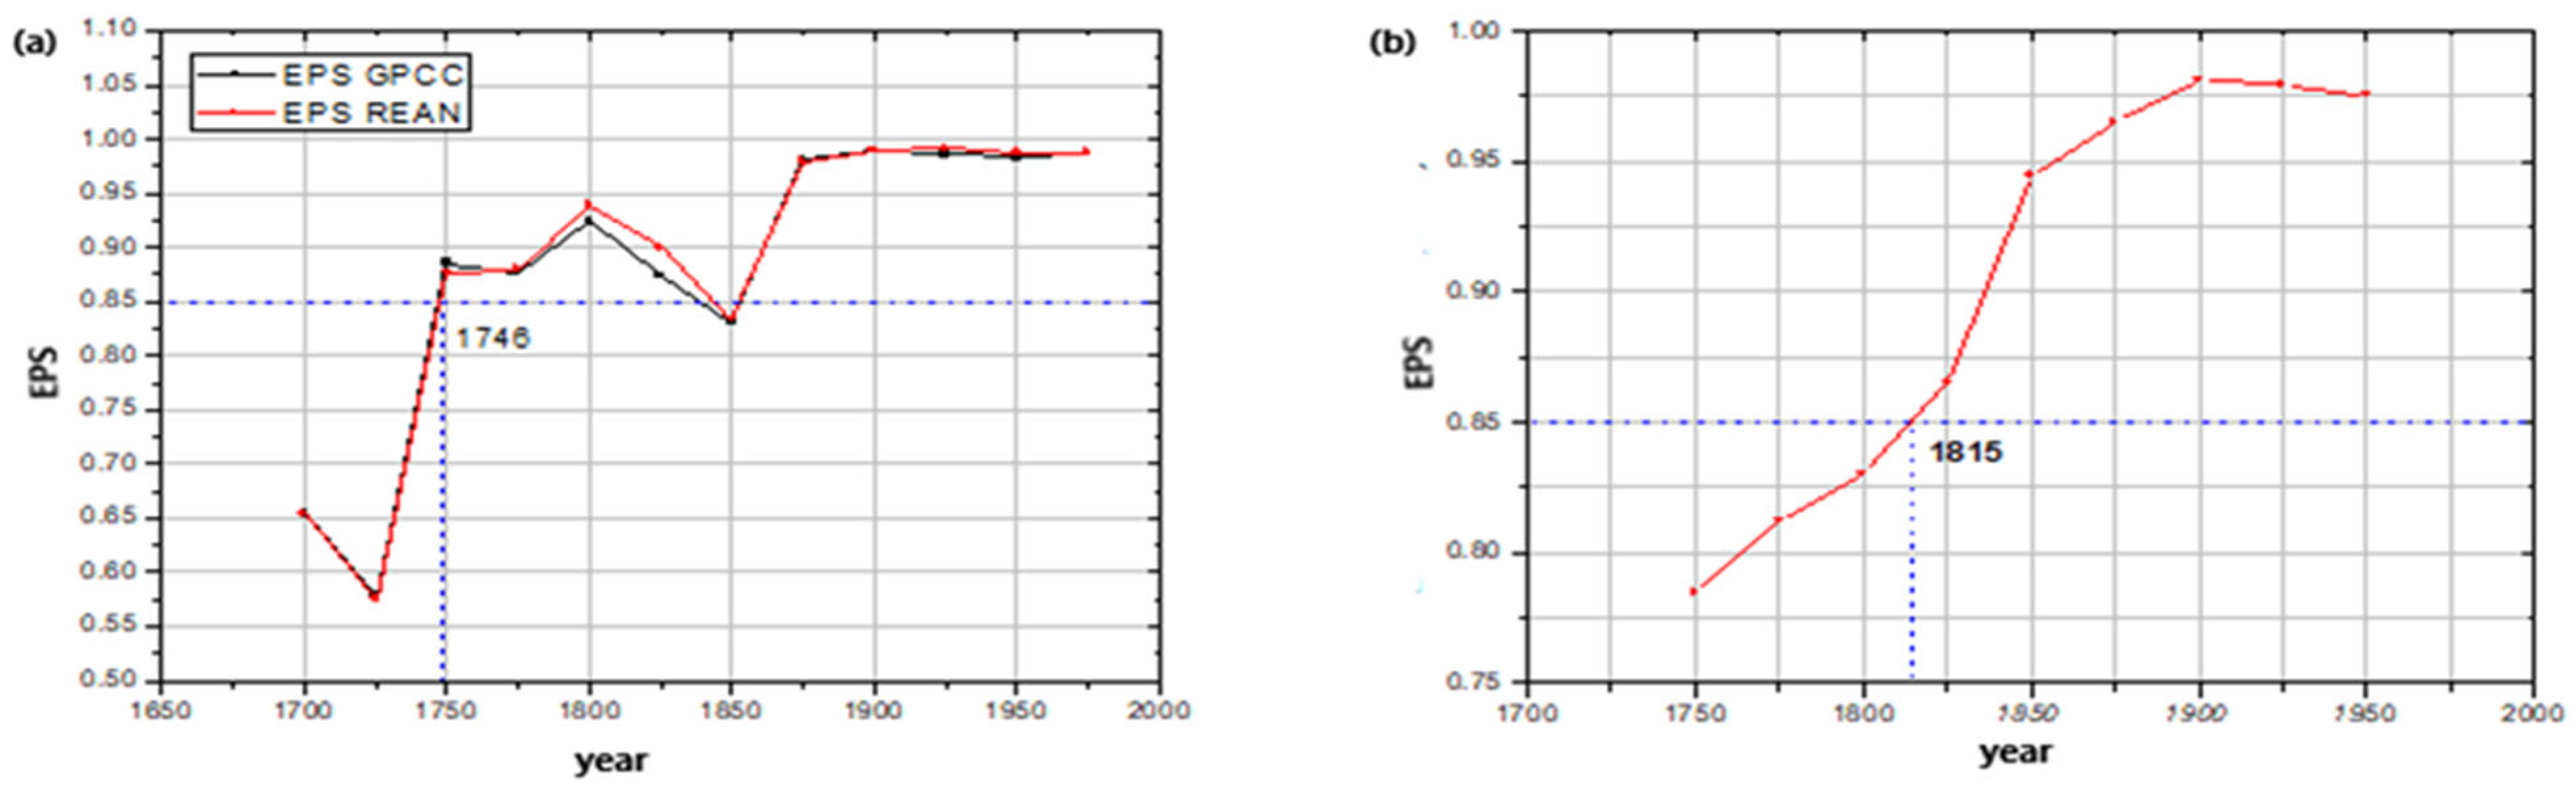
3.2. The Followed Process for Reconstructing the Tre-Ring Chronologies

Table 1 and Figure 2 and Figure 3, show the eight (standard) and five (residual) chronologies that were used to reconstruct the monthly precipitation of the AMJJA (based on 20CR data) and MJ (based on GPCC data and CRU data), applying principal component analysis (PCA) [42]. After the implementation of several combinations and tests, the chronologies of Chalkidiki and Menalo were removed from the creation of the TRW AMJJA (20CR data, Figure 5a) reconstruction whereas the chronology of Vihren was excluded from the reconstructions of TRW AMJJA (20CR data) and TRW MJ (GPCC data, Figure 5b). The overall variation described by each period’s final reconstructions (Table 2) ranges from a minimum of 15% (MJ TRW, period 1657–1978) to a maximum of 45% (AMJJA reconstruction period 1833–1978) [12,43].
Table 3 shows that the Pearson correlation coefficients R are often increased, significant, and balanced across the calibration and verification periods, and the RE statistic values are positive [7,54]. Given the large and highly significant F values of the sub-periods, the resulting reconstructions were appropriately validated in order to create the final reconstructions. A few exceptional cases, where RE < 0 during the splitting periods (Table 2, 1929–1999 for TRW MJ and 1812–1978 and 1722–1978 for EWW MJ) were considered unacceptable, and the relevant principal component periods were excluded from the reconstruction. As described in the preceding paragraph, the precipitation data for the whole 1928–1978 period were utilized for the final calibration to produce the final reconstructions (Figure 6) using the successful splitting technique.
These three final precipitation reconstructions (Figure 6), which extended from 1657 to 2020 (cases of AMJJA and MJ based on TRW) and from 1834 to 2020 (case of MJ based on EWW), presented mean values of Pearson correlation coefficients between 0.62 and 0.67 (Table 2), which showed an acceptable fit to the gridded observational data that was high enough for a trustworthy and accurate examination of historical climate conditions [2,6,7,11,26,27].
Sample length (Figure 2 and Figure 3) reaches a maximum at 1977 (131 for AMJJA TRW, 159 for MJ TRW, and 91 for MJ EWW) and a common minimum value of 24 at 2019. The sharp decrease in samples after 1978 can be attributed to the fact that only Pertouli, Taygetos, and Scotida (2) chronologies were extended till recent years, 2020 and 1999, respectively.
According to Figure 4, after 1746 (or 1815 for MJ EWW), the running expressed population signal (EPS) is above the critical value of 0.85 for all the reconstructions. Also, a slightly lower than 0.83 temporary reduction in the running EPS is observed between 1840 and 1860, owing to the introduction of several new chronologies with a low number of samples and inter-series correlation. All of the reconstructions may be classified as interpretable based on this empirical criterion. The crucial 0.85 cut-off number, however, is purely arbitrary and ought to be utilized just as an estimate [43,56].
Figure 7 presents the reconstructed (MJ or AMJJA) series and the relevant precipitation data during the calibration period 1928–1978 (gridded instrumental data). It is clear that the series have a similar variance. The length of the series is the primary distinction between the instrumental (gridded) and reconstructed precipitation series throughout the calibration period. The instrumental (gridded) series have increased length compared to the reconstructed series, which is more prominent in the case of MJ TRW and EWW (Figure 7b,c).

3.3. Verification with Other Existing Reconstructions

Table 3 presents the correlation coefficient between the reconstructions of our research with the existing reconstructions of precipitation based on the north Aegean [6], precipitation based on Central Europe [58], PDSI values in the summer period [55], precipitation in spring and summer [14], and the Balkan Peninsula [8,14,27,56]. Although the existing reconstruction may refer to quite different areas, variables, and monthly span periods, significant correlations appear. Based on these results, reconstructions of the present study correlated significantly (p < 0.01) during the common yearly period with the majority of the existing reconstructions referred to above. Only the MJ EWW reconstruction presents weak correlations with some of the existing series. The highest correlations are observed with the existing reconstructions of JJ PDSI of [55], spring TRW western Turkey of [8], and AMJJA TRW south-central Turkey of [14].
The low (but already significant) correlation coefficients between the present TRW reconstructions and the MXD reconstructions of [27] are noticeable. Although there are several common tree-ring chronologies (Menalon, Panetoliko, Vihren, and Sparti) used by both reconstructions, the relevant correlation coefficients were expected to be higher than the existing values. However, a moving average filter (5, 10, and 20 year) between both the reconstruction of the present study and the reconstruction of [27] finally resulted in a significant increase in the relevant correlation coefficients (Table S1, Figure S1, Supplementary Material). This led to a conclusion of a common and robust reconstruction performance on low-frequency precipitation variations (long-term mean precipitation variations).
When filtering only the reconstructions of [27] with a 5-year moving average (an actually low pass filter, Figure S1, Supplementary Material), the correlation coefficient between the reconstructions increased (it almost double). Reversely, filtering only the reconstructions of the present study with a 5-year moving average does not lead to a substantial increase in the correlation coefficient. Also, implementation of a 10-year moving average alternately does not differ gradually in any case, whereas a 20-year moving average removes the correlation. This final observation may present a different environmental signal between the residual version of MXD reconstructions of [27] and the TRW (present study) in the 0–0.2 frequency domain (high-frequency precipitation variations between 1 and 5 years), which may possibly be triggered by the different nature of the MXD and STD chronologies and the reference precipitation data (20CR vs. CRU) used during the calibration procedures. As indicated also by [12], residual chronologies may contain a high-frequency environmental signal. It must be noted that the low-frequency signal (corresponding to a low amplitude) of the present reconstruction is obvious in Figure 7 as well.
Finally, the consistency of the current investigation’s reconstructions of the climatic signal is confirmed by the previously noted substantial correlations between the reconstructions of the current study and the reconstructions of nearby locations. The KNMI climate explorer was used to download the existing reconstructions (http://climexp.knmi.nl, accessed on 12 October 2024) and the ITRDB database was also used https://www.ncei.noaa.gov/pub/data/paleo/treering/reconstructions/turkey, accessed on 22 November 2024).

3.4. Reconstructions and Regional Precipitation Variability

Although reconstructions of the present study differ in monthly span (AMJJA vs. MJ) and in gridded precipitation data used for their calibration (20CRV3, GPCCv2020, and CRU TS4.07), there exist significant correlation between them (Table 4). EWW reconstruction reveals slightly lower correlation with the other two. Although the two relevant MJ reconstructions were based on different proxy data chronologies and quite different tree-ring sites and calibration gridded data, the value of R (0.70) between them is high enough to ensure the consistency of the developing procedure and their common environmental signal.
A simple test for addressing the reconstructions’ ability to describe the high-frequency precipitation variability was performed, calculating the SD of the difference between the current and the previous year of each reconstruction. Results showed that the SD of AMJJA TRW reconstruction is almost half the SD of MJ TRW (0.21 vs. 0.41), whereas the SD of MJ EWW is the highest (0.58). It is evident that residual MJ EWW reconstructions may contain higher frequency environmental signals than the others. This is possibly influenced by the use of the residual version of chronologies to obtain the relevant reconstruction [12] as well.
Reconstruction also correlated highly and significantly with the regional (AMJJA or MJ) gridded precipitation data of Greece (period 1928–1978), with coefficients R = 0.66 (AMJJA TRW), R = 0.64 (MJ TRW), and R = 0.65 (MJ EWW), as well. The three reconstructions represent almost the same spatial extent. This notably high regional signal of reconstructions containing chronologies from different climatic zones (i.e., Vihren chronology-alpine climate zone) is not something new [8,9,10,20,26,27].
A periodogram (power spectra, Figure 8) of the reconstructed series showed several significant (p < 0.05) cyclic signals. The most significant of them existed in 19.57, 12.45, and 2.21 years (peaks of diagrams) for the AMJJA TRW, MJ TRW, and MJ EWW reconstructions, respectively. Several common significant cycling signals occurred between 3 and 19 years as well (Table 5, characters with italics). The lower-cycle periodic significant signals of the MJ EWW reconstruction may ensure the ability to capture the high-frequency environmental variation, as is noted above.
The straightforward and widely accepted standard deviation (SD) classification criteria [13,26,57,59,60,61] was applied in order to confirm the dry/wet events of the current study. There were two phases to the process. Initially, the standard deviation (SD) was used to divide the difference between the precipitation of the current year and the average precipitation of the reconstructed chronologies. In the literature, these numbers are frequently referred to as the standard deviation precipitation abnormalities. Values which exceed the 2 SD threshold are denoted as extremely wet events, whereas values between 1 SD and 2 SD are denoted as wet events. Similar values between −1 SD and −2 SD, and values less than −2 SD are denoted as dry or extremely dry events as well.
Table 6 presents the dry/wet years for each reconstruction according to classification criteria of the SD. Bold characters denoted years with common observations of drought or wetness by existing reconstruction from the literature. Analytical references for verified events by the available studies are presented in Table S3, (Supplementary Material). Some of the available reconstructions from the literature were based on several common tree-ring arrays but different proxy data (MXD-[27]) or common tree-ring arrays and proxy data chronologies (i.e., TRW-[23], TRW-[20]). For the case of TRW reconstructions, there is a balance between the wet and dry events, with the number of wet years being slightly higher than drought years. The same occurred during the extremely wet and extremely dry years. EWW reconstruction presented more drought years than wet years and more extremely wet years than extremely dry years. The years of 1885 and 1913 were by far the years with the most extreme wet threshold during the period under consideration, whereas 1894 and 1895 were the most extreme drought years of the TRW reconstructions. Similarly, 1865, 1884, 1877, and 1861, 1869, 1871 were the most extremely wet and dry years of the EWW reconstructions, respectively. The most extreme dry/wet years referred above were also recognized by at least one reference study, except for 1895 (extreme dry for TRW MJ) and 1871 (extreme dry for EWW MJ).
In general, an overall verification of drought and flood events between reconstructions of the present study and by at least one other reconstruction of neighboring areas derived from the literature (years with bold characters), led to values of 72.5%, 69%, and 64% for the TRW AMJJA, TRW MJ, and EWW MJ, respectively. These values increase gradually in the case of extreme wet and dry events to 92%, 78%, and 90%.
Concerning the driest/wettest periods lasting for 5, 10, and 20 years (Figure 6), we obtain the following:
TRW AMJJA: 1892–1896 and 1911–1915 (5 y), 1887–1896 and 1813–1822 (10 y), 1879–1898 and 1809–1828 (20 y).
TRW MJ: 1892–1896 and 1812–1816 (5 y), 1887–1896 and 1813–1822 (10 y), 1879–1898 and 1809–1828 (20 y).
EWW MJ: 1867–1871 and 1862–1866 (5 y), 1925–1934 and 1857–1866 (10 y), 1927–1946 and 1901–1919 (20 y).
The 10-year dry period observed by TRW reconstructions almost coincides with the relevant period highlighted by [62]. Likewise with the wet 20-year period of EWW reconstruction was also verified by [12].

4. Conclusions

In this work, eight tree-ring chronologies (Pinus sp. and Abies sp.) with a span time of 1657–2020 were used to provide a complete dendroclimatic reconstruction of precipitation variability in central Greece. Reliable reconstructions for AMJJA (April–August) and MJ (May–June) precipitation were constructed using standardized (TRW) and residual (EWW) chronologies and gridded climate data (20CRv3, GPCC v2020, CRU TS 4.07). The reconstructions revealed high- and low-frequency climatic signals, and were consistent with previous paleoclimate studies, explaining 45% of precipitation variance.
The results showed that tree growth is sensitive to spring–summer moisture availability, with TRW chronologies showing significant correlation with both MJ precipitation (GPCC) and AMJJA precipitation (20CRv3). EWW chronology presented more noise, however it showed clear high-frequency signals which may represent the cambial reaction to seasonal water stresses. A total of 72%–92% of extreme years were confirmed, while it was important to validate extreme dry/wet occurrences using previous reconstructions that were supported by independent research, such as the severe droughts of 1894–1895 and the exceptionally wet years of 1885 and 1913.
The main limitations of the study were the short length of instrumental data compared to tree-ring time series, which is a frequent problem in dendroclimatology, and the limited sample depth beyond 1978. The necessity for increased spatial sampling to improve signal strength was shown by the removal of some chronologies because of low RE values.
This work enhanced our knowledge about the variability of the Mediterranean hydroclimate and revealed the utility of tree-rings in reconstructing historical precipitation patterns. The results highlighted the susceptibility to droughts and floods and showed past extreme events and climate cycles in the specific region, which are crucial factors for managing water resources under climate variability conditions.

Supplementary Materials

The following supporting information can be downloaded at: https://www.mdpi.com/article/10.3390/f16050773/s1, Figure S1: 10 year moving averaged of the Normalized reconstruction of the present study relative to (a) Greece MXD JJA reconstruction (Sakalis 2025) and (b) Tripoli MXD AMJJA reconstructions (Sakalis 2025). Bold characters denote significant values (p < 0.05); Table S1: Pearson correlation coefficient between the present reconstructions and reconstructions of JJA Greece (Sakalis 2025), in various moving averaged versions. Bold characters denote significant values (p < 0.05); Table S2: Pearson correlation coefficient between the present reconstructions and reconstructions of Sakalis (2025) in various moving averaged versions. Bold characters denote significant values (p < 0.05); Table S3: The complete wet/dry events of the present reconstructions and the relevant verification information from the available literature.

Author Contributions

Conceptualization, V.D.S.; methodology, V.D.S. and A.K.; software, V.D.S.; validation, V.D.S. and A.K.; formal analysis, V.D.S. and A.K.; investigation, V.D.S.; resources, V.D.S. and A.K.; data curation, V.D.S.; writing—original draft preparation, V.D.S. and A.K.; writing—review and editing, V.D.S. and A.K.; visualization, V.D.S.; supervision, V.D.S. All authors have read and agreed to the published version of the manuscript.

Funding

This research received no external funding.

Data Availability Statement

The data that support the findings of this study are available from the corresponding author upon reasonable request.

Conflicts of Interest

Author Vasileios D. Sakalis was employed by the Northern Kynouria Municipal Water Supply and Sewerage Company. The remaining authors declare that the research was conducted in the absence of any commercial or financial relationships that could be construed as a potential conflict of interest.

References

  1. Maheras, P.; Xoplaki, E.; Kutiel, H. Wet and Dry Monthly Anomalies Across the Mediterranean Basin and Their Relationship with Circulation, 1860–1990. Theor. Appl. Climatol. 1999, 64, 189–199. [Google Scholar] [CrossRef]
  2. Luckman, B.H. Dendroclimatology. In Encyclopedia of Quaternary Science; Elsevier: Amsterdam, The Netherlands, 2013; pp. 459–470. [Google Scholar]
  3. Poljanšek, S.; Ceglar, A.; Levanič, T. Long-Term Summer Sunshine/Moisture Stress Reconstruction from Tree-Ring Widths from Bosnia and Herzegovina. Clim. Past 2013, 9, 27–40. [Google Scholar] [CrossRef]
  4. Esper, J.; Konter, O.; Klippel, L.; Krusic, P.J.; Büntgen, U. Pre-instrumental Summer Precipitation Variability in Northwestern Greece from a High-elevation Pinus heldreichii Network. Int. J. Climatol. 2021, 41, 2828–2839. [Google Scholar] [CrossRef]
  5. Klippel, L.; Krusic, P.J.; Brandes, R.; Hartl-Meier, C.; Trouet, V.; Meko, M.; Esper, J. High-Elevation Inter-Site Differences in Mount Smolikas Tree-Ring Width Data. Dendrochronologia 2017, 44, 164–173. [Google Scholar] [CrossRef]
  6. Griggs, C.; Pearson, C.; Manning, S.W.; Lorentzen, B. A 250-Year Annual Precipitation Reconstruction and Drought Assessment for Cyprus from Pinus brutia Ten. Tree-Rings. Int. J. Climatol. 2014, 34, 2702–2714. [Google Scholar] [CrossRef]
  7. Griggs, C.; DeGaetano, A.; Kuniholm, P.; Newton, M. A Regional High-frequency Reconstruction of May–June Precipitation in the North Aegean from Oak Tree Rings, A.D. 1089–1989. Int. J. Climatol. 2007, 27, 1075–1089. [Google Scholar] [CrossRef]
  8. Levanič, T.; Popa, I.; Poljanšek, S.; Nechita, C. A 323-Year Long Reconstruction of Drought for SW Romania Based on Black Pine (Pinus nigra) Tree-Ring Widths. Int. J. Biometeorol. 2013, 57, 703–714. [Google Scholar] [CrossRef]
  9. Touchan, R.; Xoplaki, E.; Funkhouser, G.; Luterbacher, J.; Hughes, M.K.; Erkan, N.; Akkemik, Ü.; Stephan, J. Reconstructions of Spring/Summer Precipitation for the Eastern Mediterranean from Tree-Ring Widths and Its Connection to Large-Scale Atmospheric Circulation. Clim. Dyn. 2005, 25, 75–98. [Google Scholar] [CrossRef]
  10. Touchan, R.; Anchukaitis, K.J.; Shishov, V.V.; Sivrikaya, F.; Attieh, J.; Ketmen, M.; Stephan, J.; Mitsopoulos, I.; Christou, A.; Meko, D.M. Spatial Patterns of Eastern Mediterranean Climate Influence on Tree Growth. Holocene 2014, 24, 381–392. [Google Scholar] [CrossRef]
  11. Trouet, V. A Tree-Ring Based Late Summer Temperature Reconstruction (AD 1675–1980) for the Northeastern Mediterranean. Radiocarbon 2014, 56, S69–S78. [Google Scholar] [CrossRef]
  12. Klesse, S.; Ziehmer, M.; Rousakis, G.; Trouet, V.; Frank, D. Synoptic Drivers of 400 Years of Summer Temperature and Precipitation Variability on Mt. Olympus, Greece. Clim. Dyn. 2015, 45, 807–824. [Google Scholar] [CrossRef]
  13. Akkemik, Ü.; D’Arrigo, R.; Cherubini, P.; Köse, N.; Jacoby, G.C. Tree-Ring Reconstructions of Precipitation and Streamflow for North-Western Turkey. Int. J. Climatol. 2008, 28, 173–183. [Google Scholar] [CrossRef]
  14. Akkemik, Ü.; Dağdeviren, N.; Aras, A. A Preliminary Reconstruction (A.D. 1635–2000) of Spring Precipitation Using Oak Tree Rings in the Western Black Sea Region of Turkey. Int. J. Biometeorol. 2005, 49, 297–302. [Google Scholar] [CrossRef] [PubMed]
  15. Akkemik, U.; Aras, A. Reconstruction (1689–1994 AD) of April-August Precipitation in the Southern Part of Central Turkey. Int. J. Climatol. 2005, 25, 537–548. [Google Scholar] [CrossRef]
  16. Köse, N.; Akkemik, Ü.; Güner, H.T.; Dalfes, H.N.; Grissino-Mayer, H.D.; Özeren, M.S.; Kındap, T. An Improved Reconstruction of May–June Precipitation Using Tree-Ring Data from Western Turkey and Its Links to Volcanic Eruptions. Int. J. Biometeorol. 2013, 57, 691–701. [Google Scholar] [CrossRef]
  17. Köse, N.; Akkemik, Ü.; Dalfes, H.N.; Özeren, M.S. Tree-Ring Reconstructions of May–June Precipitation for Western Anatolia. Quat. Res. 2011, 75, 438–450. [Google Scholar] [CrossRef]
  18. Christopoulou, A.; Fyllas, N.M.; Gmińska-Nowak, B.; Özarslan, Y.; Arianoutsou, M.; Brandes, R.; Ważny, T. Exploring the Past of Mavrovouni Forest in the Pindus Mountain Range (Greece) Using Tree Rings of Bosnian Pines. Trees 2022, 36, 153–166. [Google Scholar] [CrossRef]
  19. Papadopoulos, A. Tree-Ring Patterns and Climate Response of Mediterranean Fir Populations in Central Greece. Dendrochronologia 2016, 40, 17–25. [Google Scholar] [CrossRef]
  20. Panayotov, M.; Bebi, P.; Trouet, V.; Yurukov, S. Climate Signal in Tree-Ring Chronologies of Pinus peuce and Pinus heldreichii from the Pirin Mountains in Bulgaria. Trees 2010, 24, 479–490. [Google Scholar] [CrossRef]
  21. Hughes, M.K.; Kuniholm, P.; Eischeid, J.K.; Garfin, G.M.; Griggs, C.B.; Latini, C.E. Aegean Tree-Ring Signature Years Explained. Tree-Ring Res. 2001, 57, 67–73. [Google Scholar]
  22. Genç, S.; Güner, H.T. Precipitation and Streamflow Reconstructions from Tree Rings for the Lower Kızılırmak River Basin, Turkey. Forests 2022, 13, 501. [Google Scholar] [CrossRef]
  23. Cook, E.R.; Seager, R.; Kushnir, Y.; Briffa, K.R.; Büntgen, U.; Frank, D.; Krusic, P.J.; Tegel, W.; van der Schrier, G.; Andreu-Hayles, L.; et al. Old World Megadroughts and Pluvials during the Common Era. Sci. Adv. 2015, 1, 1500561. [Google Scholar] [CrossRef]
  24. Kastridis, A.; Kamperidou, V.; Stathis, D. Dendroclimatological Analysis of Fir (A. borisii-regis) in Greece in the Frame of Climate Change Investigation. Forests 2022, 13, 879. [Google Scholar] [CrossRef]
  25. Seim, A.; Büntgen, U.; Fonti, P.; Haska, H.; Herzig, F.; Tegel, W.; Trouet, V.; Treydte, K. Climate Sensitivity of a Millennium-Long Pine Chronology from Albania. Clim. Res. 2012, 51, 217–228. [Google Scholar] [CrossRef]
  26. Seim, A.; Treydte, K.; Trouet, V.; Frank, D.; Fonti, P.; Tegel, W.; Panayotov, M.; Fernández-Donado, L.; Krusic, P.; Büntgen, U. Climate Sensitivity of Mediterranean Pine Growth Reveals Distinct East-West Dipole. Int. J. Climatol. 2015, 35, 2503–2513. [Google Scholar] [CrossRef]
  27. Klippel, L.; Krusic, P.J.; Brandes, R.; Hartl, C.; Belmecheri, S.; Dienst, M.; Esper, J. A 1286-year Hydro-climate Reconstruction for the Balkan Peninsula. Boreas 2018, 47, 1218–1229. [Google Scholar] [CrossRef]
  28. Sakalis, V.D. Reconstructing the Rainfall Series of the Greek and Balkan Peninsula since 1595 A.D Based on Tree-Ring Data and Historical Evidence Verification. Rend. Lincei Sci. Fis. Nat. 2025, 1–39. [Google Scholar] [CrossRef]
  29. Harris, I.; Osborn, T.J.; Jones, P.; Lister, D. Version 4 of the CRU TS Monthly High-Resolution Gridded Multivariate Climate Dataset. Sci. Data 2020, 7, 109. [Google Scholar] [CrossRef]
  30. Blasing, T.J.; Duvick, D.N.; West, D.C. Dendroclimatic Calibration and Verification Using Regionally Averaged and Single Station Precipitation Data. Tree-Ring Bull. 1981, 41, 38–43. [Google Scholar]
  31. Tejedor, E.; Saz, M.Á.; Cuadrat, J.M.; Esper, J.; de Luis, M. Temperature Variability in the Iberian Range since 1602 Inferred from Tree-Ring Records. Clim. Past 2017, 13, 93–105. [Google Scholar] [CrossRef]
  32. Schneider, L.; Ljungqvist, F.C.; Yang, B.; Chen, F.; Chen, J.; Li, J.; Hao, Z.; Ge, Q.; Talento, S.; Osborn, T.J.; et al. The Impact of Proxy Selection Strategies on a Millennium-Long Ensemble of Hydroclimatic Records in Monsoon Asia. Quat. Sci. Rev. 2019, 223, 105917. [Google Scholar] [CrossRef]
  33. Ljungqvist, F.C.; Piermattei, A.; Seim, A.; Krusic, P.J.; Büntgen, U.; He, M.; Kirdyanov, A.V.; Luterbacher, J.; Schneider, L.; Seftigen, K.; et al. Ranking of Tree-Ring Based Hydroclimate Reconstructions of the Past Millennium. Quat. Sci. Rev. 2020, 230, 106074. [Google Scholar] [CrossRef]
  34. Slivinski, L.C.; Compo, G.P.; Whitaker, J.S.; Sardeshmukh, P.D.; Giese, B.S.; McColl, C.; Allan, R.; Yin, X.; Vose, R.; Titchner, H.; et al. Towards a More Reliable Historical Reanalysis: Improvements for Version 3 of the Twentieth Century Reanalysis System. Q. J. R. Meteorol. Soc. 2019, 145, 2876–2908. [Google Scholar] [CrossRef]
  35. Holmes, R.L. Computer-Assisted Quality Control in Tree-Ring Dating and Measurement. Tree-Ring Bull. 1983, 43, 69–78. [Google Scholar]
  36. Grissino-Mayer, H.D. Evaluating Crossdating Accuracy: A Manual and Tutorial for the Computer Program COFECHA. Tree-Ring Res. 2001, 57, 205–221. [Google Scholar]
  37. Cook, E.R.; Holmes, R.L. Users Manual for Program ARSTAN. In Tree-Ring Chronologies of Western North America: California, Eastern Oregon and Northern Great Basin; Laboratory of Tree-Ring Research, University of Arizona: Tucson, AZ, USA, 1986; pp. 50–65. [Google Scholar]
  38. Fritts Harold, C. Tree Rings and Climate; Academic Press: Cambridge, MA, USA, 1976; ISBN 9780122684500. [Google Scholar]
  39. Schneider, U.; Becker, A.; Finger, P.; Meyer-Christoffer, A.; Ziese, M.; Rudolf, B. GPCC’s New Land Surface Precipitation Climatology Based on Quality-Controlled in Situ Data and Its Role in Quantifying the Global Water Cycle. Theor. Appl. Climatol. 2014, 115, 15–40. [Google Scholar] [CrossRef]
  40. Becker, A.; Finger, P.; Meyer-Christoffer, A.; Rudolf, B.; Schamm, K.; Schneider, U.; Ziese, M. A Description of the Global Land-Surface Precipitation Data Products of the Global Precipitation Climatology Centre with Sample Applications Including Centennial (Trend) Analysis from 1901–Present. Earth Syst. Sci. Data 2013, 5, 71–99. [Google Scholar] [CrossRef]
  41. Compo, G.P.; Whitaker, J.S.; Sardeshmukh, P.D.; Matsui, N.; Allan, R.J.; Yin, X.; Gleason, B.E.; Vose, R.S.; Rutledge, G.; Bessemoulin, P.; et al. The Twentieth Century Reanalysis Project. Q. J. R. Meteorol. Soc. 2011, 137, 1–28. [Google Scholar] [CrossRef]
  42. Zhang, L.; Liu, Y.; Zheng, J.; Hao, Z. The Summer Standardized Precipitation Evapotranspiration Index (SPEI) Dataset for Six European Regions over the Past Millennium Reconstructed by Tree-Ring Chronologies. Big Earth Data 2023, 7, 1146–1168. [Google Scholar] [CrossRef]
  43. Cook, R.E.; Kairiukstis, A.L. (Eds.) Methods of Dendrochronology; Springer: Dordrecht, The Netherlands, 1990; ISBN 978-90-481-4060-2. [Google Scholar]
  44. Cook, E.R.; Palmer, J.G.; Cook, B.I.; Hogg, A.; D’Arrigo, R.D. A Multi-Millennial Palaeoclimatic Resource from Lagarostrobos Colensoi Tree-Rings at Oroko Swamp, New Zealand. Glob. Planet. Change 2002, 33, 209–220. [Google Scholar] [CrossRef]
  45. Fritts, H.C.; Guiot, J.; Gordon, G.A.; Schweingruber, F. Methods of Calibration, Verification, and Reconstruction. In Methods of Dendrochronology; Springer: Dordrecht, The Netherlands, 1990; pp. 163–217. [Google Scholar]
  46. Waszak, N.; Robertson, I.; Puchałka, R.; Przybylak, R.; Pospieszyńska, A.; Koprowski, M. Investigating the Climate-Growth Response of Scots Pine (Pinus sylvestris L.) in Northern Poland. Atmosphere 2021, 12, 1690. [Google Scholar] [CrossRef]
  47. Stathi, E.; Kastridis, A.; Myronidis, D. Analysis of Hydrometeorological Characteristics and Water Demand in Semi-Arid Mediterranean Catchments under Water Deficit Conditions. Climate 2023, 11, 137. [Google Scholar] [CrossRef]
  48. Stathi, E.; Kastridis, A.; Myronidis, D. Analysis of Hydrometeorological Trends and Drought Severity in Water-Demanding Mediterranean Islands under Climate Change Conditions. Climate 2023, 11, 106. [Google Scholar] [CrossRef]
  49. Camarero, J.J.; Gazol, A.; Sangüesa-Barreda, G.; Oliva, J.; Vicente-Serrano, S.M. To Die or Not to Die: Early Warnings of Tree Dieback in Response to a Severe Drought. J. Ecol. 2015, 103, 44–57. [Google Scholar] [CrossRef]
  50. Camarero, J.J.; Rubio-Cuadrado, Á. Relating Climate, Drought and Radial Growth in Broadleaf Mediterranean Tree and Shrub Species: A New Approach to Quantify Climate-Growth Relationships. Forests 2020, 11, 1250. [Google Scholar] [CrossRef]
  51. Subotić, J.; Dukić, V.; Popov, T.; Trbić, G.; Maunaga, Z.; Petrović, D. Relationships Between Climatic Variables and Tree-Ring Width of Silver Fir (Abies alba Mill.) in Kozara National Park (Bosnia and Herzegovina). South-East Eur. For. 2020, 11, 17–27. [Google Scholar] [CrossRef]
  52. Linares, J.C.; Camarero, J.J.; Carreira, J.A. Plastic Responses of Abies pinsapo Xylogenesis to Drought and Competition. Tree Physiol. 2009, 29, 1525–1536. [Google Scholar] [CrossRef]
  53. Carrer, M.; Nola, P.; Motta, R.; Urbinati, C. Contrasting Tree-Ring Growth to Climate Responses of Abies Alba toward the Southern Limit of Its Distribution Area. Oikos 2010, 119, 1515–1525. [Google Scholar] [CrossRef]
  54. Walder, D.; Krebs, P.; Bugmann, H.; Manetti, M.C.; Pollastrini, M.; Anzillotti, S.; Conedera, M. Silver Fir (Abies alba Mill.) Is Able to Thrive and Prosper under Meso-Mediterranean Conditions. For. Ecol. Manag. 2021, 498, 119537. [Google Scholar] [CrossRef]
  55. Tejedor, E.; de Luis, M.; Cuadrat, J.M.; Esper, J.; Saz, M.Á. Tree-Ring-Based Drought Reconstruction in the Iberian Range (East of Spain) since 1694. Int. J. Biometeorol. 2016, 60, 361–372. [Google Scholar] [CrossRef]
  56. Pauling, A.; Luterbacher, J.; Casty, C.; Wanner, H. Five Hundred Years of Gridded High-Resolution Precipitation Reconstructions over Europe and the Connection to Large-Scale Circulation. Clim. Dyn. 2006, 26, 387–405. [Google Scholar] [CrossRef]
  57. Cook, E.R.; Woodhouse, C.A.; Eakin, C.M.; Meko, D.M.; Stahle, D.W. Long-Term Aridity Changes in the Western United States. Science 2004, 306, 1015–1018. [Google Scholar] [CrossRef] [PubMed]
  58. D’Arrigo, R.; Cullen, H.M. A 350-Year (AD 1628–1980) Reconstruction of Turkish Precipitation. Dendrochronologia 2001, 19, 169–177. [Google Scholar]
  59. Wigley, T.M.L.; Briffa, K.R.; Jones, P.D. On the Average Value of Correlated Time Series, with Applications in Dendroclimatology and Hydrometeorology. J. Clim. Appl. Meteorol. 1984, 23, 201–213. [Google Scholar] [CrossRef]
  60. Xoplaki, E.; Maheras, P.; Luterbacher, J. Variability of Climate in Meridional Balkans during the Periods 1675–1715 and 1780–1830 and Its Impact on Human Life. Clim. Change 2001, 48, 581–615. [Google Scholar] [CrossRef]
  61. Camuffo, D.; Bertolin, C.; Barriendos, M.; Dominguez-Castro, F.; Cocheo, C.; Enzi, S.; Sghedoni, M.; Della Valle, A.; Garnier, E.; Alcoforado, M.J.; et al. 500-Year Temperature Reconstruction in the Mediterranean Basin by Means of Documentary Data and Instrumental Observations. Clim. Change 2010, 101, 169–199. [Google Scholar] [CrossRef]
  62. Roibu, C.C.; Nagavciuc, V.; Ionita, M.; Popa, I.; Horodnic, S.A.; Mursa, A.; Büntgen, U. A Tree Ring-Based Hydroclimate Reconstruction for Eastern Europe Reveals Large-Scale Teleconnection Patterns. Clim. Dyn. 2022, 59, 2979–2994. [Google Scholar] [CrossRef]
Figure 1. Map of the study area. Green locations refer to the areas of the available dendrochronology time series. Red square refers to the area (latitude 39–40°, longitude 21–23°) of central Greece, where the gridded precipitation data are averaged.
Forests 16 00773 g001
Figure 2. The available standard TRW chronologies (ah), used for the development of TRW AMJJA and MJ reconstructions, (i) refers to the AMJJA yearly samples and (j) refers to MJ yearly samples.
Forests 16 00773 g002
Figure 3. The available residual EWW chronologies (ae) and the relevant yearly available (samples) (f) used for the development of the EWW MJ reconstruction.
Forests 16 00773 g003
Figure 4. The calculated values of running EPS using (a) reanalysis of TRW AMJJA, and the Global Precipitation Climatology Centre (GPCCV2020) TRW MJ reconstructions, and (b) Climate Research Unit (CRU TSv4.07) EWW reconstruction. Critical values for EPS > 0.85 correspond to the years 1746 and 1815, for TRW and EWW reconstructions (blue dash lines), respectively.
Forests 16 00773 g004
Figure 5. Growth–climate response patterns (Pearson correlation coefficients) between (a) the TRW chronologies used for the AMJJA reconstruction, (b) the TRW chronologies used for the MJ reconstruction, and (c) the EWW chronologies used for the MJ reconstructions, respectively. Dashed black lines denote probabilities of p = 0.1 and p = 0.05. The symbol “-” indicates the month of the previous year.
Forests 16 00773 g005aForests 16 00773 g005b
Figure 6. The resulting precipitation reconstructions (a) TRW MJ reconstruction based on GPCCv2020, (b) TRW AMJJA based on 20CRv3, and (c) EWW based on CRU TSv4.07. The values of the 5-, 10-, and 20-year moving average are indicated by red, blue, and green lines, respectively. Horizontal lines indicate the ±2 SD and ±1 SD. The vertical lines of (a,b) denote first years with EPS > 0.85.
Forests 16 00773 g006
Figure 7. Reconstructed chronologies (blue lines, (a,c,e)) and the relevant gridded instrumental precipitation series (red dotted lines) of the calibration period. The right column (b,d,f) refers to the correlation coefficient between reconstructed and gridded instrumental data.
Forests 16 00773 g007
Figure 8. Power spectra relative to yearly period for (a) TRW MJ, (b) EWW MJ, and (c) TRW AMJJA series (calculation was based on KNMI climate explorer portal, http://climexp.knmi.nl, accessed on 12 October 2024, accessed on 13 February 2025).
Forests 16 00773 g008
Table 1. The tree-ring time series chronologies utilized in the current study, based on the ITRDB databank * (https://www.ncei.noaa.gov/products/paleoclimatology/tree-ring, accessed on 14 October 2024), except the Pertouli forest chronology. The truncated period was used in the study.
NoLatitudeLongitudeAltitude
(m)
SiteSpeciesAvailabilityProxy VariableOriginal
Period
Truncated Period *Chronology doi Number
137.0822.331.106Sparta
(Langada)
Pinus nigra subsp. nigraStandard, ARSTAN, residualTRW, EWW1825–19801833–1978https://doi.org/10.25921/jpm4-p943
237.6322.281.322Menalon OrosAbies cephalonica LoudonStandard, ARSTAN, residualTRW, EWW1832–19801833–1978https://doi.org/10.25921/gpe0-0t88
338.7221.671407Panetolikon-OrosAbies borisii regis Mattf.Standard, ARSTAN, residualTRW, EWW1812–19801812–1978https://doi.org/10.25921/tf06-v979
441.7723.382.100Vihren National ParkPinus leucodermis H. Christ.Standard, ARSTAN, residualTRW, EWW1721–19801722–1978https://doi.org/10.25921/fech-b460
536.9222.951.400Taygetos ForestPinus nigra subsp. nigraStandardTRW1657–19991657–1999https://doi.org/10.25921/v2v4-r670
640.320.91500Scotida Forest (1)Abies cephalonica Loudon StandardTRW1676–19781676–1978https://doi.org/10.25921/mdh4-e656
740.320.91500Scotida Forest (2)Pinus nigra subsp. nigraStandardTRW1751–20031751–1999https://doi.org/10.25921/zqwn-3r45
839.5421.451200–1500Pertouli ForestAbies borisii-regis Mattf.Standard, ARSTAN, residualTRW, EWW1833–20201833–2020https://doi.org/10.3390/f13060879
Table 2. Analyzing the current reconstructions by splitting the calibration–verification period. Lines with italics correspond to periods which finally were excluded from the procedure (not accepted by the relevant criteria).
ReconstructionPeriodNumber of PCCalibrationVerificationRFRERegression LineR2R (Probability)FAcceptance
AMJJA (20th Reanalysis)1929–202011929–19531954–19780.486.80.22256.01 × PC1 − 24.484870.310.56 (2.5 × 10⁻⁵)21.8OK
1954–19781929–19530.6517.10.39
1929–199931929–19531954–19780.5510.20.32226.88 + 22.47 × PC1 − 21.13 × PC30.360.60 (3.5 × 10⁻⁶)27.47OK
1954–19781929–19530.424.90.22
1833–197851929–19531954–19780.6820.120.35233.0 + 28.93 × PC1 + 9.07 × PC20.450.67 (1.2 × 10⁻⁷)35.6OK
1954–19781929–19530.6113.220.39
1812–197841929–19531954–19780.6516.70.25238.57 + 33.27 × PC1 − 11.47 × PC30.390.62 (1.9 × 10⁻⁶)29.44OK
1954–19781929–19530.497.30.29
1751–197831929–19531954–19780.6314.70.33228.97 + 27.79 × PC1 − 23.63 × PC30.350.59 (7.7 × 10⁻⁶)25.14OK
1954–19781929–19530.507.520.16
1676–197821929–19531954–19780.5811.360.46230.075 + 37.720 × PC10.350.59 (7.5 × 10⁻⁶)25.22OK
1954–19781929–19530.507.50.20
1657–197811929–19531954–19780.5912.40.32213.03 × PC1 + 16.142840.240.49 (3.5 × 10⁻⁴)14.84OK
1954–19781929–19530.332.70.12
MJ (GPCC)1929–202011929–19531954–19780.6113.90.1171.97 × PC1 − 95.780.350.59 (7 × 10⁻⁶)25.5OK
1954–19781929–19530.6315.40.29
1929–199931929–19531954–19780.528.51−0.191.4157 × PC1 − 31.290.250.50 (2 × 10⁻⁴)16.0Not OK
1954–19781929–19530.6517.050.31
1833–197851929–19531954–19780.6113.90.171.22 + 14.53 × PC1 + 9.41 × CPC20.420.65 (3 × 10⁻⁷)35.5OK
1954–19781929–19530.6433.60.28
1812–197851929–19531954–19780.549.40.0571.97 + 18.56 × PC1 + 8.36 × PC20.390.62 (1.4 × 10⁻⁶)30.3OK
1954–19781929–19530.6012.70.29
1751–197841929–19531954–19780.538.70.1974.83 + 17.60 × PC1 − 19.01 × PC40.390.62 (1.7 × 10⁻⁶)29.7OK
1954–19781929–19530.5912.30.30
1676–197821929–19531954–19780.5610.70.1174.73 + 23.39 × PC1 − 14.68 × PC20.390.62 (5.5 × 10⁻⁷)29.8OK
1954–19781929–19530.6315.40.38
1657–197821929–19531954–19780.292.10.05105.37 × PC1 − 30.80.150.38 (7 × 10⁻³)8.00OK
1954–19781929–19530.5710.70.38
MJ (CRU)1929–202011929–19531954–19780.6113.40.27254 × PC1 − 164.560.390.62 (7 × 10⁻⁷)29.0OK
1954–19781929–19530.6718.50.40
1833–197851929–19531954–19780.486.80.090.9991 × PC1 + 0.007210.390.62 (2 × 10⁻⁶)29.3OK
1954–19781929–19530.404.20.13
1812–197821929–19531954–19780.160.62−0.31-0.130.36 (0.01)7.05Not OK
1954–19781929–19530.302.20.07
1722–197811929–19531954–19780.060.07−0.32-0.10.28 (0.05)4.18Not OK
1954–19781929–19530.445.50.034
Table 3. The resulting reconstructions and the obtained reconstructions from the literature were compared using Pearson correlation coefficients. Bold characters correspond to significant values (p < 0.05 or 95% c.l).
Reconstructions of the Present StudyGriggs et al. (2007)
(MJ) [6]
Pauling et al., 2005
(JJA) [55]
Pauling et al., 2005
(MAM) [55]
Cook et al., 2005 (PDSI)
(JJ) [56]
Akkemic and Aras 2005
(AMJJA) [14]
Akkemic Dagdeviren and Aras 2005
(MAM) [13]
Touchan et al., 2005
(MAM) [5]
Touchan et al., 2005
(MAM) Second [5]
D Arrigo and Kullen (2001) [57]Sakalis (2025)
Greece
JJA [27]
Sakalis (2025)
Trikala
JJA [27]
Sakalis (2025)
Tripoli
AMJJA [27]
GPCC MJJA PRECIPITATION0.27 (p < 6 × 10⁻⁵)0.24 (p < 3.4 × 10⁻⁴)0.18 (p < 0.0074)0.51 (p < 1.2 × 10⁻¹⁵)0.28 (p < 3.6 × 10⁻⁵)0.13 (p < 0.042)0.25 (p < 6.5 × 10⁻⁵)0.29 (p < 8.2 × 10⁻⁶)0.23 (p < 6.4 × 10⁻⁴)0.17 (p < 0.01)0.18 (p < 0.005)0.18 (p < 0.007)
REANALYSIS AMJJA PRECIPITATION0.25 (p < 1.3 × 10⁻⁴)0.26 (p < 2.4 × 10⁻⁵)0.15 (p < 0.015)0.5 (p < 1 × 10⁻²⁰)0.29 (p < 8 × 10⁻⁶)0.13 (p < 0.04)0.24 (p < 5 × 10⁻⁵)0.34 (p < 2 × 10⁻⁷)0.26 (p < 6.5 × 10⁻⁵)0.14 (p < 0.03)0.14 (p < 0.03)0.14 (p < 0.029)
EARLYWOOD MJ CRU PRECIPITATION0.30 (p < 2.9 × 10⁻⁴)0.13 (p < 0.084)0.21 (p < 0.0073)0.52 (p < 5.1 × 10⁻¹³)0.39 (p < 10 × 10−6)0.12 (p < 0.11)0.33 (p < 4.5 × 10⁻⁶)0.40 (p < 1.8 × 10⁻⁸)0.44 (p < 2.1 × 10⁻⁸)0.08 (p < 0.33)0.09 (p < 0.29)0.09 (p < 0.45)
Table 4. Pearson correlation coefficients between the calculated reconstructions of the current research.
AMJJA TRWMJ TRWMJ EWW
AMJJA TRW10.930.67
MJ TRW 10.70
MJ EWW 1
Table 5. Significant cycling signals and the relevant probability according to power spectra (Figure 8). Bold characters correspond to the most pronounced period (with the maximum probability) for each reconstruction, whereas values with italics characters correspond to common (or almost common) pronounced periods between the 3 reconstructions.
ReconstructionPeriod TProbability P
Reanalysis AMJJA precipitation
54.800530.01561
19.571390.0001
15.222320.02127
14.421070.02976
13.699940.02289
12.454540.0002
7.828590.04842
7.61110.01683
6.682930.00593
3.805550.04062
GPCC MJ Precipitation
30.444180.00991
22.833140.03905
19.571390.00194
14.421070.03196
12.454540.00131
7.025630.04313
6.682930.00455
3.914290.02663
3.805550.03906
Earlywood MJ CRU Precipitation18.600150.02078
12.400020.03086
3.957450.04443
2.619720.03652
2.214290.00119
Table 6. Dry/wet years based on present reconstruction (a simplified version of Table S3). Bold characters denote years with common observation of drought or flood by at least 1 existing reconstruction derived from the literature.
TRW AMJJA (20CRv3)TRW MJ (GPCCv2020)EWW MJ (CRUTS 4.07)
WETDRYWETDRYWETDRY
1 ≤ SD < 2SD ≥ 2−2 < SD < −1SD ≤ −21 ≤ SD < 2SD ≥ 2−2 < SD < −1SD ≤ −21 ≤ SD < 2SD ≥ 2−2 < SD < −1SD ≤ −2
174717481756177317661748175618301841185718521834
175517731767189317711799176718931842186518541861
176617991769189417921812176918941844187618581869
177118041774189518041814177318951859187718671871
179218121779190818131815177419081860188118681929
181318181782 181618181779 186618841878
181418271794 181918851782 188919151880
181518591795 182219131794 1892 1882
181918851796 182719371795 1897 1887
182219131806 1855 1796 1899 1893
182619141808 1858 1806 1900 1894
183719151810 1859 1808 1913 1895
183819751830 1860 1810 1917 1898
1842 1833 1876 1829 1920 1908
1855 1834 1877 1831 1930 1916
1858 1840 1884 1832 1936 1923
1860 1847 1899 1833 1959 1927
1876 1861 1901 1834 1960 1928
1877 1869 1912 1835 1975 1932
1884 1870 1914 1840 1979 1935
1899 1871 1915 1847 1983 1952
1900 1880 1934 1848 1998 1969
1912 1887 1936 1861 1971
1926 1896 1940 1869 2002
1936 1909 1941 1870 2006
1937 1918 1959 1875 2020
1959 1923 1960 1879
1960 1928 1975 1880
1998 1929 1979 1887
2018 1944 1983 1890
1945 1998 1891
1949 2005 1896
1969 2018 1907
1971 1909
1988 1918
2020 1923
1928
1929
1944
1945
1969
1981
2020
Disclaimer/Publisher’s Note: The statements, opinions and data contained in all publications are solely those of the individual author(s) and contributor(s) and not of MDPI and/or the editor(s). MDPI and/or the editor(s) disclaim responsibility for any injury to people or property resulting from any ideas, methods, instructions or products referred to in the content.

