
A Standardized Framework to Estimate Drought-Induced Vulnerability and Its Temporal Variation in Woody Plants Based on Growth
 , , ,
, , ,  ,
,  and
and 
Abstract
1. Introduction
2. Materials and Methods
2.1. Study Sites and Species
2.2. Dendrochronological Methods
2.3. Climate Data and Drought Index
2.4. Statistical Analysis
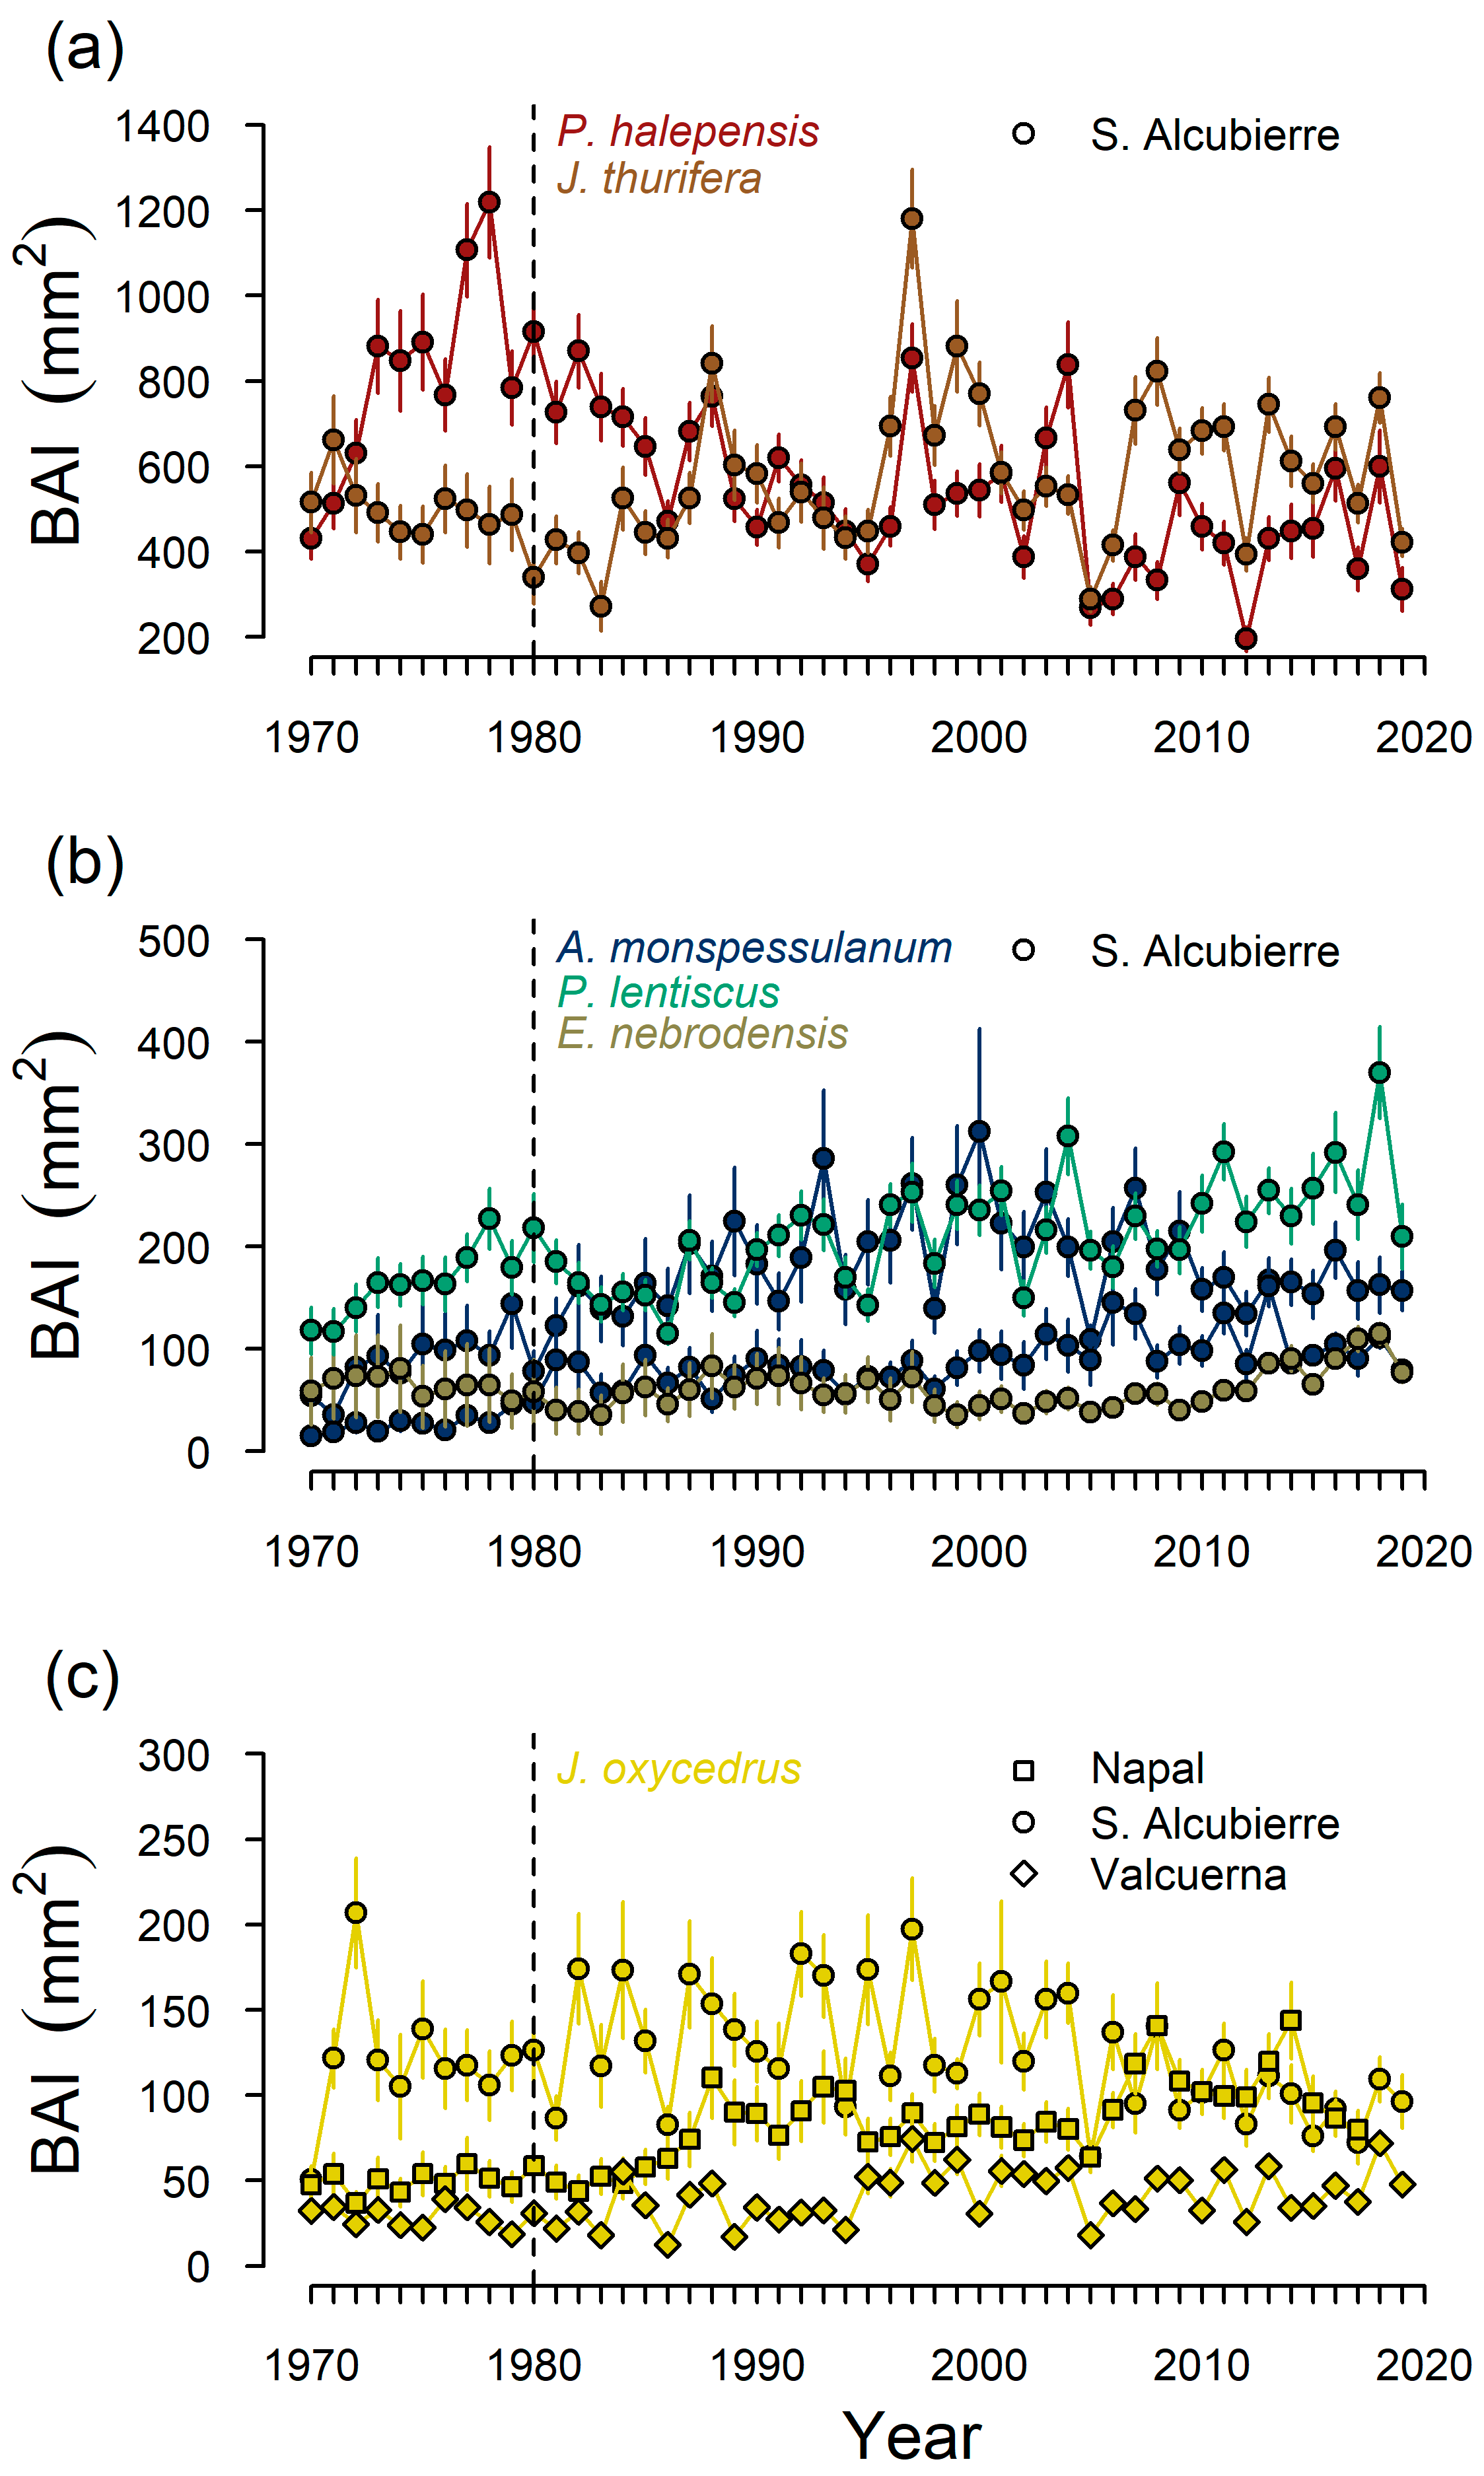
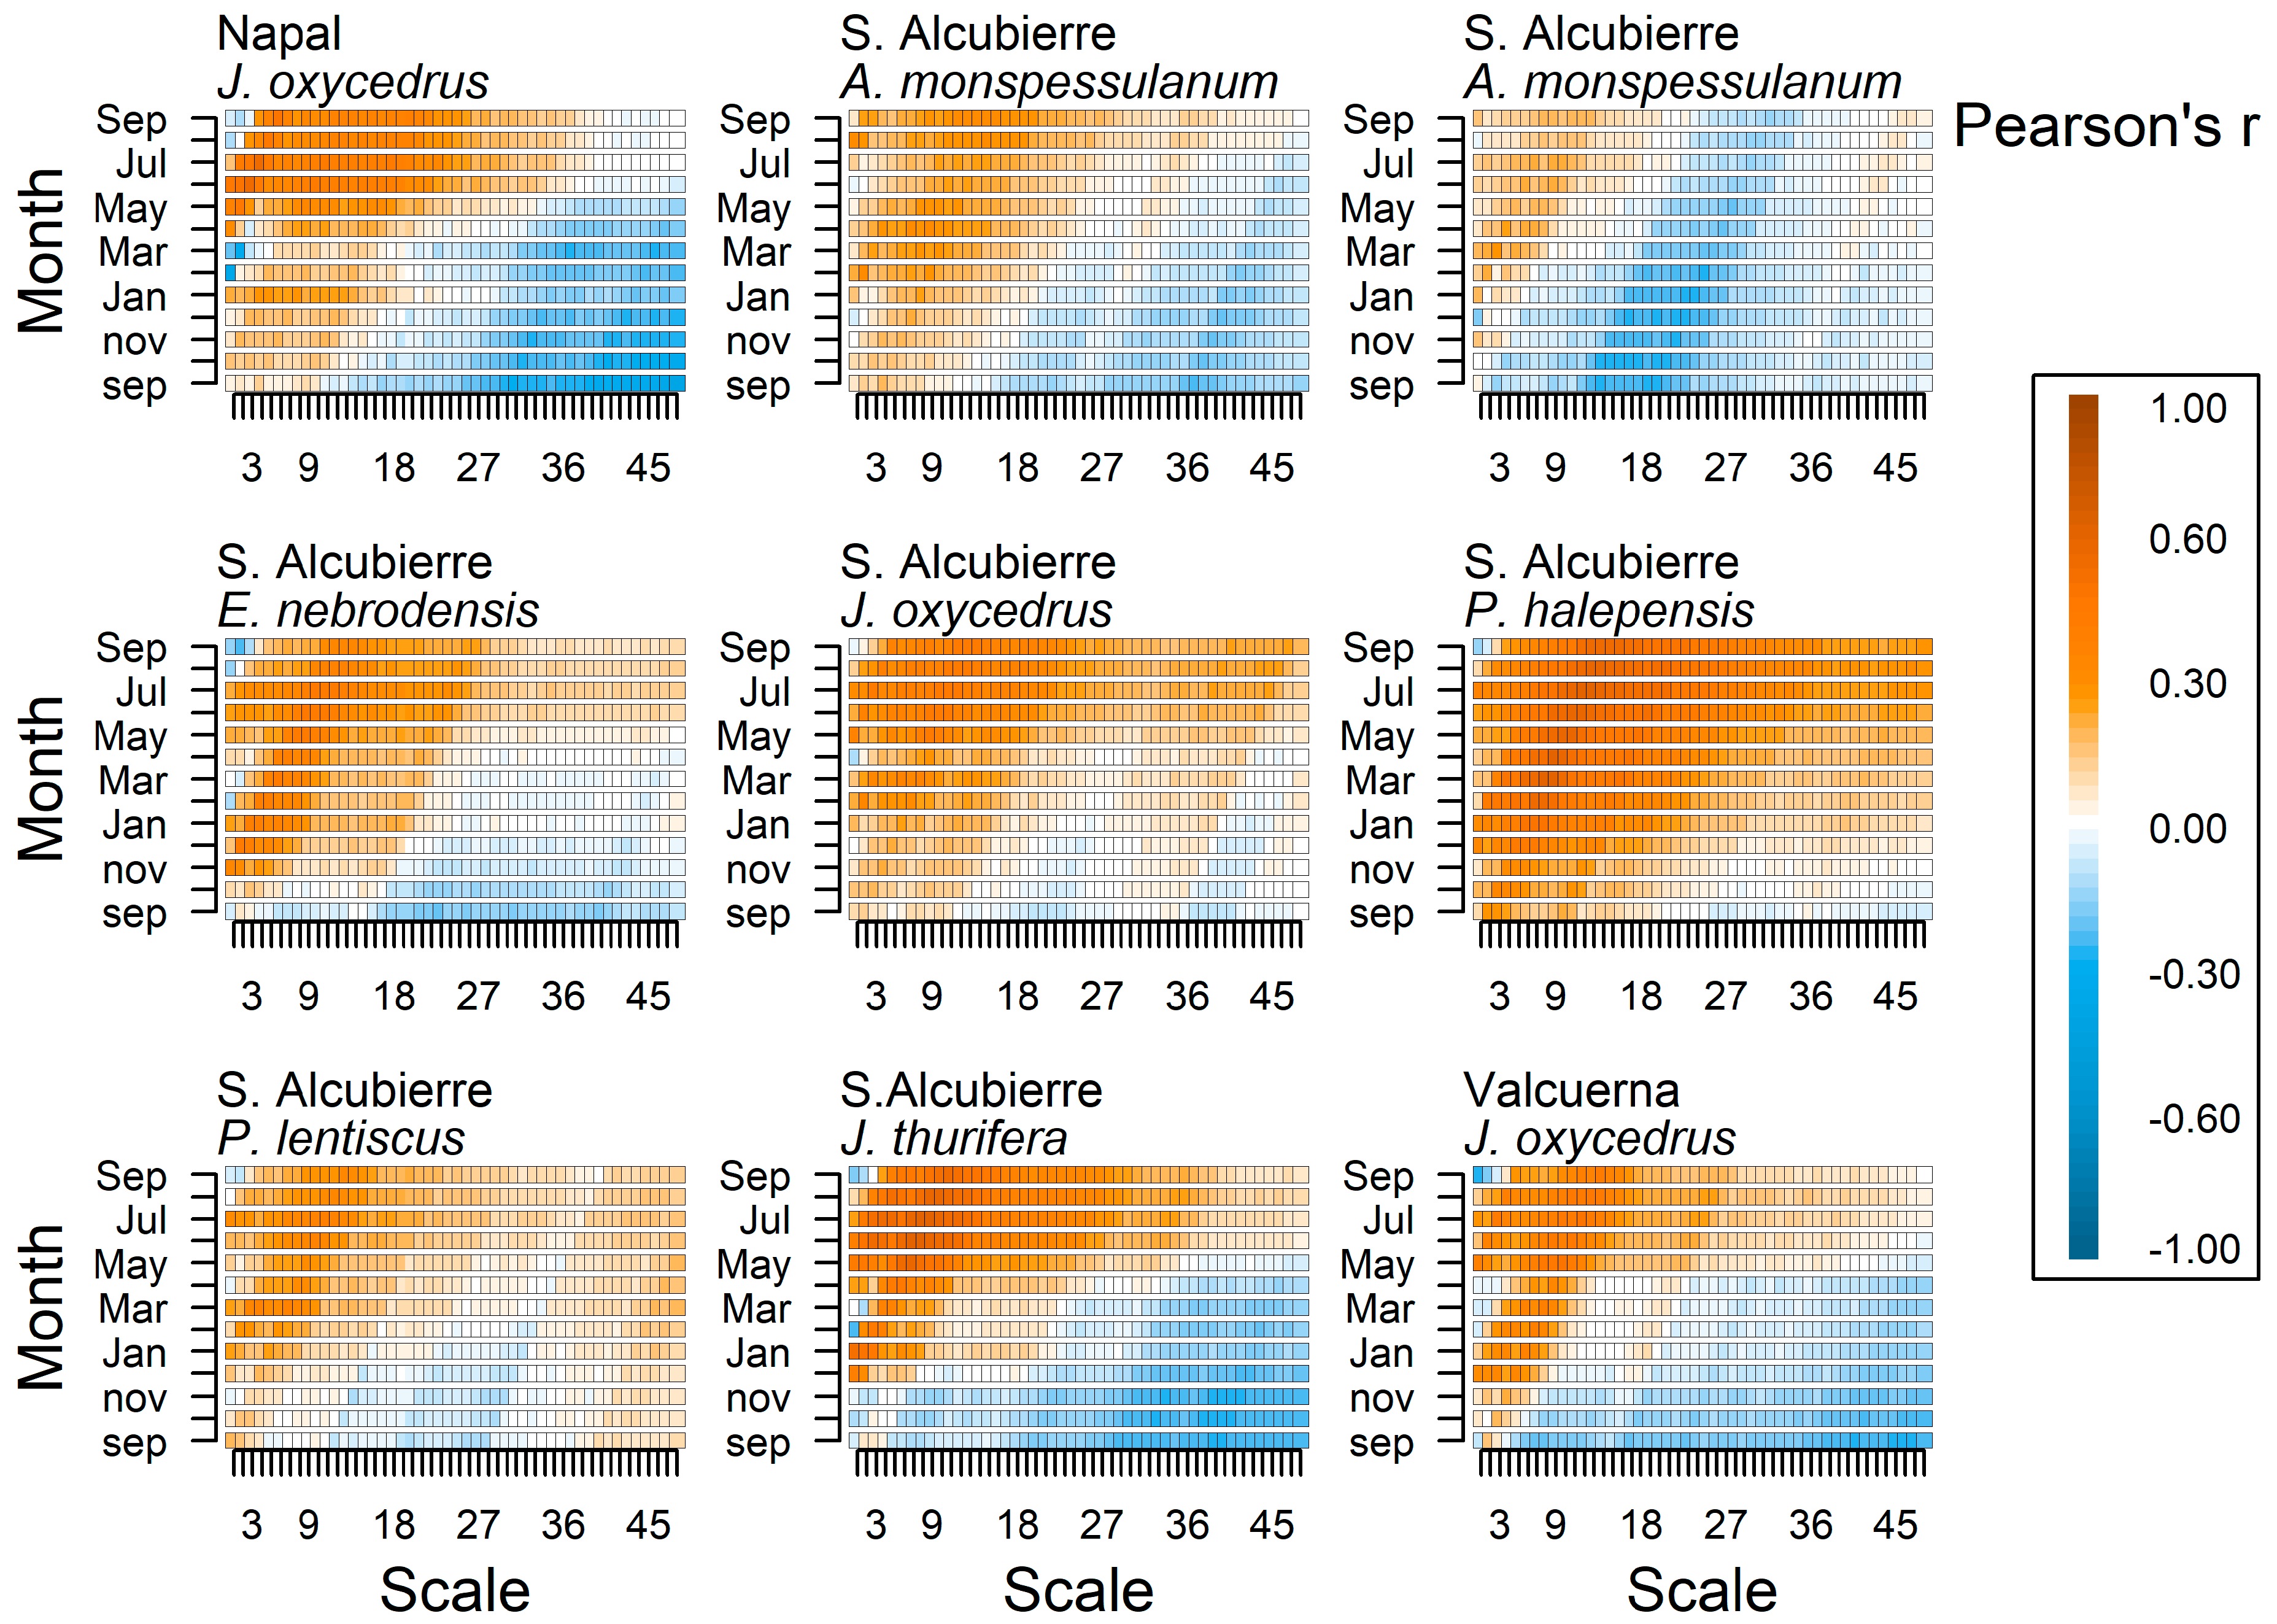
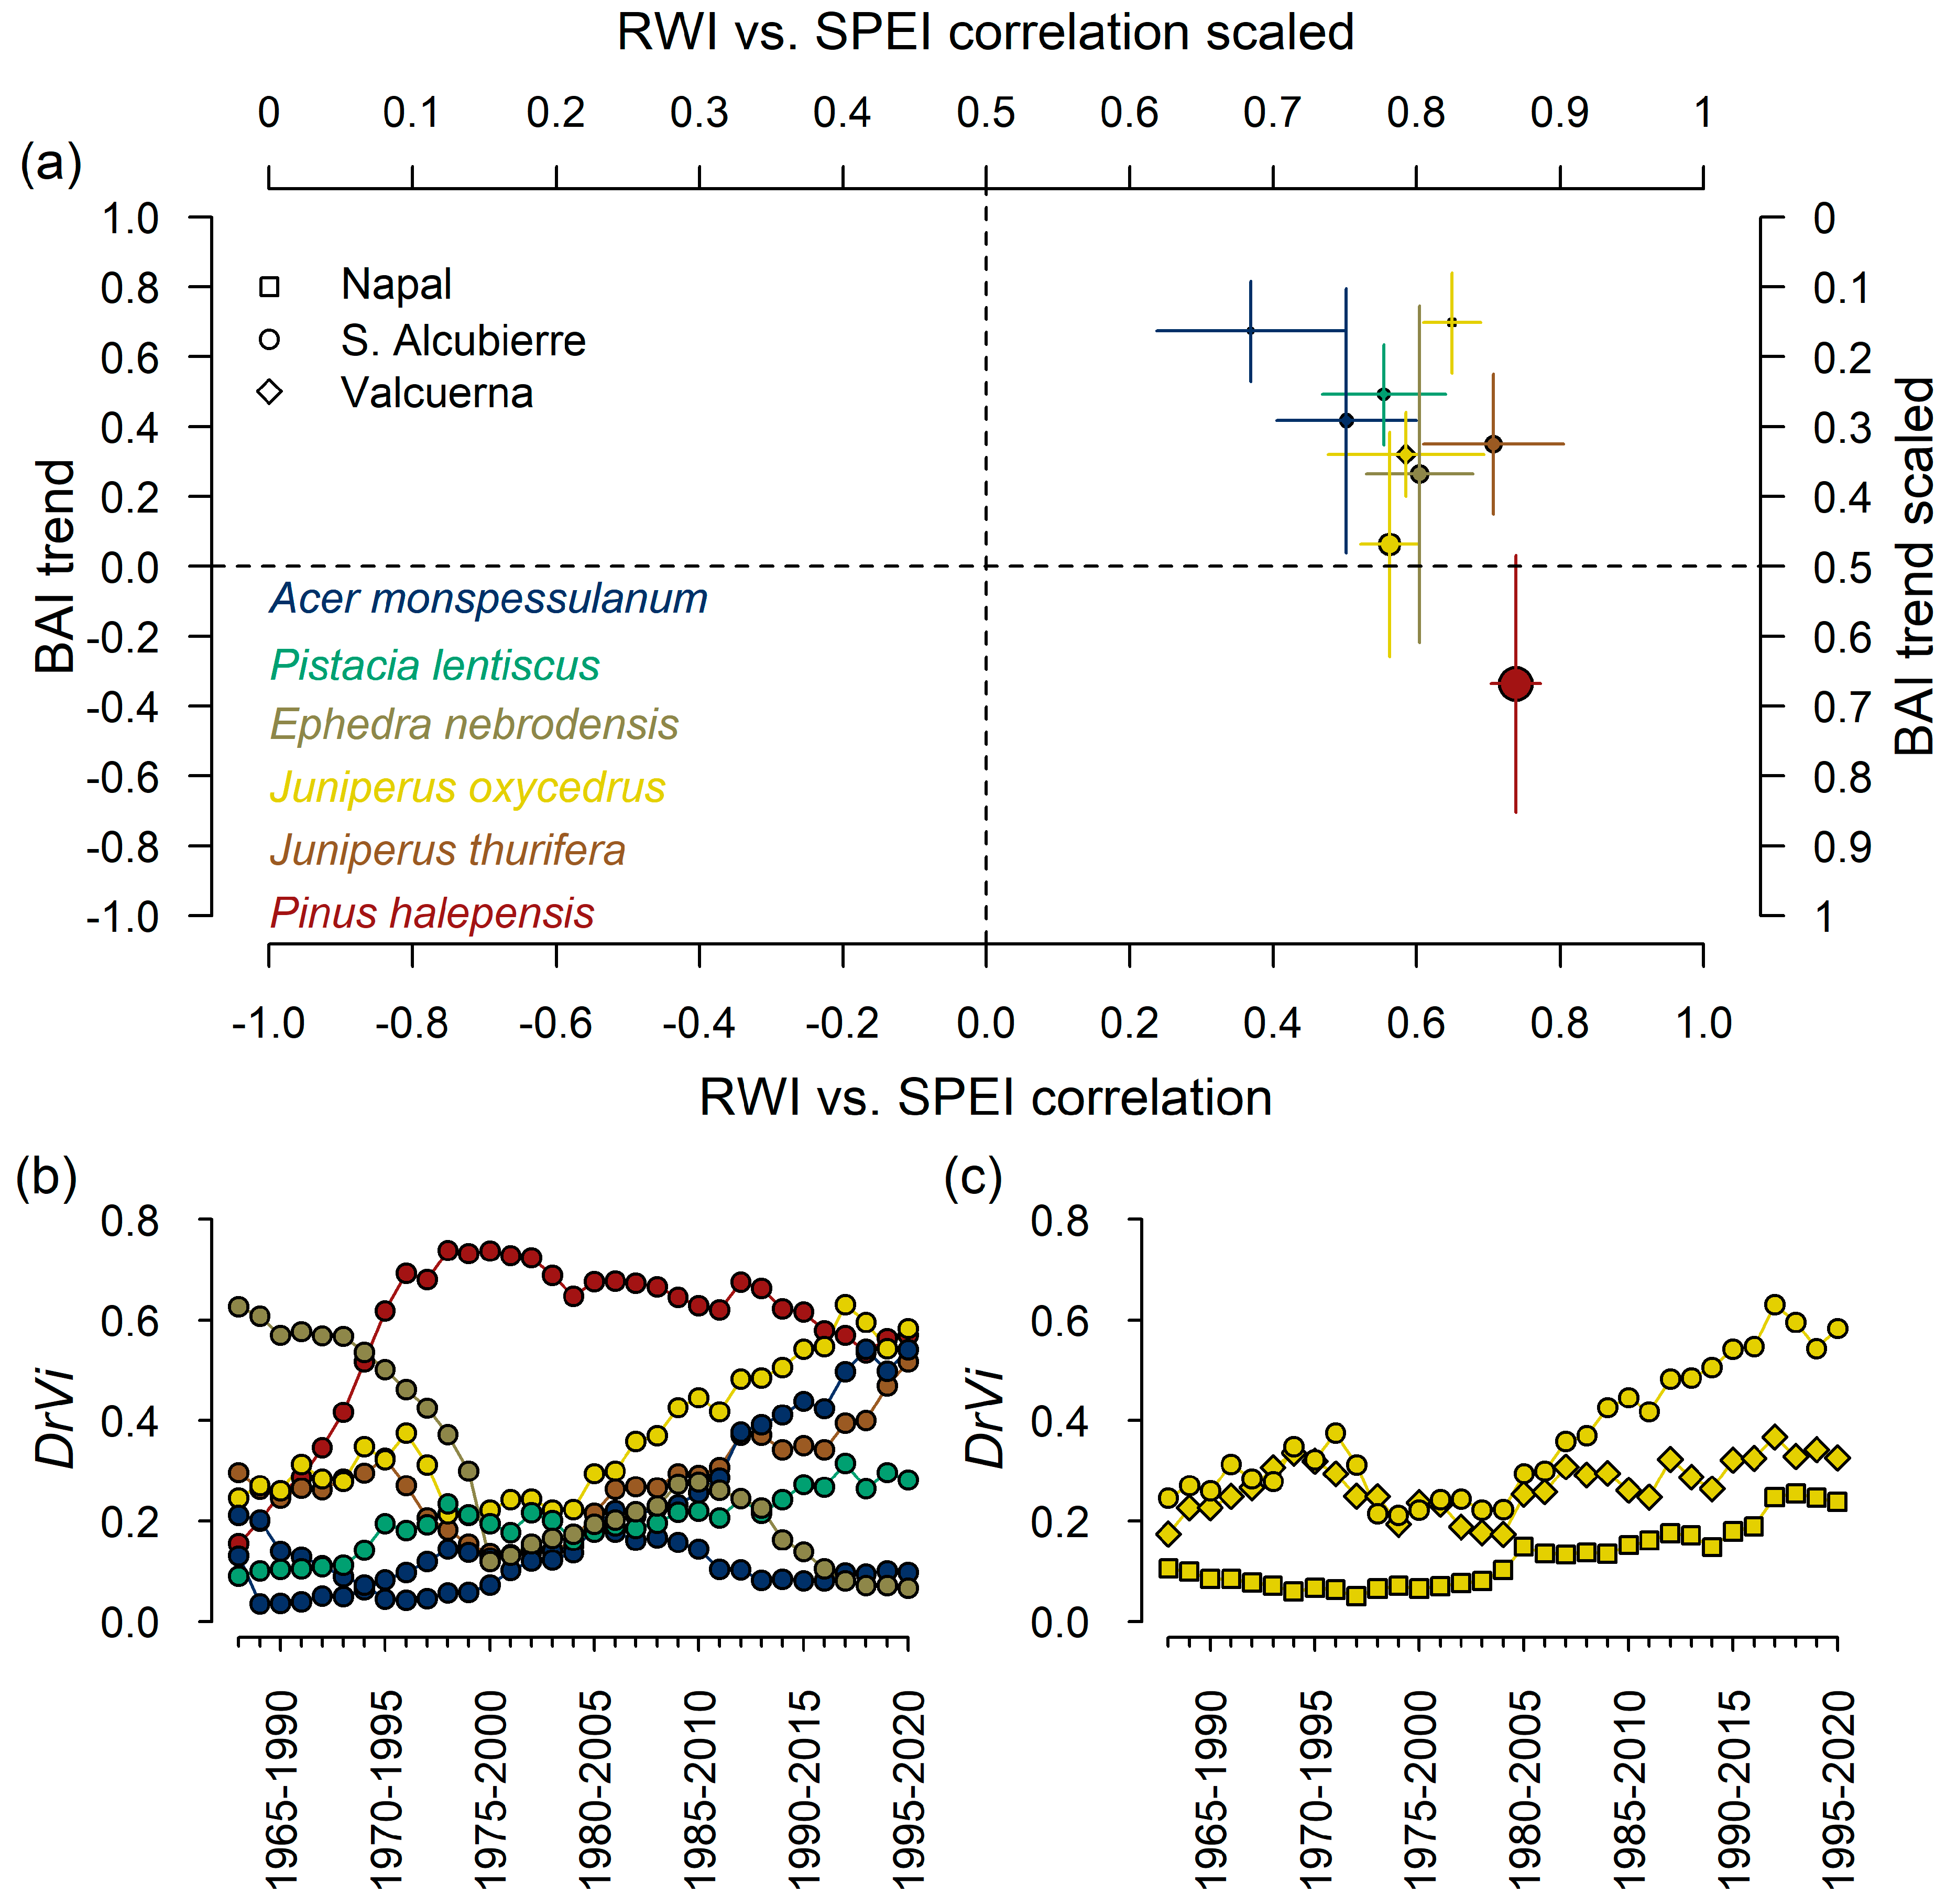
3. Results
4. Discussion
5. Conclusions
Supplementary Materials
Author Contributions
Funding
Data Availability Statement
Acknowledgments
Conflicts of Interest
References
- AghaKouchak, A.; Chiang, F.; Huning, L.S.; Love, C.A.; Mallakpour, I.; Mazdiyasni, O.; Moftakhari, H.; Papalexiou, S.M.; Ragno, E.; Sadegh, M. Climate extremes and compound hazards in a warming world. Annu. Rev. Earth Planet. Sci. 2020, 48, 519–548. [Google Scholar] [CrossRef]
- Arias, P.A.; Bellouin, N.; Coppola, E.; Jones, R.G.; Krinner, G.; Marotzke, J.; Naik, V.; Palmer, M.D.; Plattner, G.-K.; Rogelj, J.; et al. Technical Summary. In Climate Change 2021: The Physical Science Basis. Contribution of Working Group I to the Sixth Assessment Report of the Intergovernmental Panel on Climate Change; Masson-Delmotte, V., Zhai, P., Pirani, A., Connors, S.L., Péan, C., Berger, S., Caud, N., Chen, Y., Goldfarb, L., Gomis, M.I., et al., Eds.; Cambridge University Press: Cambridge, UK; New York, NY, USA, 2021; pp. 33–144. [Google Scholar]
- Pecl, G.T.; Araújo, M.B.; Bell, J.D.; Blanchard, J.; Bonebrake, T.C.; Chen, I.-C.; Clark, T.D.; Colwell, R.K.; Danielsen, F.; Evengård, B.; et al. Biodiversity redistribution under climate change: Impacts on ecosystems and human well-being. Science 2017, 355, eaai9214. [Google Scholar] [CrossRef] [PubMed]
- Friedl, M.A.; Woodcock, C.E.; Olofsson, P.; Zhu, Z.; Loveland, T.; Stanimirova, R.; Arevalo, P.; Bullock, E.; Hu, K.-T.; Zhang, Y.; et al. Medium spatial resolution mapping of global land cover and land cover change across multiple decades from Landsat. Front. Remote Sens. 2022, 3, 894571. [Google Scholar] [CrossRef]
- Allen, C.D.; Breshears, D.D.; McDowell, N.G. On underestimation of global vulnerability to tree mortality and forest die-off from hotter drought in the Anthropocene. Ecosphere 2015, 6, 129. [Google Scholar] [CrossRef]
- Hammond, W.M.; Williams, A.P.; Abatzoglou, J.T.; Adams, H.D.; Klein, T.; López, R.; Sáenz-Romero, C.; Hartmann, H.; Breshears, D.D.; Allen, C.D. Global field observations of tree die-off reveal hotter-drought fingerprint for Earth’s forests. Nat. Commun. 2022, 13, 1761. [Google Scholar] [CrossRef] [PubMed]
- Hidalgo-Triana, N.; Solakis, A.; Casimiro-Soriguer, F.; Choe, H.; Navarro, T.; Pérez-Latorre, A.V.; Thorne, J.H. The high climate vulnerability of western Mediterranean forests. Sci. Total Environ. 2023, 895, 164983. [Google Scholar] [CrossRef]
- Vicente-Serrano, S.M.; Peña-Angulo, D.; Beguería, S.; Domínguez-Castro, F.; Tomás-Burguera, M.; Noguera, I.; Gimeno-Sotelo, L.; El Kenawy, A. Global drought trends and future projections. Phil Trans. R. Soc. A 2022, 380, 20210285. [Google Scholar] [CrossRef]
- Tuel, A.; Eltahir, E.A. Why is the Mediterranean a climate change hot spot? J. Clim. 2020, 33, 5829–5843. [Google Scholar] [CrossRef]
- Batllori, E.; Lloret, F.; Aakala, T.; Anderegg, W.R.L.; Aynekulu, E.; Bendixsen, D.P.; Bentouati, A.; Bigler, C.; Burk, C.J.; Camarero, J.J.; et al. Forest and woodland replacement patterns following drought-related mortality. Proc. Natl. Acad. Sci. USA 2020, 117, 29720–29729. [Google Scholar] [CrossRef] [PubMed]
- Doblas-Miranda, E.; Martínez-Vilalta, J.; Lloret, F.; Álvarez, A.; Ávila, A.; Bonet, F.J.; Brotons, L.; Castro, J.; Curiel Yuste, J.; Díaz, M.; et al. Reassessing global change research priorities in mediterranean terrestrial ecosystems: How far have we come and where do we go from here? Glob. Ecol. Biogeogr. 2015, 24, 25–43. [Google Scholar] [CrossRef]
- Peñuelas, J.; Sardans, J. Global change and forest disturbances in the Mediterranean basin: Breakthroughs, knowledge gaps, and recommendations. Forests 2021, 12, 603. [Google Scholar] [CrossRef]
- Fritts, H.C. Tree Rings and Climate; Academic Press: London, UK, 1976. [Google Scholar]
- Jump, A.S.; Hunt, J.M.; Penuelas, J. Rapid climate change-related growth decline at the southern range edge of Fagus sylvatica. Glob. Change Biol. 2006, 12, 2163–2174. [Google Scholar] [CrossRef]
- Denisa, S.; Róbert, S.; Patrik, K.; Pavel, Ď.; Milan, S.; Peter, J.; Stanislav, K. Divergent growth responses of healthy and declining spruce trees to climatic stress: A case study from the Western carpathians. Dendrochronologia 2022, 76, 126023. [Google Scholar] [CrossRef]
- Bowman, D.M.; Brienen, R.J.; Gloor, E.; Phillips, O.L.; Prior, L.D. Detecting trends in tree growth: Not so simple. Trends Plant Sci. 2013, 18, 11–17. [Google Scholar] [CrossRef]
- Delpierre, N.; Berveiller, D.; Granda, E.; Dufrêne, E. Wood phenology, not carbon input, controls the interannual variability of wood growth in a temperate oak forest. New Phytol. 2015, 210, 459–470. [Google Scholar] [CrossRef]
- Lloret, F.; Keeling, E.G.; Sala, A. Components of tree resilience: Effects of successive low-growth episodes in old ponderosa pine forests. Oikos 2011, 120, 1909–1920. [Google Scholar] [CrossRef]
- Eilmann, B.; Rigling, A. Tree-growth analyses to estimate tree species’ drought tolerance. Tree Physiol. 2012, 32, 178–187. [Google Scholar] [CrossRef]
- Vilà-Cabrera, A.; Jump, A.S. Greater growth stability of trees in marginal habitats suggests a patchy pattern of population loss and retention in response to increased drought at the rear edge. Ecol. Lett. 2019, 22, 1439–1448. [Google Scholar] [CrossRef] [PubMed]
- Schwarz, J.; Skiadaresis, G.; Kohler, M.; Kunz, J.; Schnabel, F.; Vitali, V.; Bauhus, J. Quantifying growth responses of trees to drought—A critique of commonly used resilience indices and recommendations for future studies. Curr. Rep. 2020, 6, 185–200. [Google Scholar] [CrossRef]
- Schmucker, J.; Uhl, E.; Schmied, G.; Pretzsch, H. Growth and drought reaction of European hornbeam, European white elm, field maple and wild service tree. Trees 2023, 37, 1515–1536. [Google Scholar] [CrossRef]
- Anderegg, W.R.L.; Schwalm, C.R.; Biondi, F.; Camarero, J.J.; Koch, G.W.; Litvak, M.; Ogle, K.; Shaw, J.D.; Shevliakova, E.; Williams, A.P.; et al. Pervasive drought legacies in forest ecosystems and their implications for carbon cycle models. Science 2015, 349, 528–532. [Google Scholar] [CrossRef] [PubMed]
- Fernández-de-Uña, L.; Martínez-Vilalta, J.; Poyatos, R.; Mencuccini, M.; McDowell, N.G. The role of height-driven constraints and compensations on tree vulnerability to drought. New Phytol. 2023, 239, 2083–2098. [Google Scholar] [CrossRef]
- Camarero, J.J.; Pizarro, M.; Gernandt, D.S.; Gazol, A. Smaller conifers are more resilient to drought. Agric. For. Meteorol. 2024, 350, 109993. [Google Scholar] [CrossRef]
- Kasper, J.; Leuschner, C.; Walentowski, H.; Petritan, A.M.; Weigel, R. Winners and losers of climate warming: Declining growth in Fagus and Tilia vs. stable growth in three Quercus species in the natural beech–oak forest ecotone (western Romania). For. Ecol. Manag. 2022, 506, 119892. [Google Scholar] [CrossRef]
- Su, J.; Gou, X.; HilleRisLambers, J.; Deng, Y.; Fan, H.; Zheng, W.; Zhang, R.; Manzanedo, R.D. Increasing climate sensitivity of subtropical conifers along an aridity gradient. For. Ecol. Manag. 2021, 482, 118841. [Google Scholar] [CrossRef]
- Weigel, R.; Bat-Enerel, B.; Dulamsuren, C.; Muffler, L.; Weithmann, G.; Leuschner, C. Summer drought exposure, stand structure, and soil properties jointly control the growth of European beech along a steep precipitation gradient in northern Germany. Glob. Change Biol. 2023, 29, 763–779. [Google Scholar] [CrossRef]
- Serra-Maluquer, X.; Mencuccini, M.; Martínez-Vilalta, J. Changes in tree resistance, recovery and resilience across three successive extreme droughts in the northeast Iberian Peninsula. Oecologia 2018, 187, 343–354. [Google Scholar] [CrossRef]
- Camarero, J.J.; Gazol, A.; Sangüesa-Barreda, G.; Oliva, J.; Vicente-Serrano, S.M. To die or not to die: Early warnings of tree dieback in response to a severe drought. J. Ecol. 2015, 103, 44–57. [Google Scholar] [CrossRef]
- Cailleret, M.; Jansen, S.; Robert, E.M.R.; Desoto, L.; Aakala, T.; Antos, J.A.; Beikircher, B.; Bigler, C.; Bugmann, H.; Caccianiga, M.; et al. A synthesis of radial growth patterns preceding tree mortality. Glob. Change Biol. 2017, 23, 1675–1690. [Google Scholar] [CrossRef]
- DeSoto, L.; Cailleret, M.; Sterck, F.; Jansen, S.; Kramer, K.; Robert, E.M.R.; Aakala, T.; Amoroso, M.M.; Bigler, C.; Camarero, J.J.; et al. Low growth resilience to drought is related to future mortality risk in trees. Nat. Commun. 2020, 11, 545. [Google Scholar] [CrossRef]
- Cabon, A.; DeRose, R.J.; Shaw, J.D.; Anderegg, W.R.L. Declining tree growth resilience mediates subsequent forest mortality in the US Mountain West. Glob. Change Biol. 2023, 29, 4826–4841. [Google Scholar] [CrossRef] [PubMed]
- Foden, W.B.; Young, B.E.; Akçakaya, H.R.; Garcia, R.A.; Hoffmann, A.A.; Stein, B.A.; Thomas, C.D.; Wheatley, C.J.; Bickford, D.; Carr, J.A.; et al. Climate change vulnerability assessment of species. WIREs Clim. Change 2019, 10, e551. [Google Scholar] [CrossRef]
- Serra-Maluquer, X.; Gazol, A.; Anderegg, W.R.L.; Martínez-Vilalta, J.; Mencuccini, M.; Camarero, J.J. Wood density and hydraulic traits influence species’ growth response to drought across biomes. Glob. Change Biol. 2022, 28, 3871–3882. [Google Scholar] [CrossRef]
- Wilmking, M.; Van Der Maaten-Theunissen, M.; Van Der Maaten, E.; Scharnweber, T.; Buras, A.; Biermann, C.; Gurskaya, M.; Hallinger, M.; Lange, J.; Shetti, R.; et al. Global assessment of relationships between climate and tree growth. Glob. Change Biol. 2020, 26, 3212–3220. [Google Scholar] [CrossRef]
- Roshani Sajjad, H.; Kumar, P.; Masroor, M.; Rahaman, M.H.; Rehman, S.; Ahmed, R.; Sahana, M. Forest vulnerability to climate change: A review for future research framework. Forests 2022, 13, 917. [Google Scholar] [CrossRef]
- Martinez del Castillo, E.; Zang, C.S.; Buras, A.; Hacket-Pain, A.; Esper, J.; Serrano-Notivoli, R.; Hartl, C.; Weigel, R.; Klesse, S.; de Dios, V.R.; et al. Climate-change-driven growth decline of European beech forests. Commun. Biol. 2022, 5, 163. [Google Scholar] [CrossRef]
- Montserrat-Martí, G.; Palacio, S.; Milla, R.; Giménez-Benavides, L. Meristem growth, phenology, and architecture in chamaephytes of the Iberian Peninsula: Insights into a largely neglected life form. Folia Geobot. 2011, 46, 117–136. [Google Scholar] [CrossRef]
- Götmark, F.; Götmark, E.; Jensen, A.M. Why be a shrub? A basic model and hypotheses for the adaptive values of a common growth form. Front. Plant Sci. 2016, 7, 1095. [Google Scholar] [CrossRef] [PubMed]
- Camarero, J.J.; Valeriano, C.; Gazol, A.; Colangelo, M.; Sanchez-Salguero, R. Climate differently impacts the growth of coexisting trees and shrubs under semi-arid Mediterranean conditions. Forests 2021, 12, 381. [Google Scholar] [CrossRef]
- Lombardo, E.; Bancheva, S.; Domina, G.; Venturella, G. Distribution, ecological role and symbioses of selected shrubby species in the Mediterranean Basin: A review. Plant Biosyst. 2020, 154, 438–454. [Google Scholar] [CrossRef]
- Gazol, A.; Camarero, J.J. Mediterranean dwarf shrubs and coexisting trees present different radial-growth synchronies and responses to climate. Plant Ecol. 2012, 213, 1687–1698. [Google Scholar] [CrossRef]
- Tamudo, E.; Gazol, A.; Valeriano, C.; González, E.; Colangelo, M.; Camarero, J.J. Similar climate–growth relationships but divergent drought resilience strategies in coexisting Mediterranean shrubs. J. Ecol. 2024, 112, 1804–1817. [Google Scholar] [CrossRef]
- Madoz, P. Diccionario Geográfico-Estadístico-Histórico de España y sus Posesiones de Ultramar; Imprenta del Diccionario: Madrid, Spain, 1849; Volume 1. [Google Scholar]
- Molero Briones, J.; Sáez, L.; Villar, L. Interés florístico y geobotánico de la Sierra de Alcubierre (Monegros, Aragón). Acta Bot. Barcinonense 1998, 45, 363–390. [Google Scholar]
- Valeriano, C.; Gutiérrez, E.; Colangelo, M.; Gazol, A.; Sánchez-Salguero, R.; Tumajer, J.; Shishov, V.; Bonet, J.A.; de Aragón, J.M.; Ibáñez, R.; et al. Seasonal precipitation and continentality drive bimodal growth in Mediterranean forests. Dendrochronologia 2023, 78, 126057. [Google Scholar] [CrossRef]
- Fick, S.E.; Hijmans, R.J. WorldClim 2: New 1km spatial resolution climate surfaces for global land areas. Int. J. Climatol. 2017, 37, 4302–4315. [Google Scholar] [CrossRef]
- Larsson, L.A.; Larsson, P.O. CDendro and CooRecorder, v. 9.8.1; Cybis Elektronik and Data AB: Saltsjöbaden, Sweden, 2022.
- Holmes, R.L. Computer-assisted quality control in tree-ring dating and measurement. Tree-Ring Bull. 1983, 43, 51–67. [Google Scholar]
- Biondi, F.; Qeadan, F. A theory-driven approach to tree-ring standardization: Defining the biological trend from expected basal area increment. Tree-Ring Res. 2008, 64, 81–96. [Google Scholar] [CrossRef]
- Briffa, K.R.; Jones, P.D. Basic Chronology Statistics and Assessment. In Methods of Dendrochronology; Cook, E.R., Kairiukstis, L.A., Eds.; Kluwer: Dordrecht, The Netherlands, 1990; pp. 137–152. [Google Scholar]
- Wigley, T.M.; Briffa, K.R.; Jones, P.D. On the average value of correlated time series, with applications in dendroclimatology and hydrometeorology. J. Appl. Meteorol. Climatol. 1984, 23, 201–213. [Google Scholar] [CrossRef]
- Tejedor, E.; Saz, M.A.; Esper, J.; Cuadrat, J.M.; De Luis, M. Summer drought reconstruction in northeastern Spain inferred from a tree ring latewood network since 1734. Geophys. Res. Lett. 2017, 44, 8492–8500. [Google Scholar] [CrossRef]
- R Core Team. R: A Language and Environment for Statistical Computing; R Foundation for Statistical Computing: Vienna, Austria, 2025. [Google Scholar]
- Bunn, A.G. A dendrochronology program library in R (dplR). Dendrochronologia 2008, 26, 115–124. [Google Scholar] [CrossRef]
- Van der Maaten-Theunissen, M.; van der Maaten, E.; Bouriaud, O. pointRes: An R package to analyze pointer years and components of resilience. Dendrochronologia 2015, 35, 34–38. [Google Scholar] [CrossRef]
- Van der Maaten-Theunissen, M.; Trouillier, M.; Schwarz, J.; Skiadaresism, G.; Thurm, A.A.; van der Maaten, E. pointRes 2.0: New functions to describe tree resilience. Dendrochronologia 2021, 70, 125899. [Google Scholar] [CrossRef]
- Vicente-Serrano, S.M.; Beguería, S.; López-Moreno, J.I. A multiscalar drought index sensitive to global warming: The standardized precipitation evapotranspiration index. J. Clim. 2010, 23, 1696–1718. [Google Scholar] [CrossRef]
- Abatzoglou, J.T.; Dobrowski, S.Z.; Parks, S.Z.; Hegewisch, K.C. Terraclimate, a high-resolution global dataset of monthly climate and climatic water balance from 1958–2015. Sci. Data 2018, 5, 170191. [Google Scholar] [CrossRef]
- Beguería, S.; Vicente-Serrano, S.M. SPEI: Calculation of the Standardized Precipitation-Evapotranspiration Index. R Package Version 1.8.1. 2021. Available online: https://CRAN.R-project.org/package=SPEI (accessed on 5 February 2025).
- Legendre, P.; Legendre, L. Numerical Ecology, 3rd ed.; Elsevier: Amsterdam, The Netherlands, 2012. [Google Scholar]
- McArdle, B.H.; Anderson, M.J. Fitting multivariate models to community data: A comment on distance-based redundancy analysis. Ecology 2001, 82, 290–297. [Google Scholar] [CrossRef]
- Zang, C.; Biondi, F. treeclim: An R package for the numerical calibration of proxy-climate relationships. Ecography 2015, 38, 431–436. [Google Scholar] [CrossRef]
- Camarero, J.J.; Olano, J.M.; Parras, A. Plastic bimodal xylogenesis in conifers from continental Mediterranean climates. New Phytol. 2010, 185, 471–480. [Google Scholar] [CrossRef]
- Gazol, A.; Ribas, M.; Gutiérrez, E.; Camarero, J.J. Aleppo pine forests from across Spain show drought-induced growth decline and partial recovery. Agric. For. Meteorol. 2017, 232, 186–194. [Google Scholar] [CrossRef]
- Camarero, J.J.; Gazol, A.; Valeriano, C.; Pizarro, M.; González de Andrés, E. Topoclimatic modulation of growth and production of intra-annual density fluctuations in Juniperus thurifera. Dendrochronologia 2023, 82, 126145. [Google Scholar] [CrossRef]
- Pasho, E.; Camarero, J.J.; Vicente-Serrano, S.M. Climatic impacts and drought control of radial growth and seasonal wood formation in Pinus halepensis. Trees 2012, 26, 1875–1886. [Google Scholar] [CrossRef]
- Willson, C.J.; Manos, P.S.; Jackson, R.B. Hydraulic traits are influenced by phylogenetic history in the drought-resistant, invasive genus Juniperus (Cupressaceae). Am. J. Bot. 2008, 95, 299–314. [Google Scholar] [CrossRef] [PubMed]
- Illuminati, A.; Querejeta, J.I.; Pías, B.; Escudero, A.; Matesanz, S. Coordination between water uptake depth and the leaf economic spectrum in a Mediterranean shrubland. J. Ecol. 2022, 110, 1844–1856. [Google Scholar] [CrossRef]
- Fajardo, A.; McIntire, E.J.; Olson, M.E. When short stature is an asset in trees. Trends Ecol. Evol. 2019, 34, 193–199. [Google Scholar] [CrossRef] [PubMed]

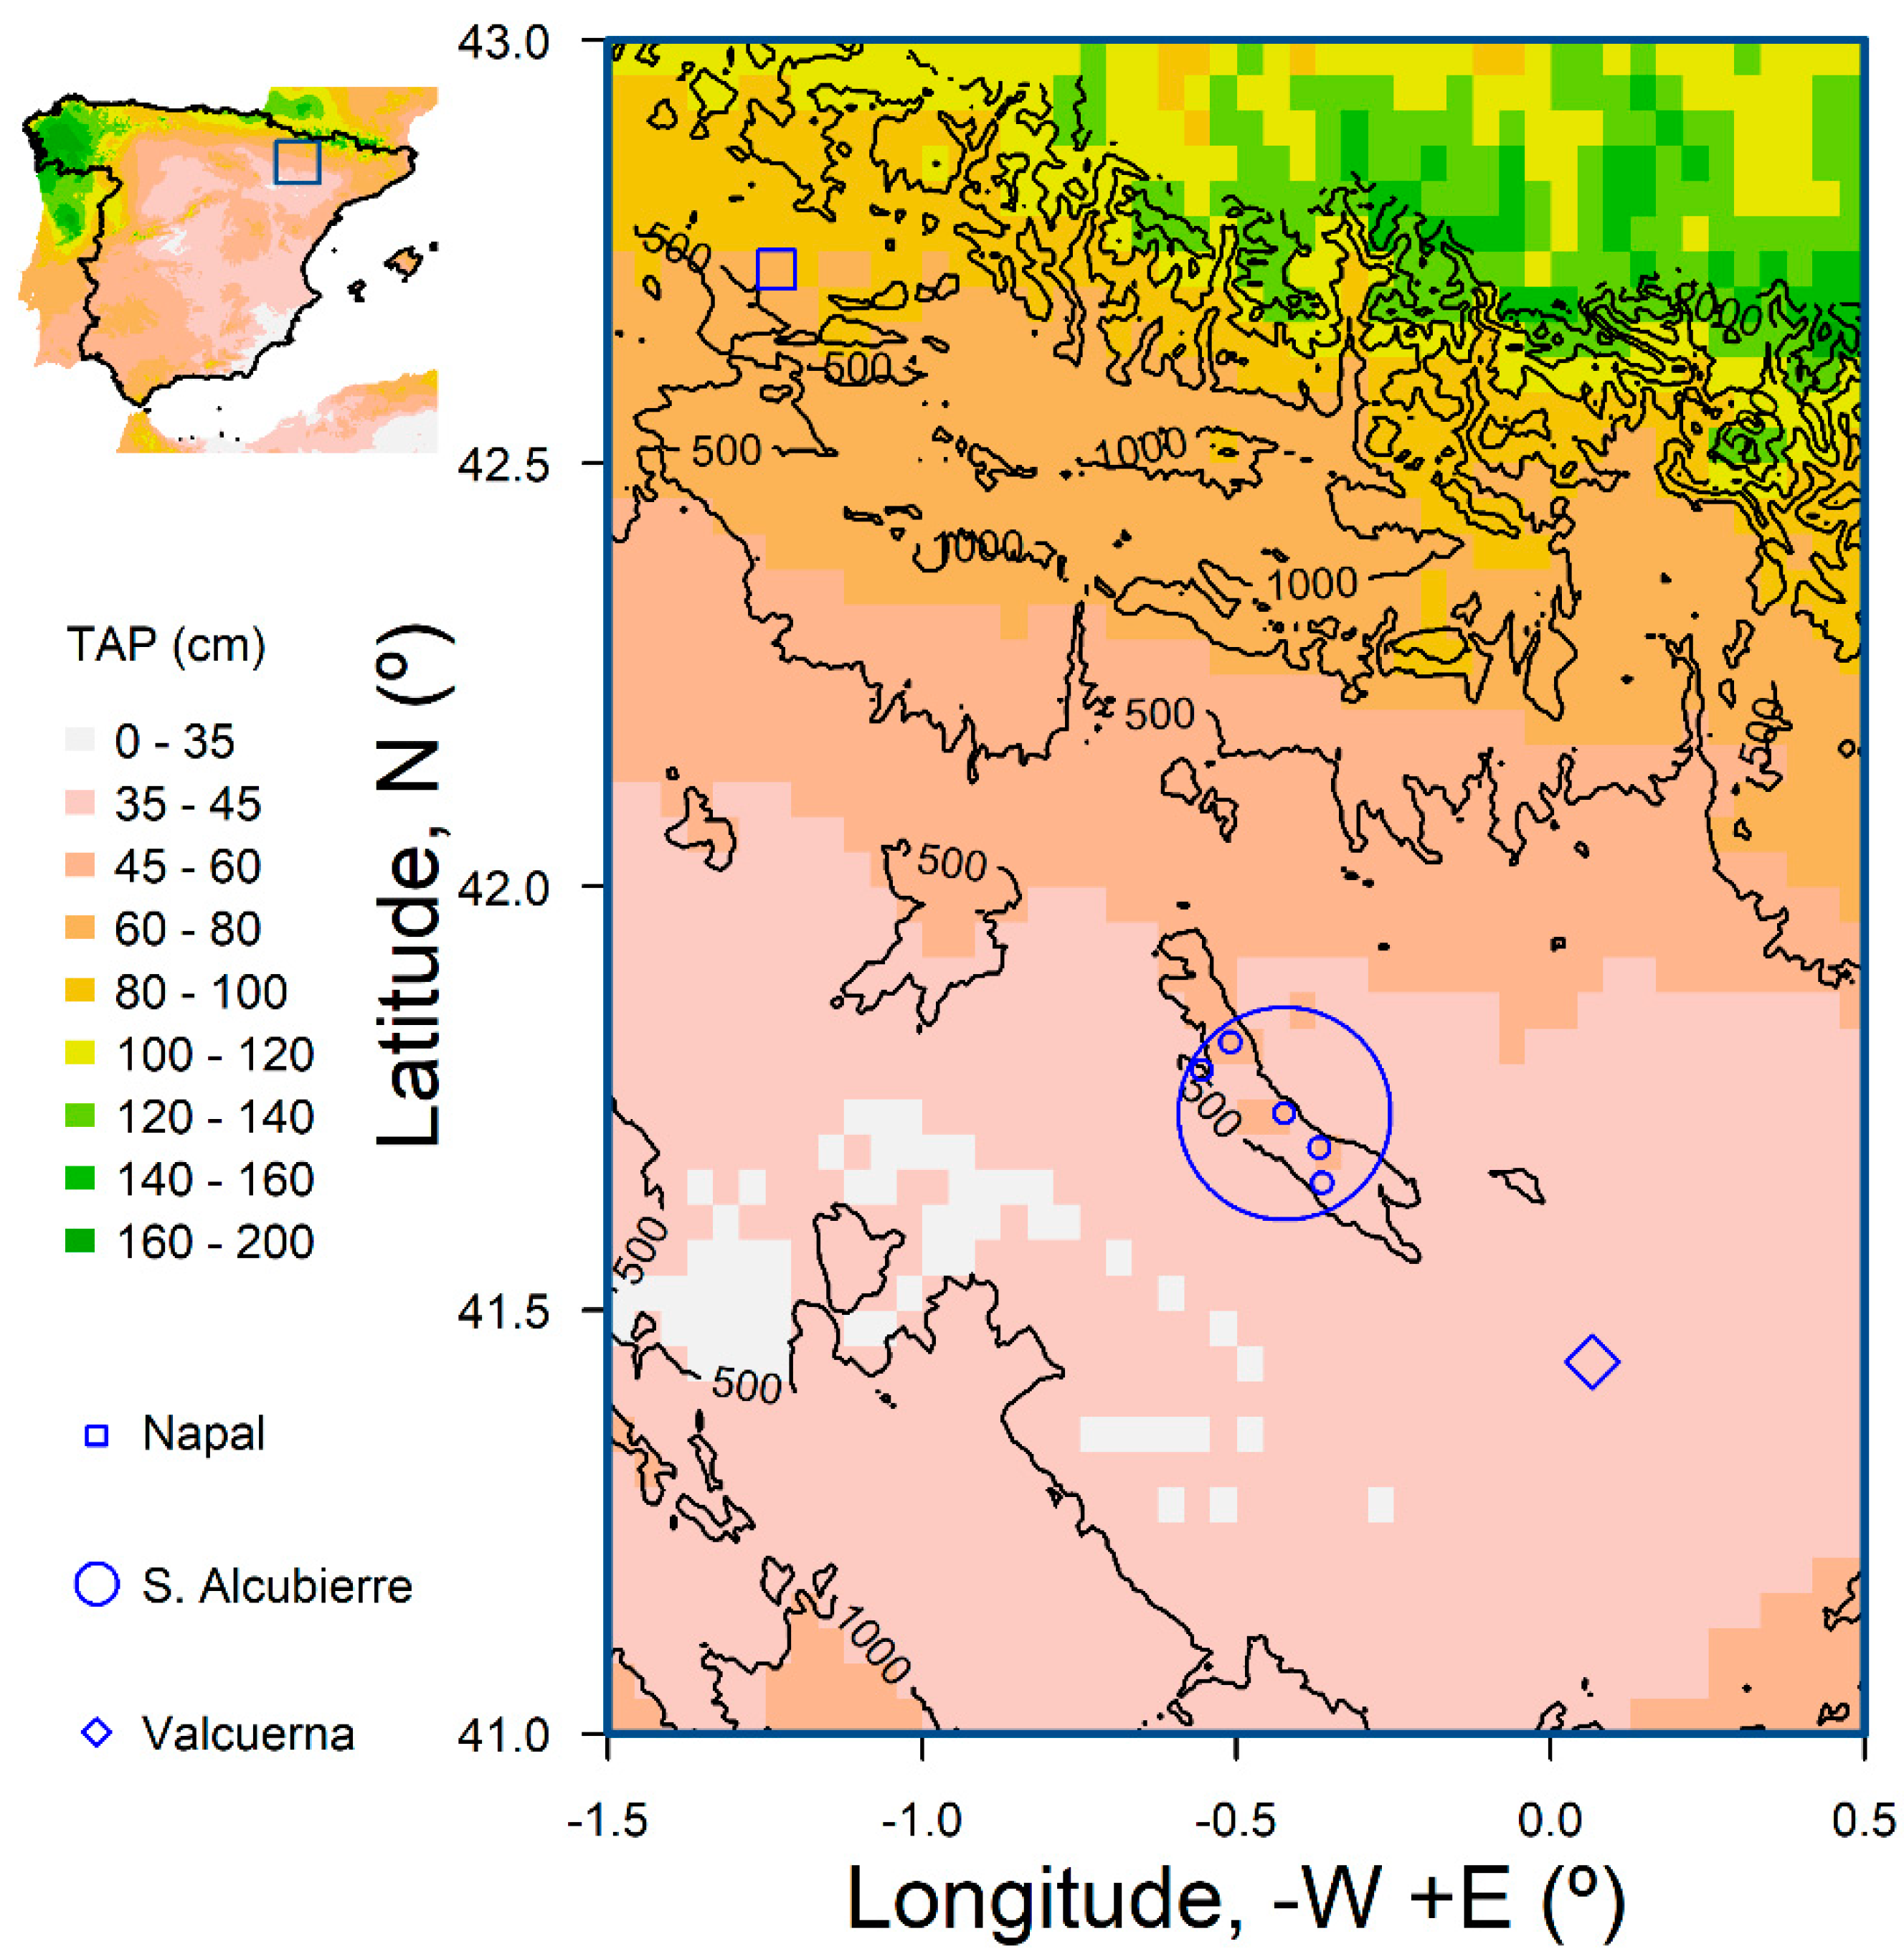
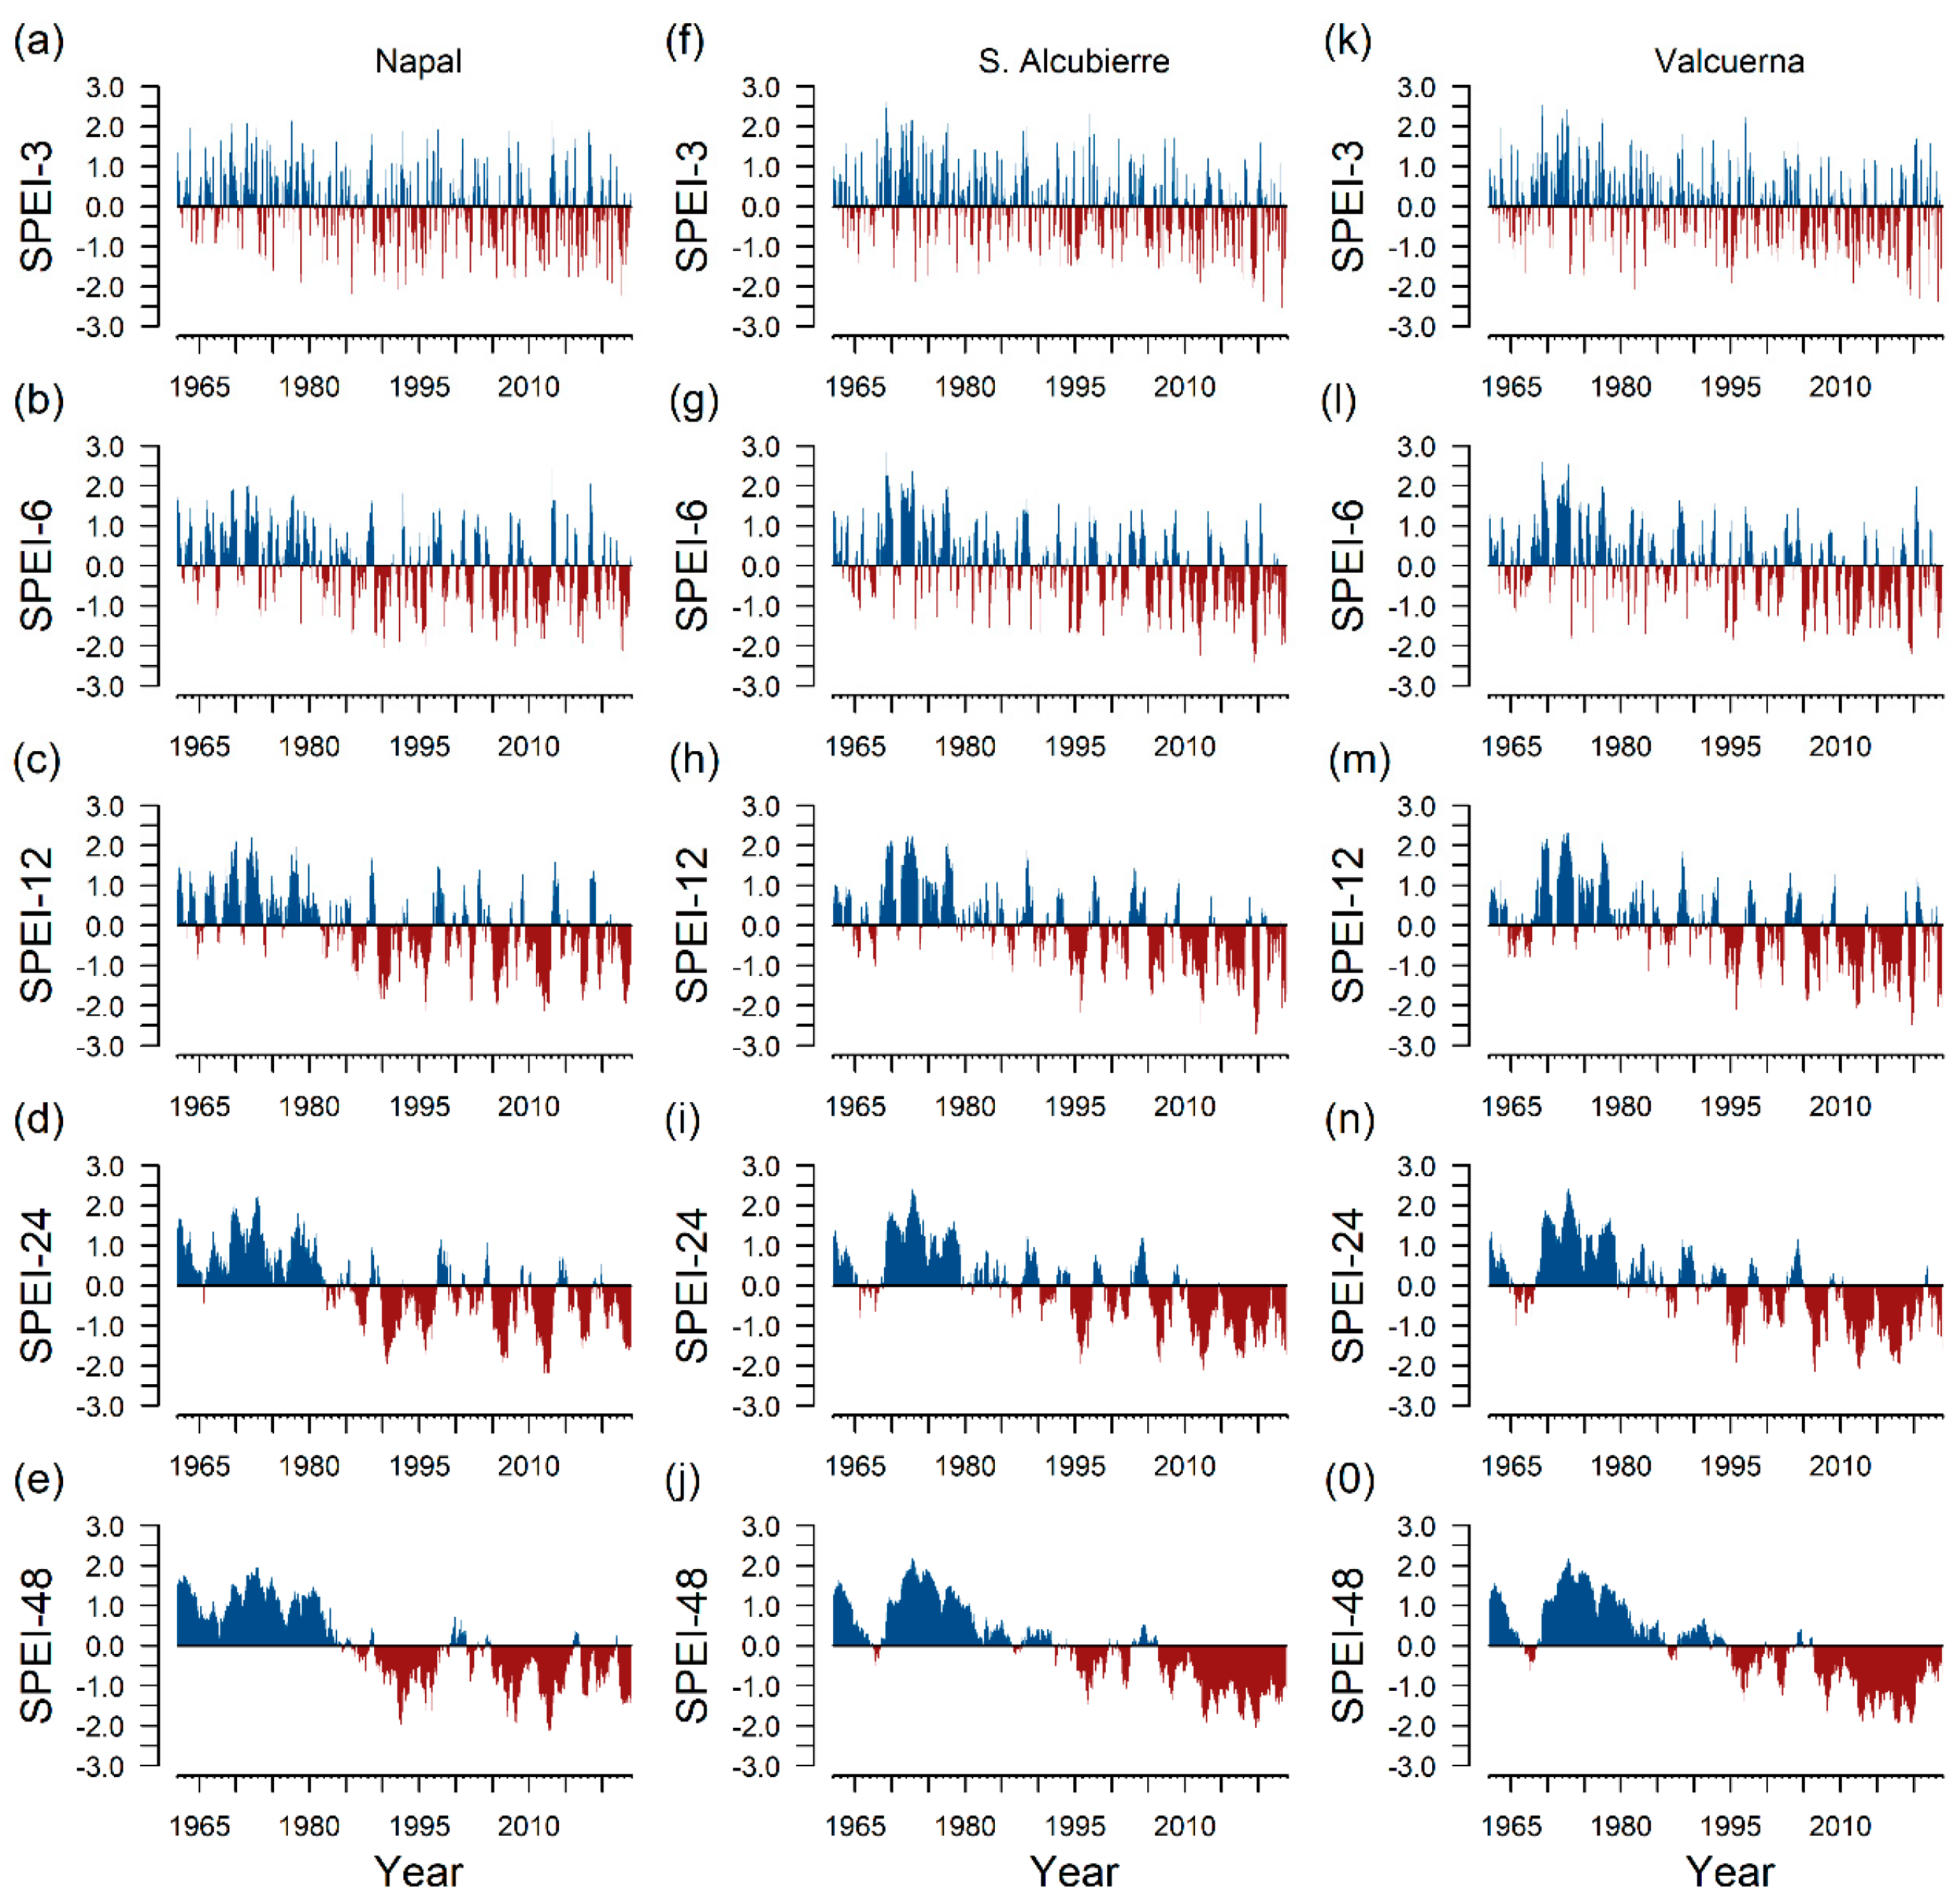
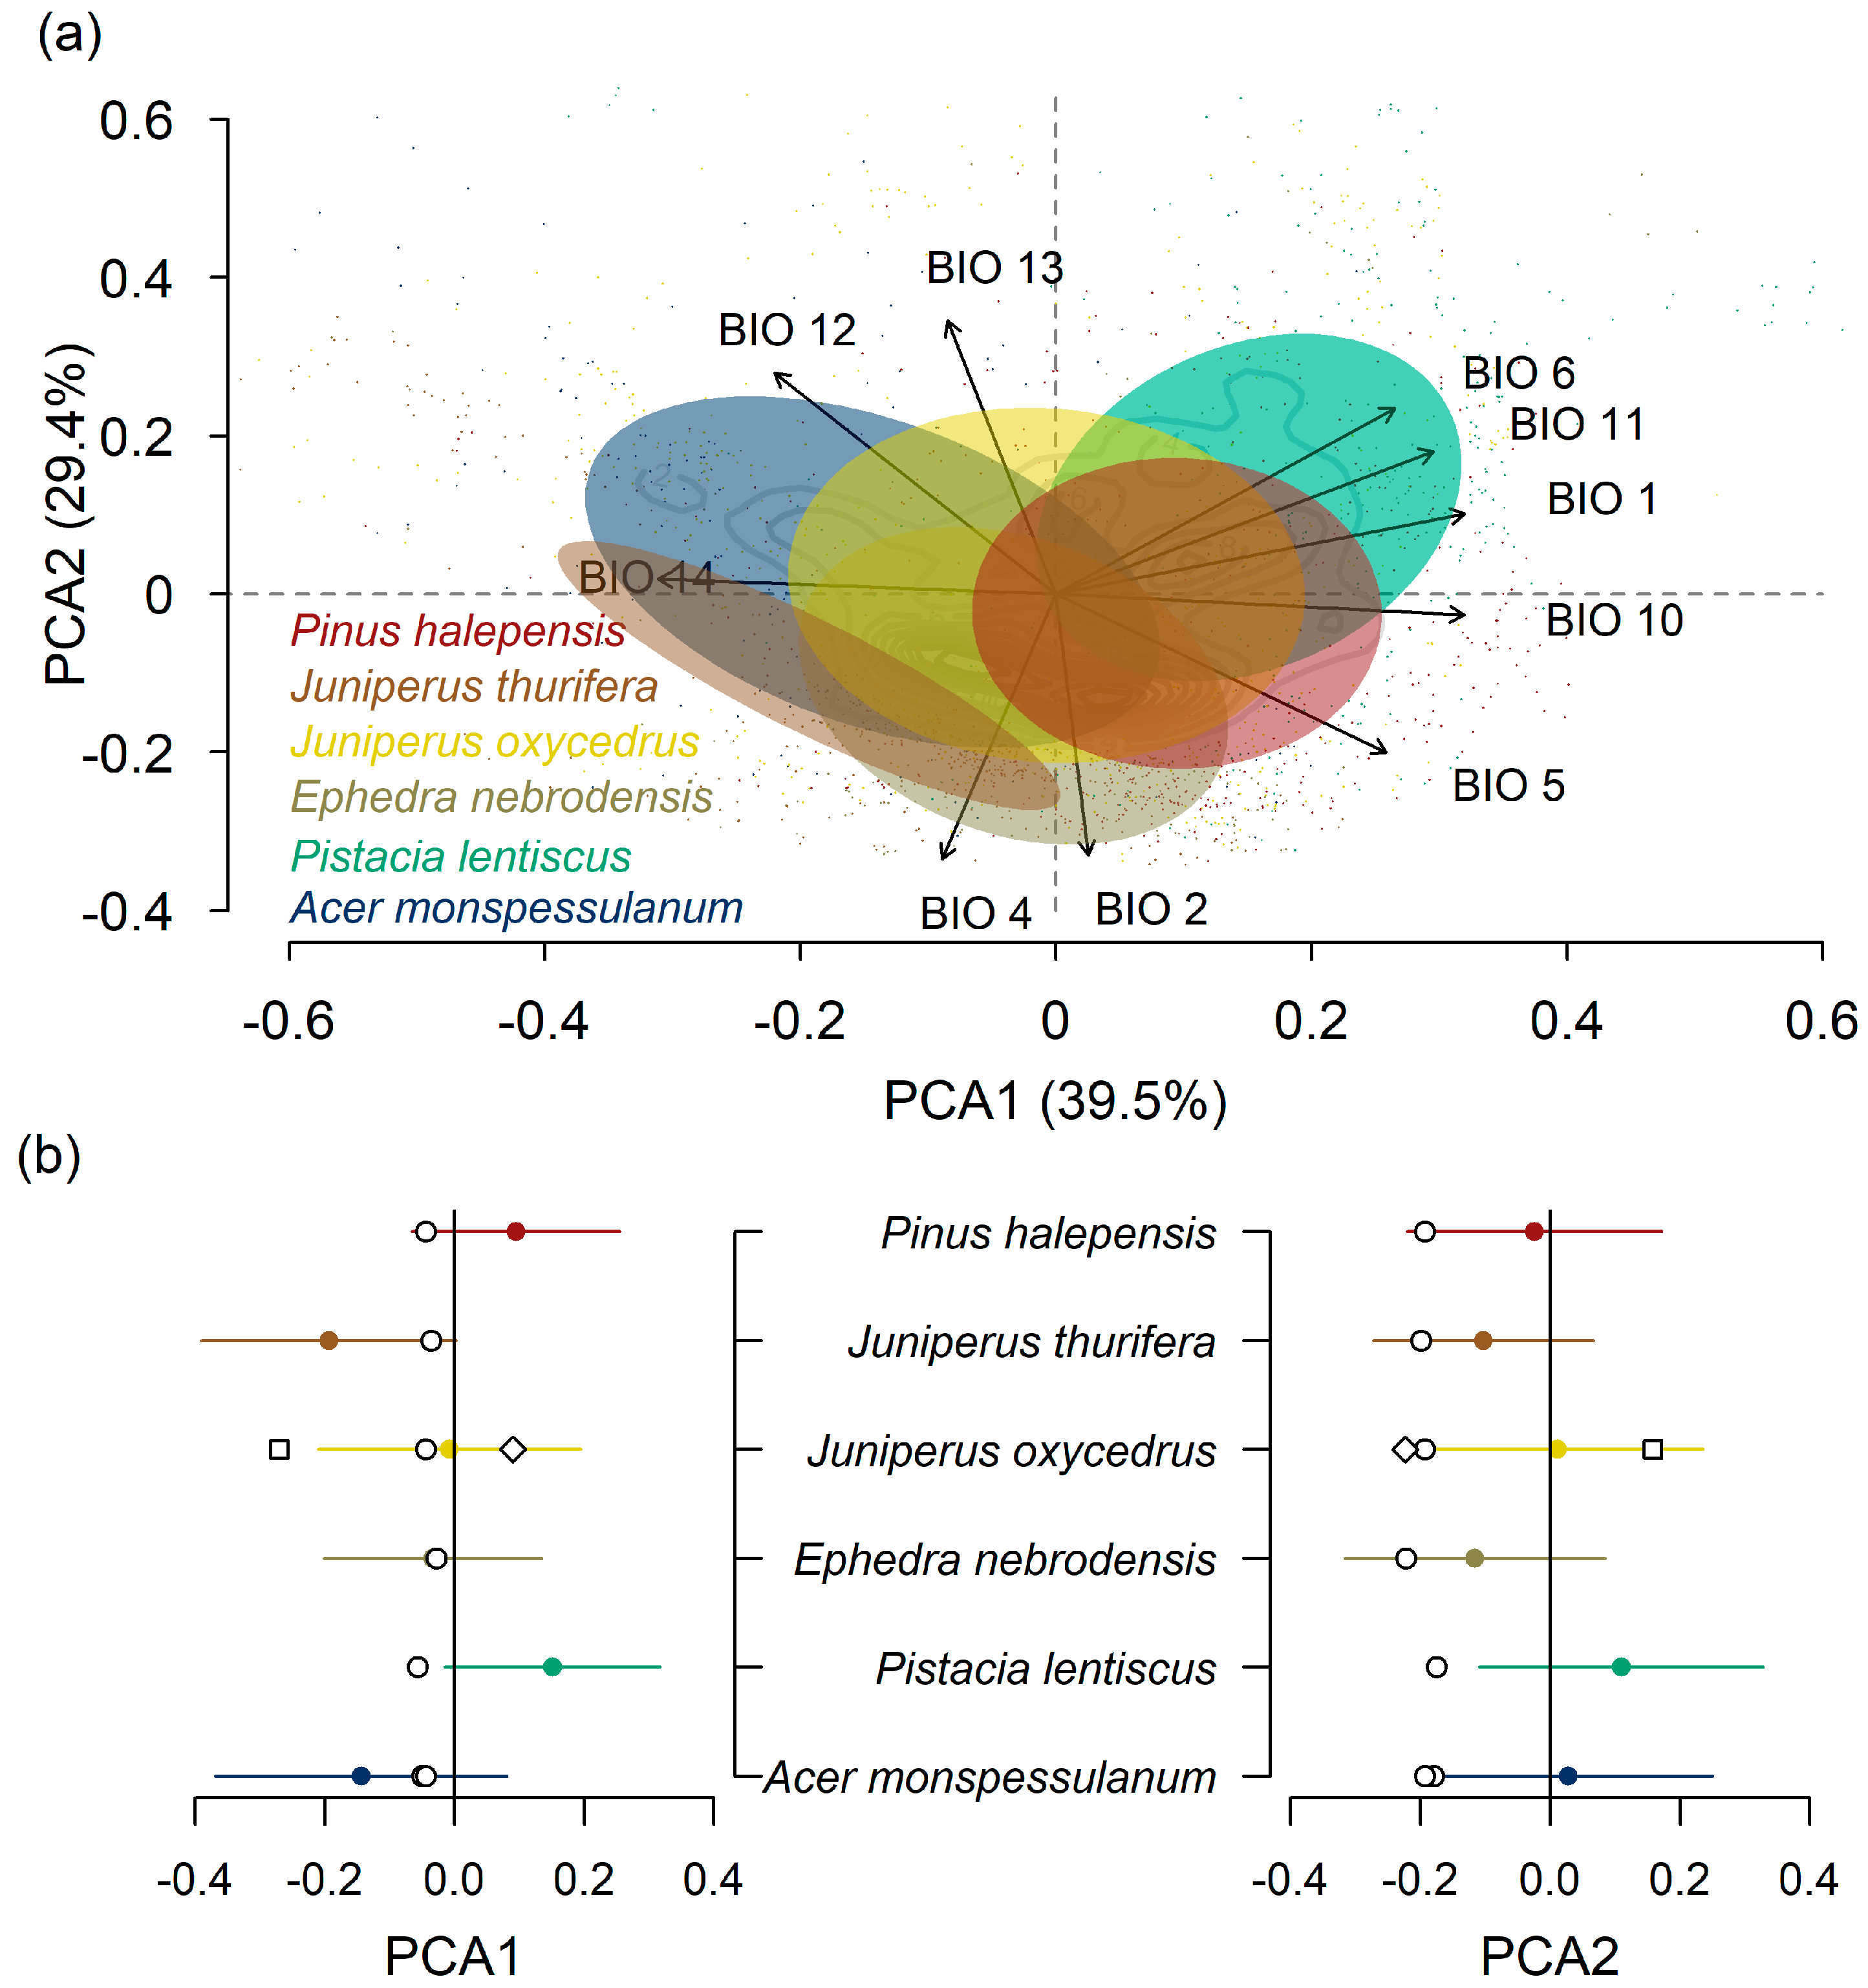
| Site | Latitude (°) N | Longitude (°) − W/+ E | Species | Code |
|---|---|---|---|---|
| Sierra de Alcubierre | 41.8165 | −0.5088 | Acer monspessulanum L. | ALAM |
| 41.6920 | −0.3677 | Acer monspessulanum L. | LAAM | |
| 41.6499 | −0.3635 | Ephedra nebrodensis Tineo ex Guss. | LAEP | |
| 41.6920 | −0.3677 | Juniperus oxycedrus L. | LAJO | |
| 41.6920 | −0.3677 | Pinus halepensis Mill. | LAPH | |
| 41.7327 | −0.4237 | Pistacia lentiscus L. | LAPL | |
| 41.7828 | −0.5544 | Juniperus thurifera L. | PEJT | |
| Napal | 42.7290 | −1.2312 | Juniperus oxycedrus L. | NAJO |
| Valcuerna | 41.4387 | 0.0675 | Juniperus oxycedrus L. | VAJO |
| Code | Site | Species | Timespan | Ring Width/SD (mm) | No. Series/No. Individuals | AR1/SD | rbar | EPS |
|---|---|---|---|---|---|---|---|---|
| ALAM | Sierra de Alcubierre | Acer monspessulanum L. | 1960–2023 | 0.852 ± 0.544 | 22/11 | 0.360 ± 0.25 | 0.193 | 0.724 |
| LAAM | Acer monspessulanum L. | 1926–2023 | 0.681 ± 0.443 | 32/16 | 0.310 ± 0.232 | 0.177 | 0.751 | |
| LAEP | Ephedra nebrodensis Tineo ex Guss. | 1936–2020 | 0.762 ± 0.418 | 40/20 | 0.295 ± 0.245 | 0.313 | 0.732 | |
| LAJO | Juniperus oxycedrus L. | 1880–2023 | 0.461 ± 0.399 | 32/17 | 0.276 ± 0.259 | 0.163 | 0.768 | |
| LAPH | Pinus halepensis Mill. | 1862–2023 | 0.838 ± 0.636 | 41/21 | 0.373 ± 0.231 | 0.602 | 0.969 | |
| LAPL | Pistacia lentiscus L. | 1936–2023 | 0.797 ± 0.454 | 30/15 | 0.216 ± 0.248 | 0.235 | 0.821 | |
| NAJO | Juniperus thurifera L. | 1849–2019 | 1.087 ± 0.793 | 31/16 | 0.365 ± 0.257 | 0.150 | 0.739 | |
| PEJT | Napal | Juniperus oxycedrus L. | 1878–2017 | 0.589 ± 0.436 | 87/46 | 0.383 ± 0.167 | 0.513 | 0.974 |
| VAJO | Valcuerna | Juniperus oxycedrus L. | 1914–2022 | 0.328 ± 0.213 | 30/15 | 0.246 ± 0.191 | 0.324 | 0.878 |
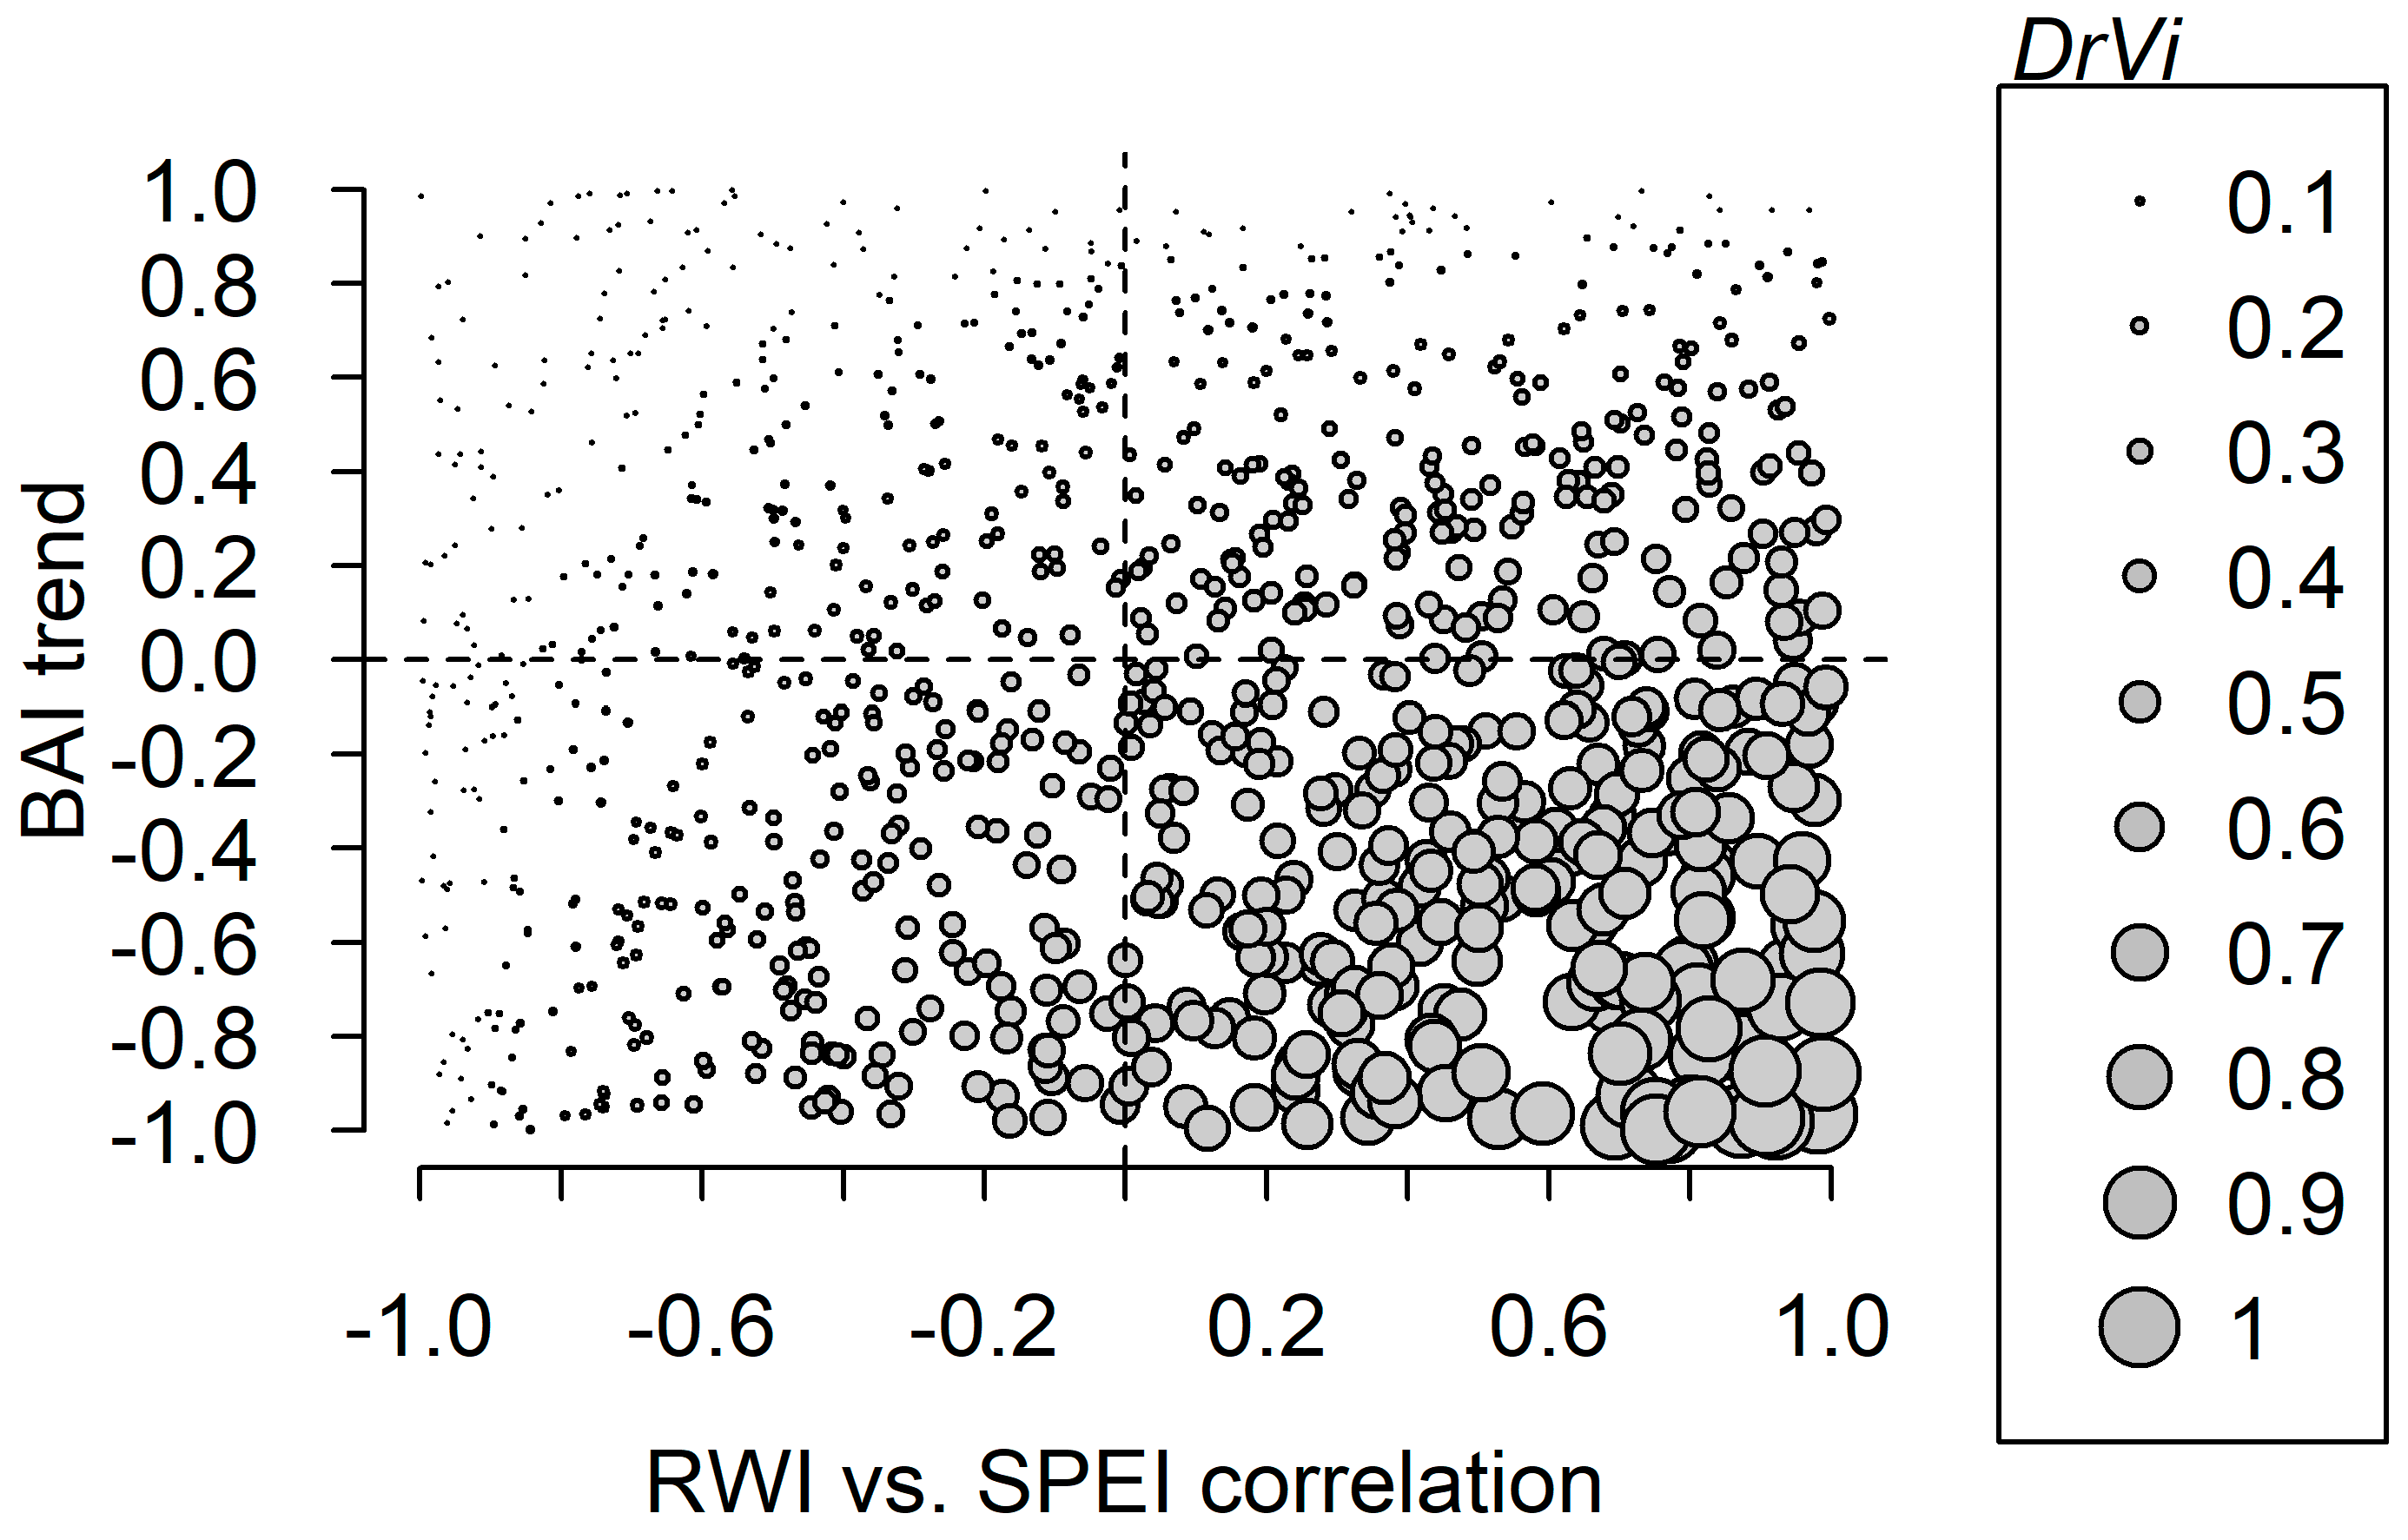
| Code | Site | Species | RWI–SPEI Correlation | Trend in the Max. RWI–SPEI Correlation | BAI Mean Trend | Trend in the BAI Mean Trend |
|---|---|---|---|---|---|---|
| ALAM | Sierra de Alcubierre | Acer monspessulanum L. | 0.500 ± 0.017 | 0.751 * | 0.417 ± 0.066 | −0.846 * |
| LAAM | Acer monspessulanum L. | 0.371 ± 0.023 | 0.342 | 0.673 ± 0.025 | −0.163 | |
| LAEP | Ephedra nebrodensis Tineo ex Guss. | 0.604 ± 0.012 | 0.155 | 0.264 ± 0.084 | 0.876 * | |
| LAJO | Juniperus oxycedrus L. | 0.559 ± 0.007 | 0.161 | 0.063 ± 0.056 | −0.828 * | |
| LAPH | Pinus halepensis Mill. | 0.738 ± 0.006 | −0.003 | −0.336 ± 0.064 | −0.476 * | |
| LAPL | Pistacia lentiscus L. | 0.553 ± 0.016 | 0.249 | 0.491 ± 0.025 | −0.845 * | |
| NAJO | Juniperus thurifera L. | 0.651 ± 0.007 | 0.382 * | 0.697 ± 0.025 | −0.866 * | |
| PEJT | Napal | Juniperus oxycedrus L. | 0.707 ± 0.018 | 0.911 * | 0.350 ± 0.035 | −0.439 * |
| VAJO | Valcuerna | Juniperus oxycedrus L. | 0.588 ± 0.019 | 0.927 * | 0.321 ± 0.021 | −0.204 |
Disclaimer/Publisher’s Note: The statements, opinions and data contained in all publications are solely those of the individual author(s) and contributor(s) and not of MDPI and/or the editor(s). MDPI and/or the editor(s) disclaim responsibility for any injury to people or property resulting from any ideas, methods, instructions or products referred to in the content. |
© 2025 by the authors. Licensee MDPI, Basel, Switzerland. This article is an open access article distributed under the terms and conditions of the Creative Commons Attribution (CC BY) license (https://creativecommons.org/licenses/by/4.0/).
Share and Cite
Gazol, A.; Tamudo-Minguez, E.; Valeriano, C.; González de Andrés, E.; Colangelo, M.; Camarero, J.J. A Standardized Framework to Estimate Drought-Induced Vulnerability and Its Temporal Variation in Woody Plants Based on Growth. Forests 2025, 16, 760. https://doi.org/10.3390/f16050760
Gazol A, Tamudo-Minguez E, Valeriano C, González de Andrés E, Colangelo M, Camarero JJ. A Standardized Framework to Estimate Drought-Induced Vulnerability and Its Temporal Variation in Woody Plants Based on Growth. Forests. 2025; 16(5):760. https://doi.org/10.3390/f16050760
Chicago/Turabian StyleGazol, Antonio, Elisa Tamudo-Minguez, Cristina Valeriano, Ester González de Andrés, Michele Colangelo, and Jesús Julio Camarero. 2025. "A Standardized Framework to Estimate Drought-Induced Vulnerability and Its Temporal Variation in Woody Plants Based on Growth" Forests 16, no. 5: 760. https://doi.org/10.3390/f16050760
APA StyleGazol, A., Tamudo-Minguez, E., Valeriano, C., González de Andrés, E., Colangelo, M., & Camarero, J. J. (2025). A Standardized Framework to Estimate Drought-Induced Vulnerability and Its Temporal Variation in Woody Plants Based on Growth. Forests, 16(5), 760. https://doi.org/10.3390/f16050760