Abstract
The resilience and regeneration of cork oak (Quercus suber L.) play a central role in sustaining the European oak landscape, particularly within the socio-economic and ecological frameworks of the Western Mediterranean. This species has a noticeable ability to withstand drought and temperature extremes. However, its natural regeneration is increasingly challenged by climate change and associated extreme weather events, as well as by competition among individuals for light, water, and nutrients. Monitoring this process in the field can be time-consuming, requiring the use of sampling techniques and the identification of appropriate inventory sampling design (ISD) schemes. Line transect (LT) and radial cluster (RC) inventory designs are widely used in ecological studies, botanical research, and plant species distribution assessments, as well as other environmental forestry studies. This research compares two inventory sampling designs (line transect vs. radial cluster) for inventorying and monitoring the dynamics of natural regeneration at the initial development stages of cork oak. In particular, this study evaluates the influences of inventory sampling design, time, and acorn density on the total living and dead seedlings over a two-year period, using the cork oak as a reference species in the Mediterranean climate of Northern Portugal. The results confirm the critical role of acorn availability in seedling regeneration dynamics within cork oak ecosystems and emphasize a temporal increase in the death of seedlings, markedly influenced by the day of year. The temporal component had a substantial impact on seedling mortality, which increased by 5.00‰ per day, meaning that one seedling died approximately every 200 days, whereas mortality spikes occur on specific days, suggesting temporal factors affecting seedling viability. The study also shows differences in regeneration estimates between the inventory designs. The line transect design records lower acorn density and seedlings than the radial cluster design. The results highlight an important but often overlooked source of variation in forest regeneration studies, emphasizing the need for careful consideration of inventory methods to ensure effective data collection and accurate representation of natural regeneration dynamics, ultimately supporting efforts to enhance cork oak regeneration and resilience against climate change and competitive pressures.
1. Introduction
Mediterranean vegetation is determined not only by temperature but to a large extent by the availability and seasonality of moisture [1,2] and particularly by human activities such as cultivation, forestry, livestock grazing, controlled burning, and clearcutting that shaped and transformed vegetation, creating novel plant communities such as olive, chestnut, walnut and also cork oak woodlands [1].
European oakscape (as defined in ref. [3] to describe oak landscapes) represents a delicate balance between tree regeneration, encompassing germination and early seedling growth, and various influencing factors. Beneficial elements, including advantageous climatic circumstances and effective silvicultural activities, encourage this regeneration [4,5,6,7]. Conversely, negative factors, such as unfavorable site location, competition from shade-tolerant competitors or rapidly growing pioneering species, may counteract it [3,6,7,8,9,10,11].
Being informed about the regeneration status is indispensable for making wise decisions in the management of forestry production areas [8]. Either the presence or the absence of vegetation influences the selection of harvest methods, and the subsequent actions aimed at preserving or establishing it [9,10]. The cork oak (Quercus suber L.), an evergreen botanical species indigenous to the Western Mediterranean region, particularly the Iberian Peninsula, is renowned for its dual ecological and economic significance [11]. In Portugal, cork oak is one of the most dominant tree species, occupying 720,000 ha and representing 23% of the Portuguese forested area [12,13]. Being the country with the largest area of cork oak in the world, this species plays an important role in the national economy [14,15]. The remarkable thermotolerance and acclimatization to drought of the cork oak are demonstrated by this species, which is well adapted to the current Mediterranean climatic conditions. Furthermore, these attributes depend on both age and genetic factors [16,17]. This botanical resilience underscores its critical role in the socioeconomy of the region [18,19]. Within cork oak stands, natural regeneration unfolds as a dynamic process wherein novel individuals integrate with the established population, thereby offsetting losses incurred through mortality [20,21]. This intricate phenomenon, shaped by diverse biotic and abiotic factors, encompasses multiple reproductive stages [22,23]. Notably, the cork oak has a unisexual reproductive system, meaning that male and female flowers are produced on the same tree but in separate structures (monoecious), and is characterized by a heightened self-incompatibility, which prevents self-fertilization and promotes cross-pollination between different trees [24]. The flowering process usually starts during the period spanning from March to June in 15- to 20-year-old trees, with wind-pollinated blossoms maturing into acorns [25].
In the “Corkoakscape”, the environmental and meteorological conditions significantly influence annual and biennial acorn production variability [26,27,28]. The annual variation in acorn production is observed among individual trees [28]. Acorn formation typically occurs between July and August of a given year, with mature acorns falling from the branches in the period between October of the same year and February of the following year [29,30]. Survival of these acorns is constrained by ineffective dispersal, absence of viable cork oak, and high post-dispersal losses due to predation [23,31,32].
Cork oak seedling survival is assumed to be contingent upon germination behavior, seedling size, soil conditions, climate anomalies, wild pastoralism, and species interactions within interspecific communities, making it difficult to predict [33,34]. Climate change further exerts adverse impacts on regeneration survival [35], by causing abiotic soil degradation through extreme heat, prolonged drought, and storms [36,37]. These stressors weaken tree health, increasing susceptibility to pests and diseases [38]. As a result, the transition from acorn to seedling is becoming increasingly complex, requiring forest management interventions to mitigate these constraints [21,39].
For cork oak forests, climate change and other stressors require in-depth investigation to understand and mitigate their impact on regeneration (e.g., refs. [16,40,41]). Mitigating these impacts through forest management remains an ongoing challenge, requiring further research [20,21]. However, forest ecological studies fundamentally rely on the selected inventory sampling design (ISD), which directly influences their outcomes [42], including the specification of the shape and size of the sampling unit and how those units are organized as a structure. Among the various ISD frameworks, two noteworthy approaches, the line transect (LT) and the two-stage radial cluster (RC), have etched enduring legacies in the annals of ecological investigation [43,44,45]. These two ISD methodological choices, with their distinct merits and limitations, continue to shape our understanding of ecological dynamics [46]. The LT, rooted in early botanical explorations, holds historical significance, as it facilitated the cartographic delineation of plant species distribution across diverse terrains [47]. Initially employed in the early 20th century, LT gained prominence in ecology as plant ecologists sought to understand vegetation distribution along environmental gradients.
In contrast, the use of the RC in studies concerning forest dynamics is mainly due to the need to understand the impact of the tree falls on light patterns and seedling growth, capturing the randomness of these events [48]. The notoriety of RC increased in the mid-20th century as the importance of spatial patterns in ecological processes began to be embraced by ecologists. As far as the authors are aware, there are no specific studies on the appropriate ISD for cork oak regeneration studies within the scope of forest management.
This study has two primary objectives. The first objective is to evaluate the relationship between acorn density, total live seedlings (TS) categorized by height into two groups (TS1: height ≤ 10 cm; TS2: height > 10 cm), and dead seedlings (DS), while considering the impact of the inventory sampling design, specifically the RC and LT designs, on seedling outcomes. The second objective is to examine how variations in inventory sampling design (ISD) affect the estimation of seedling and acorn abundance using readily available ecological variables, particularly day of the year (DOY, ranging from 1 for 1 January to 365 for 31 December, or 366 in a leap year), used as a time proxy to facilitate temporal analyses. The hypothesis for objective one posits that a higher density of acorns would be positively correlated with the quantity of live seedlings, irrespective of the sampling design used. Objective two posits a relationship between the day of year (DOY) and both live and dead seedlings, with elevated DOY values being associated with increased seedling mortality and reduced abundance of live seedlings. In Mediterranean environments, seedlings are exposed to environmental stresses throughout the growing season, such as summer drought and increasing competition over time, which can considerably affect seedling survival.
2. Materials and Methods
2.1. Study Area and Inventory Design
The research was conducted in Northeastern Portugal, within the Trás-os-Montes region, specifically in the municipality of Mogadouro, Bragança district. The study area has a Mediterranean climate characterized by hot, dry summers and cold, moist winters. Throughout the year, average temperatures range from 1 °C to 29 °C, with extremes between −4 °C and 35 °C. The region receives an average annual precipitation of 558 mm, with the rainy season extending from October to May. November and December are the wettest months, with averages of 76.9 mm and 80.4 mm of rainfall, respectively, while July is the driest month, with 8.9 mm. Meteorological data were sourced from three nearby weather stations, Bragança, Vila Real Airport, and Salamanca Airport, and analyzed using historical weather reports and model reconstructions (1980–2016). Climatic estimates were adjusted for elevation differences following the “International Standard Atmosphere” model and refined using the “MERRA-2 satellite-era Reanalysis” dataset [49,50]. In the study area, the soil type is dystric and umbric leptosols [51]. A more detailed and comprehensive description of the characteristics of the study area, including its topography, climate, and vegetation, can be found in ref. [52].
Two circular plots (A1 and A2; Figure 1), each with an area of 500 m2 (radius = 12.62 m), were established in the pilot forest to monitor the dynamics of cork oak regeneration. Plots A1 and A2 are located at 41.352589° N, 6.794488° W (570 m a.s.l.) and 41.352578° N, 6.792151° W (579 m a.s.l.), respectively. The evaluations were carried out on sampling plot within A1 and A2 using two inventory sampling designs (ISD), the line transect (LT) and the two-stage radial cluster (RC), as shown in Figure 1. The LT design has 12 square subplots, resulting in a total of 24 subplots when considering both A1 and A2 plots. Each subplot covers an area of 1 m2 (1 m × 1 m), organized consecutively in a rectangle configuration spanning 12 m in length and 1 m in width. The center of LT is located at the midpoint of each plot (Figure 1). In contrast, the RC design comprises five clusters of subplots, each encompassing a square area of 4 m2. Each cluster comprises four square subplots of 1 m2 (1 m × 1 m), yielding a total of 20 subplots (4 subplots × 5 clusters) per plot, and an aggregate of 40 subplots for plots A1 and A2 combined. One cluster is situated at the center of the plot, and the other four clusters are arranged radially, equidistantly positioned from the center (6 m), the plot boundary, and from one another (Figure 1).
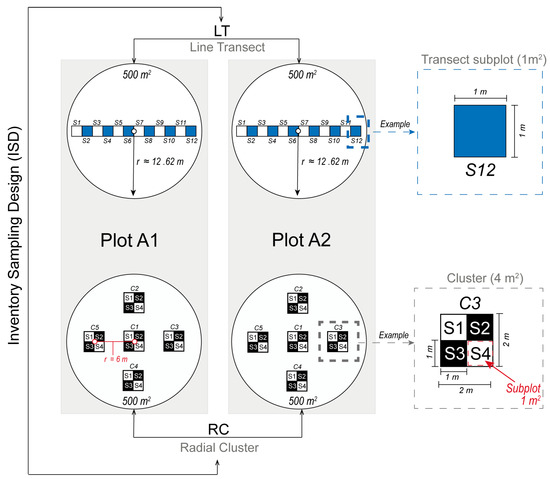
Figure 1.
Inventory sampling design (ISD) for sampling seedlings and acorns, featuring two linear horizontal transect plots and two radial cluster plots. Subplots are labeled with the prefix “S” and numbered 1 to 12 for LT plots and 1 to 4 for RC plots. Clusters in RC plots are denoted with the prefix “C” and numbered 1 to 5. Notice: For the sake of clarity, ISDs are shown separately and are not drawn to scale in the graphs.
The overlap area resulting from the two types of inventory sampling design is 8 m2 (12.5%), primarily located in the central region. The cumulative overlap area resulting from the two types of inventory sampling design was evaluated to be 64 m2, and the overall observation overlap between the designs was found to be 9.10%.
2.2. Monitoring and Data Collection
Monitoring and data collection were performed in 2022 and 2023 within both plots and sampling designs. The number of acorns per m2 (Acorns) and the total number of living seedlings per m2 (TS) were recorded along the year at the monitoring dates on the following DOY: for 2022, the DOY were 46, 157, 263; while for 2023, the DOY were 4, 181, 312 (304 only for the plot A2) (Table 1). Dates match the seasonal time periods of winter, late spring/early summer, late summer 2022, and winter 2023, respectively. The living seedlings were recorded according to specific categories based on size and subsequently divided into two groups: (1) specimens with a height of 10 cm or less (TS1) and (2) specimens with a height greater than 10 cm (TS2) (Table 1). In addition, the dead seedlings (DS) were also recorded within each 1 m2 subplot. The dead condition of a seedling was determined through careful visual observation, assessing key indicators such as complete leaf desiccation, stem discoloration, loss of structural integrity, and absence of any signs of regrowth.

Table 1.
Mean and standard deviation of response and source of variation variables for all observations (total) and by inventory sampling design (ISD). ISD includes line transect (LT) and radial cluster (RC), both considered categorical sources of variation in the analysis. The variables TS, DS, TS1, TS2, and Acorns are expressed in terms of counts per square meter, while DOY is expressed as day number after 1 January 2022.
Day of the year (DOY) was used as a proxy for seasonal progression in cork oak phenology, as it aligns with key environmental cycles in Mediterranean ecosystems, including temperature, photoperiod, and soil moisture. This approach captures the cumulative effects of seasonal drivers while ensuring methodological consistency across years. However, interannual climatic variability (e.g., drought anomalies) may decouple DOY from phenological triggers, a limitation further discussed in Section 4. The effect of year was excluded from the analysis, as preliminary models incorporating it as a fixed or random effect showed no significant improvement in mixed model fit (p = 0.66–0.98), indicating that interannual variability did not substantially influence acorn and seedling development in this dataset.
2.3. Statistical Analysis
Four mixed models with autoregressive model of first order (AR(1)) repetitive structure were applied separately to the response variables TS, DS, TS1, and TS2. The number of Acorns, DOY, ISD, and their interactions served as fixed factors. For all four mixed models, the F-values and their respective p-values were assessed. The Variance Inflation Factor (VIF) of source of variations was evaluated, and the sources of variation were deemed legitimate only if VIF < 2 (Table A1).
To determine whether to include the overlap observations (9.10%) between the two ISDs, we compared the differences in means, standard deviations, and VIF of each variable for the two ISDs, and also the F-values between the results of the mixed model derived from datasets with and without overlapping. The analysis includes Spearman Rank correlation and a Wilcoxon signed-rank test. In the dataset without overlap, RC values were removed due to their predominant area, leading to an RC-only correlation. For LT, no comparison was made since the overlapped and non-overlapped datasets had identical values.
All analyses performed in this research were conducted using JMP® (v18). SAS Institute Inc., Cary, NC, USA, 1989–2024.
3. Results
Statistical analyses (see Appendix B) demonstrated that the predetermined area overlap between the two ISD would not impact the inferences to be drawn from the results, and thus all observations were retained. The results presented herein pertain to the total observations.
3.1. Seedling Significance Differences
The mixed model results indicate the primary causes of variance in the response variables (Table 2). The outcomes indicate that the quantity of acorns considerably affects the fluctuation in the number of seedlings. Moreover, the type of ISD affects this variance, namely the lower (TS1) and taller (TS2) surviving seedlings (Table 2).
Table 2.
Mixed model F-values and their p-values for TS, DS, TS1, and TS2 as response variables. (*) p < 0.05, (**) p < 0.01, (***) p < 0.0001, (ns) p > 0.05 (not significative). The DOY is the day of year, and ISD is inventory sampling design.
Analyzing case by case, the F-values indicate that variations in the number of acorns are significantly associated with the number of seedlings (TS, p < 0.0001) (Table 2), as well as with the total number of seedlings less than 10 cm tall (TS1, p < 0.0001) (Table 2). The ISD significantly influences the variation in TS and TS1, contributing to discrepancies in individual effect estimates (TS1, p < 0.01) and in interaction with the acorn quantity (TS and TS1, p < 0.05), as well as being more pronounced in taller seedlings (TS2, p < 0.01). The sample design, classified as LT and RC, exhibits a significant relationship with the total number of seedlings (TS). The ISD interaction with acorns indicates that the sampling designs LT and RC influence the association between TS1 and Acorns, and TS2 and Acorns. The temporal component DOY substantially influences the number of dead seedlings (DS, p < 0.05) (Table 2). Other factors may influence the variation of DS, but with little impact and presumably of a non-causal character. Is the case of TS1, where the DOY exhibits a marginally significant correlation with Acorns and ISD (p < 0.05).
3.2. Inventory Sampling Design Effects
The mixed model analysis indicated a significant effect of ISD on TS1 and TS2. The mean density of total living seedlings (TS) was 3.22 per square meter for LT and 5.45 for RC (Table 1 and Figure 2). Using RC as the reference (100%), the mean value of LT represented 59.08% of RC, indicating a 40.92% reduction in TS mean density estimates for LT. When analyzing the TS subgroups separately, similar patterns are evidenced. TS1 (seedlings ≤10 cm in height) displayed mean values of 1.95 units for LT and 2.84 for RC, representing a 31.34% reduction in TS1 density estimates from LT assessments. Similarly, TS2 (seedlings > 10 cm in height) displayed mean values of 1.27 units for LT and 2.61 for RC, indicating a 51.34% reduction in TS2 estimates for LT.
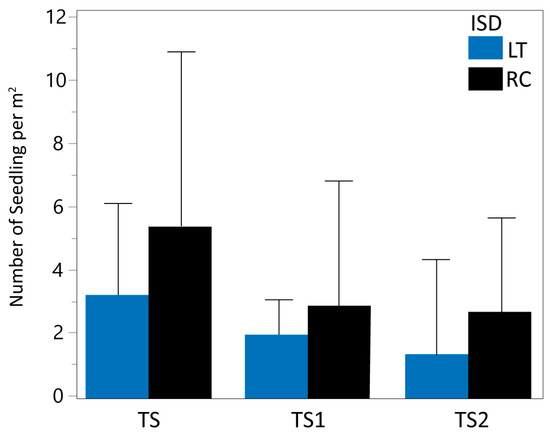
Figure 2.
Mean and standard deviation of actual data for living seedling density (TS, TS1, and TS2) for LT (in blue) and RC (in black) inventory sampling design.
The ISD was maintained as a variable in the TS, TS1, and TS2 density, both as an interaction with Acorns density and as an independent component in conjunction with Acorns (ISD × Acorns). Analyzing the quantity of seedlings in the two ISD, the results show that seedling abundance is associated with acorn density in both designs, with a stronger relationship observed in the RC design. The patterns observed in TS1 and TS2, similar to TS overall, emphasize significant differences in how inventory designs capture seedling establishment dynamics.
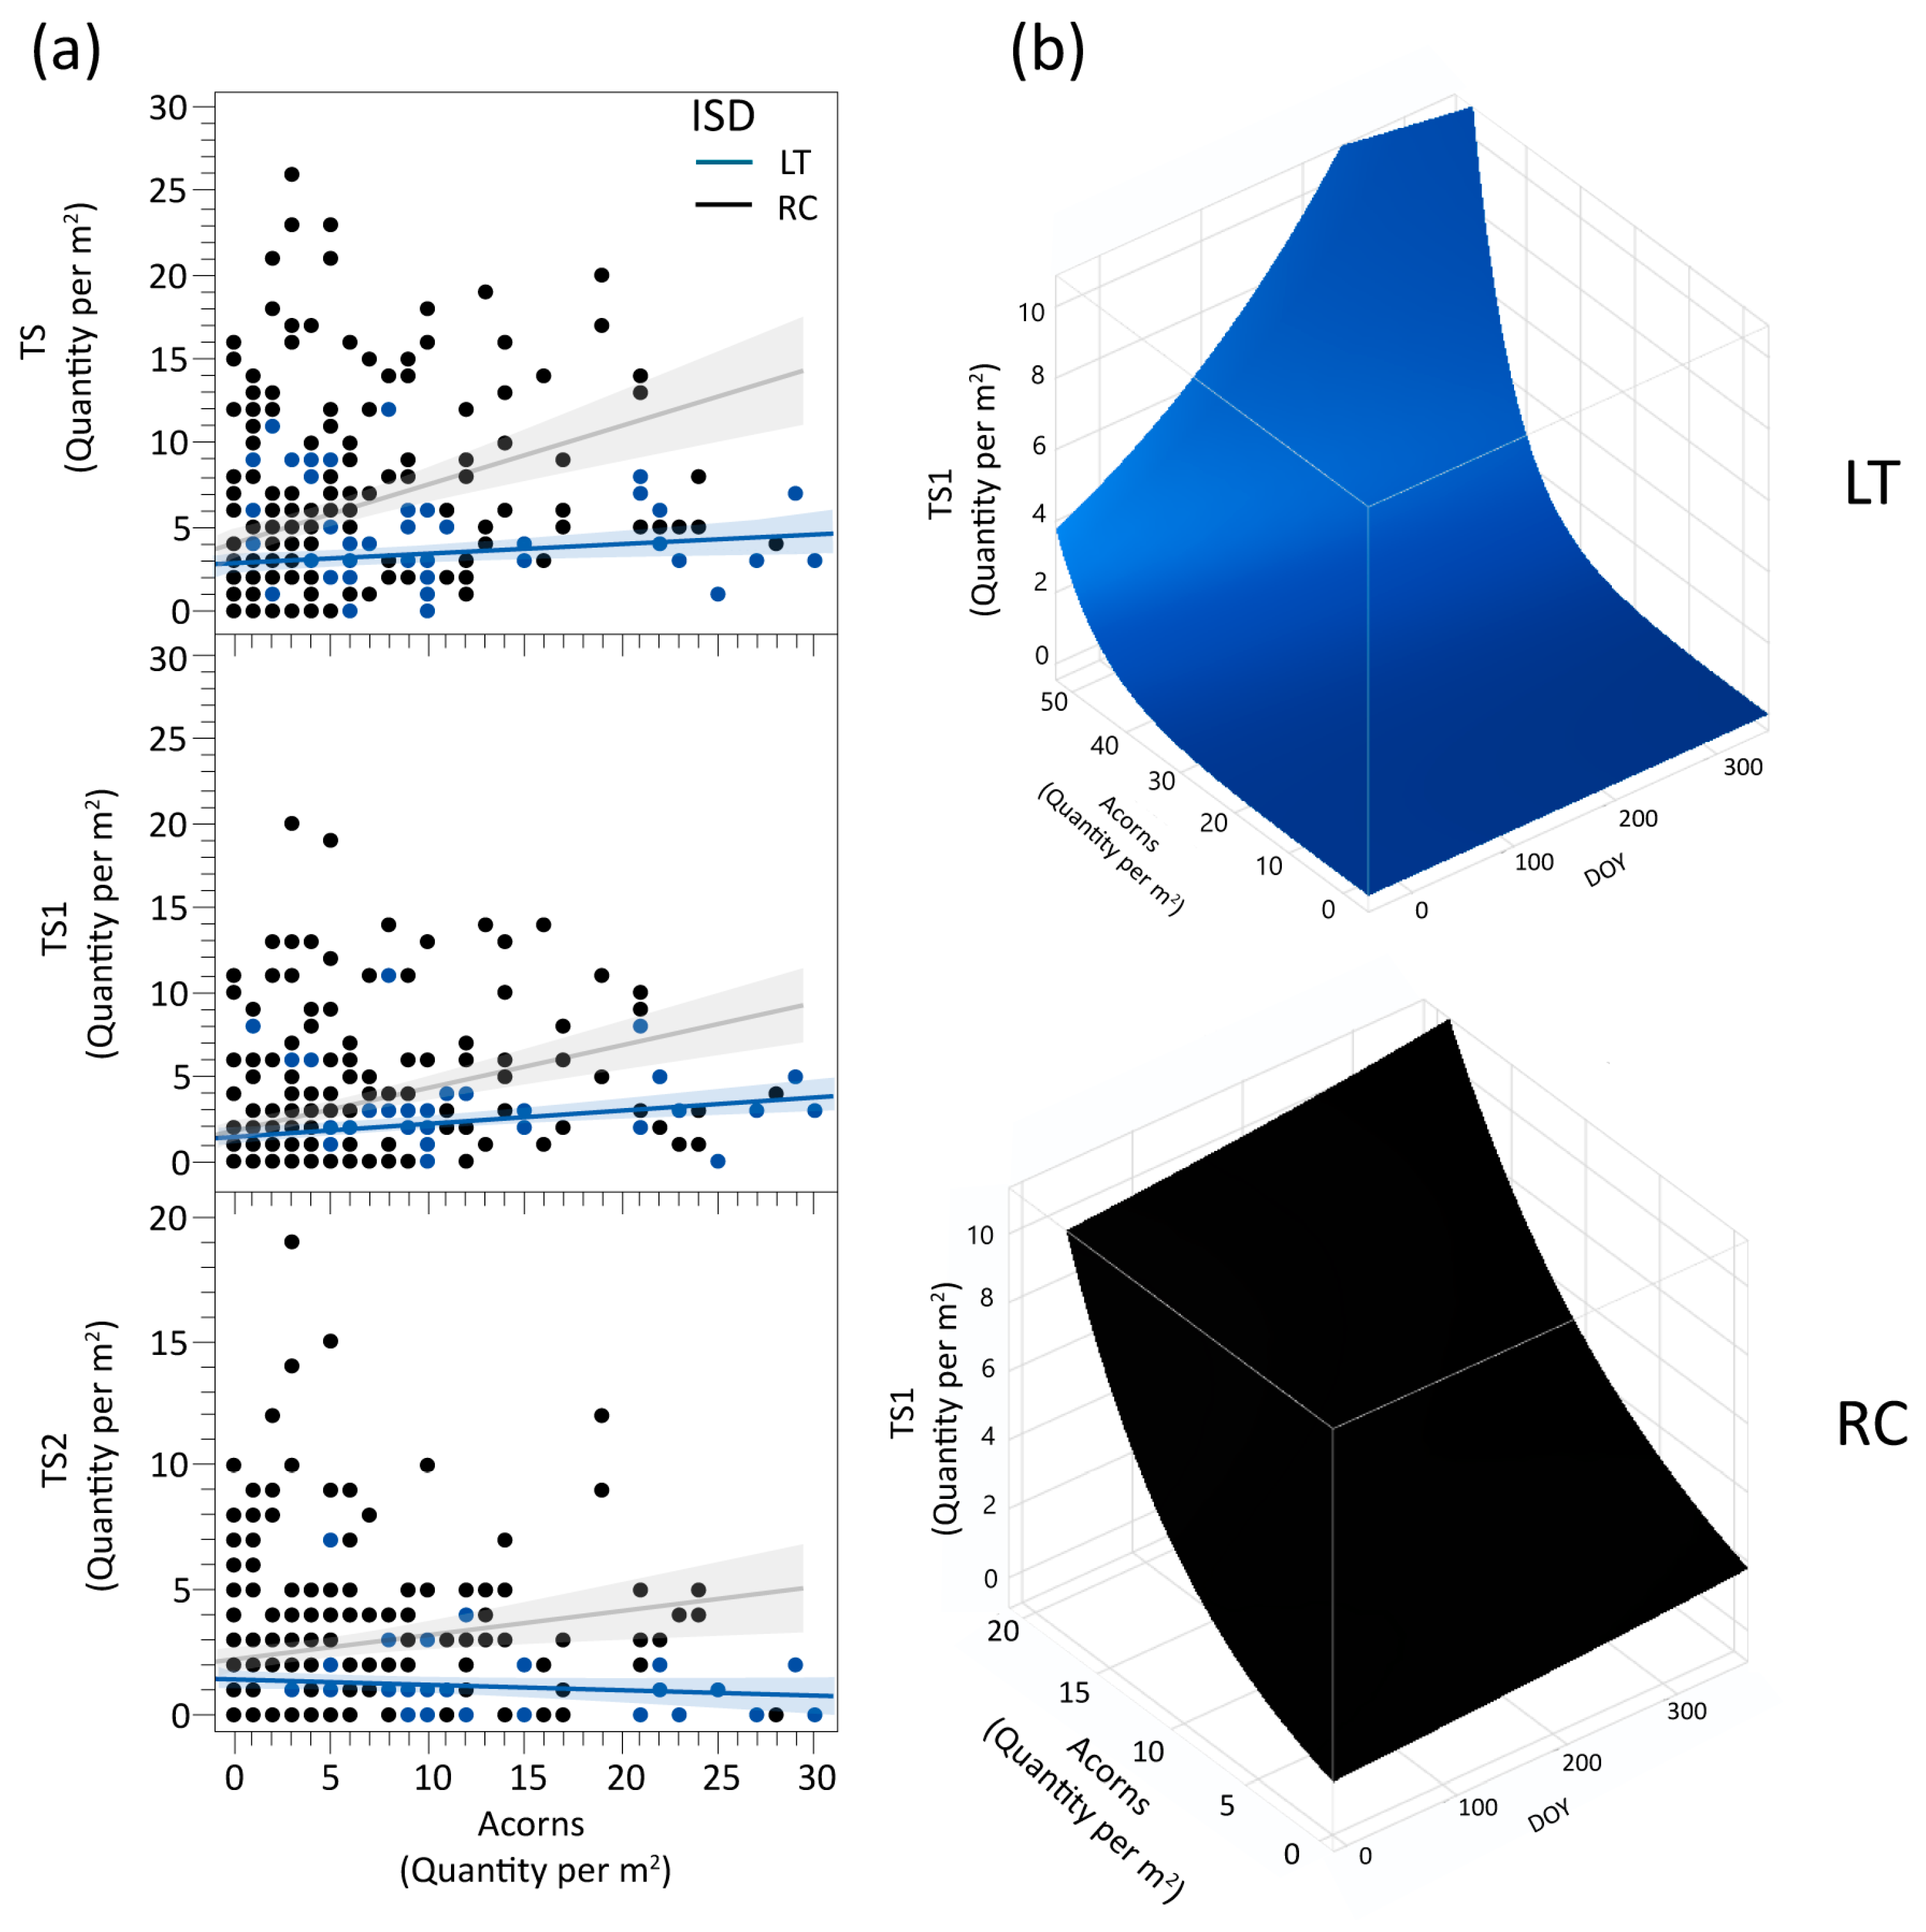
The interaction ISD × Acorns × DOY is significant in TS1, showing a growth trend in TS1 with increasing acorns in both RC and LT (Figure 3). However, in LT, after about DOY 159, TS1 begins to decline slightly, as can be seen in Figure 3b, marking a shift from the previous upward trend, which does not occur in RC.

Figure 3.
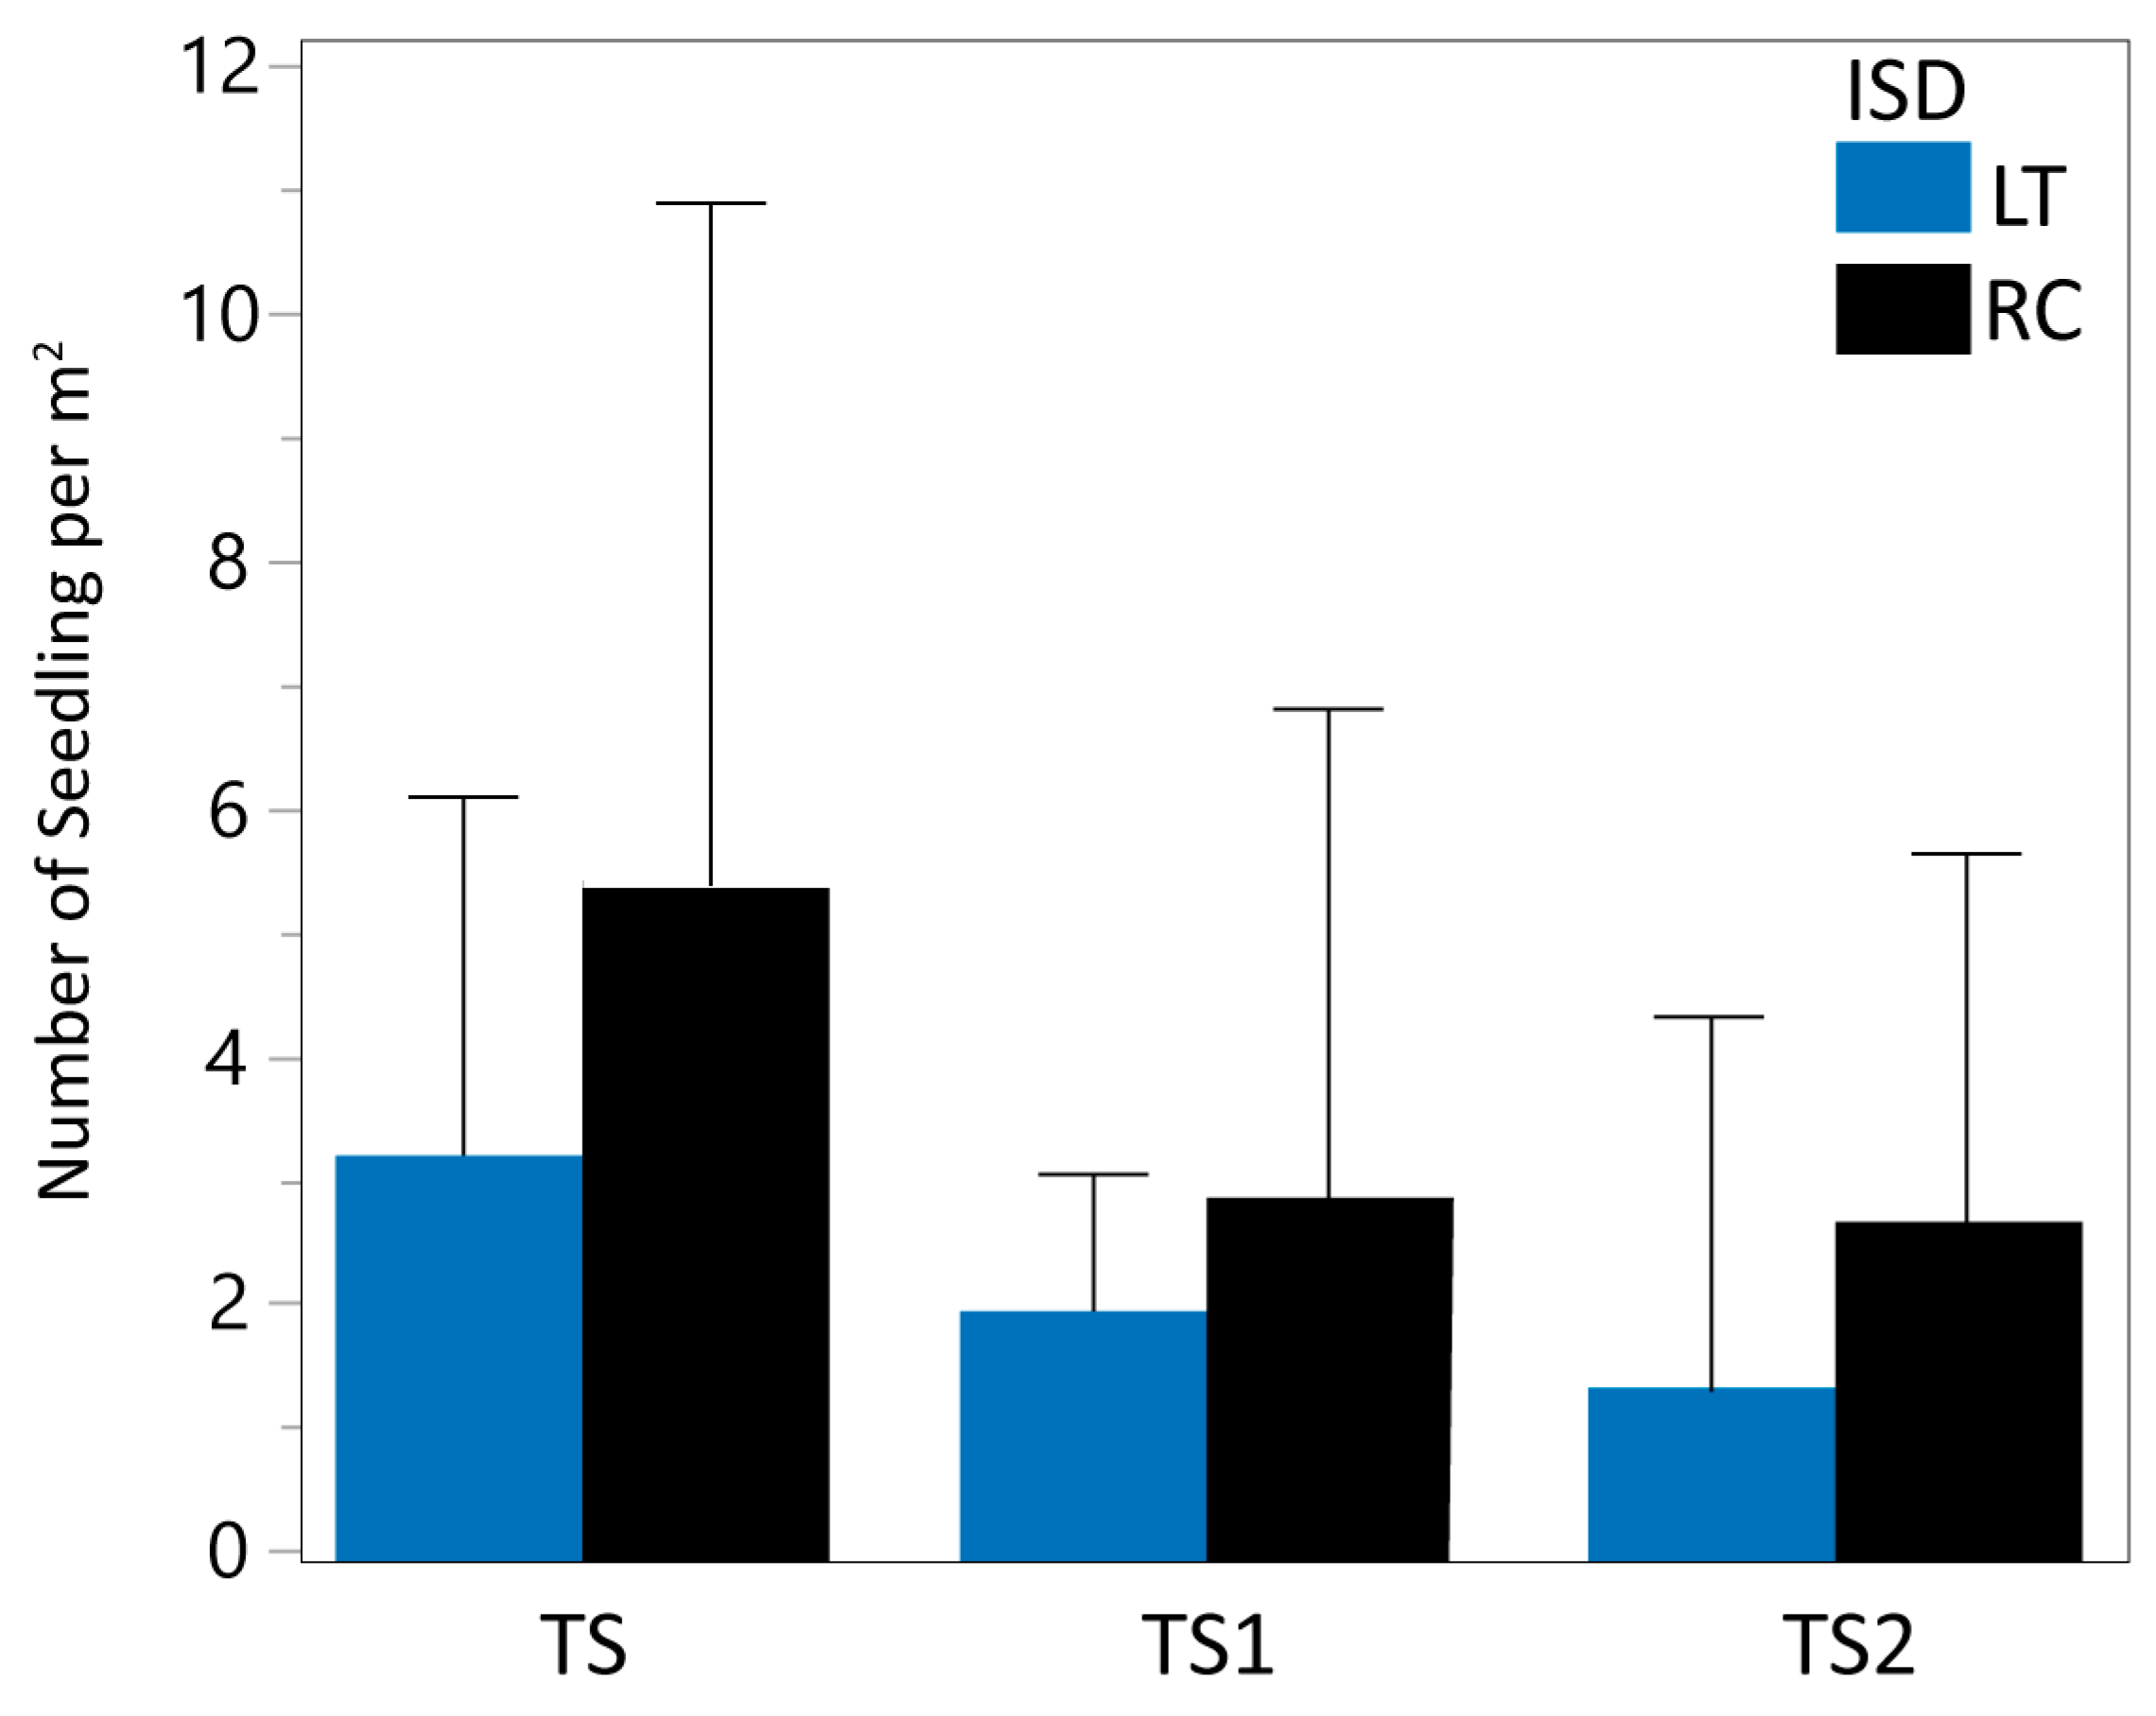
(a) Denotes the relationship between each ISD (LT and RC) for the live seedlings (TS; TS1; TS2) and the number of acorns per square meter. (b) The relationship of TS1 with interaction ISD × Acorns × DOY is shown by two 3D graphs, LT (in blue) and RC (in black). Note. The Acorns density scale is different because the increased intensity of TS1 density was more pronounced in RC than in LT.
The mixed model results show that DOY has a small but positive effect on dead seedling density (DS), independent of ISD. The trend is described by DS = 0.18 + 0.005 × DOY, indicating that seedling mortality increases by 5.00‰ per day. This average estimate equates to one seedling dying approximately every 200 days (approximately 6–7 months). Although less visually obvious than other relationships (e.g., TS vs. Acorns), this trend suggests a gradual increase in seedling mortality over time.
4. Discussion
We conducted this study over two years in a mature Mediterranean cork oak forest in Portugal, focusing on natural regeneration dynamics. Emphasis was placed on examining the dynamics of natural regeneration in terms of acorns and seedlings over time, whilst considering the influences of the sampling design (RC and LT) on data assessment. The research results support the hypothesis that higher acorn density is a significant predictor of live seedling abundance throughout all early stand development stages, reinforcing the relationship between acorn availability and seedling establishment. However, this relationship should not be interpreted as evidence of a direct causal sequence linking current acorn density to seedling abundance. Instead, it is more likely to reflect common ecological factors that simultaneously promote both higher acorn inputs and favorable conditions for seedling recruitment, such as suitable microhabitats, reduced predation pressure, and favorable climatic conditions. We argue that the sampling design influences the estimated effects of acorn density on seedling development, as demonstrated by the differences observed between RC and LT. Our data indicate that time significantly affects seedling mortality, suggesting that seasonal timing plays a critical role in seedling viability. While DOY influences the number of dead seedlings (DS), it does not significantly alter the predicted abundance of live seedlings, even when considered alongside acorn density or sampling design. We confirm that variations in DOY influence model prediction for acorn abundance when seedlings are ≤10 cm tall, but only in interaction with acorn density and sampling design.
The present study highlights the importance of selecting and adapting ISD when modeling the stand development stages for silvicultural practices. In the studied cork oak ecosystem, the RC design proved particularly effective in assessing regional regeneration patterns. Previous studies, such as refs. [53,54], have also employed the RC design in regionally distributed sampling of cork oak regeneration dynamics. Our findings align with those of ref. [12], who similarly employed the RC design to examine cork oak regeneration in mainland Portugal, exploring how canopy cover influences spontaneous regeneration at different development stages.
Both this study and Ribeiro et al. [12] used a 500 m2 circular plot, incorporating five 4 m2 square subplots (as also adopted by ref. [55]) to achieve the fine-scale resolution necessary for understanding localized ecological processes. This design effectively captures spatial differences in regeneration patterns. Ritsche et al. [7] emphasize the value of dividing square plots into 1 m2 subplots, showing this method’s ability to identify spatial variations and capture gradients, such as canopy cover and stand density. These configurations have consistently shown notable efficacy in facilitating cork oak regeneration assessments throughout heterogeneous landscapes, as corroborated by previous research [7,46]. Moreover, our findings corroborate the claims of ref. [48], who emphasized that cluster designs such as RC improve cost-effectiveness (see also ref. [56]) and precision, especially in heterogeneous ecosystems like cork oak forests. Our results indicated that the RC design effectively documented intense regeneration inside restricted oak woods, in contrast to more open cork oak woodlands or shrublands [4,5,57,58].
We affirm that the application of RC in inventory evaluations is effective, as evidenced by its prior utilization in national forest inventories in Austria, Finland, France, Germany, Sweden, and the USA [48,59]. The results also validate the application of the RC design grounded in cluster sampling principles, which emphasize optimal spatial utilization and multifaceted observation [48]. Additionally, our findings indicate that RC design methodology, employing a cluster distribution scheme similar to the traditional Camp Unit System utilized in Thailand for teak inventories [60], improves area coverage while minimizing field effort, thereby effectively capturing substantial ecological gradients. The implementation of the RC design demonstrates its versatility and precision, rendering it an optimal selection for cork oak natural regeneration assessments and further substantiating its utility in regeneration research. One key advantage of cluster sampling is the reduced need for a comprehensive sampling frame at the element level across the entire population. Instead, cluster-level frames, often defined by administrative or geographical boundaries (e.g., districts, villages, or enumeration areas), are typically sufficient [61]. In our case, this concept applies to analyzing acorn abundance and allows a better understanding of how geographical and environmental factors influence natural regeneration.
Our findings regarding LT validate its efficacy as a versatile strategy for sampling in varied environments in ecological studies. Our LT results confirm the ref. [62] methodology, which, when combined with Monte Carlo integration (for details see also ref. [63]) to improve estimates, supports the use of LT for assessing seedling abundance in various canopy covers. This shows that using a one-dimensional baseline for sampling forest attributes works well, especially in areas with irregular shapes like riparian zones, because it gets rid of the need to estimate land area. Across these regions, the LT approach circumvents reliance on exact land measures, enabling uncomplicated execution across intricate terrains. Also, ref. [64] mentions how effective LT is in multi-treatment designs for studying cork oak growth in a variety of settings, pointing out how well it works for dealing with complex ecological interactions. Their study illustrated how climatic elements such as temperature and precipitation affect tree growth, whereas we noted that LT is similarly proficient in capturing micro-climatic impacts on seedling abundance. Therefore, the utilization of LT in specific cases and block design showcases the flexibility and efficiency of ISD, making it suitable for cork oak regeneration and seedling distribution in diverse environments.
In flat terrain, the number of seedlings increased as the cork oak cover increased, likely due to a higher concentration of acorns in low-humidity areas and more favorable sunlight and microclimatic conditions beneath the tree canopy for seedling growth [65,66,67]. As Ritsche et al. [7] also describe, the slope induces a non-homogeneous distribution of acorns, and this alteration leads to the simultaneous germination of seedlings. Further studies are needed to understand how acorn distribution influences the simultaneous germination of seedlings and the variation in density across different regeneration stages. Although this may be challenging in sampling time, as the LT is a simpler design compared to the RC. The LT design utilized fewer subplots (24 vs. 40 in RC), potentially impacting labor efforts. Our analysis estimates that total labor hours for LT were approximately 85% of those required for RC, balancing reduced spatial coverage with lower per-unit effort. This trade-off suggests that LT may be a more cost-effective option for long-term monitoring when resources are limited and vegetation is homogeneously dispersed, while RC’s larger sample size enhances the detection of rare events, such as seedling mortality.
As reported by Vaz et al. [67], acorn density significantly influences the initial phase of seedling development. Both biotic and abiotic factors contribute to acorn loss, altering the balance between acorn input and successful seedling establishment. Abiotic, biotic, and anthropogenic sources pose a threat to cork oak forests in the Iberian Peninsula and North Africa, according to recent research. Studies attribute the limitations on acorn and seedling density to drought, soil conditions, land management, and herbivory [29,68,69]. Among the abiotic factors, de Sousa et al. [70] and Camilo-Alves et al. [71] indicate that drought is the primary cause of cork oak mortality. Additionally, Herrera et al. [72] identified that failures in the natural regeneration of cork oak are primarily attributable to seed predation and grazing by both domestic and wild animals. Subsequent studies, such as refs. [58,73], reaffirmed these findings. Time interrelates all factors influencing seedling survival with abiotic and biotic stresses acting as seedling selectors, exposing deficiencies in competitiveness, resiliency, and evolutionary potential [74,75].
In our study, the variable time, represented by DOY, was significantly associated with the density of dead seedlings (DS). This association likely reflects the influence of seasonal environmental factors, such as summer droughts typical of Mediterranean climates, which affect plant responses and contribute to cork oak seedling mortality. For example, the relationship between DOY and cork oak seedling mortality is evident on days 114 and 115, which fall during the peak summer months, highlighting the impact of seasonal stress on seedling survival. During this period, increased evapotranspiration and reduced water availability create critical drought conditions, significantly impacting seedling survival. Furthermore, several studies have linked mortality at specific DOY markers to the physiological stress experienced by seedlings, with their survival largely dependent on their resilience [71,74,75]. In cork oak ecosystems, annual competition between oak seedlings and mature trees is a characteristic dynamic, resulting in a predictable mortality rate after germination [29]. In addition, annual variations in environmental factors such as temperature, precipitation, soil moisture, and light availability significantly affect the resilience and survival of young seedlings. These variations, coupled with the erratic behavior of seedlings, amplify the effects of biotic stressors on acorn density [12,71,76]. The study ultimately concluded that acorn density, ISD, and DOY do not substantially influence seedlings over 10 cm in height (TS2), indicating the presence of other unmeasured factors. Soil moisture, light availability, and plant competition are determinants of growth and survival. Taller seedlings frequently demonstrate tolerance to micro-environmental fluctuations, whereas the minimum effect of DOY may result from yearly oscillations shaped by environmental factors. Using DOY as a variable assumes temporal stationarity in phenological responses, which may oversimplify interactions with annual climate variability. For the case studied, year effects between acorn dispersal and seedling establishment were not explicitly modeled due to their non-significance as predictors, suggesting that acorn density and DOY sufficiently integrate annual climatic influences on recruitment. However, longer-term studies may still benefit from disentangling these drivers, particularly under climate change, where extreme events could disrupt phenological cues. For example, unaccounted heatwaves or delayed rainfall may shift germination timing independently of calendar dates. Future studies should refine this approach by incorporating direct environmental metrics (e.g., growing degree days and soil moisture thresholds) to disentangle calendar-based and biologically driven phenology.
A potential limitation of this study is that it focuses on a single site, which may raise concerns about pseudoreplication; however, this was addressed by a careful study design. The sampling procedure captured spatial variability by selecting plots with different stand density indices and tree abundance, while a nested subplot approach accounted for fine-scale heterogeneity. Additionally, mixed effects models addressed spatial dependencies, further strengthening the robustness of the results. While multi-site replication would improve generalizability, this study represents a methodologically robust step towards understanding the ecological dynamics of cork oak regeneration. It also highlights the central role of sampling design and its influence on effective monitoring and modeling of regeneration processes, providing valuable guidance for future ecological research and long-term forest management planning.
5. Conclusions
This study has demonstrated the effect of both the sampling design and the availability of acorns on the assessment of seedling regeneration and its dynamics within Mediterranean cork oak ecosystems. The findings confirm that acorn density is a critical determinant of seedling abundance. There is a consistent relationship between the living seedling and acorns. Our results show significant variation attributed to the ISD, confirming that methodological choices and experimental conditions have a notable impact on the assessment of seedling distribution. This study demonstrates that the implementation of the RC design is superior, as it effectively captures a greater diversity of regeneration patterns. Additionally, while acorn production was positively associated with living seedlings, the relationships regarding dead seedlings (DS) appeared less influenced by the experimental variables, indicating a potential decoupling between acorn availability and seedling mortality.
It is essential for future forest management strategies to consider the interplay between acorn production and seedling viability, particularly within the context of Mediterranean ecosystems, where environmental variability and seasonal factors may further influence regeneration outcomes. Furthermore, the exploration of additional ecological factors affecting both acorn production and seedling growth is recommended to enhance the robustness of ecological assessments and management strategies.
Overall, this study provides valuable insights into the regeneration processes of cork oak, highlighting the importance of selecting appropriate sampling methodologies tailored to specific research objectives and ecological conditions. Such considerations are essential for effective conservation and management of Mediterranean forests to ensure the sustainability of cork oak populations in a changing climate and may also be applicable to regeneration studies of other forest species.
Author Contributions
A.F. was responsible for drafting the manuscript, statistical analysis, and preparation of tables and figures. T.F.F. conceived the field sampling design, supervised data collection and database creation, and reviewed the manuscript. All authors have read and agreed to the published version of the manuscript.
Funding
This work obtains partial funding from Agenda Transform, project No. C644865735-00000007, following the Mobilization Agendas for Business Innovation (Notice No. 02/C05-i01/2021), supported by the Recovery and Resilience Plan (PRR) and European Funds NextGeneration EU. Author AF thanks his Grant (BI/UTAD/56/2023) in the scope of the project Agenda Transform. Part of the research was partially funded by the INTERREG-SUDOE Programme through the European Regional Development Fund [project “ForManRisk-Forest Management and Natural Risks”], operation number SOE3/P4/F0898, coordinated at UTAD by TF, and supported by National Funds by FCT—Portuguese Foundation for Science and Technology, under the projects UID/04033: Centro de Investigação e de Tecnologias Agro-Ambientais e Biológicas and LA/P/0126/2020 (https://doi.org/10.54499/LA/P/0126/2020, accessed on 23 April 2025).
Data Availability Statement
The raw data utilized in this study are not publicly accessible due to their protected status. Summarized data and analysis results can be obtained upon reasonable request by contacting the corresponding author.
Acknowledgments
The authors express their gratitude to Carlos Fernandes for his significant assistance in data collecting. Gratitude is expressed to Maria Emília Silva, coordinator of Agenda Transform project at UTAD. We express our heartfelt gratitude to Martin Čerňan at CTU-FEE (Prague, Czechia) for his review of the article and for offering helpful recommendations to enhance the logical structure and clarity of the text. Moreover, the authors want to express their gratitude towards the reviewers for their precious suggestions.
Conflicts of Interest
The authors declare no conflicts of interest.
Abbreviations
The abbreviations utilized in the manuscript are presented in alphabetical order as follows:
| DOY | Day of year |
| DS | Dead seedling |
| ISD | Inventory sampling design |
| LT | Line Transept |
| RC | Radial cluster |
| TS | Total seedling (living) |
| TS1 | Total seedling with height ≤ 10 cm (living) |
| TS2 | Total seedling with height > 10 cm (living) |
Appendix A
Table A1.
Variance Inflation Factor (VIF) for the sources of variation used in mixed models.
Table A1.
Variance Inflation Factor (VIF) for the sources of variation used in mixed models.
| Source of Variation | VIF |
|---|---|
| ISD | 1.05 |
| DOY | 1.13 |
| Acorns | 1.74 |
| ISD × DOY | 1.12 |
| ISD × Acorns | 1.70 |
| DOY × Acorns | 1.67 |
| ISD × DOY × Acorns | 1.66 |
| Mean ± SD | 1.44 ± 0.32 |
Appendix B
Table A2.
Non-overlapping dataset version results, including the mean and standard deviation of response and source of variation of response and source of variation variables for the total dataset (all data combined) and by inventory sampling design (ISD). In ISD, LT refers to the line transect, and RC represents the radial cluster (both serving as categorical sources of variation in the analysis). The variables TS, DS, TS1, TS2, and Acorns are expressed in terms of counts per square meter, while DOY is expressed as day number after 1 January 2022.
| Type | Variable | Total | ISD | |
|---|---|---|---|---|
| LT | RC | |||
| Response | TS | 4.61 ± 5.20 | 3.22 ± 2.87 | 5.65 ± 6.21 |
| DS | 0.22 ± 0.99 | 0.22 ± 0.80 | 0.24 ± 1.11 | |
| TS1 | 2.63 ± 3.57 | 1.95 ± 2.30 | 3.34 ± 4.22 | |
| TS2 | 1.98 ± 2.74 | 1.27 ± 1.78 | 2.51 ± 3.18 | |
| Source | DOY | 159 ± 108 | 161 ± 107 | 157 ± 108 |
| Acorns | 5.45 ± 8.43 | 6.65 ± 10.71 | 4.55 ± 6.02 | |
Table A3.
Statistical test results related to the null hypothesis (H0). H0 states that the groups do not share the same distribution and are not correlated. The correlation coefficient (Rho) was obtained using Spearman’s rank correlation, while the matched-pairs test statistic (S) was derived from the Wilcoxon signed-rank test. p > |S| represents the two-tailed p-value, p < S is the one-tailed p-value for a left-tailed test, and p > S is the one-tailed p-value from a right-tailed test. (***) p < 0.0001.
| Statistical Test | Values | H0 | |
|---|---|---|---|
| Spearman’s Correlation | Rho | 0.95 *** | Not rejected |
| Wilcoxon Signed Rank | S | 76.5 | Not rejected |
| p > |S| | 0.63 | Not rejected | |
| p > S | 0.31 | Not rejected | |
| p < S | 0.68 | Not rejected | |
Table A4.
Summary statistics and collinearity analysis comparing the overlapping (used in main text) and non-overlapping datasets. The table presents mean differences within pairs (MWP), mean among pairs (MAP), and their percentage difference (MWP vs. MAP). Statistics include total means and standard deviations, as well as values stratified by radial cluster (RC) sampling design. Collinearity is assessed using the Variance Inflation Factor (VIF), and F-values from the mixed model are reported.
| Statistics Type | Statistics | Mean Differences Within the Pairs (MWP) | Mean Among Pair (MAP) | % Difference (MWP vs. MAP) |
|---|---|---|---|---|
| Summary | Means (Total) | 0.05 | 28.96 | 0.17% |
| Standard deviation(Total) | 0.28 | 21.25 | 1.32% | |
| Mean (RC) | −0.15 | 28.96 | −0.51% | |
| Standard deviation (RC) | 0.19 | 21.36 | 0.87% | |
| Collinearity | VIF | 0.01 | 1.44 | 0.79% |
| Mixed Model | F-values | −1.09 | 6.19 | −7.32% |
Table A5.
Statistical test results comparing overlapping (used in the main text) and non-overlapping datasets. The table presents F-values and p-values for mean differences within pairs (MWP) and mean among pairs (MAP). The null hypothesis (H0) states that the groups do not differ significantly, and it is not rejected for both comparisons.
| Test Across the Groups | MWP | MAP | H0 |
|---|---|---|---|
| F-values | 1.17 | 0.65 | Not rejected |
| p-values | 0.33 | 0.72 | Not rejected |
References
- Samartin, S.; Heiri, O.; Joos, F.; Renssen, H.; Franke, J.; Brönnimann, S.; Tinner, W. Warm Mediterranean Mid-Holocene Summers Inferred from Fossil Midge Assemblages. Nat. Geosci. 2017, 10, 207–212. [Google Scholar] [CrossRef]
- Thuiller, W.; Vayreda, J.; Pino, J.; Sabate, S.; Lavorel, S.; Gracia, C. Large-Scale Environmental Correlates of Forest Tree Distributions in Catalonia (NE Spain). Glob. Ecol. Biogeogr. 2003, 12, 313–325. [Google Scholar] [CrossRef]
- Bobiec, A.; Reif, A.; Öllerer, K. Seeing the Oakscape beyond the Forest: A Landscape Approach to the Oak Regeneration in Europe. Landsc. Ecol. 2018, 33, 513–528. [Google Scholar] [CrossRef]
- Pulido, F.J.; Díaz, M. Regeneration of a Mediterranean Oak: A Whole-Cycle Approach. Écoscience 2005, 12, 92–102. [Google Scholar] [CrossRef]
- Plieninger, T.; Rolo, V.; Moreno, G. Large-Scale Patterns of Quercus ilex, Quercus suber, and Quercus Pyrenaica Regeneration in Central-Western Spain. Ecosystems 2010, 13, 644–660. [Google Scholar] [CrossRef]
- Annighöfer, P.; Beckschäfer, P.; Vor, T.; Ammer, C. Regeneration Patterns of European Oak Species (Quercus petraea (Matt.) Liebl., Quercus robur L.) in Dependence of Environment and Neighborhood. PLoS ONE 2015, 10, e0134935. [Google Scholar] [CrossRef]
- Ritsche, J.; Katzensteiner, K.; Acácio, V. Tree Regeneration Patterns in Cork Oak Landscapes of Southern Portugal: The Importance of Land Cover Type, Stand Characteristics and Site Conditions. For. Ecol. Manag. 2021, 486, 118970. [Google Scholar] [CrossRef]
- McNabb, K. OPERATIONS|Nursery Operations. In Encyclopedia of Forest Sciences; Burley, J., Ed.; Elsevier: Oxford, UK, 2004; pp. 649–657. ISBN 978-0-12-145160-8. [Google Scholar]
- Catry, F.X.; Moreira, F.; Duarte, I.; Acácio, V. Factors Affecting Post-Fire Crown Regeneration in Cork Oak (Quercus suber L.) Trees. Eur. J. For. Res. 2009, 128, 231–240. [Google Scholar] [CrossRef]
- Canuel, C.-M.; Thiffault, É.; Thiffault, N. Post-Harvest Regeneration Is Driven by Ecological Factors Rather than Wood Procurement Intensity in Eastern Canadian Forests. For. Int. J. For. Res. 2024, 97, 663–677. [Google Scholar] [CrossRef]
- Ramos, A.M.; Usié, A.; Barbosa, P.; Barros, P.M.; Capote, T.; Chaves, I.; Simões, F.; Abreu, I.; Carrasquinho, I.; Faro, C.; et al. The Draft Genome Sequence of Cork Oak. Sci. Data 2018, 5, 180069. [Google Scholar] [CrossRef]
- Ribeiro, S.; Cerveira, A.; Soares, P.; Ribeiro, N.A.; Camilo-Alves, C.; Fonseca, T.F. Natural Regeneration of Cork Oak Forests under Climate Change: A Case Study in Portugal. Front. For. Glob. Change 2024, 7, 1332708. [Google Scholar] [CrossRef]
- ICNF. 6.° Inventário Florestal Nacional: 2015 Relatório Final; ICNF: Lisboa, Portugal, 2019. [Google Scholar]
- APCOR—Associação Portuguesa da Cortiça. APCOR Cork Yearbook 2020; APCOR—Associação Portuguesa da Cortiça: Santa Maria de Lamas, Portugal, 2020. [Google Scholar]
- Mata, F.; Dos-Santos, M. Modeling Cork Yield, Thickness, Price, and Gross Income in the Portuguese Cork Oak Montado. Forests 2024, 15, 2163. [Google Scholar] [CrossRef]
- Leite, C.; Oliveira, V.; Miranda, I.; Pereira, H. Cork Oak and Climate Change: Disentangling Drought Effects on Cork Chemical Composition. Sci. Rep. 2020, 10, 7800. [Google Scholar] [CrossRef]
- Valliere, J.M.; Nelson, K.C.; Martinez, M.C. Functional Traits and Drought Strategy Predict Leaf Thermal Tolerance. Conserv. Physiol. 2023, 11, coad085. [Google Scholar] [CrossRef] [PubMed]
- Acácio, V.; Holmgren, M. Pathways for Resilience in Mediterranean Cork Oak Land Use Systems. Ann. For. Sci. 2014, 71, 5–13. [Google Scholar] [CrossRef]
- Sørensen, I.H.; Torralba, M.; Quintas-Soriano, C.; Muñoz-Rojas, J.; Plieninger, T. Linking Cork to Cork Oak Landscapes: Mapping the Value Vhain of Vork Production in Portugal. Front. Sustain. Food Syst. 2021, 5, 787045. [Google Scholar] [CrossRef]
- Arosa, M.L.; Bastos, R.; Cabral, J.A.; Freitas, H.; Costa, S.R.; Santos, M. Long-Term Sustainability of Cork Oak Agro-Forests in the Iberian Peninsula: A Model-Based Approach Aimed at Supporting the Best Management Options for the Montado Conservation. Ecol. Model. 2017, 343, 68–79. [Google Scholar] [CrossRef]
- Mechergui, T.; Pardos, M.; Boussaidi, N.; Jacobs, D.F.; Catry, F.X. Problems and Solutions to Cork Oak (Quercus suber L.) Regeneration: A Review. iForest 2023, 16, 10–22. [Google Scholar] [CrossRef]
- Pérez-Ramos, I.M.; Padilla-Díaz, C.M.; Koenig, W.D.; Marañón, T. Environmental Drivers of Mast-Seeding in Mediterranean Oak Species: Does Leaf Habit Matter? J. Ecol. 2015, 103, 691–700. [Google Scholar] [CrossRef]
- Matías, L.; Abdelaziz, M.; Godoy, O.; Gómez-Aparicio, L. Disentangling the Climatic and Biotic Factors Driving Changes in the Dynamics of Quercus suber Populations across the Species‘ Latitudinal Range. Divers. Distrib. 2019, 25, 524–535. [Google Scholar] [CrossRef]
- Sobral, R.; Costa, M.M.R. Role of Floral Organ Identity Genes in the Development of Unisexual Flowers of Quercus suber L. Sci. Rep. 2017, 7, 10368. [Google Scholar] [CrossRef]
- Sobral, R.; Silva, H.G.; Laranjeira, S.; Magalhães, J.; Andrade, L.; Alhinho, A.T.; Costa, M.M.R. Unisexual Flower Initiation in the Monoecious Quercus suber L.: A Molecular Approach. Tree Physiol. 2020, 40, 1260–1276. [Google Scholar] [CrossRef] [PubMed]
- Cecich, R.A.; Sullivan, N.H. Influence of Weather at Time of Pollination on Acorn Production of Quercus alba and Quercus velutina. Can. J. For. Res. 1999, 29, 1817–1823. [Google Scholar] [CrossRef]
- Abrahamson, W.G.; Layne, J.N. Long-Term Patterns of Acorn Production for Five Oak Species in Xeric Florida Uplands. Ecology 2003, 84, 2476–2492. [Google Scholar] [CrossRef]
- Pons, J.; Pausas, J.G. The Coexistence of Acorns with Different Maturation Patterns Explains Acorn Production Variability in Cork Oak. Oecologia 2012, 169, 723–731. [Google Scholar] [CrossRef] [PubMed]
- Arosa, M.L.; Ceia, R.S.; Costa, S.R.; Freitas, H. Factors Affecting Cork Oak (Quercus suber) Regeneration: Acorn Sowing Success and Seedling Survival under Field Conditions. Plant Ecol. Divers. 2015, 8, 519–528. [Google Scholar] [CrossRef]
- Benamirouche, S.; Chouial, M.; Messaoudene, M. Storage of Cork Oak (Quercus suber L., 1753) Acorns and Effect of Storage Duration on Seedlings Vigour: Artificial Regeneration Implications. Rev. Ecol. 2018, 73, 80–95. [Google Scholar] [CrossRef]
- Matías, L.; Jump, A.S. Asymmetric Changes of Growth and Reproductive Investment Herald Altitudinal and Latitudinal Range Shifts of Two Woody Species. Glob. Change Biol. 2015, 21, 882–896. [Google Scholar] [CrossRef]
- Lopes, A.L.; Costa, M.L.; Sobral, R.; Costa, M.M.; Amorim, M.I.; Coimbra, S. Arabinogalactan Proteins and Pectin Distribution during Female Gametogenesis in Quercus suber L. Ann. Bot. 2016, 117, 949–961. [Google Scholar] [CrossRef]
- McDowell, N.G.; Beerling, D.J.; Breshears, D.D.; Fisher, R.A.; Raffa, K.F.; Stitt, M. The Interdependence of Mechanisms Underlying Climate-Driven Vegetation Mortality. Trends Ecol. Evol. 2011, 26, 523–532. [Google Scholar] [CrossRef]
- Trugman, A.T.; Anderegg, L.D.L.; Anderegg, W.R.L.; Das, A.J.; Stephenson, N.L. Why Is Tree Drought Mortality so Hard to Predict? Trends Ecol. Evol. 2021, 36, 520–532. [Google Scholar] [CrossRef]
- Ramírez-Valiente, J.A.; Valladares, F.; Gil, L.; Aranda, I. Population Differences in Juvenile Survival under Increasing Drought Are Mediated by Seed Size in Cork Oak (Quercus suber L.). For. Ecol. Manag. 2009, 257, 1676–1683. [Google Scholar] [CrossRef]
- Cramer, W.; Guiot, J.; Fader, M.; Garrabou, J.; Gattuso, J.-P.; Iglesias, A.; Lange, M.A.; Lionello, P.; Llasat, M.C.; Paz, S.; et al. Climate Change and Interconnected Risks to Sustainable Development in the Mediterranean. Nat. Clim. Change 2018, 8, 972–980. [Google Scholar] [CrossRef]
- Bonanno, G.; Veneziano, V. Seed Dormancy, Climate Changes, Desertification and Soil Use Transformation Threaten the Mediterranean Endemic Monospecific Plant Petagnaea gussonei. Sci. Rep. 2024, 14, 8235. [Google Scholar] [CrossRef]
- Seidl, R.; Thom, D.; Kautz, M.; Martin-Benito, D.; Peltoniemi, M.; Vacchiano, G.; Wild, J.; Ascoli, D.; Petr, M.; Honkaniemi, J.; et al. Forest Disturbances under Climate Change. Nat. Clim. Change 2017, 7, 395–402. [Google Scholar] [CrossRef] [PubMed]
- Siscart, D.; Diego, V.; Lloret, F. Acorn Ecology. In Ecology of Mediterranean Evergreen Oak Forests; Rodà, F., Retana, J., Gracia, C.A., Bellot, J., Eds.; Springer: Berlin/Heidelberg, Germany, 1999; pp. 75–87. ISBN 978-3-642-58618-7. [Google Scholar]
- Costa, A.; Pereira, H.; Oliveira, A. The Effect of Cork-Stripping Damage on Diameter Growth of Quercus suber L. Forestry 2004, 77, 1–8. [Google Scholar] [CrossRef]
- Costa-e-Silva, F.; Correia, A.C.; Pinto, C.A.; David, J.S.; Hernandez-Santana, V.; David, T.S. Effects of Cork Oak Stripping on Tree Carbon and Water Fluxes. For. Ecol. Manag. 2021, 486, 118966. [Google Scholar] [CrossRef]
- Morris, C.E.; Bardin, M.; Berge, O.; Frey-Klett, P.; Fromin, N.; Girardin, H.; Guinebretière, M.-H.; Lebaron, P.; Thiéry, J.M.; Troussellier, M. Microbial Biodiversity: Approaches to Experimental Design and Hypothesis Testing in Primary Scientific Literature from 1975 to 1999. Microbiol. Mol. Biol. Rev. 2002, 66, 592. [Google Scholar] [CrossRef] [PubMed]
- Ehrenfeld, J.G. Understory Response to Canopy Gaps of Varying Size in a Mature Oak Forest. Bull. Torrey Bot. Club 1980, 107, 29–41. [Google Scholar] [CrossRef]
- Schöb, C.; Armas, C.; Guler, M.; Prieto, I.; Pugnaire, F.I. Variability in Functional Traits Mediates Plant Interactions along Stress Gradients. J. Ecol. 2013, 101, 753–762. [Google Scholar] [CrossRef]
- Crum, N.J.; Neyman, L.C.; Gowan, T.A. Abundance Estimation for Line Transect Sampling: A Comparison of Distance Sampling and Spatial Capture-Recapture Models. PLoS ONE 2021, 16, e0252231. [Google Scholar] [CrossRef] [PubMed]
- Dias, F.S.; Miller, D.L.; Marques, T.A.; Marcelino, J.; Caldeira, M.C.; Orestes Cerdeira, J.; Bugalho, M.N. Conservation Zones Promote Oak Regeneration and Shrub Diversity in Certified Mediterranean Oak Woodlands. Biol. Conserv. 2016, 195, 226–234. [Google Scholar] [CrossRef]
- Navarro, J.; Díaz-Gamboa, R. Line Transect Sampling. In Introduction to Ecological Sampling; Chapman and Hall/CRC: New York, NY, USA, 2014; ISBN 978-0-429-09901-4. [Google Scholar]
- Köhl, M.; Magnussen, S.; Marchetti, M. Sampling in Forest Surveys. In Sampling Methods, Remote Sensing and GIS Multiresource Forest Inventory; Springer: Berlin/Heidelberg, Germany, 2006; pp. 71–196. [Google Scholar]
- Weather Spark. Climate and Average Weather Year Round in Mogadouro, Portugal. Available online: https://weatherspark.com/y/33558/Average-Weather-in-Mogadouro-Portugal-Year-Round#Figures-Rainfall (accessed on 25 January 2025).
- Global Modeling and Assimilation Office. Modern-Era Retrospective Analysis for Research and Applications, Version 2. Available online: https://gmao.gsfc.nasa.gov/reanalysis/MERRA-2/ (accessed on 25 January 2025).
- Agroconsultores e Coba. Carta dos Solos, Carta do Uso Actual da Terra e Carta Aptidão da Terra do Nordeste de Portugal; Memórias; Universidade de Trás-os-Montes e Alto Douro: Vila Real, Portugal, 1991. [Google Scholar]
- Ribeiro, S.; Fonseca, T. Bonnes Pratiques Pour Favoriser La Régénération Du Chêne-Liège (Quercus suber L.) Dans Le Nord-Est de Trás-Os-Montes (Portugal)—Fiche 4. In Garantir a Regeneração e Reduzir o Risco de Incêndio: Um Desafio Para o Futuro das Florestas no Sudoeste da Europa. Interreg Sudoe; Lehoucq, A., Araújom, D., Beltrán, M., Dalgé, B., Destribat, B., Ferreira, P., Fonseca, T.F., A López, A., Magalhães, M., Maugard, F., et al., Eds.; ForManRisk, UTAD: Vila Real, Portugal, 2023; p. 136. ISBN 978-989-704-538-7. [Google Scholar]
- Krebs, C.J. Ecological Methodology, 2nd ed.; The Benjamin/Cummings Series in the Life Sciences; Benjamin/Cummings: Menlo Park, CA, USA, 1999; ISBN 0-321-02173-8. [Google Scholar]
- Marques, C.; Fonseca, T.; Duarte, J. Guia Prático de Avaliações Florestais: Inventário Florestal e Modelação Estatística; Sílabas & Desafios: Faro, Portugal, 2018. [Google Scholar]
- Cabral, M.; Fonseca, T.F.; Cerveira, A. Optimization of Forest Management in Large Areas Arising from Grouping of Several Management Bodies: An Application in Northern Portugal. Forests 2022, 13, 471. [Google Scholar] [CrossRef]
- Scott, C.T. Optimal Design of a Plot Cluster for Monitoring. In The Optimal Design of Forest Experiments and Forest Surveys, Proceedings of the IUFRO S.4.11 Conference, London, UK, 10–14 September 1991; Rennolls, K., Gertner, G., Eds.; University of Greenwich, London: London, UK, 1993; pp. 233–242. [Google Scholar]
- Pons, J.; Pausas, J.G. Oak Regeneration in Heterogeneous Landscapes: The Case of Fragmented Quercus suber forests in the Eastern Iberian Peninsula. For. Ecol. Manag. 2006, 231, 196–204. [Google Scholar] [CrossRef]
- Acácio, V.; Holmgren, M.; Jansen, P.A.; Schrotter, O. Multiple Recruitment Limitation Causes Arrested Succession in Mediterranean Cork Oak Systems. Ecosystems 2007, 10, 1220–1230. [Google Scholar] [CrossRef]
- Köhl, M. National Inventories and Inventories of Endangered Forests in Europe; USDA Forest Service General Technical Report PNW-GTR-Pacific Northwest Research Station (USA); U.S. Department of Agriculture Forest Service: Portland, OR, USA, 1990.
- Loetsch, F. A Forest Inventory in Thailand; FAO: Rome, Italy, 1957. [Google Scholar]
- FAO. World Programme for the Census of Agriculture 2020; FAO: Rome, Italy, 2020. [Google Scholar]
- Lynch, T.B. Horizontal Line Sampling for Riparian Forests without Land Area Estimation. For. Sci. 2006, 52, 119–129. [Google Scholar] [CrossRef]
- Rubinstein, R.Y.; Kroese, D.P. Simulation and the Monte Carlo Method; John Wiley & Sons: Hoboken, NJ, USA, 2016; ISBN 1-118-63220-6. [Google Scholar]
- Constança, C.-A.; José Antonio, N.; Ana Patricia, P.; João, R.; Dinis, C.; Barroso, J.M.; Vaz, M.; Almeida-Ribeiro, N. Influence of Water and Nutrients on Cork Oak Radial Growth–Looking for an Efficient Fertirrigation Regime. Silva Fenn. 2022, 56, 10698. [Google Scholar]
- Pérez-Ramos, I.M.; Rodríguez-Calcerrada, J.; Ourcival, J.M.; Rambal, S. Quercus ilex Recruitment in a Drier World: A Multi-Stage Demographic Approach. Perspect. Plant Ecol. Evol. Syst. 2013, 15, 106–117. [Google Scholar] [CrossRef]
- Príncipe, A.; Matos, P.; Sarris, D.; Gaiola, G.; do Rosário, L.; Correia, O.; Branquinho, C. In Mediterranean Drylands Microclimate Affects More Tree Seedlings than Adult Trees. Ecol. Indic. 2019, 106, 105476. [Google Scholar] [CrossRef]
- Vaz, P.G.; Bugalho, M.N.; Fedriani, J.M. Grazing Hinders Seed Dispersal during Crop Failure in a Declining Oak Woodland. Sci. Total Environ. 2024, 907, 167835. [Google Scholar] [CrossRef]
- Marañón, T.; Zamora Rodríguez, R.; Villar Montero, R.; Zavala, M.A.; Quero Pérez, J.L.; Pérez-Ramos, I.M.; Mendoza Sagrera, I.; Castro Gutiérrez, J. Regeneration of Tree Species and Restoration under Contrasted Mediterranean Habitats: Field and Glasshouse Experiments. Int. J. Ecol. Environ. Sci. 2004, 30, 187–196. [Google Scholar]
- Montero-Muñoz, J.L.; Ureña, C.; Navarro, D.; Herrera, V.; Alonso-Rojo, P.; Hernández-Alonso, H.; Cepeda-González, M.F.; Jovellar, L.C.; Fernández-Santos, B.; Silla, F. Regeneration Dynamics in Fragmented Landscapes at the Leading Edge of Distribution: Quercus suber Woodlands as a Study Case. Plant Soil 2021, 467, 311–327. [Google Scholar] [CrossRef]
- De Sousa, E.M.R.; Santos, M.N.S.; Varela, M.C.; Henriques, J. Perda de Vigor Dos Montados de Sobro e Azinho: Análise Da Situação e Perspectivas. 2007. Available online: https://www.iniav.pt/images/publicacoes/livros-manuais/montados_sobro_azinho_analise.pdf (accessed on 23 April 2025).
- Camilo-Alves, C.S.P.; Vaz, M.; Da Clara, M.I.E.; Ribeiro, N.M.D.A. Chronic Cork Oak Decline and Water Status: New Insights. New For. 2017, 48, 753–772. [Google Scholar] [CrossRef]
- Herrera, J. Acorn Predation and Seedling Production in a Low-Density Population of Cork Oak (Quercus suber L.). For. Ecol. Manag. 1995, 76, 197–201. [Google Scholar] [CrossRef]
- Pérez-Ramos, I.M.; Marañón, T.; Lobo, J.M.; Verdú, J.R. Acorn Removal and Dispersal by the Dung Beetle Thorectes Lusitanicus: Ecological Implications. Ecol. Entomol. 2007, 32, 349–356. [Google Scholar] [CrossRef]
- Balducci, L.; Fierravanti, A.; Rossi, S.; Delzon, S.; De Grandpré, L.; Kneeshaw, D.D.; Deslauriers, A. The Paradox of Defoliation: Declining Tree Water Status with Increasing Soil Water Content. Agric. For. Meteorol. 2020, 290, 108025. [Google Scholar] [CrossRef]
- Wu, J.; Wang, J.; Hui, W.; Zhao, F.; Wang, P.; Su, C.; Gong, W. Physiology of Plant Responses to Water Stress and Related Genes: A Review. Forests 2022, 13, 324. [Google Scholar] [CrossRef]
- Pardos, M.; Jiménez, M.D.; Aranda, I.; Puértolas, J.; Pardos, J.A. Water Relations of Cork Oak (Quercus suber L.) Seedlings in Response to Shading and Moderate Drought. Ann. For. Sci. 2005, 62, 377–384. [Google Scholar] [CrossRef]

Disclaimer/Publisher’s Note: The statements, opinions and data contained in all publications are solely those of the individual author(s) and contributor(s) and not of MDPI and/or the editor(s). MDPI and/or the editor(s) disclaim responsibility for any injury to people or property resulting from any ideas, methods, instructions or products referred to in the content. |
© 2025 by the authors. Licensee MDPI, Basel, Switzerland. This article is an open access article distributed under the terms and conditions of the Creative Commons Attribution (CC BY) license (https://creativecommons.org/licenses/by/4.0/).