Article

Genome-Wide Identification, Evolution and Expression Analysis of the U-Box E3 Ubiquitin Ligases Gene Family in Poplar (Populus alba × P. tremula var. glandulosa)

1
State Key Laboratory of Tree Genetics and Breeding, Co-Innovation Center for Sustainable Forestry in Southern China, Nanjing Forestry University, Nanjing 210037, China
2
College of Horticulture, Nanjing Agricultural University, Nanjing 210095, China
*
Author to whom correspondence should be addressed.
Forests 2025, 16(5), 749; https://doi.org/10.3390/f16050749 (registering DOI)
Submission received: 31 March 2025 / Revised: 22 April 2025 / Accepted: 23 April 2025 / Published: 27 April 2025
(This article belongs to the Section Genetics and Molecular Biology)

Abstract

:
Plant U-box E3 ubiquitin ligases (PUBs) serve as crucial regulators of protein degradation and are fundamentally involved in plant developmental processes and stress response mechanisms. Despite their well-characterized roles in model plant species, the PUB gene family in the hybrid poplar (Populus alba × P. tremula var. glandulosa) remains poorly understood. By conducting a comprehensive genome-wide analysis, we identified 152 PUB genes in poplar and phylogenetically classified them into five distinct clades based on a comparative analysis with Arabidopsis thaliana and tomato PUB homologs. The structural characterization revealed that numerous PagPUB proteins possess additional functional domains, including ARM and WD40 repeats, which are indicative of potential functional diversification. Genomic distribution and synteny analyses demonstrated that the expansion of the PUB gene family predominantly resulted from whole-genome duplication (WGD) events, with evolutionary constraint analyses (Ka/Ks ratios < 1) suggesting strong purifying selection. An examination of the promoter region uncovered an abundance of stress-responsive cis-elements, particularly ABRE and MYB binding sites associated with abiotic stress and hormonal regulation. Transcriptome profiling demonstrated both tissue-specific expression patterns and dynamic regulation under diverse stress conditions, including drought, salinity, temperature extremes, and pathogen infection. Our findings provide the first systematic characterization of the PUB gene family in poplar and establish a valuable framework for elucidating their evolutionary history and functional significance in environmental stress adaptation.

1. Introduction

Plants are constantly exposed to various abiotic and biotic stresses during their growth and development; these stresses include drought, high temperature, low temperature, and pathogen infections [1]. These environmental challenges often disrupt cellular homeostasis, inhibit photosynthesis, and induce oxidative stress, ultimately affecting plant survival and productivity [2]. To cope with these stresses, plants have evolved complex signaling networks and regulatory mechanisms at the transcriptional, post-transcriptional, translational, and post-translational levels [3,4]. Among these, post-translational modification (PTM) is a rapid mechanism that allows for the precise regulation of protein activity, stability, and subcellular localization. Ubiquitination, a major PTM process, plays a pivotal role in protein degradation and signaling regulation through the ubiquitin/26S proteasome system (UPS) [5,6].
The UPS consists of three main enzymes: ubiquitin-activating enzyme (E1), ubiquitin-conjugating enzyme (E2), and ubiquitin ligase (E3). Among them, E3 ligases determine substrate specificity and are classified into four main types: HECT, RING, Cullin-RING ligases (CRLs), and U-box proteins [7]. U-box E3 ubiquitin ligases are characterized by a conserved U-box domain of approximately 70 amino acids and are functionally similar to RING-type ligases. U-box proteins have been shown to mediate diverse biological processes by targeting specific proteins for ubiquitination and subsequent degradation via the 26S proteasome [8,9]. In plants, U-box genes—also referred to as Plant U-box (PUB) genes—are significantly expanded compared to animals and yeast, indicating their specialized roles in plant-specific physiological and developmental pathways [10].
Previously, genome-wide studies have identified 61 PUB genes in Arabidopsis [11,12], 77 in rice [13], 62 in tomato [14], 93 in cotton [15], 91 in banana [16]. These genes have been functionally associated with a broad range of processes including hormone signaling [9], immune responses, and environmental stress adaptation [17]. For instance, AtPUB22 and AtPUB23 are negative regulators of drought stress responses [18], while AtPUB25 and AtPUB26 regulate freezing tolerance by targeting the negative regulator MYB15 for degradation [18]. In rice, OsPUB15 and OsPUB63 have been implicated in enhancing tolerance to salt and heat stress, respectively [19,20]. Despite extensive studies in herbaceous and model plant species, our understanding of PUB gene functions in perennial woody species, such as poplar, remains limited.
Populus species, particularly the fast-growing hybrid poplar (P. alba × P. tremula var. glandulosa), serve as important model systems for forest biology due to their compact genomes and well-developed genomic resources. As economically important perennials, poplars routinely encounter abiotic stresses including drought, heat, and salinity in both natural and cultivated environments. These stressors often lead to significant growth reduction and productivity losses, especially under current climate change scenarios. Understanding the molecular mechanisms underlying stress responses in poplar therefore holds both fundamental biological significance and practical economic value. In this study, we present the first comprehensive genome-wide characterization of the PUB gene family in hybrid poplar, identifying 152 members. Through integrated phylogenetic, structural, and evolutionary analyses, we: (1) classify PUB genes into five distinct clades, (2) elucidate their expansion history via duplication events, (3) identify stress-responsive cis-elements in promoter regions, and (4) analyze their expression patterns across tissues and under various stress conditions. Our findings provide a valuable foundation for future functional studies of PUB genes in woody plants and their potential application in developing stress-resilient tree varieties.

2. Materials and Methods

2.1. Genome-Wide Identification of PUB Gene Family in Poplar

The genome sequence of poplar (P. alba x P. tremula var. glandulosa clone 84K) was downloaded from the NCBI website (https://www.ncbi.nlm.nih.gov/, accessed on 1 March 2025). The Hidden Markov Model (HMM) of the U-box domain (PF04564) was downloaded from the Pfam database (https://pfam.xfam.org/, accessed on 1 March 2025). Then, we scanned the whole-genome protein sequences using the HMMsearch (v3.4) software (E-value < 1 × 10⁻⁵), and obtained PUB gene candidates [21]. In parallel, we constructed a local protein database using makeblastdb software (v2.13.0). Using the PUB protein sequences in Arabidopsis and tomato as queries, we scanned the poplar protein database using BLASTP (v2.13.0+) software (E-value < 1 × 10⁻⁵, identify > 30%) [22]. We removed the redundant hits between the BLAST and HMMsearch analysis (Figure S1).
To further determine the presence and completeness of U-box domain, all candidate PUB genes were submitted to the SMART website (http://smart.embl-heidelberg.de/, accessed on 1 March 2025) and CDD website (https://www.ncbi.nlm.nih.gov/Structure/cdd/wrpsb.cgi, accessed on 1 March 2025). Ultimately, a total of 152 PUB genes were identified in the poplar genome. In addition, the physicochemical properties of PUB proteins were evaluated using the ExPASy ProtParam website (https://web.expasy.org/protparam/, accessed on 1 March 2025), including the amino acid number, molecular weight, theoretical isoelectric point (pI), instability index, aliphatic index, and grand average of hydropathicity. We also predicted the subcellular localization of the poplar PUB genes using the online tool WoLF PSORT (https://wolfpsort.hgc.jp/, accessed on 1 March 2025). The chromosome distribution of PUB genes in poplar was visualized using TBtools software (v2.210) [23].

2.2. Multiple Sequence Alignment and Phylogenetic Analysis

The phylogenetic analysis was conducted in two main steps. Initially, the full-length PUB protein sequences from poplar, Arabidopsis, and tomato were aligned using ClustalW (v2.1) with default parameters. Subsequently, a Neighbor-Joining (NJ) phylogenetic tree was generated in MEGA-X software (v10.2.2) with 1000 bootstrap replications [22], based on the multiple sequence alignment results. The phylogenetic tree was visualized using Evolview (https://www.evolgenius.info/evolview/, accessed on 1 March 2025), an online tool for phylogenetic tree visualization.

2.3. Gene Structure, Conserved Domain, and Motif Analysis

The exon–intron structures of 152 PUB genes in poplar were extracted from the genome annotation file (GFF file) using an in-house Python (v 3.9.13) script. The CDD website (https://www.ncbi.nlm.nih.gov/Structure/cdd/wrpsb.cgi, accessed on 1 March 2025) was used to predict the conserved domain of poplar PUB genes. We used MEME suit (https://meme-suite.org/meme/, accessed on 1 March 2025) to identify the conserved motifs of poplar PUB genes.

2.4. Cis-Acting Element Analysis of PUB Gene Promoters

In this study, the 2000 bp upstream sequences from the transcription start site (TSS) of each PUB gene were considered as putative promoter regions. These promoter sequences were extracted from the genome using TBtools software [23]. Subsequently, the sequences were submitted to the PlantCARE database (http://bioinformatics.psb.ugent.be/webtools/plantcare/html/, accessed on 1 March 2025) for the prediction of cis-acting regulatory elements. The conserved motifs, gene structures, and cis-acting elements of PUB genes in poplar were visualized using TBtools.

2.5. Collinearity Analysis of PUB Genes

The collinearity analysis was performed following the guidelines provided by DupGen_finder (https://github.com/qiao-xin/DupGen_finder, accessed on 1 March 2025). In this study, the collinearity analysis was independently conducted for subgenomes A and G. First, a local BLAST database was constructed from the complete protein sequences of the poplar genome using the makeblastdb tool. Then, BLASTP searches were performed with all protein sequences as queries (E-value < 1 × 10⁻¹⁰; max_target_seqs = 5) to identify putative homologous gene pairs.
To classify gene duplication types, the duplicate_gene_classifier program was used to categorize PUB genes into five types: whole-genome duplication (WGD)/segmental duplication, tandem duplication (TD), proximal duplication (PD), dispersed duplication (DD), and singleton duplication (SD). MCScanX software (v1.0.0) was employed with default parameters to detect collinear gene blocks. Finally, the collinearity relationships of the PUB genes were visualized using Circos software (version 0.69.2) [24].

2.6. Ka and Ks Analysis

To estimate the non-synonymous (Ka) and synonymous (Ks) substitution rates of PUB paralogous gene pairs located within syntenic blocks, we used ParaAT software (v2.0) in combination with KaKs_Calculator 2.0 [25,26]. The calculations were conducted using the Yang–Nielsen (YN) model (parameter: -m YN) and the standard genetic code table (parameter: -c) in KaKs_Calculator 2.0.

2.7. Expression Pattern Analysis of PUB Gene Family

The transcriptome datasets used in this study were retrieved from the National Center for Biotechnology Information (NCBI) database (https://www.ncbi.nlm.nih.gov/, accessed on 1 March 2025). Based on prior research, RNA-seq data were collected from four tissues (root, leaf, bark, and xylem) of P. tremula × P. alba, and from four tissues (shoot, root, leaf, and callus) of P. alba × P. tremula var. glandulosa [27,28,29,30]. Additionally, transcriptomic data under abiotic stress conditions (including salt, drought, high and low temperature treatments) and biotic stress (infection by Alternaria alternata) were obtained from earlier studies (accession numbers: ERR1864411–ERR1864437 and SRR12371687–SRR12371698) [31].
Quality assessments of the raw data were performed using FastQC (https://www.bioinformatics.babraham.ac.uk/projects/fastqc/, accessed on 1 March 2025). Adapter trimming and the removal of low-quality reads were carried out using Trimmomatic (v0.39) with the following parameters: LEADING:30 HEADCROP:10 TRAILING:20 SLIDINGWINDOW:3:20 MINLEN:20 [32]. High-quality clean reads were aligned to the reference genome of P. alba × P. tremula var. glandulosa using HISAT2 (v2.2.1) [33]. Subsequently, alignment files were converted from SAM to BAM formats and sorted using SAMtools (v1.14) [34]. Gene-level quantification was achieved using featureCounts (v2.0.6), and gene expression levels were calculated as fragments per kilobase of transcript per million mapped reads (FPKM). Finally, expression heatmaps were visualized using the R (v4.0.2) package pheatmap [35].

3. Results

3.1. Whole-Genome Identification of PUB Genes in Poplar

In this study, we identified PUB gene family members in poplar using both BLASTP- and HMMER-based searches. As a result, a total of 152 PUB genes were identified in the P. alba × P. tremula var. glandulosa genome. Based on their chromosomal positions, these genes were named PagPUB1 to PagPUB152 (Table 1). As shown in Table 1, the physicochemical property analysis revealed that the length of the encoded PUB proteins ranged from 287 amino acids (PagPUB6 and PagPUB84) to 1506 amino acids (PagPUB25), with an average of 645 amino acids. The corresponding molecular weights ranged from 32.73 kDa (PagPUB84) to 167.96 kDa (PagPUB25), with an average of 71.51 kDa. The predicted isoelectric points (pI) of these proteins ranged from 4.88 to 9.12. The instability index indicated that 22 PUB proteins had values less than 40, suggesting they are stable, while the remaining 130 were predicted to be unstable (instability index > 40). The aliphatic index varied from 68.29 (PagPUB5) to 118.84 (PagPUB12), reflecting differences in thermostability among members. Subcellular localization predictions showed that 47 PUB proteins (31%) are likely localized in the nucleus, 37 (24%) in the cytoplasm, and 30 (20%) in the chloroplast. These results suggest that PUB proteins may function in multiple subcellular compartments, potentially participating in diverse regulatory processes.

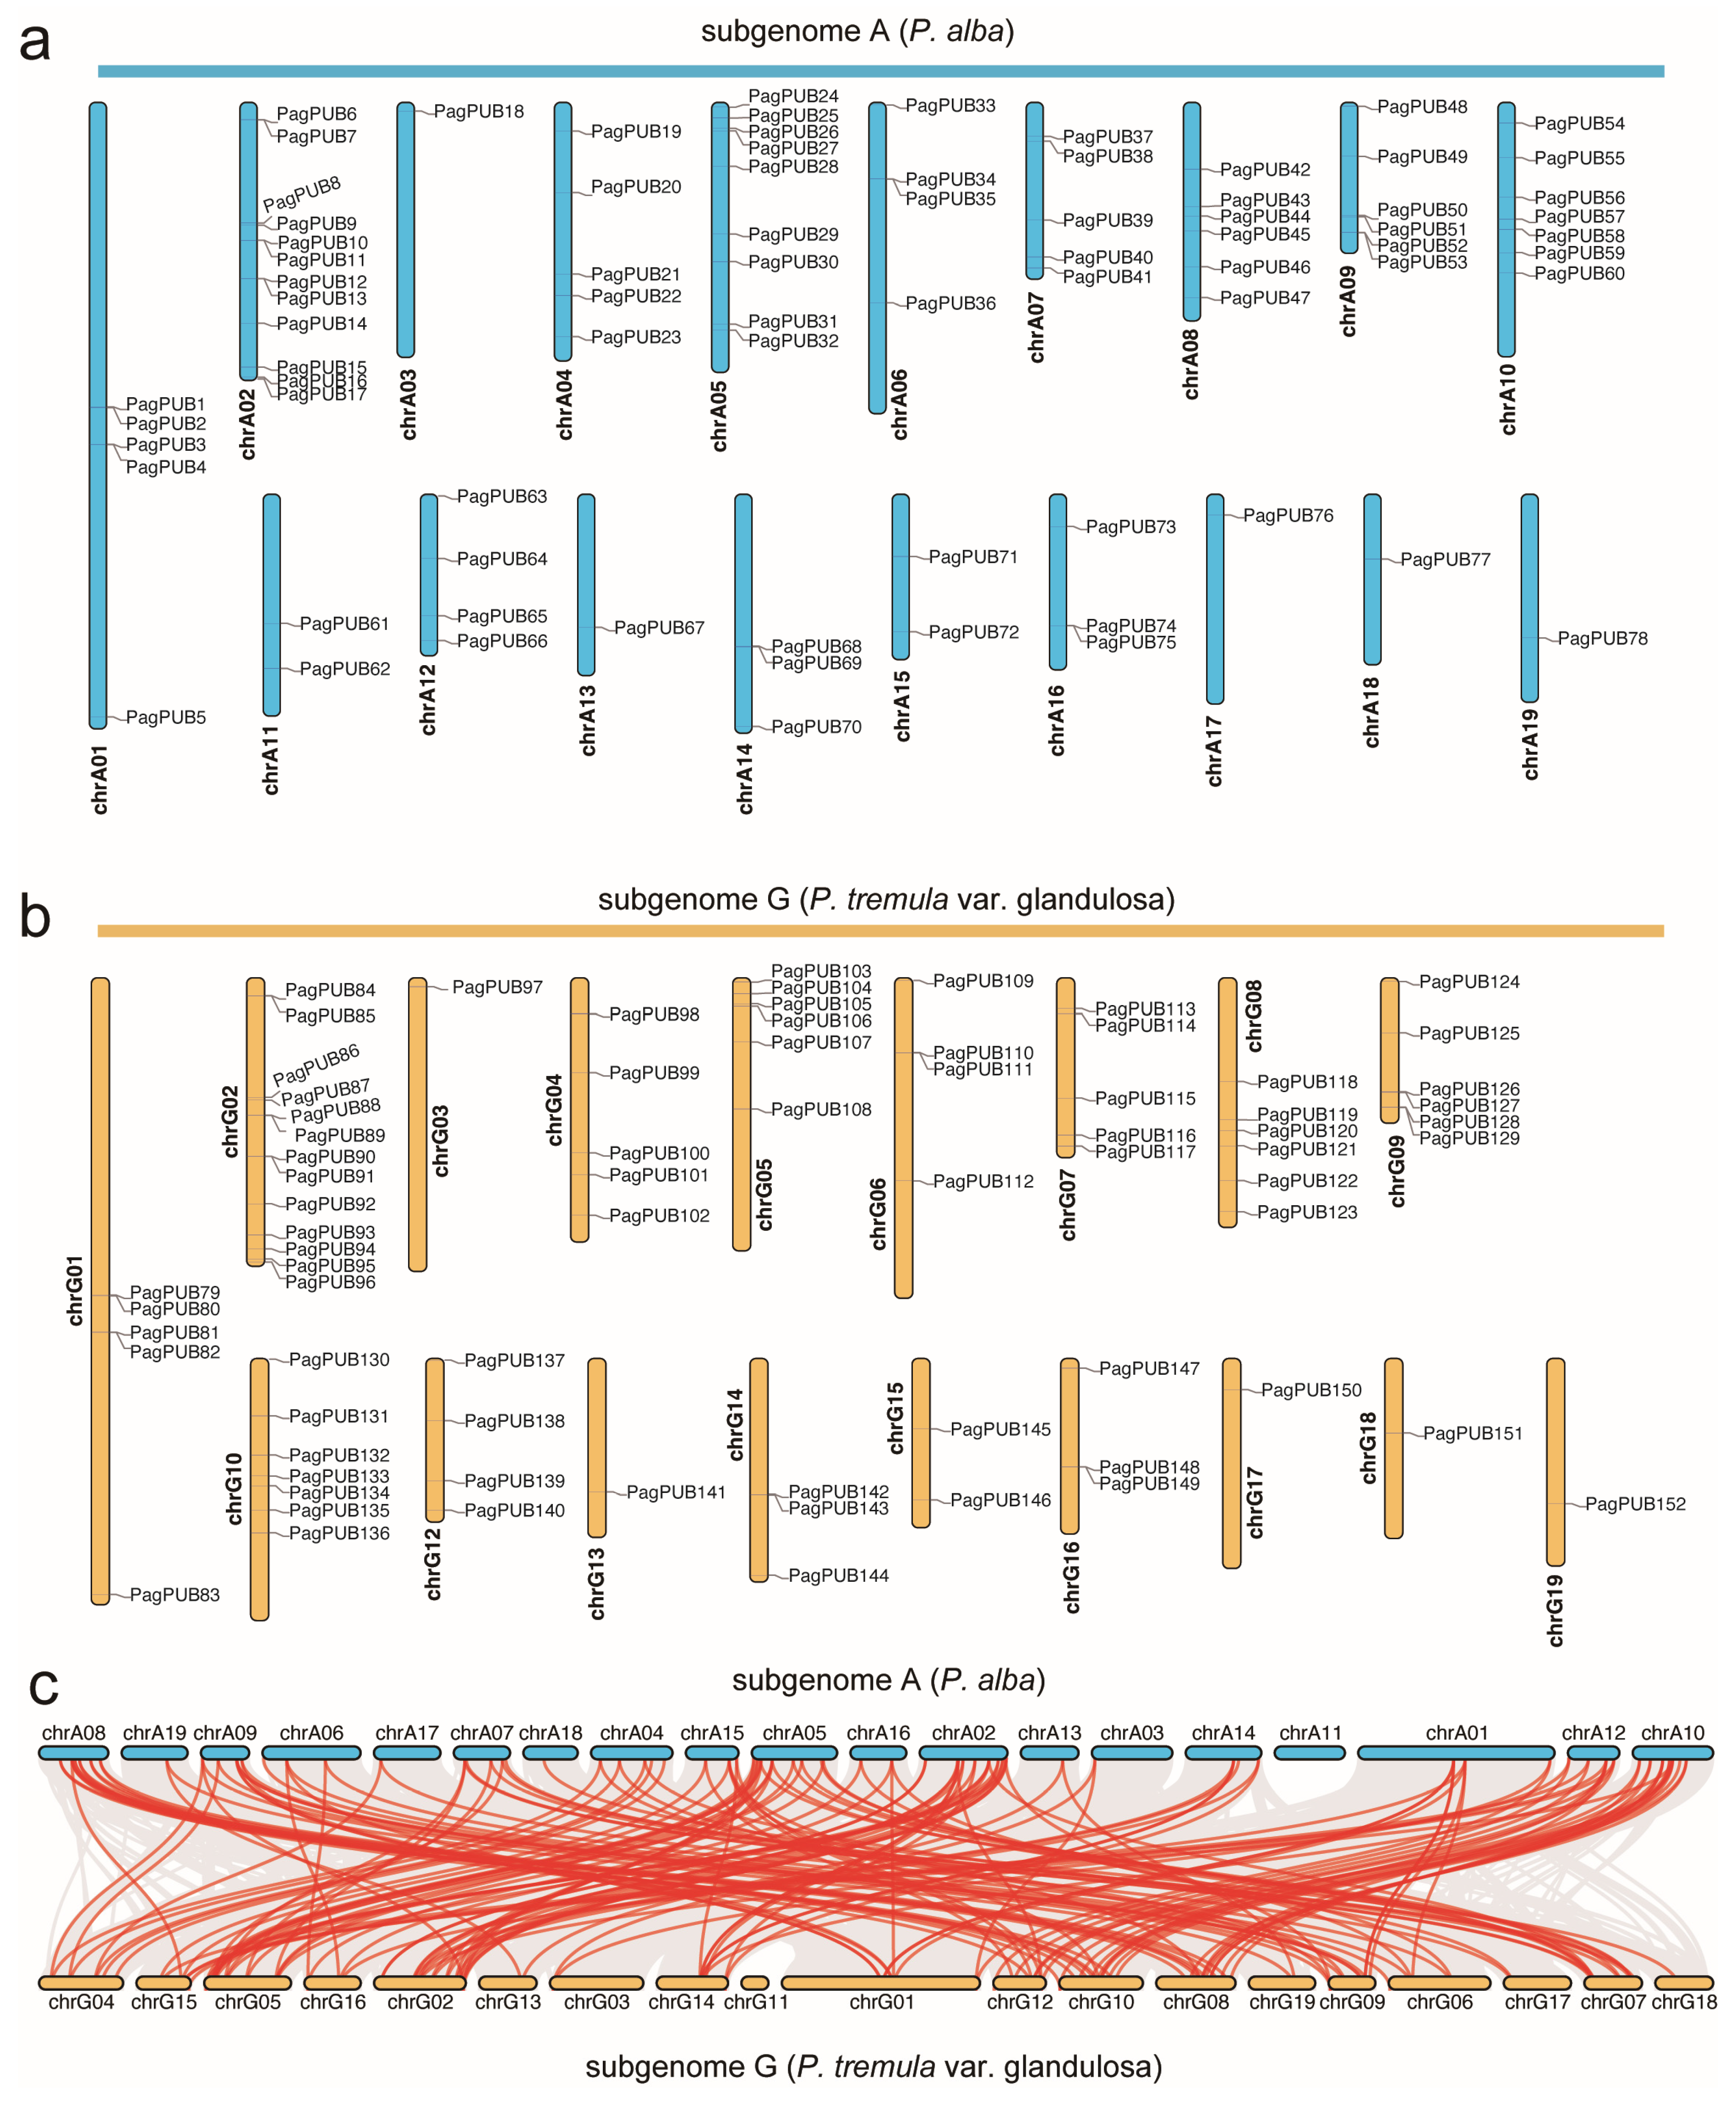
3.2. The Chromosomal Distribution Pattern of PUB Genes in the Poplar Genome

Based on the genome annotation file, we retrieved the chromosomal location information of PUB genes in poplar. A total of 78 PUB genes were mapped to subgenome A and 74 to subgenome G (Figure 1a,b). Our chromosomal localization analysis revealed that PUB genes were unevenly distributed across the chromosomes. In subgenome A, chromosome A02 (chrA02) contained the highest number of PUB genes (12), whereas chromosomes chrA03, chrA13, chrA17, chrA18, and chrA19 each harbored only one PUB gene. Similarly, in subgenome G, chrG02 had the most PUB genes (13), while chrG03, chrG13, chrG17, chrG18, and chrG19 each contained only one PUB gene.
The collinearity analysis identified numerous syntenic gene pairs between subgenomes A and G. In total, 155 PUB collinear gene pairs were detected (e.g., PagPUB42PagPUB118, PagPUB78PagPUB152), indicating that segmental duplication events have played a significant role in the expansion of the PUB gene family in poplar (Figure 1c). These results provide valuable insights into the evolutionary conservation and divergence of PUB genes between the two subgenomes.

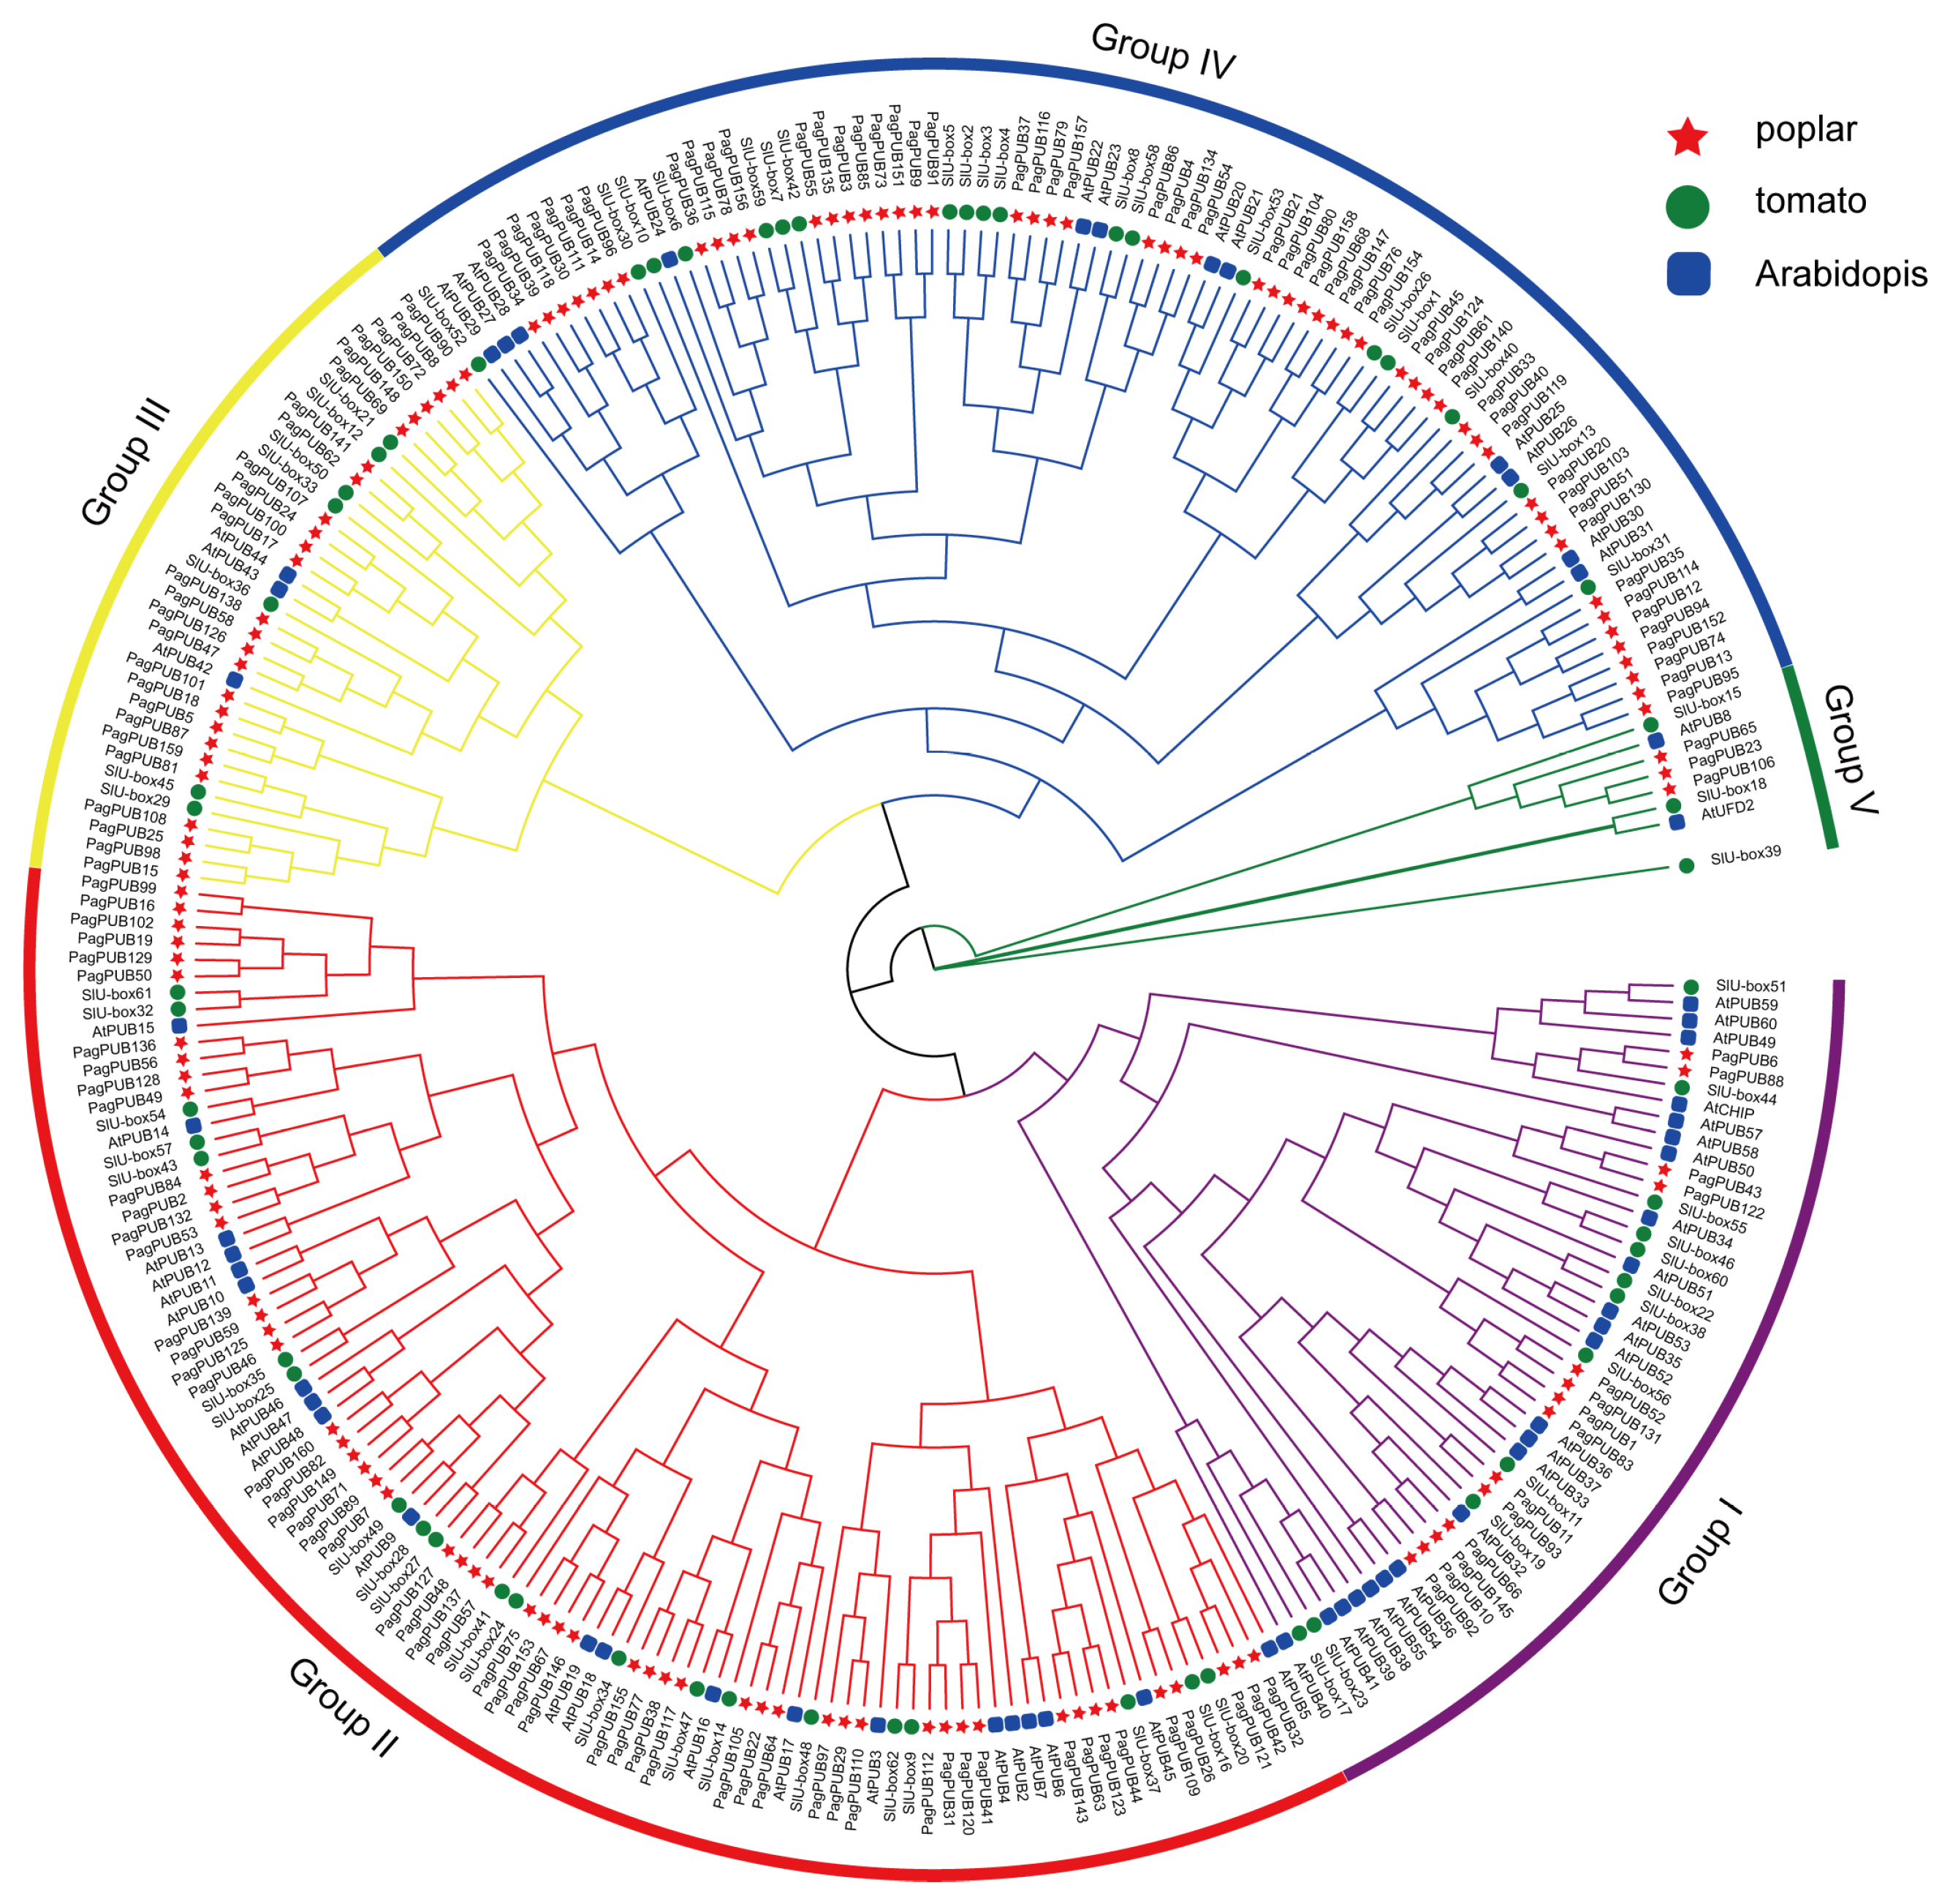
3.3. Phylogenetic Analysis of PUB Genes in Poplar, Arabidopsis and Tomato

To investigate the evolutionary relationships of the PUB gene family in poplar, a Neighbor-Joining (NJ) phylogenetic tree was constructed using full-length PUB protein sequences from poplar, tomato, and Arabidopsis. A total of 275 PUB proteins, including 152 from poplar, 62 from tomato, and 61 from Arabidopsis, were aligned using MUSCLE, and the NJ tree was generated with MEGA software using 1000 bootstrap replicates. Based on the phylogenetic relationships, all PUB proteins were classified into five major groups, designated as Groups I to V (Figure 2). Group III contained the largest number of total members, whereas Group V had the fewest. The 152 poplar PUB proteins were distributed across all five groups: 14 members in Group I, 55 in Group II, 26 in Group III, 54 in Group IV, and 3 in Group V. Notably, PUB genes from poplar and tomato were more frequently clustered together compared to those from Arabidopsis, suggesting a closer evolutionary relationship between poplar and tomato.

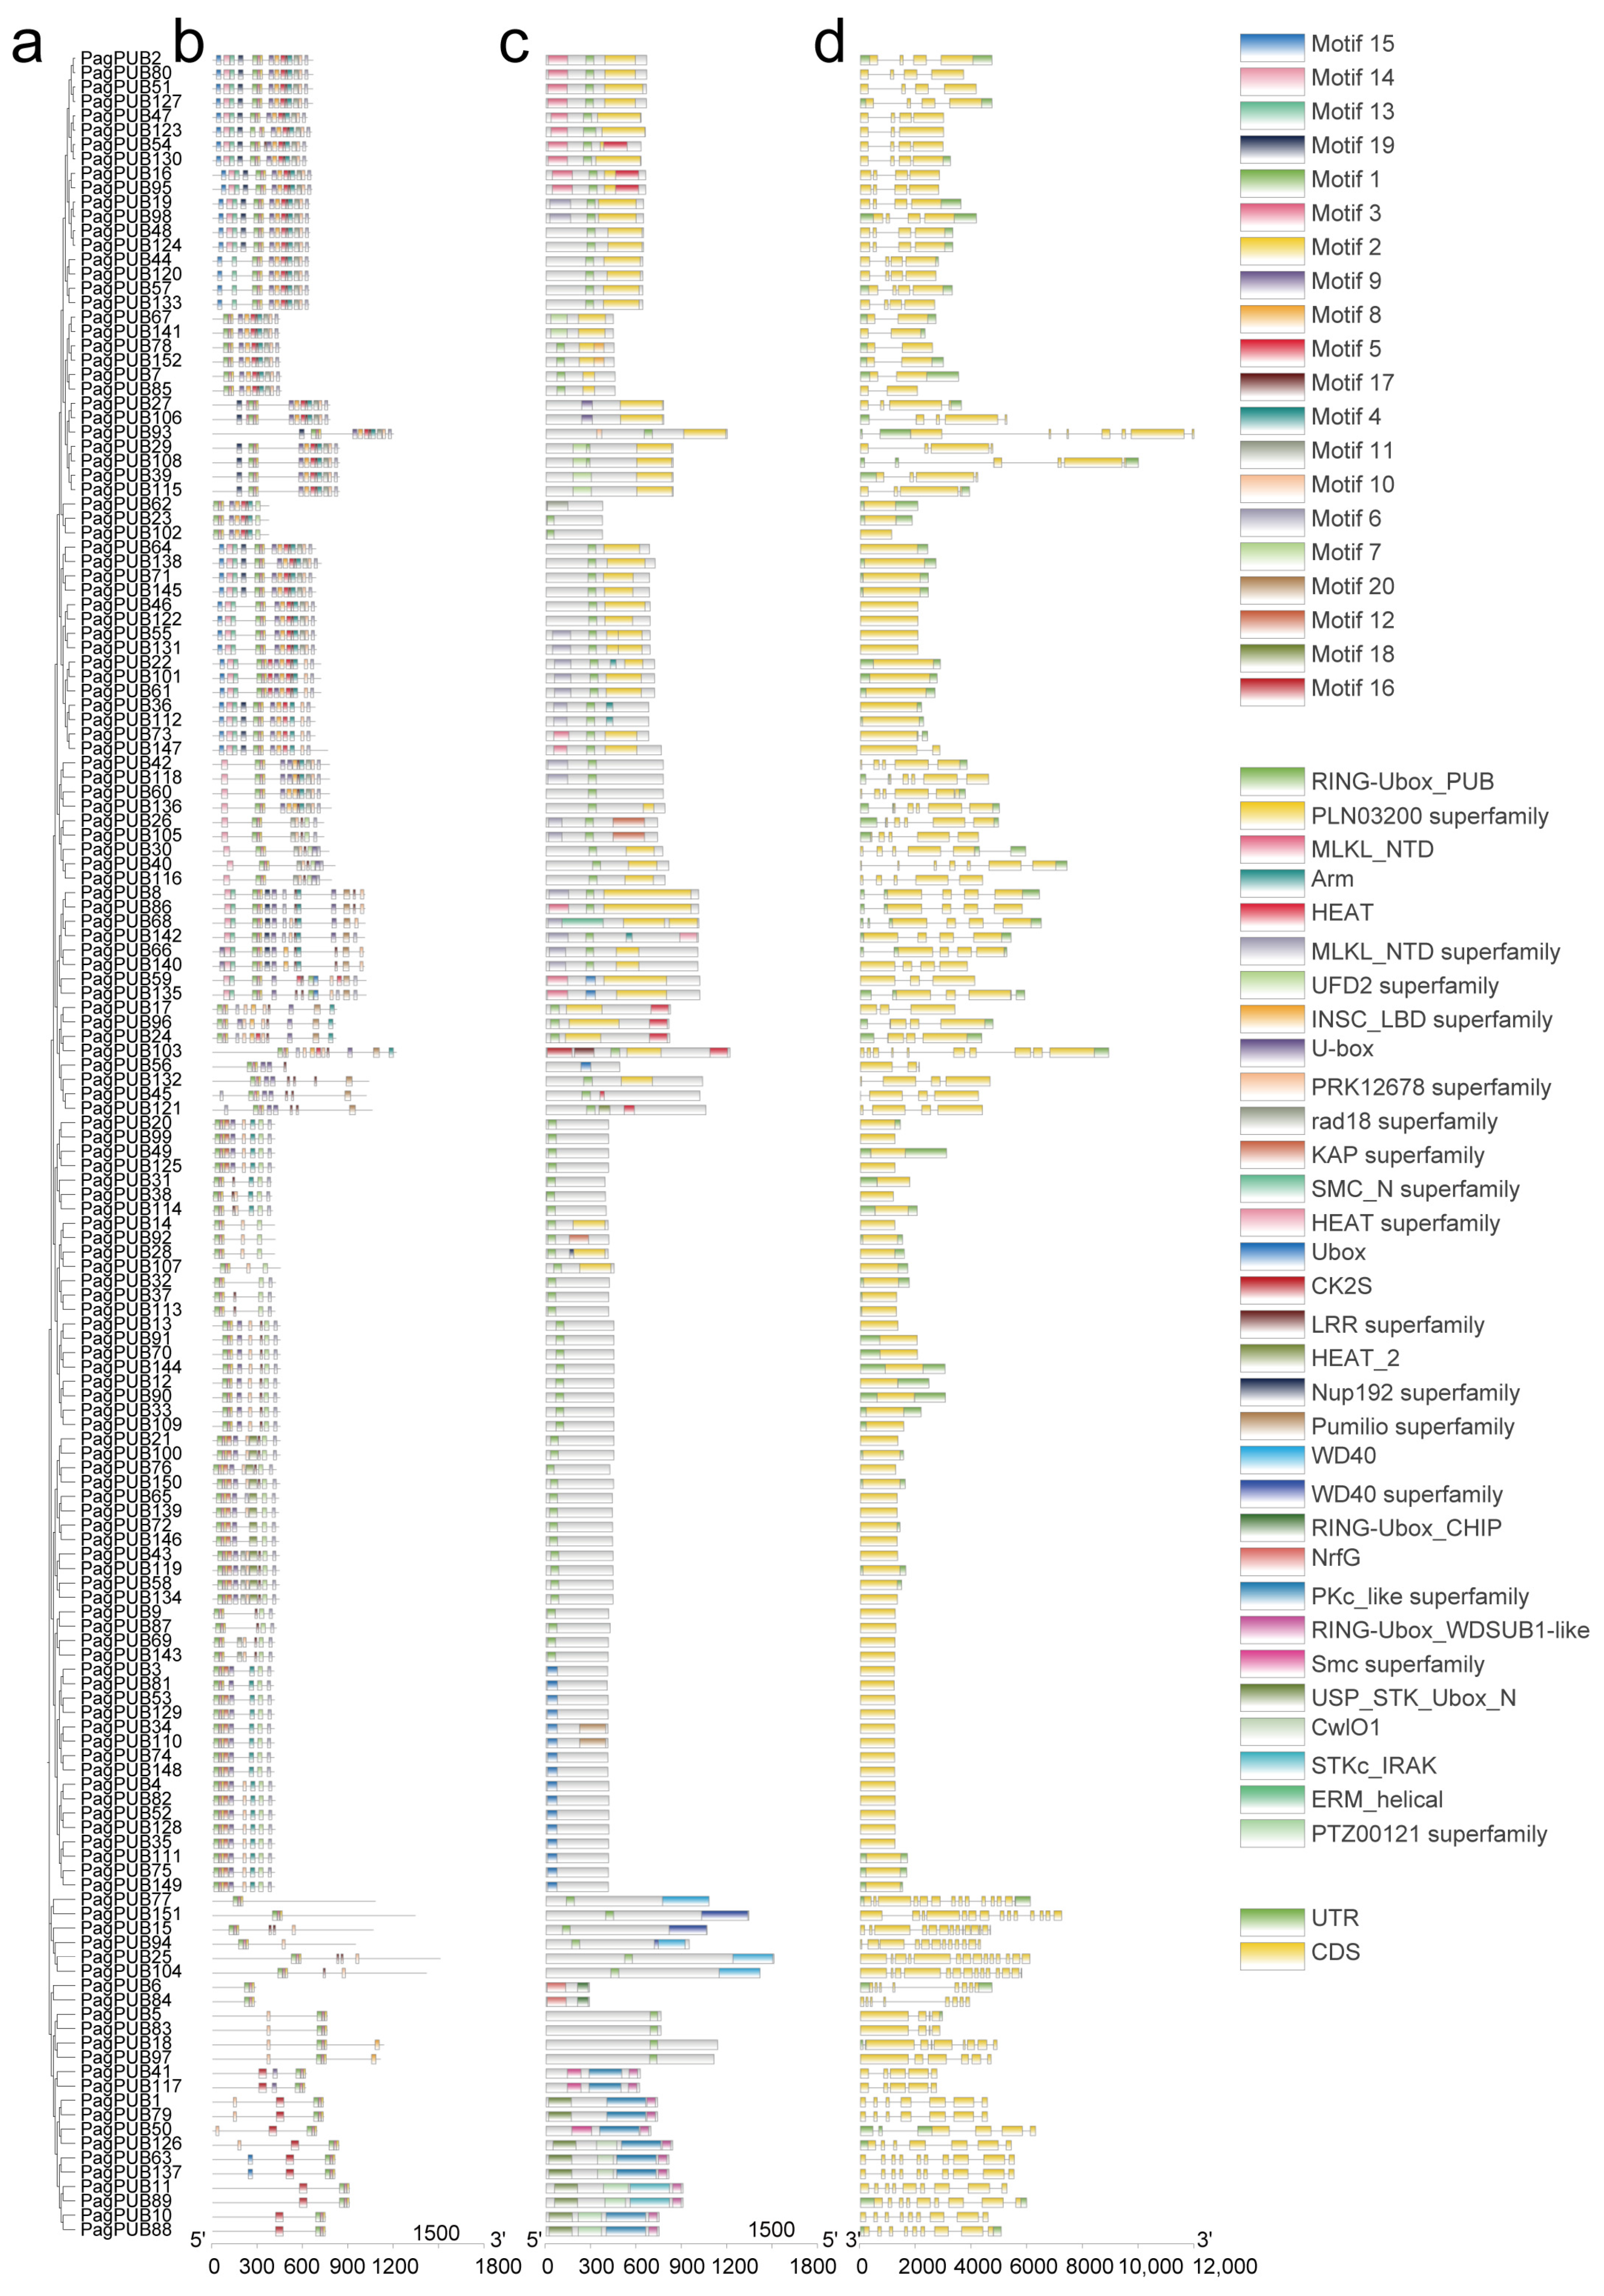
3.4. Gene Structure, Conserved Domain, and Motif Analysis of PagPUB Geness

To explore the structural diversity and functional conservation of PUB genes in poplar, we analyzed the gene structures, conserved motifs, and functional domains of PagPUB family members. First, a Neighbor-Joining (NJ) phylogenetic tree was constructed using the full-length protein sequences of PagPUB genes with 1000 bootstrap replicates (Figure 3a). A total of 20 conserved motifs were identified using the MEME Suite (Figure 3b). Most PagPUB proteins shared several core motifs, particularly Motif1, Motif2, and Motif3, indicating that these motifs are highly conserved within the PagPUB gene family. SMART domain analysis revealed that the U-box domain is composed of these three motifs, further validating the reliability of the PUB gene set identified in this study. Notably, certain motifs were specific to particular subgroups, suggesting functional divergence among different PUB subfamilies. Domain analysis using the NCBI Conserved Domain Database (CDD) confirmed that all PagPUB proteins contained the canonical U-box domain (Figure 3c). Additionally, several proteins possessed other domains, such as ARM repeats, WD40 repeats, or other functional motifs, indicating their potential involvement in diverse biological processes. Exon–intron structure analysis revealed considerable variation in gene architecture among PagPUB members (Figure 3d). Some genes had multiple exons with long introns, while others exhibited simpler structures with a single exon. For example, PagPUB15 contained the highest number of exons (15), whereas genes such as PagPUB3, PagPUB81, and PagPUB149 consisted of only one exon. The variation in gene structures supports the idea of the functional diversification of PagPUB genes during evolution.

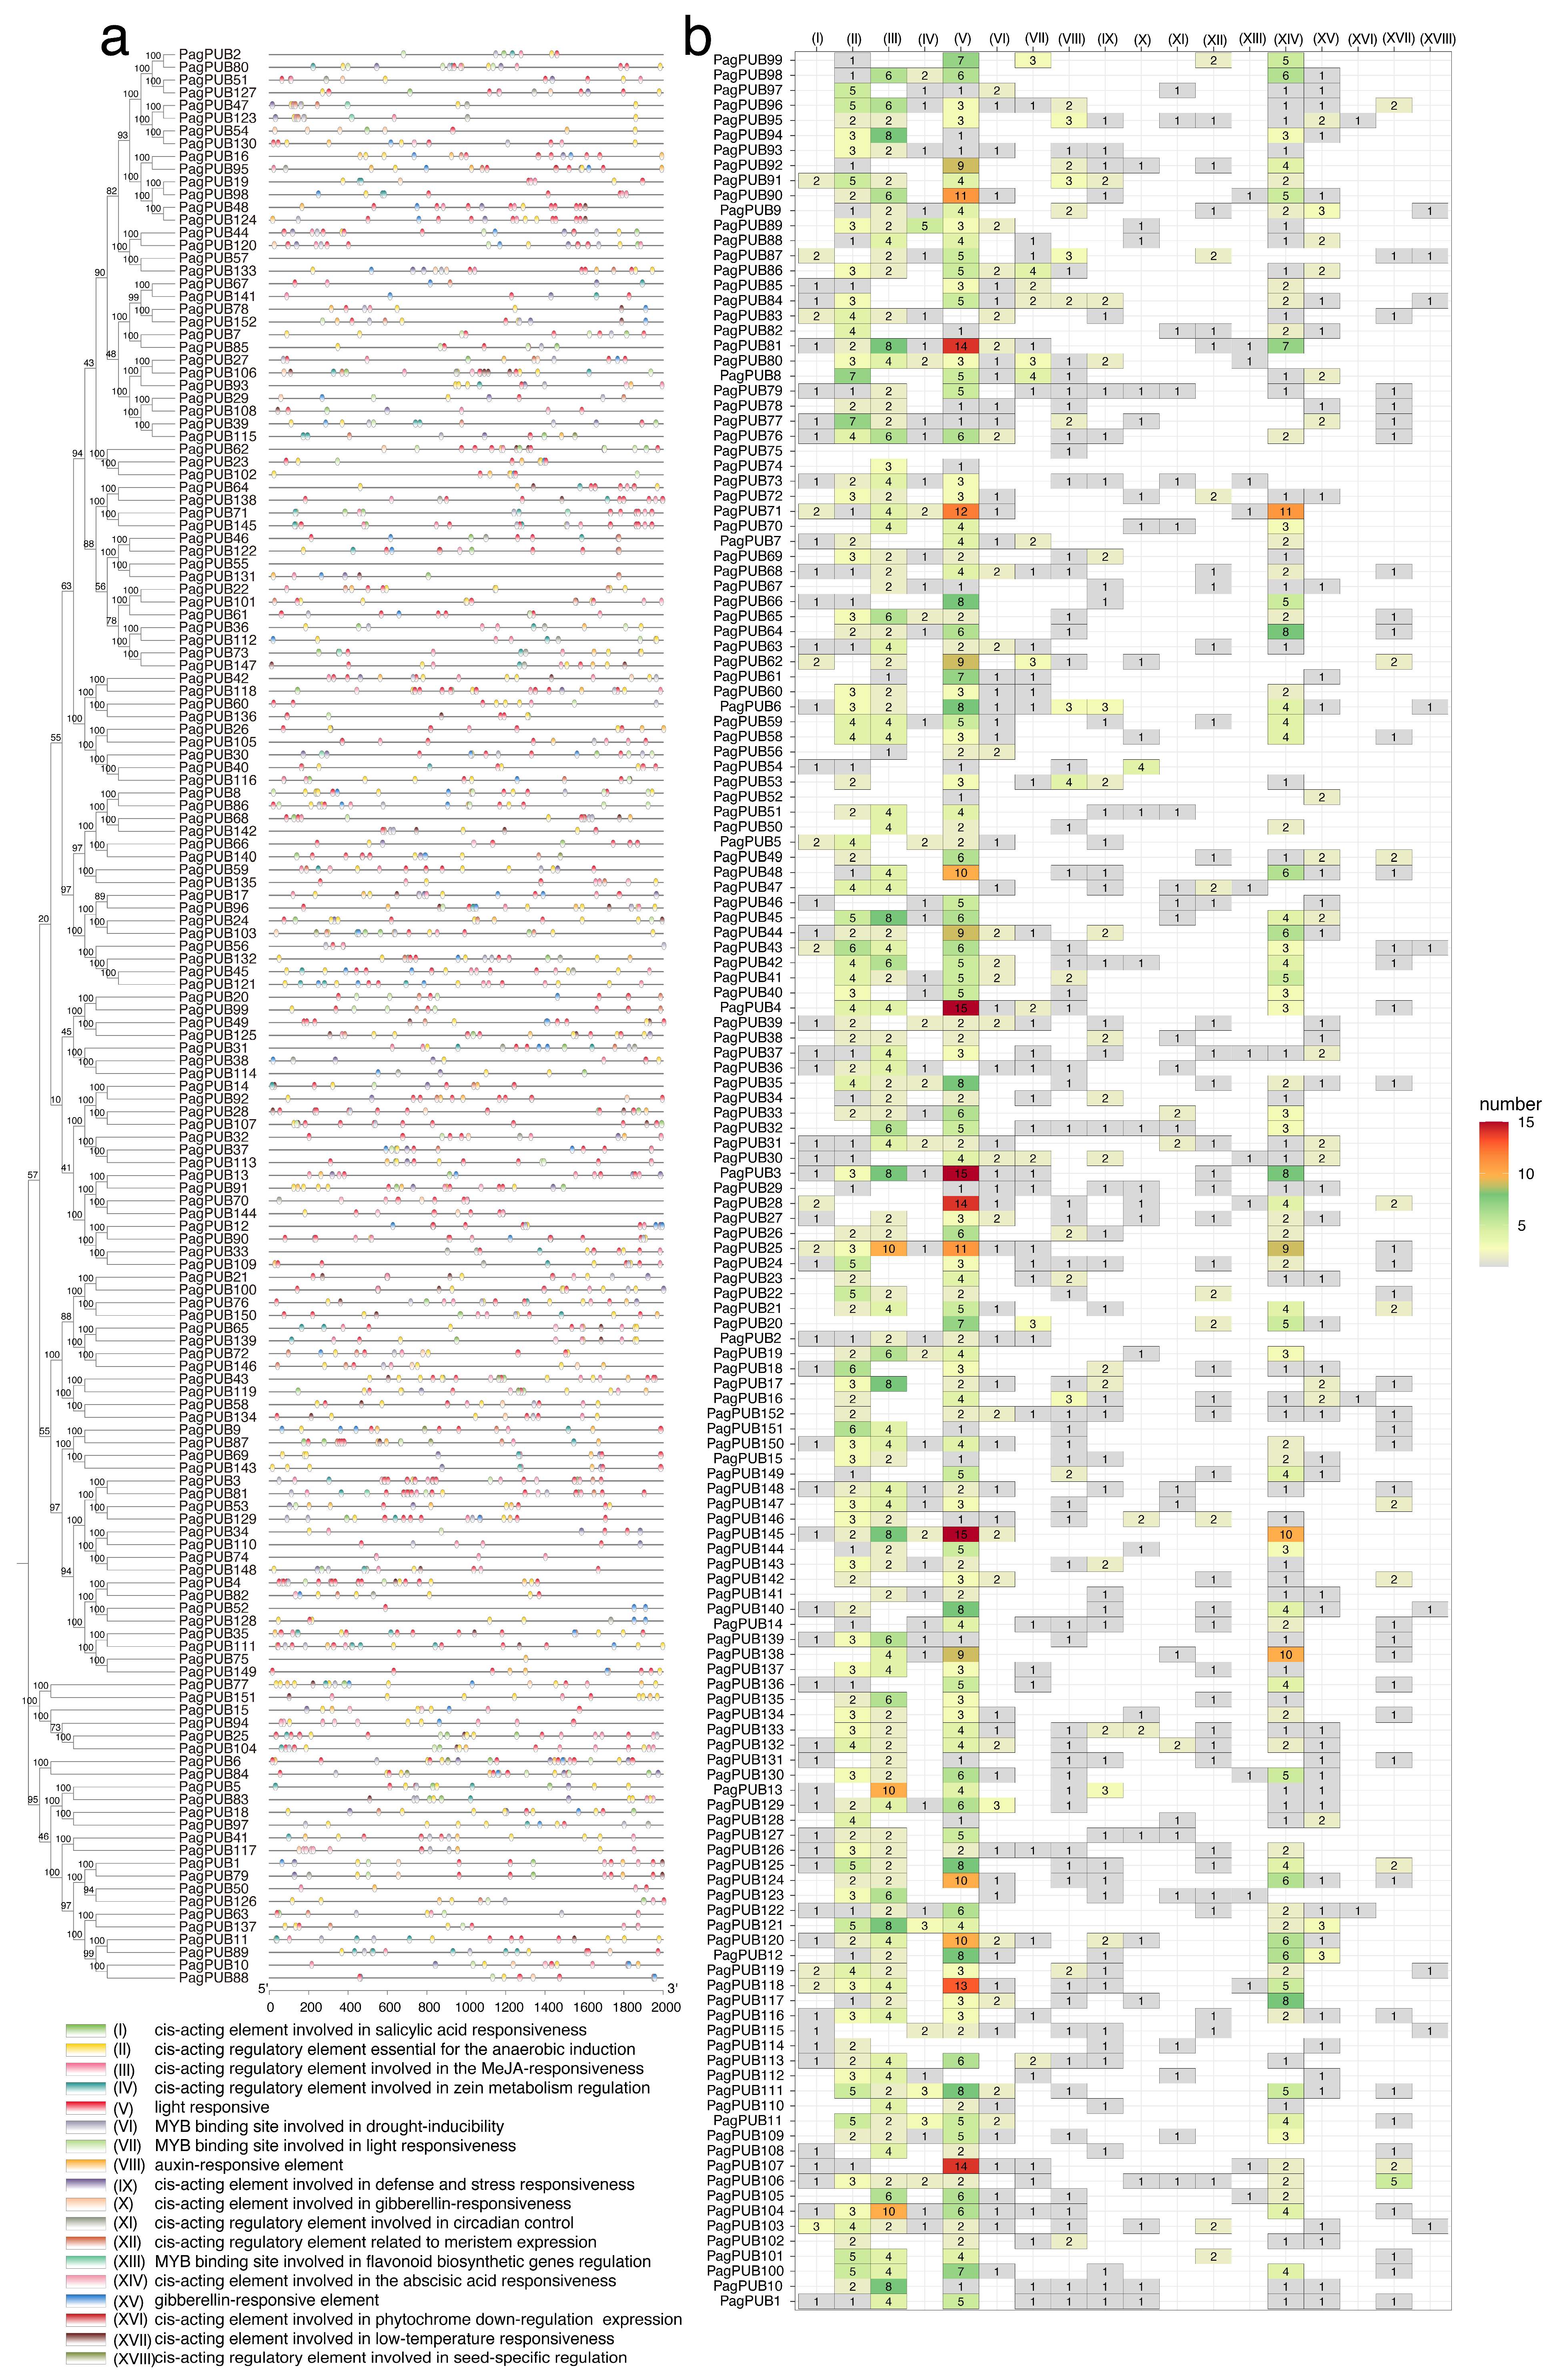
3.5. Cis-Acting Element Predication of PagPUB Genes

Gene expression and function are largely influenced by cis-acting elements located in promoter regions. To investigate the potential regulatory mechanisms of PagPUB genes, we analyzed the 2000 bp upstream sequences (putative promoter regions) of 152 PagPUB genes for cis-acting elements. A total of 52 different types of cis-elements were identified. Among them, 18 functionally important cis-elements were selected for further analysis (Figure 4a and Table S1), including elements associated with hormone responsiveness (e.g., auxin, gibberellin, abscisic acid, salicylic acid, and MeJA), stress responses (e.g., drought, low temperature, and anaerobic induction), light responsiveness, and tissue-specific expression. The distribution of these cis-elements varied substantially among PagPUB genes. Light-responsive elements were the most abundant and were detected in the promoter regions of nearly all PagPUB genes, suggesting that light signaling may broadly regulate PUB gene expression in poplar. Additionally, many promoters contained hormone-responsive elements, particularly those responsive to abscisic acid (ABRE), MeJA, and auxin, indicating the potential roles of PagPUB genes in hormone signaling and abiotic stress responses.
A quantitative analysis of the 18 major cis-elements revealed diverse abundance patterns across genes (Figure 4b). Notably, MYB-binding sites involved in drought inducibility were frequently detected. For instance, PagPUB30 contained three such MYB-binding elements in its promoter region, suggesting its potential role in drought stress responses and regulation by MYB transcription factors. In total, 62 PUB genes contained cis-acting elements involved in defense and stress responsiveness; 117 PUB genes contained cis-acting elements involved in the abscisic acid responsiveness; and 48 genes contained cis-acting elements involved in low-temperature responsiveness. These findings suggest that PUB genes may be involved in a wide range of abiotic and biotic stress responses.

3.6. Synteny and Duplication Event Analyses Reveal Expansion of the PUB Gene Family

Gene family expansion is often driven by various duplication events, including whole-genome duplication (WGD)/segmental duplication, tandem duplication, proximal duplication, transposed duplication, and dispersed duplication. To investigate the evolutionary history of the PUB gene family in poplar, we conducted a comprehensive synteny analysis using MCScanX and classified the duplication modes in the following priority order: WGD > tandem duplication > proximal duplication > transposed duplication > dispersed duplication. Among these, WGD-derived PUB gene pairs were the most abundant, accounting for the majority of duplicated genes in both subgenomes. Specifically, 69 out of 78 genes (88%) in subgenome A and 60 out of 74 genes (81%) in subgenome G originated from WGD events (Table S2). These results suggest that WGD has played a major role in the expansion of the PUB gene family in poplar (Figure 5a). We further identified collinear gene pairs within each subgenome. As shown in Figure 5b,c, PUB genes exhibited extensive collinearity. A total of 26 collinear gene pairs were detected in subgenome A, and 38 were detected in subgenome G. These findings indicate that the PUB gene family has undergone significant expansion through large-scale duplication events, contributing to its diversification during evolution.
To infer the evolutionary timing of PUB gene duplication events, we calculated the synonymous substitution rates (Ks) of collinear gene pairs in subgenomes A and G (Table S3). The Ks values of the PUB gene pairs in subgenome A ranged from approximately 0.01 to 3.5, with a prominent peak between 0.15 and 0.30 (Figure 5d), while subgenome G exhibited a similar distribution pattern (Figure 5e). This Ks peak corresponds to a relatively recent whole-genome duplication (WGD) event that occurred approximately 30–45 million years ago (MYA), as is consistent with previous studies in poplar species. To estimate the selective pressure acting on duplicated PUB genes, we calculated the ratio of non-synonymous to synonymous substitutions (Ka/Ks). The distribution of Ka/Ks values (Figure 5f) showed that most gene pairs had Ka/Ks < 1, indicating that the PUB gene family has predominantly undergone purifying selection during evolution. Moreover, Ka/Ks ratios were generally higher in subgenome G than in subgenome A, suggesting that PUB genes in subgenome A have been subject to stronger evolutionary constraints.

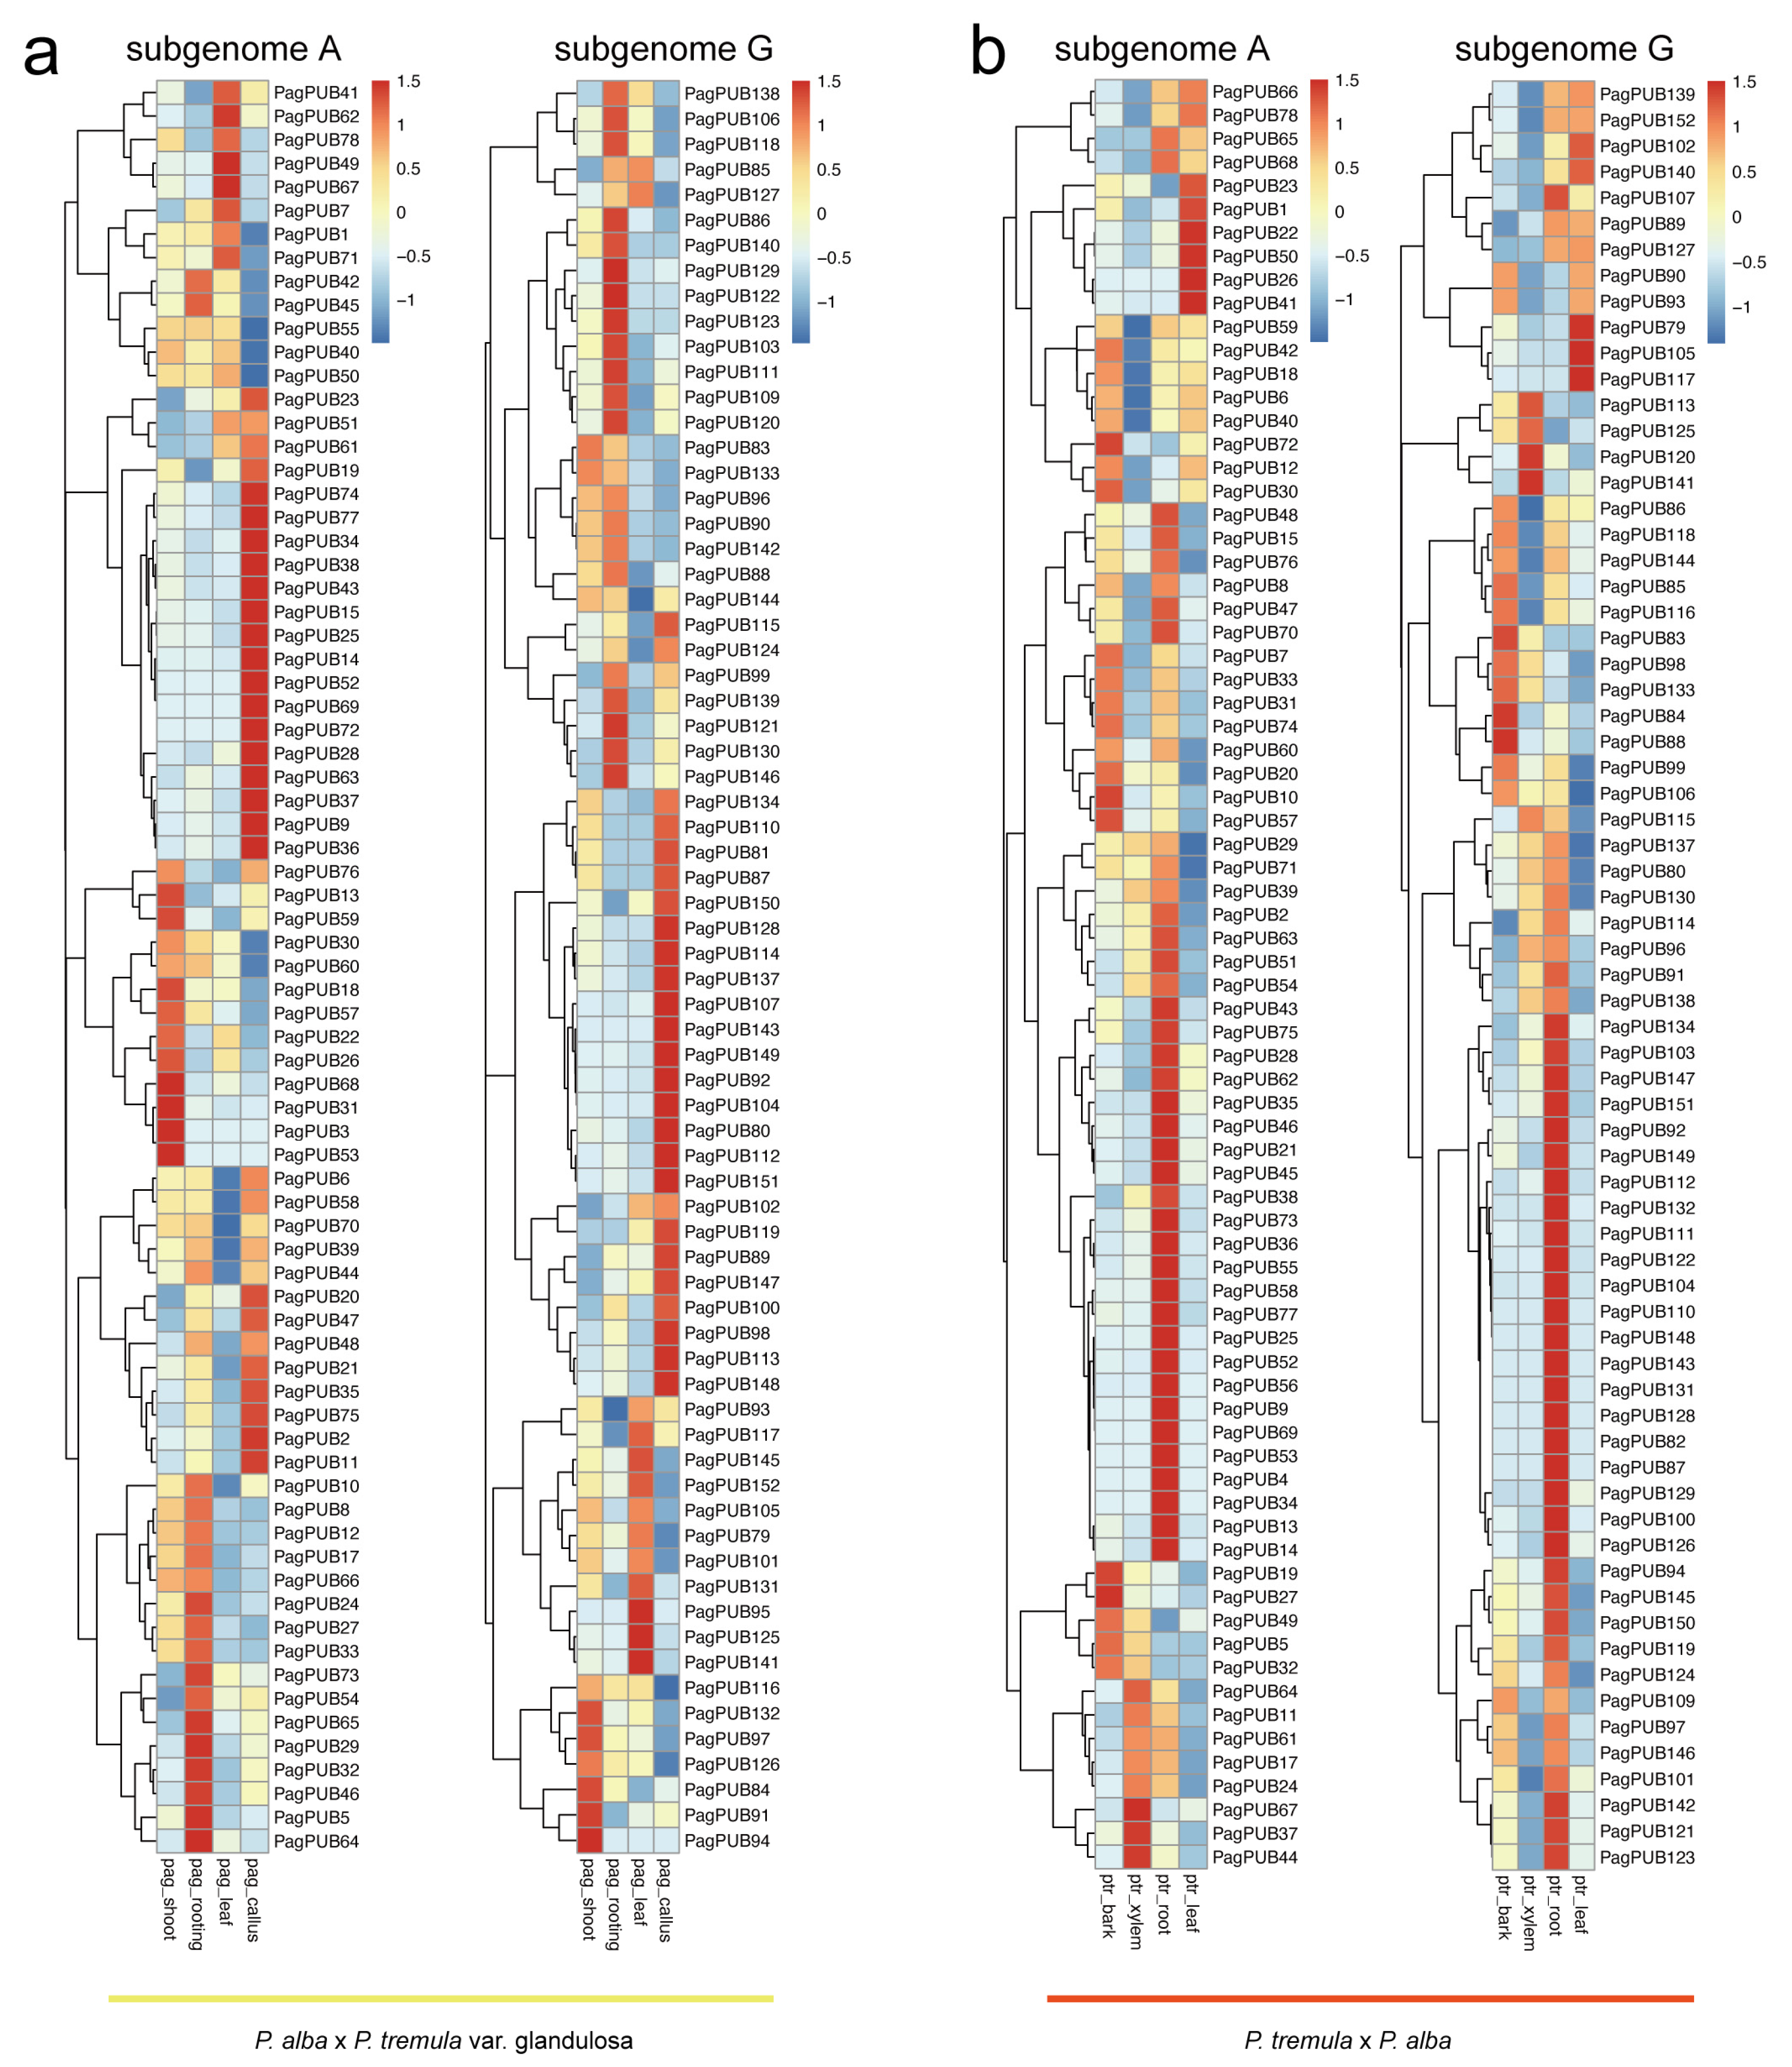
3.7. Expression Patterns of PUB Genes in Different Tissues of Poplar

To investigate the tissue-specific expression patterns of PUB genes, we analyzed RNA-seq data from two poplar hybrids: P. alba × P. tremula var. glandulosa and P. tremula × P. alba. Gene expression levels were quantified as FPKM values and visualized using heatmaps (Figure 6, Tables S4 and S5). As shown in Figure 6a, PUB genes in P. alba × P. tremula var. glandulosa displayed diverse expression patterns across four tissues: root, leaf, bark, and xylem. Notably, several genes, such as PagPUB9, PagPUB36, PagPUB37, PagPUB92, and PagPUB112, exhibited preferential expression in callus tissue, suggesting their potential involvement in processes such as cell dedifferentiation and regeneration. In P. tremula × P. alba, gene expression was examined in shoot, root, leaf, and callus tissues (Figure 6b). Similarly, distinct expression trends were observed in this hybrid. Given the essential role of roots in water and nutrient absorption, as well as in responding to environmental stresses such as drought, salinity, and soil pathogens, several PUB genes—including PagPUB67, PagPUB37, PagPUB44, PagPUB121, PagPUB123, and PagPUB142—were found to be highly expressed in roots, implying their potential roles in stress response pathways. Overall, many PUB genes exhibited clear tissue-specific expression patterns. Some genes were broadly expressed across multiple tissues, while others showed highly specialized expression profiles. These findings suggest that PUB genes may participate in a variety of biological processes in poplar, including tissue development, cellular differentiation, and adaptation to environmental challenges.

3.8. Expression Patterns of PUB Genes Under Pathogen Stress

To further investigate the potential roles of PUB genes in biotic stress responses, we analyzed their expression profiles in poplar leaves following A. alternata infection. Expression data were derived from time-course transcriptome datasets, and the results were visualized as heatmaps for both subgenome A and subgenome G (Figure 7, Tables S6 and S7). A number of PUB genes displayed dynamic transcriptional changes in response to pathogen treatment. For instance, genes such as PagPUB3, PagPUB4, PagPUB46, PagPUB53, PagPUB81, and PagPUB82 showed marked upregulation at two days post-inoculation, suggesting their involvement in early defense responses. Additionally, PagPUB48, PagPUB117, and PagPUB150 were strongly induced at three days post-treatment, indicating a slightly delayed yet rapid activation in response to pathogen attack. In contrast, genes such as PagPUB15, PagPUB40, PagPUB67, PagPUB93, and PagPUB141 were significantly upregulated at four days post-inoculation, reaching peak expression levels at this time point. This pattern suggests that these genes may be involved in sustained or later-phase immune signaling. Collectively, these findings indicate that PUB genes in poplar are responsive to pathogen stress in a time-dependent manner, and that different PUB members may participate in distinct stages of the plant’s defense response.

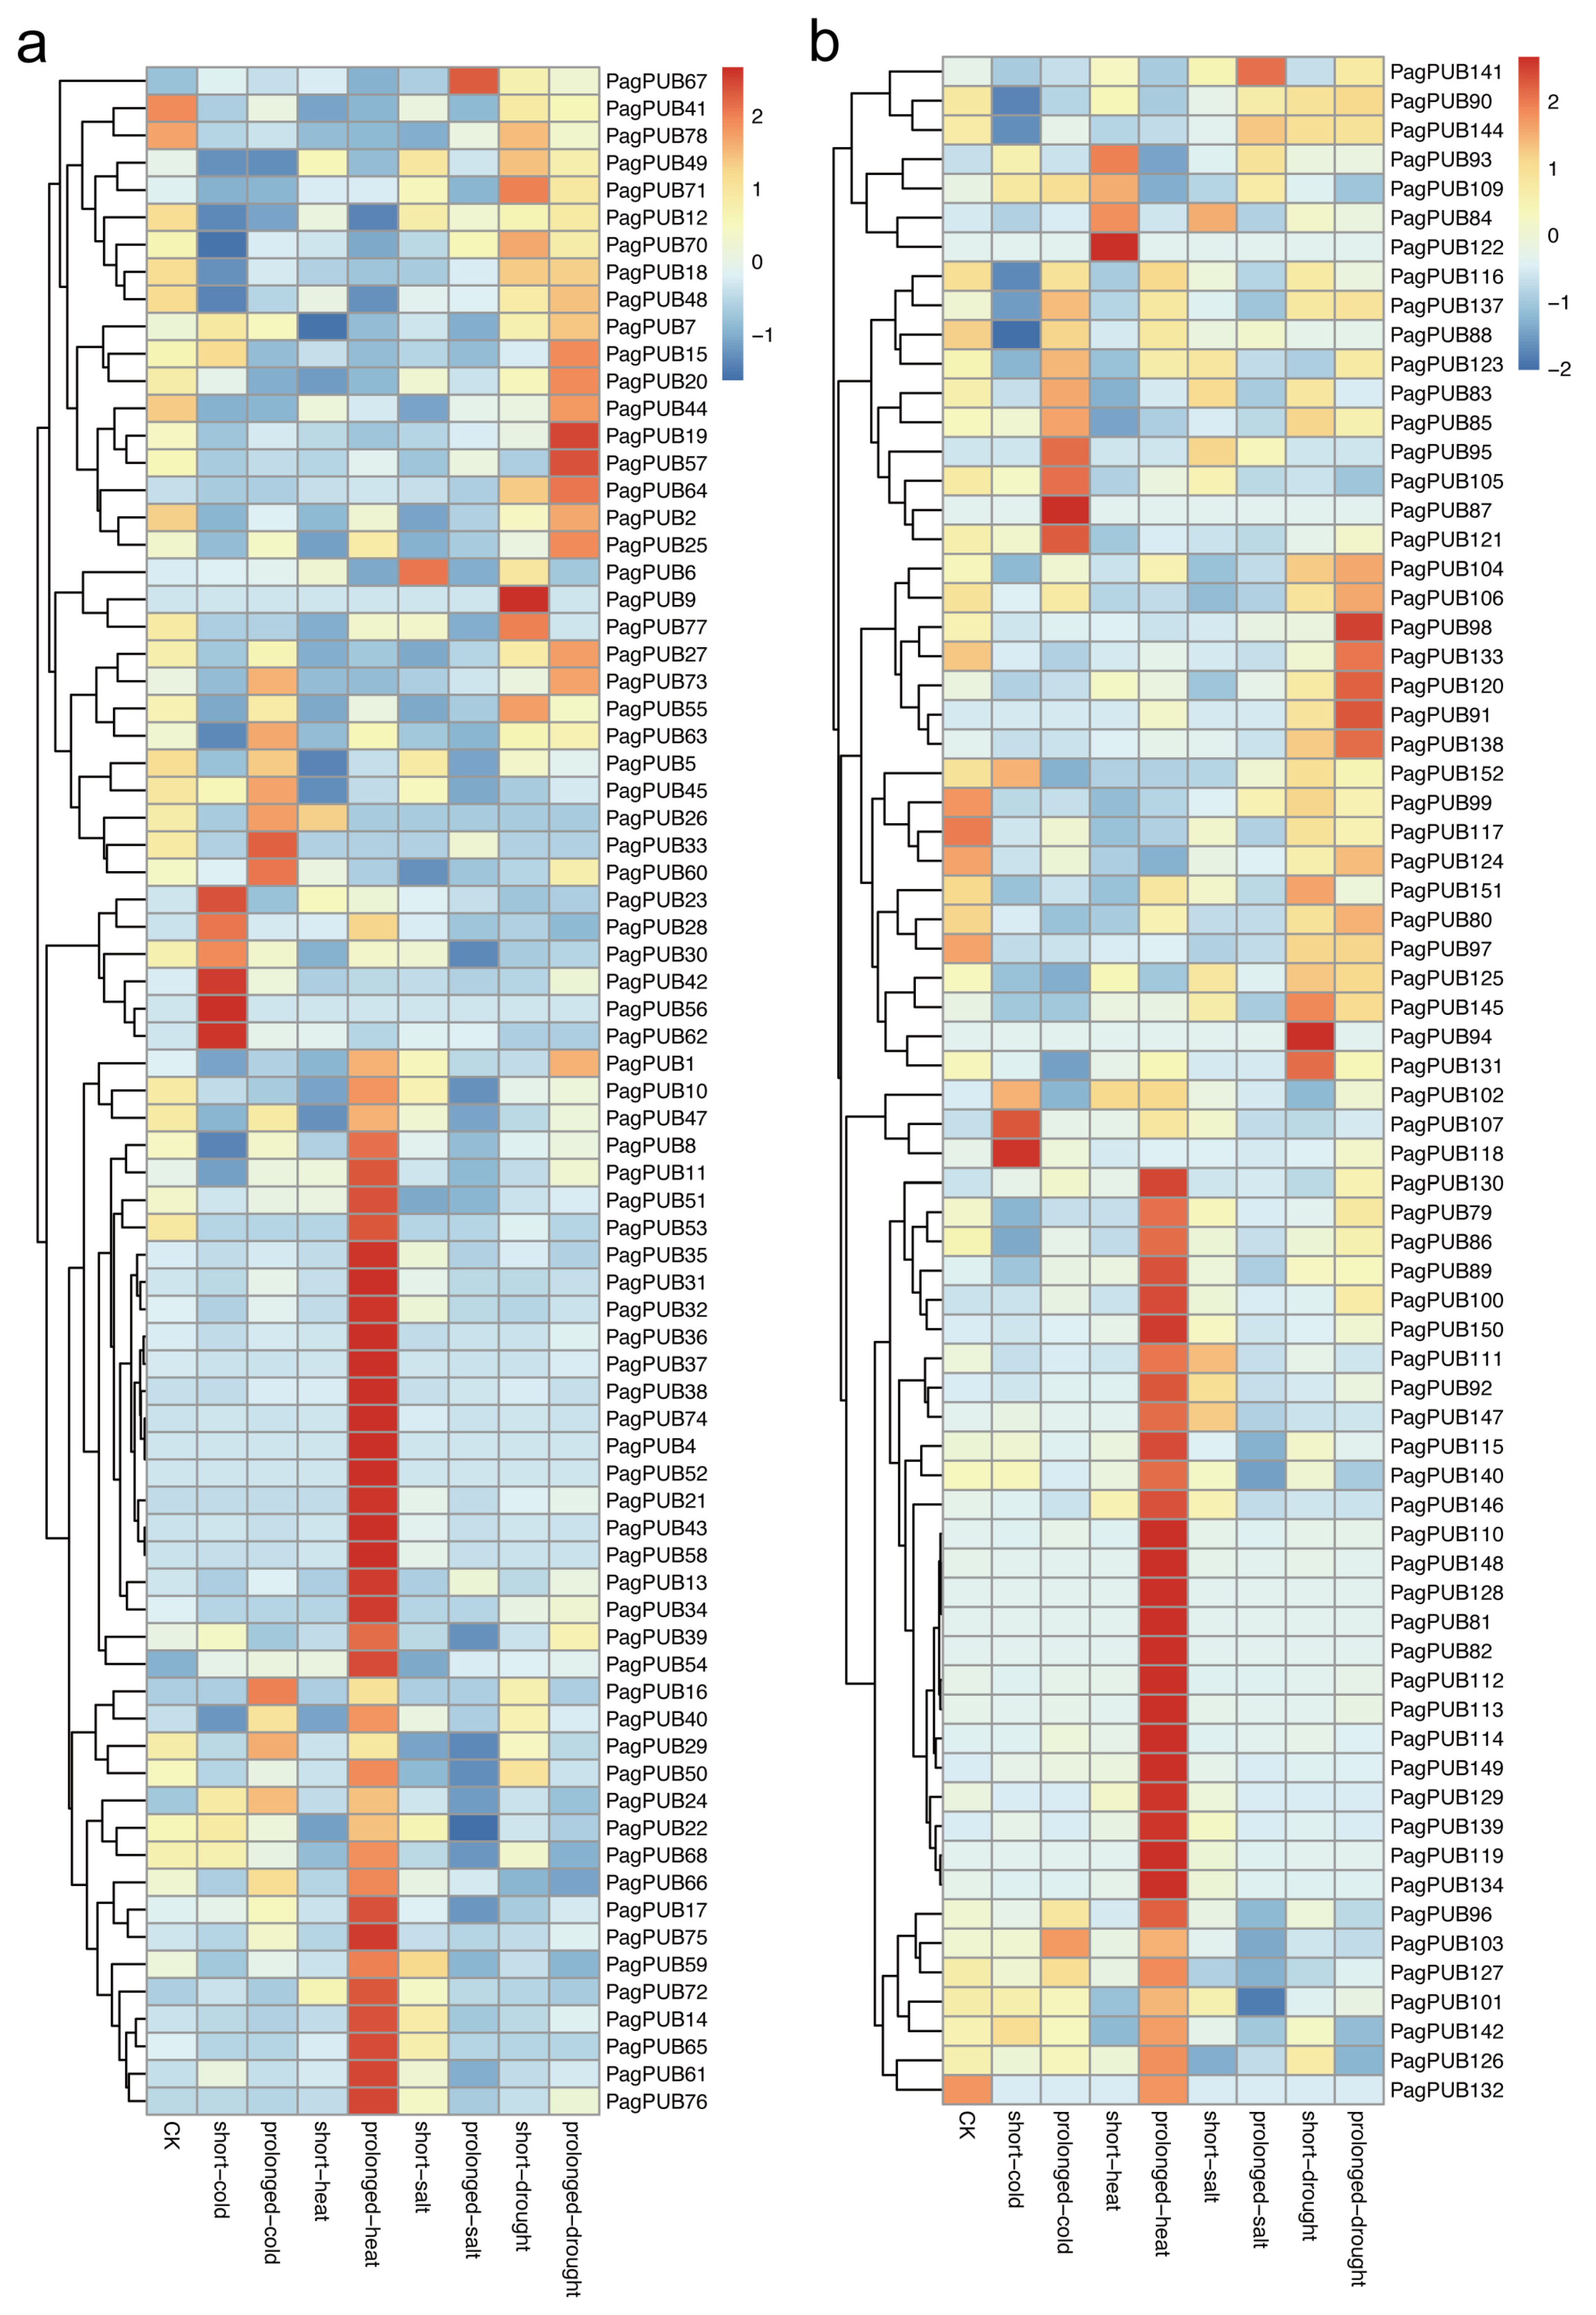
3.9. Expression Patterns of PUB Genes Under Abiotic Stress Conditions

To assess the potential involvement of PUB genes in abiotic stress responses, we analyzed their expression patterns under four different stress treatments: drought, salt, high temperature, and low temperature. Gene expression data from both subgenome A and subgenome G were visualized as heatmaps (Figure 8). As shown in Figure 8a, several PUB genes in subgenome A exhibited significant transcriptional changes in response to abiotic stress. Notably, 30 out of 78 genes (38%) showed markedly increased expression under high-temperature conditions, including PagPUB75, PagPUB21, and PagPUB43, suggesting their possible roles in heat stress tolerance. Additionally, PagPUB67 was upregulated under salt stress, while PagPUB9 and PagPUB19 responded strongly to drought stress, indicating their potential involvement in salinity and drought adaptation mechanisms. PagPUB9 contained five cis-acting elements involved in ABA responsiveness; PagPUB19 contained three cis-acting elements involved in ABA responsiveness. Previous studies reported that ABA plays a crucial role in regulating stomatal closure under drought conditions [36]. These findings highlight the potential role of PUB genes in drought stress.
In subgenome G (Figure 8b), genes such as PagPUB107, PagPUB118, and PagPUB87 showed higher expression levels under low-temperature treatment. Moreover, 36 out of 74 PUB genes (49%) were significantly upregulated under high-temperature conditions, further supporting the hypothesis that heat stress is a key regulatory factor for PUB gene expression in poplar. Taken together, these results reveal that PUB genes display diverse and stress-specific expression patterns under different abiotic conditions. The differential expression responses between subgenomes also suggest potential functional diversification. These findings provide valuable insights into the roles of PUB genes in stress adaptation, particularly in response to heat stress.

4. Discussion

U-box E3 ubiquitin ligase genes (PUB) are widely reported in plants [9] and have been implicated in various biological processes, including plant development, hormonal signaling, and responses to abiotic and biotic stresses [37,38,39,40,41]. Due to their critical roles in plant growth and adaptation, the PUB gene family has been identified in many plant species, such as Arabidopsis (61 PUB gene members) [11,12], rice (77 PUB gene members) [13], tomato (62 PUB gene members) [14], cotton (93 PUB gene members) [15], pear (62 PUB gene members) [42] and banana (91 PUB gene members) [16]. In the present study, we performed a comprehensive genome-wide identification of the PUB gene family in poplar (P. alba × P. tremula var. glandulosa). A total of 152 PUB genes were identified. Among them, 78 genes were located in subgenome A (P. alba) and 74 genes were located in subgenome G (P. tremula var. glandulosa), suggesting potential evolutionary divergence between the two subgenomes.
Phylogenetic analysis clustered all PUB proteins from poplar, tomato, and Arabidopsis into five distinct groups (I–V), consistent with previous classifications in other species such as cotton [15], banana [16], and pear [42]. Interestingly, PUB genes from poplar and tomato were more frequently grouped together than with Arabidopsis, reflecting their closer taxonomic relationship. Group II contained the largest number of poplar PUB genes, while Group V had the fewest. This uneven distribution may suggest the lineage-specific expansion or contraction of specific PUB clades. Additionally, motif and domain analyses revealed that, although most PagPUB proteins harbor the conserved U-box domain, a substantial proportion also contain ARM, WD40, or TPR domains. These accessory domains are known to mediate protein–protein interactions and substrate recognition [41], highlighting the functional diversity of PUB family members. The promoter analysis of PagPUB genes identified multiple cis-acting elements associated with abiotic stress responses, hormone signaling, and developmental regulation. Notably, 118 genes contained abscisic-acid-responsive elements, suggesting that the PUB gene family in poplar may be involved in ABA-mediated signaling pathways. PagPUB71 harbored 11 abscisic-acid-responsive elements, indicating potential involvement in ABA responses. In addition, drought-responsive MYB-binding elements were commonly detected across promoters of many PUB genes. For example, PagPUB30 contained three MYB-related drought-inducible elements, implying potential transcriptional regulation by MYB transcription factors during drought stress. Previous studies have shown that PUB genes play important roles in drought stress responsive process [43,44], and similar roles mechanisms may exist in poplar.
Poplar has undergone a recent whole-genome duplication event [45]. Gene duplication is a key driver of gene family expansion and functional diversification [46]. In this study, the MCScanX analysis revealed that 129 out of 152 (85%) PagPUB genes were derived from whole-genome duplication (WGD) or segmental duplication events. Specifically, 69 out of 78 genes in subgenome A and 60 out of 74 genes in subgenome G were WGD-derived, indicating that lineage-specific genome duplication events contributed predominantly to the expansion of the PUB gene family in poplar. This pattern is consistent with other gene families in poplar that have undergone substantial expansion via WGD. For example, a previous study reported that WGD contibuted to the evolution of the F-box-associated (FBA) protein family [47]. To further explore the evolutionary dynamics, we examined the Ka/Ks ratios of duplicated PUB gene pairs. The Ks distribution showed a peak around 0.15–0.30, corresponding to a relatively recent WGD event that occurred approximately 30–45 million years ago (MYA); this finding is similar to the report from previous studies of poplar genome evolution that poplar underwent a recent whole-genome duplication event [45]. Most Ka/Ks ratios were less than 1, indicating that the duplicated PUB genes have undergone strong purifying selection to maintain functional stability. Interestingly, the Ka/Ks values were slightly higher in subgenome G than in subgenome A, suggesting that PUB genes in subgenome G might be under relatively relaxed selection constraints or might be undergoing functional divergence.
Biotic stress analysis under A. alternata infection demonstrated that several PUB genes exhibited time-specific induction. Genes such as PagPUB46 and PagPUB53 responded early (two days), while PagPUB117 and PagPUB150 showed peak expression at three days, and others, such as PagPUB67 and PagPUB141, were upregulated after four days, implying temporal regulation during pathogen defense. Similar dynamic expression changes have been reported for PUB genes in Arabidopsis under pathogen attack [48]. Under abiotic stress conditions, including drought, salt, heat, and cold, a number of PagPUB genes were upregulated in a stress-specific manner. In total, 30 genes in subgenome A and 36 genes in subgenome G were responsive to high-temperature stress. In rice, OsPUB63 has been identified as an early heat-responsive E3 ubiquitin ligase, and its overexpression enhances heat and dehydration stress tolerance in transgenic lines [20]. These findings suggest that many PUB genes are involved in high-temperature stress.
We explored the correlation between the number of drought-related cis-acting elements in the promoter regions of PUB genes and their expression levels under short-term and long-term drought conditions. Specifically, we counted the drought-related cis-elements (MYB binding sites involved in drought inducibility) in the promoter regions of PUB genes, and we then compared these counts with the gene expression levels under both short-term and long-term drought treatments. Our correlation analysis revealed a significant positive relationship between the number of drought-related cis-elements and the expression levels of PUB genes (short-term: p-value = 0.006213; long-term: p-value = 0.009788), indicating that genes with more drought-responsive cis-elements tend to show higher expression levels in response to both short-term and long-term drought stress. This suggests that these cis-elements may play an important role in regulating PUB gene activity in response to drought stress.
In summary, this study presents a comprehensive genome-wide analysis of the PUB gene family in poplar. The expansion of PUB genes was primarily driven by whole-genome duplication (WGD) events, and most gene pairs have been conserved through purifying selection. Promoter and expression analyses suggest that PUB genes may play important roles in hormone signaling and responses to various environmental stresses. Overall, our findings provide a valuable foundation for the future functional characterization of PUB genes and their potential application in the genetic improvement of stress-resilient poplar varieties.

5. Conclusions

In this study, we performed a comprehensive identification of the PUB gene family in poplar and highlighted the roles of these genes in biotic and abiotic stress responses. A total of 152 PUB genes were identified. Whole-genome duplication events played a major role in the expansion of the PUB gene family. An analysis of the cis-acting elements revealed that PUB genes are involved in plant hormone signaling pathways and stress response mechanisms. The transcriptome data analysis showed that PUB genes exhibit tissue-specific expression across various tissues of poplar and are induced under diverse stress conditions, including drought, salinity, cold, heat, and pathogen infection. These findings provide valuable insights into the functional roles of PUB genes in stress adaptation, offering potential targets for improving stress resilience in poplar and other tree species.

Supplementary Materials

The following supporting information can be downloaded at: https://www.mdpi.com/article/10.3390/f16050749/s1, Figure S1: Workflow for identifying PUB genes in poplar; Table S1: Cis-acting element analysis in the promoter of PUB genes in poplar; Table S2: Gene duplication analysis of the PUB gene family in poplar; Table S3: Ka, Ks and Ka/Ks ratio of the PUB syntenic gene pairs in poplar; Table S4: The expression patterns of PUB genes in four tissues (root, leaf, bark, and xylem) of P. alba × P. tremula var. glandulosa; Table S5: Expression patterns of PUB genes in four tissues (shoot, root, leaf, and callus) of P. tremula × P. alba; Table S6: PUB gene expression under pathogen treatments at different time points (two, three, and four days) compared to the control (water); Table S7: Expression levels of PUB genes under four abiotic treatments, including drought, salt, high temperature, and low temperature.

Author Contributions

Conceptualization, M.M.; funding, M.M.; data curation, Q.W., X.L., K.S., L.L., A.Z., Y.W., Q.L. and F.F.; writing–original draft preparation, B.S.; writing—review and editing, B.S., M.M. and F.F. All authors have read and agreed to the published version of the manuscript.

Funding

This work was supported by the Biological Breeding-National Science and Technology Major Projects (2023ZD0405601), the National Natural Science Foundation of China (32301613), and the China Postdoctoral Science Foundation (2023M741721).

Data Availability Statement

The transcriptome data were download from NCBI (accession numbers: ERR1864411-ERR1864437 and SRR12371687-SRR12371698).

Conflicts of Interest

The authors declare no conflicts of interest.

Abbreviations

The following abbreviations are used in this manuscript:
pITheoretical isoelectric points
WGDWhole-genome duplication
HMMHidden Markov Model
pITheoretical isoelectric points
ABAAbscisic acid
FPKMFragments per kilobase of exon per million mapped reads
WGDWhole-genome duplication
TDTandem duplication
PDProximal duplication
DDDispersed duplication
SDSingleton duplication
PUBPlant U-box E3 ubiquitin ligases
PTMPost-translational modification
TETransposable element

References

  1. Martín-Cardoso, H.; San Segundo, B. Impact of Nutrient Stress on Plant Disease Resistance. Int. J. Mol. Sci. 2025, 26, 1780. [Google Scholar] [CrossRef]
  2. Sachdev, S.; Ansari, S.A.; Ansari, M.I.; Fujita, M.; Hasanuzzaman, M. Abiotic Stress and Reactive Oxygen Species: Generation, Signaling, and Defense Mechanisms. Antioxidants 2021, 10, 277. [Google Scholar] [CrossRef] [PubMed]
  3. Gong, Z.; Xiong, L.; Shi, H.; Yang, S.; Herrera-Estrella, L.R.; Xu, G.; Chao, D.-Y.; Li, J.; Wang, P.-Y.; Qin, F. Plant abiotic stress response and nutrient use efficiency. Sci. China Life Sci. 2020, 63, 635–674. [Google Scholar] [PubMed]
  4. Hirayama, T.; Shinozaki, K. Research on plant abiotic stress responses in the post-genome era: Past, present and future. Plant J. 2010, 61, 1041–1052. [Google Scholar] [CrossRef] [PubMed]
  5. Smalle, J.; Vierstra, R.D. The ubiquitin 26S proteasome proteolytic pathway. Annu. Rev. Plant Biol. 2004, 55, 555–590. [Google Scholar] [CrossRef]
  6. McClellan, A.J.; Tam, S.; Kaganovich, D.; Frydman, J. Protein quality control: Chaperones culling corrupt conformations. Nat. Cell Biol. 2005, 7, 736–741. [Google Scholar] [CrossRef]
  7. Zhang, Z.; Li, J.; Liu, H.; Chong, K.; Xu, Y. Roles of ubiquitination-mediated protein degradation in plant responses to abiotic stresses. Environ. Exp. Bot. 2015, 114, 92–103. [Google Scholar] [CrossRef]
  8. Jansen, A.H.; Reits, E.A.; Hol, E.M. The ubiquitin proteasome system in glia and its role in neurodegenerative diseases. Front. Mol. Neurosci. 2014, 7, 73. [Google Scholar] [CrossRef]
  9. Santner, A.; Estelle, M. The ubiquitin-proteasome system regulates plant hormone signaling. Plant J. 2010, 61, 1029–1040. [Google Scholar] [CrossRef]
  10. Song, J.; Mo, X.; Yang, H.; Yue, L.; Song, J.; Mo, B. The U-box family genes in Medicago truncatula: Key elements in response to salt, cold, and drought stresses. PLoS ONE 2017, 12, e0182402. [Google Scholar] [CrossRef]
  11. Azevedo, C.; Santos-Rosa, M.J.; Shirasu, K. The U-box protein family in plants. Trends Plant Sci. 2001, 6, 354–358. [Google Scholar] [CrossRef] [PubMed]
  12. Wiborg, J.; O’Shea, C.; Skriver, K. Biochemical function of typical and variant Arabidopsis thaliana U-box E3 ubiquitin-protein ligases. Biochem. J. 2008, 413, 447–457. [Google Scholar] [CrossRef] [PubMed]
  13. Zeng, L.-R.; Park, C.H.; Venu, R.C.; Gough, J.; Wang, G.-L. Classification, Expression Pattern, and E3 Ligase Activity Assay of Rice U-Box-Containing Proteins. Mol. Plant 2008, 1, 800–815. [Google Scholar] [CrossRef]
  14. Sharma, B.; Taganna, J. Genome-wide analysis of the U-box E3 ubiquitin ligase enzyme gene family in tomato. Sci. Rep. 2020, 10, 9581. [Google Scholar] [CrossRef]
  15. Lu, X.; Shu, N.; Wang, D.; Wang, J.; Chen, X.; Zhang, B.; Wang, S.; Guo, L.; Chen, C.; Ye, W. Genome-wide identification and expression analysis of PUB genes in cotton. BMC Genom. 2020, 21, 213. [Google Scholar] [CrossRef] [PubMed]
  16. Hu, H.; Dong, C.; Sun, D.; Hu, Y.; Xie, J. Genome-Wide Identification and Analysis of U-Box E3 Ubiquitin-Protein Ligase Gene Family in Banana. Int. J. Mol. Sci. 2018, 19, 3874. [Google Scholar] [CrossRef]
  17. Wang, C.; Duan, W.; Riquicho, A.R.; Jing, Z.; Liu, T.; Hou, X.; Li, Y. Genome-wide survey and expression analysis of the PUB family in Chinese cabbage (Brassica rapa ssp. pekinesis). Mol. Genet. Genom. 2015, 290, 2241–2260. [Google Scholar] [CrossRef]
  18. Seo, D.H.; Ryu, M.Y.; Jammes, F.; Hwang, J.H.; Turek, M.; Kang, B.G.; Kwak, J.M.; Kim, W.T. Roles of Four Arabidopsis U-Box E3 Ubiquitin Ligases in Negative Regulation of Abscisic Acid-Mediated Drought Stress Responses. Plant Physiol. 2012, 160, 556–568. [Google Scholar] [CrossRef]
  19. Wang, J.; Qu, B.; Dou, S.; Li, L.; Yin, D.; Pang, Z.; Zhou, Z.; Tian, M.; Liu, G.; Xie, Q.; et al. The E3 ligase OsPUB15 interacts with the receptor-like kinase PID2 and regulates plant cell death and innate immunity. BMC Plant Biol. 2015, 15, 49. [Google Scholar] [CrossRef]
  20. Kaur, H.; Salvi, P.; Chaurasia, A.; Mondal, T.K. PUB63, a novel early heat responsive ubiquitin E3 ligase from rice implicates heat stress tolerance. Plant Stress 2023, 10, 100291. [Google Scholar] [CrossRef]
  21. Finn, R.D.; Clements, J.; Eddy, S.R. HMMER web server: Interactive sequence similarity searching. Nucleic Acids Res. 2011, 39, W29–W37. [Google Scholar] [CrossRef] [PubMed]
  22. Madden, T. The BLAST Sequence Analysis Tool. In The NCBI Handbook, 2nd ed.; National Center for Biotechnology Information (NCBI): Bethesda, MD, USA, 2013; Volume 2, pp. 425–436. [Google Scholar]
  23. Chen, C.; Chen, H.; Zhang, Y.; Thomas, H.R.; Frank, M.H.; He, Y.; Xia, R. TBtools: An integrative toolkit developed for interactive analyses of big biological data. Mol. Plant 2020, 13, 1194–1202. [Google Scholar] [CrossRef] [PubMed]
  24. Krzywinski, M.; Schein, J.; Birol, I.; Connors, J.; Gascoyne, R.; Horsman, D.; Jones, S.J.; Marra, M.A. Circos: An information aesthetic for comparative genomics. Genome Res. 2009, 19, 1639–1645. [Google Scholar] [CrossRef]
  25. Wang, D.; Zhang, Y.; Zhang, Z.; Zhu, J.; Yu, J. KaKs_Calculator 2.0: A toolkit incorporating gamma-series methods and sliding window strategies. Genom. Proteom. Bioinform. 2010, 8, 77–80. [Google Scholar] [CrossRef]
  26. Zhang, Z.; Xiao, J.; Wu, J.; Zhang, H.; Liu, G.; Wang, X.; Dai, L. ParaAT: A parallel tool for constructing multiple protein-coding DNA alignments. Biochem. Biophys. Res. Commun. 2012, 419, 779–781. [Google Scholar] [CrossRef] [PubMed]
  27. Harding, S.A.; Hu, H.; Nyamdari, B.; Xue, L.-J.; Naran, R.; Tsai, C.-J. Tubulins, rhythms and cell walls in poplar leaves: It’s all in the timing. Tree Physiol. 2018, 38, 397–408. [Google Scholar] [CrossRef]
  28. Xue, L.-J.; Frost, C.J.; Tsai, C.-J.; Harding, S.A. Drought response transcriptomes are altered in poplar with reduced tonoplast sucrose transporter expression. Sci. Rep. 2016, 6, 33655. [Google Scholar] [CrossRef]
  29. Liu, B.; Zhang, J.; Yang, Z.; Matsui, A.; Seki, M.; Li, S.; Yan, X.; Kohnen, M.V.; Gu, L.; Prasad, K. PtWOX11 acts as master regulator conducting the expression of key transcription factors to induce de novo shoot organogenesis in poplar. Plant Mol. Biol. 2018, 98, 389–406. [Google Scholar] [CrossRef]
  30. Shu, W.; Zhou, H.; Jiang, C.; Zhao, S.; Wang, L.; Li, Q.; Yang, Z.; Groover, A.; Lu, M.Z. The auxin receptor TIR 1 homolog (Pag FBL 1) regulates adventitious rooting through interactions with Aux/IAA 28 in Populus. Plant Biotechnol. J. 2019, 17, 338–349. [Google Scholar] [CrossRef]
  31. Yang, G.; Wang, S.; Long, L.; Yu, X.; Cai, H.; Chen, P.; Gu, L.; Yang, M. Genome-wide identification and expression analysis of PtJAZ gene family in poplar (Populus trichocarpa). BMC Genom. Data 2023, 24, 55. [Google Scholar] [CrossRef]
  32. Bolger, A.M.; Lohse, M.; Usadel, B. Trimmomatic: A flexible trimmer for Illumina sequence data. Bioinformatics 2014, 30, 2114–2120. [Google Scholar] [CrossRef] [PubMed]
  33. Kim, D.; Paggi, J.M.; Park, C.; Bennett, C.; Salzberg, S.L. Graph-based genome alignment and genotyping with HISAT2 and HISAT-genotype. Nat. Biotechnol. 2019, 37, 907–915. [Google Scholar] [CrossRef]
  34. Li, H.; Handsaker, B.; Wysoker, A.; Fennell, T.; Ruan, J.; Homer, N.; Marth, G.; Abecasis, G.; Durbin, R.; Subgroup, G.P.D.P. The sequence alignment/map format and SAMtools. Bioinformatics 2009, 25, 2078–2079. [Google Scholar] [CrossRef]
  35. Kolde, R. Package ‘pheatmap’. Available online: https://cran.r-project.org/web/packages/pheatmap/index.html (accessed on 22 April 2025).
  36. Bharath, P.; Gahir, S.; Raghavendra, A.S. Abscisic Acid-Induced Stomatal Closure: An Important Component of Plant Defense Against Abiotic and Biotic Stress. Front. Plant Sci. 2021, 12, 615114. [Google Scholar] [CrossRef] [PubMed]
  37. Yee, D.; Goring, D.R. The diversity of plant U-box E3 ubiquitin ligases: From upstream activators to downstream target substrates. J. Exp. Bot. 2009, 60, 1109–1121. [Google Scholar] [CrossRef]
  38. Zeng, L.-R.; Qu, S.; Bordeos, A.; Yang, C.; Baraoidan, M.; Yan, H.; Xie, Q.; Nahm, B.H.; Leung, H.; Wang, G.-L. Spotted leaf11, a Negative Regulator of Plant Cell Death and Defense, Encodes a U-Box/Armadillo Repeat Protein Endowed with E3 Ubiquitin Ligase Activity. Plant Cell 2004, 16, 2795–2808. [Google Scholar] [CrossRef] [PubMed]
  39. Yang, C.-W.; González-Lamothe, R.; Ewan, R.A.; Rowland, O.; Yoshioka, H.; Shenton, M.; Ye, H.; O’Donnell, E.; Jones, J.D.G.; Sadanandom, A. The E3 Ubiquitin Ligase Activity of Arabidopsis PLANT U-BOX17 and Its Functional Tobacco Homolog ACRE276 Are Required for Cell Death and Defense. Plant Cell 2006, 18, 1084–1098. [Google Scholar] [CrossRef]
  40. Orosa, B.; He, Q.; Mesmar, J.; Gilroy, E.M.; McLellan, H.; Yang, C.; Craig, A.; Bailey, M.; Zhang, C.; Moore, J.D.; et al. BTB-BACK Domain Protein POB1 Suppresses Immune Cell Death by Targeting Ubiquitin E3 ligase PUB17 for Degradation. PLoS Genet. 2017, 13, e1006540. [Google Scholar] [CrossRef]
  41. Shu, K.; Yang, W. E3 Ubiquitin Ligases: Ubiquitous Actors in Plant Development and Abiotic Stress Responses. Plant Cell Physiol. 2017, 58, 1461–1476. [Google Scholar] [CrossRef]
  42. Wang, C.; Song, B.; Dai, Y.; Zhang, S.; Huang, X. Genome-wide identification and functional analysis of U-box E3 ubiquitin ligases gene family related to drought stress response in Chinese white pear (Pyrus bretschneideri). BMC Plant Biol. 2021, 21, 235. [Google Scholar] [CrossRef]
  43. Cho, S.K.; Ryu, M.Y.; Song, C.; Kwak, J.M.; Kim, W.T. Arabidopsis PUB22 and PUB23 are homologous U-Box E3 ubiquitin ligases that play combinatory roles in response to drought stress. Plant Cell 2008, 20, 1899–1914. [Google Scholar] [CrossRef] [PubMed]
  44. Adler, G.; Konrad, Z.; Zamir, L.; Mishra, A.K.; Raveh, D.; Bar-Zvi, D. The Arabidopsis paralogs, PUB46 and PUB48, encoding U-box E3 ubiquitin ligases, are essential for plant response to drought stress. BMC Plant Biol. 2017, 17, 8. [Google Scholar] [CrossRef] [PubMed]
  45. Shi, T.; Zhang, X.; Hou, Y.; Jia, C.; Dan, X.; Zhang, Y.; Jiang, Y.; Lai, Q.; Feng, J.; Feng, J.; et al. The super-pangenome of Populus unveils genomic facets for its adaptation and diversification in widespread forest trees. Mol. Plant 2024, 17, 725–746. [Google Scholar] [CrossRef] [PubMed]
  46. Machado, T.B.; Picorelli, A.C.R.; Azevedo, B.L.d.; Aquino, I.L.M.d.; Queiroz, V.F.; Rodrigues, R.A.L.; Araújo, J.P.; Ullmann, L.S.; Santos, T.M.d.; Marques, R.E.; et al. Gene duplication as a major force driving the genome expansion in some giant viruses. J. Virol. 2023, 97, e01309–e01323. [Google Scholar] [CrossRef] [PubMed]
  47. Feng, C.-H.; Niu, M.-X.; Liu, X.; Bao, Y.; Liu, S.; Liu, M.; He, F.; Han, S.; Liu, C.; Wang, H.-L.; et al. Genome-Wide Analysis of the FBA Subfamily of the Poplar F-Box Gene Family and Its Role under Drought Stress. Int. J. Mol. Sci. 2023, 24, 4823. [Google Scholar] [CrossRef]
  48. Wang, Y.; Wu, Y.; Zhong, H.; Chen, S.; Wong, K.-B.; Xia, Y. Arabidopsis PUB2 and PUB4 connect signaling components of pattern-triggered immunity. New Phytol. 2022, 233, 2249–2265. [Google Scholar] [CrossRef]
Figure 1. Chromosomal distribution and syntenic relationships of PUB genes between the two subgenomes of P. alba (subgenome A) × P. tremula var. glandulosa (subgenome G). (a) Chromosomal locations of PUB genes in subgenome A. (b) Chromosomal locations of PUB genes in subgenome G (P. tremula var. glandulosa). Each gene is labeled on the chromosome, and their relative positions are shown. (c) Syntenic relationships of PUB genes between subgenome A and subgenome G. Red lines represent syntenic gene pairs of the PUB gene family; grey lines represent syntenic gene pairs at the whole-genome level.
Forests 16 00749 g001
Figure 2. Phylogenetic analysis of the PUB gene family. A phylogenetic tree of PUB proteins from three plant species—poplar (152 members), tomato (62 members), and Arabidopsis (61 members)—was generated using the Neighbor-Joining (NJ) algorithm implemented in MEGA-X software (v10.2.2), with 1000 bootstrap replications. In the tree, red stars, green circles, and blue rectangles indicate PUB proteins from poplar, tomato and Arabidopsis, respectively. A total of 152 PUB proteins from the three species were classified into five distinct clades, designated as Groups I–Groups V.
Forests 16 00749 g002
Figure 3. Phylogenetic relationships, conserved motifs, domains, and gene structures of PUB proteins in poplar. (a) A Neighbor-Joining (NJ) phylogenetic tree constructed based on the full-length protein sequences of PUB genes in poplar. The bootstrap value was set to 1000. (b) Conserved motif analysis of PUB proteins, where 20 distinct motifs were identified using the MEME online tool. Each motif is represented by a differently colored box. (c) Conserved domain prediction of PUB proteins using the CDD tool on the NCBI website. Domains with different functions are indicated in various colors. (d) Exon–intron structures of PUB genes visualized based on genome annotation. Yellow boxes represent untranslated regions (UTRs), green boxes indicate coding sequences (CDSs).
Forests 16 00749 g003
Figure 4. Cis-acting element analysis in the promoter regions of 152 PUB genes in poplar. (a) Distribution of 18 types of cis-acting elements within the 2000 bp upstream promoter regions of 152 PagPUB genes. Different colored triangles represent different types of cis-acting elements. A Neighbor–Joining (NJ) phylogenetic tree of 152 PUB genes in poplar was constructed using Mega-X with 1000 bootstraps. (b) Quantitative analysis of the 18 cis-acting elements in each PagPUB gene promoter. The heatmap displays the number of each cis-element type in the promoter of each gene, with the color scale representing the abundance. The 18 cis-elements include: auxin-responsive elements, cis-acting elements involved in defense and stress responsiveness, cis-acting elements involved in gibberellin-responsiveness, light responsive cis-acting elements involved in low-temperature responsiveness, cis-acting elements involved in phytochrome down-regulation expression, cis-acting element involved in salicylic acid responsiveness, cis-acting element involved in the abscisic acid responsiveness, cis-acting regulatory elements that are essential for the anaerobic induction, cis-acting regulatory elements involved in circadian control, cis-acting regulatory elements involved in seed-specific regulation, cis-acting regulatory elements involved in the MeJA-responsiveness, cis-acting regulatory elements involved in zein metabolism regulation, cis-acting regulatory elements related to meristem expression, gibberellin-responsive elements, an MYB binding site involved in drought-inducibility, an MYB binding site involved in flavonoid biosynthetic genes regulation, and an MYB binding site involved in light responsiveness.
Forests 16 00749 g004
Figure 5. Genomic distribution, collinearity, and selection pressure analysis of PUB genes in subgenomes A and G. (a) Heatmap showing the classification of duplicated gene types among PUB gene pairs in subgenome A and subgenome G, including five duplication events: whole-genome duplication, tandem duplication, proximal duplication, transposed duplication, and dispersed duplication. The presence or absence of each duplication type for a given gene is encoded in binary form, where red (value = 1) indicates the presence of the duplication event and blue (value = 0) indicates its absence. (b,c) Circos plots showing the chromosomal locations and collinearity relationships of PUB genes in subgenome A (P. alba) (b) and subgenome G (P. tremula var. glandulosa) (c), respectively. Outer circle: chromosome labels; second circle: gene density; third circle: transposable element (TE) density; inner gray lines represent collinear gene pairs; red lines represent PUB collinear gene pairs; grey lines represent collinear gene pairs at the whole-genome level. (d,e) Distribution of Ka/Ks values for collinear PUB gene pairs in subgenome A and subgenome G, respectively. (f) Boxplot comparison of Ka/Ks ratios between subgenome A and subgenome G.
Forests 16 00749 g005
Figure 6. Expression profiles of PUB genes in different tissues of two poplar hybrids, P. alba × P. tremula var. glandulosa and P. tremula × P. alba. (a) Heatmap showing the expression patterns of PUB genes in four tissues (root, leaf, bark, and xylem) of P. alba × P. tremula var. glandulosa. (b) Heatmap showing the expression patterns of PUB genes in four tissues (shoot, root, leaf, and callus) of P. tremula × P. alba. Gene expression levels were measured as fragments per kilobase of exon per million (FPKM) values. Red and blue represent high and low expression levels, respectively. Genes from subgenome A and subgenome G are shown.
Forests 16 00749 g006
Figure 7. Expression profiles of PUB genes under pathogen treatment (A. alternata) in two poplar subgenomes. (a) Heatmap of PUB gene expression in subgenome A under pathogen treatment at different time points (two, three, and four days) compared to the control (water). (b) Heatmap of PUB gene expression in subgenome G under pathogen treatment at different time points (two, three, and four days) compared to the control (water). Gene expression levels were calculated as FPKM values. The color scale indicates relative expression levels, with red representing high expression and blue representing low expression.
Forests 16 00749 g007
Figure 8. Expression profiles of PUB genes under abiotic treatments. (a) Heatmap showing the expression levels of PUB genes in subgenome A under four abiotic treatments, including drought, salt, high temperature, and low temperature. (b) Heatmap showing the expression levels of PUB genes in subgenome G under four abiotic treatments. The color scale represents relative expression levels: red indicates high expression, and blue indicates low expression.
Forests 16 00749 g008
Table 1. Members of the PUB gene family in poplar.
Gene NameSequence IDChromosomeStartEndStrandNumber of Amino AcidMolecular WeightTheoretical pIInstability IndexAliphatic IndexGrand Average of HydropathicityPrediction of Subcellular Localization
PagPUB1Pop_A01G056850.T1chrA0123,796,66423,801,21673682,94474993−0.289nuclear
PagPUB2Pop_A01G056845.T1chrA0123,858,43923,863,158+66572,007638100−0.17plasma membrane
PagPUB3Pop_A01G054584.T1chrA0126,716,22026,717,443+40746,1239421110chloroplast
PagPUB4Pop_A01G054588.T1chrA0126,742,95426,744,20141546,5979511110cytoplasmic
PagPUB5Pop_A01G029509.T1chrA0148,026,05548,028,99876084,05974568−0.725nuclear
PagPUB6Pop_A02G032997.T1chrA021,345,2951,350,018+28732,75154887−0.549nuclear
PagPUB7Pop_A02G032998.T1chrA021,358,0381,361,55945651,113939103−0.227nuclear
PagPUB8Pop_A02G012420.T1chrA029,419,7919,426,2151008111,443549104−0.077nuclear
PagPUB9Pop_A02G012404.T1chrA029,601,5909,602,83441446,1478411100nuclear
PagPUB10Pop_A02G012262.T1chrA0210,765,43910,770,01874884,83354788−0.39nuclear
PagPUB11Pop_A02G012261.T1chrA0210,777,44910,782,710906101,39365580−0.479nuclear
PagPUB12Pop_A02G066389.T1chrA0213,769,39113,771,851+44748,5657501190cytoplasmic
PagPUB13Pop_A02G066388.T1chrA0213,777,48713,778,836+44948,9956391120cytoplasmic
PagPUB14Pop_A02G065553.T1chrA0217,254,38417,255,61941144,8496431150cytoplasmic
PagPUB15Pop_A02G004950.T1chrA0220,682,91120,687,5811063117,96794691−0.139nuclear
PagPUB16Pop_A02G005103.T1chrA0221,466,96521,469,799+65873,401641103−0.232nuclear
PagPUB17Pop_A02G026918.T1chrA0221,609,39521,612,784+82290,1165421100cytoplasmic
PagPUB18Pop_A03G034675.T1chrA03666,747671,647+1133126,73265486−0.478cytoplasmic
PagPUB19Pop_A04G002612.T1chrA042,232,6422,236,25464471,826738109−0.173cytoplasmic
PagPUB20Pop_A04G030625.T1chrA047,039,5127,040,945+41345,2537511090plasma membrane
PagPUB21Pop_A04G029277.T1chrA0413,405,29013,406,636+44850,282839102−0.076endoplasmic reticulum
PagPUB22Pop_A04G029140.T1chrA0415,105,01215,107,88071778,1017451030chloroplast
PagPUB23Pop_A04G018204.T1chrA0418,307,53518,309,39137240,876843103−0.049cytoplasmic
PagPUB24Pop_A05G057115.T1chrA05369,241373,59681789,843541104−0.074cytoplasmic
PagPUB25Pop_A05G002002.T1chrA051,220,2321,226,316+1506167,95664791−0.21chloroplast
PagPUB26Pop_A05G001867.T1chrA052,028,1052,033,06073681,596648100−0.091nuclear
PagPUB27Pop_A05G001837.T1chrA052,224,7622,228,38777785,53374592−0.238chloroplast
PagPUB28Pop_A05G056236.T1chrA054,986,9564,988,532+41144,9217451070cytoplasmic
PagPUB29Pop_A05G073436.T1chrA0510,280,71010,285,45884091,03864598−0.209peroxisome
PagPUB30Pop_A05G073075.T1chrA0512,431,80312,437,733+77186,52264694−0.206nuclear
PagPUB31Pop_A05G071680.T1chrA0517,332,96117,334,731+39043,718653106−0.051plasma membrane
PagPUB32Pop_A05G071756.T1chrA0517,795,46617,797,21841846,8247391070chloroplast
PagPUB33Pop_A06G062990.T1chrA06197,704199,882+44848,3038461170nuclear
PagPUB34Pop_A06G053578.T1chrA065,979,3735,980,602+40945,910947101−0.017cytoplasmic
PagPUB35Pop_A06G053579.T1chrA065,994,4565,995,697+41345,6278441100nuclear
PagPUB36Pop_A06G089340.T1chrA0615,661,45615,663,64667974,9829431060chloroplast
PagPUB37Pop_A07G006696.T1chrA072,652,1932,653,492+41446,3769401090cytoplasmic
PagPUB38Pop_A07G006636.T1chrA073,033,7463,034,92439243,429648106−0.02extracellular
PagPUB39Pop_A07G011859.T1chrA079,187,5319,191,73783991,06564896−0.241peroxisome
PagPUB40Pop_A07G022563.T1chrA0712,074,62312,082,041+81190,72764793−0.254nuclear
PagPUB41Pop_A07G022689.T1chrA0712,936,93212,939,679+62270,76775384−0.509cytoplasmic
PagPUB42Pop_A08G045991.T1chrA085,220,4435,224,27377585,44665591−0.269nuclear
PagPUB43Pop_A08G086524.T1chrA088,137,8248,139,155+44349,421840103−0.032mitochondrial
PagPUB44Pop_A08G064119.T1chrA088,882,6458,885,43964069,41094199−0.17plasma membrane
PagPUB45Pop_A08G063939.T1chrA0810,037,78910,042,0231017113,825651101−0.16nuclear
PagPUB46Pop_A08G057978.T1chrA0812,841,02812,843,09468875,652845107−0.007golgi apparatus
PagPUB47Pop_A08G002355.T1chrA0815,252,59315,255,576+62768,486639101−0.248chloroplast
PagPUB48Pop_A09G077078.T1chrA09300,369303,68364471,635833109−0.178cytoplasmic
PagPUB49Pop_A09G026705.T1chrA094,212,2054,215,293+41345,1547491090plasma membrane
PagPUB50Pop_A09G014477.T1chrA098,839,0178,845,29969278,00775586−0.359extracellular
PagPUB51Pop_A09G059535.T1chrA098,931,4568,935,612+66372,05063898−0.254endoplasmic reticulum
PagPUB52Pop_A09G083679.T1chrA0910,169,98910,171,236+41546,623951108−0.04cytoplasmic
PagPUB53Pop_A09G083546.T1chrA0910,179,00210,180,23441046,775947108−0.098cytoplasmic
PagPUB54Pop_A10G046735.T1chrA101,606,0191,608,98462868,816641102−0.198plasma membrane
PagPUB55Pop_A10G069610.T1chrA104,319,9974,322,063+68875,339843105−0.025extracellular
PagPUB56Pop_A10G069115.T1chrA107,414,5687,416,679+48755,59756595−0.307nuclear
PagPUB57Pop_A10G001694.T1chrA109,124,3339,127,627+64069,309940101−0.165plasma membrane
PagPUB58Pop_A10G048475.T1chrA109,911,8099,913,29244249,196839103−0.023mitochondrial
PagPUB59Pop_A10G047247.T1chrA1011,735,56011,739,6631016112,970641110−0.062chloroplast
PagPUB60Pop_A10G047474.T1chrA1013,333,48213,337,243+77585,34455094−0.213nuclear
PagPUB61Pop_A11G056718.T1chrA1110,089,15310,091,82871778,2887451000chloroplast
PagPUB62Pop_A11G056786.T1chrA1113,612,91813,614,976+37440,8048421050cytoplasmic
PagPUB63Pop_A12G008014.T1chrA12131,338136,86181292,53164698−0.254nuclear
PagPUB64Pop_A12G019268.T1chrA125,023,1525,025,56868475,2028451030nuclear
PagPUB65Pop_A12G073757.T1chrA129,494,9829,496,30143949,36074899−0.097chloroplast
PagPUB66Pop_A12G081617.T1chrA1211,425,99811,431,2521004111,587644109−0.001chloroplast
PagPUB67Pop_A13G009822.T1chrA1310,404,57410,407,28244549,296640109−0.113cytoplasmic
PagPUB68Pop_A14G044946.T1chrA1411,867,88811,874,382+1010111,633549106−0.072nuclear
PagPUB69Pop_A14G044935.T1chrA1411,920,29111,921,52941245,8247441040cytoplasmic
PagPUB70Pop_A14G044906.T1chrA1418,148,87418,150,922+44948,7976411150plasma membrane
PagPUB71Pop_A15G017145.T1chrA154,862,0484,864,48568475,3488471030chloroplast
PagPUB72Pop_A15G064381.T1chrA1510,751,34510,752,762+44049,341744101−0.069nuclear
PagPUB73Pop_A16G089936.T1chrA162,517,6002,520,01467974,4989421080chloroplast
PagPUB74Pop_A16G055207.T1chrA1610,259,89110,261,117+40846,0658491040cytoplasmic
PagPUB75Pop_A16G055218.T1chrA1610,265,33010,266,987+41245,7868421070nuclear
PagPUB76Pop_A17G075184.T1chrA171,624,6501,625,91842246,912843103−0.012plasma membrane
PagPUB77Pop_A18G018919.T1chrA185,064,2745,070,370+1077118,63064797−0.096nuclear
PagPUB78Pop_A19G052378.T1chrA1911,228,97311,231,55745050,015638103−0.221chloroplast
PagPUB79Pop_G01G020781.T1chrG0124,858,64724,863,19873683,00564992−0.29nuclear
PagPUB80Pop_G01G020787.T1chrG0124,917,61724,921,318+66571,97163699−0.165plasma membrane
PagPUB81Pop_G01G005854.T1chrG0127,761,54227,762,756+40445,7169411120chloroplast
PagPUB82Pop_G01G067834.T1chrG0127,774,72527,775,97241546,3649521110cytoplasmic
PagPUB83Pop_G01G075640.T1chrG0148,346,95948,349,80776084,38574470−0.715nuclear
PagPUB84Pop_G02G015781.T1chrG021,403,3851,407,298+28732,72955086−0.563nuclear
PagPUB85Pop_G02G015782.T1chrG021,415,4161,417,46345651,086940102−0.229cytoplasmic
PagPUB86Pop_G02G035213.T1chrG029,334,5679,340,3701008111,437649104−0.089nuclear
PagPUB87Pop_G02G035233.T1chrG029,561,8209,563,09442447,5357411080nuclear
PagPUB88Pop_G02G031066.T1chrG0210,740,80510,745,85674884,89154789−0.38nuclear
PagPUB89Pop_G02G031070.T1chrG0210,752,12910,758,095906101,44165579−0.491nuclear
PagPUB90Pop_G02G005632.T1chrG0213,967,11613,970,164+44748,5097501180cytoplasmic
PagPUB91Pop_G02G005633.T1chrG0213,975,35113,977,393+44948,9966391110cytoplasmic
PagPUB92Pop_G02G005270.T1chrG0217,688,83817,690,34841545,4437411140nuclear
PagPUB93Pop_G02G026854.T1chrG0220,130,67720,142,648+1197131,79574883−0.458chloroplast
PagPUB94Pop_G02G065058.T1chrG0221,231,43821,235,743946105,42584785−0.319nuclear
PagPUB95Pop_G02G065388.T1chrG0222,015,95022,018,762+65873,329640103−0.229nuclear
PagPUB96Pop_G02G065360.T1chrG0222,255,10322,259,863+81389,295542109−0.009cytoplasmic
PagPUB97Pop_G03G076286.T1chrG03692,443697,128+1110124,40765383−0.515nuclear
PagPUB98Pop_G04G059292.T1chrG042,808,8652,813,02464471,765739109−0.173cytoplasmic
PagPUB99Pop_G04G028210.T1chrG047,399,4007,400,641+41345,2677521110endoplasmic reticulum
PagPUB100Pop_G04G066587.T1chrG0413,701,18713,702,736+44850,317837103−0.078endoplasmic reticulum
PagPUB101Pop_G04G066506.T1chrG0415,411,43615,414,18871778,2158451020chloroplast
PagPUB102Pop_G04G023347.T1chrG0418,596,59518,597,71337240,846843103−0.042cytoplasmic
PagPUB103Pop_G05G008783.T1chrG05333,289342,2051216134,888641104−0.091nuclear
PagPUB104Pop_G05G057175.T1chrG051,236,4191,242,211+1414158,33864490−0.226chloroplast
PagPUB105Pop_G05G057312.T1chrG052,019,0382,023,27573781,675647100−0.093nuclear
PagPUB106Pop_G05G057347.T1chrG052,218,1072,223,36377885,63574593−0.235mitochondrial
PagPUB107Pop_G05G008350.T1chrG055,000,1165,001,814+45049,4558481050chloroplast
PagPUB108Pop_G05G085107.T1chrG0510,253,67110,263,64984091,09464498−0.22peroxisome
PagPUB109Pop_G06G035460.T1chrG06210,349211,902+44848,3309461170nuclear
PagPUB110Pop_G06G003288.T1chrG065,823,0575,824,286+40945,8528491030cytoplasmic
PagPUB111Pop_G06G003287.T1chrG065,842,7945,844,482+41345,5888441100cytoplasmic
PagPUB112Pop_G06G051597.T1chrG0615,896,00115,898,26467974,8619431060chloroplast
PagPUB113Pop_G07G061245.T1chrG072,390,4862,391,781+41446,4559411070cytoplasmic
PagPUB114Pop_G07G061189.T1chrG072,790,2892,792,32639743,978645104−0.038nuclear
PagPUB115Pop_G07G052040.T1chrG079,396,0159,399,92884091,07364896−0.23peroxisome
PagPUB116Pop_G07G062480.T1chrG0712,295,99612,300,385+78787,60664794−0.213nuclear
PagPUB117Pop_G07G062608.T1chrG0713,162,94413,165,676+61770,15175084−0.483cytoplasmic
PagPUB118Pop_G08G082443.T1chrG088,100,1348,104,73677585,40065391−0.257cytoplasmic
PagPUB119Pop_G08G046414.T1chrG0811,101,25111,102,877+44349,334839104−0.02mitochondrial
PagPUB120Pop_G08G058547.T1chrG0811,942,78411,945,49364069,89894599−0.201endoplasmic reticulum
PagPUB121Pop_G08G058369.T1chrG0813,137,61813,141,9971056117,98065299−0.183chloroplast
PagPUB122Pop_G08G063491.T1chrG0815,864,32815,866,39468875,670847107−0.001golgi apparatus
PagPUB123Pop_G08G058063.T1chrG0818,316,01418,318,995+65671,874639102−0.196plasma membrane
PagPUB124Pop_G09G011673.T1chrG09282,639285,95764471,655832108−0.186cytoplasmic
PagPUB125Pop_G09G077318.T1chrG094,280,9574,282,198+41345,1546481090plasma membrane
PagPUB126Pop_G09G014114.T1chrG098,901,7348,907,14783794,11175090−0.375nuclear
PagPUB127Pop_G09G014123.T1chrG098,954,6318,959,350+66371,90963998−0.232endoplasmic reticulum
PagPUB128Pop_G09G027806.T1chrG0910,117,97310,119,220+41546,785951108−0.062cytoplasmic
PagPUB129Pop_G09G027805.T1chrG0910,136,56510,137,79741046,721947106−0.121chloroplast
PagPUB130Pop_G10G007781.T1chrG1054,39457,62762868,785642102−0.201plasma membrane
PagPUB131Pop_G10G047951.T1chrG104,501,4684,503,534+68875,089842107−0.015golgi apparatus
PagPUB132Pop_G10G048131.T1chrG107,567,1317,571,788+1034116,154651100−0.148chloroplast
PagPUB133Pop_G10G048375.T1chrG109,217,9139,220,579+64069,239942101−0.152plasma membrane
PagPUB134Pop_G10G000218.T1chrG109,983,7969,985,12444249,164841104−0.011mitochondrial
PagPUB135Pop_G10G060717.T1chrG1011,889,86011,895,7571016112,857640109−0.057chloroplast
PagPUB136Pop_G10G020266.T1chrG1013,673,67713,678,664+78686,55555092−0.225nuclear
PagPUB137Pop_G12G084750.T1chrG12125,343130,854+81292,33264596−0.248nuclear
PagPUB138Pop_G12G068392.T1chrG124,872,9824,875,69072079,0509421030nuclear
PagPUB139Pop_G12G050752.T1chrG129,589,3249,590,64343949,36274797−0.126chloroplast
PagPUB140Pop_G12G011606.T1chrG1211,895,13311,898,9711004111,6246441090nuclear
PagPUB141Pop_G13G071258.T1chrG1310,457,64210,459,95744549,315638107−0.141cytoplasmic
PagPUB142Pop_G14G077975.T1chrG1410,667,09910,672,502+1006111,101649106−0.081nuclear
PagPUB143Pop_G14G077964.T1chrG1410,718,09010,719,32541145,6238461030cytoplasmic
PagPUB144Pop_G14G030545.T1chrG1417,003,55317,006,588+45048,9566411150endoplasmic reticulum
PagPUB145Pop_G15G048830.T1chrG155,528,1635,530,59968475,4798471030chloroplast
PagPUB146Pop_G15G074299.T1chrG1511,090,16711,091,489+44049,33864499−0.085chloroplast
PagPUB147Pop_G16G068843.T1chrG16757,514760,36576283,2669431070chloroplast
PagPUB148Pop_G16G057564.T1chrG168,502,9448,504,170+40846,1198471040cytoplasmic
PagPUB149Pop_G16G057553.T1chrG168,508,3108,509,821+41245,8188421070chloroplast
PagPUB150Pop_G17G033358.T1chrG172,438,6102,440,21744649,883844100−0.094plasma membrane
PagPUB151Pop_G18G080275.T1chrG185,834,9785,842,201+1340148,348648100−0.094endoplasmic reticulum
PagPUB152Pop_G19G009310.T1chrG1911,390,42411,393,40245050,018638103−0.232chloroplast
Disclaimer/Publisher’s Note: The statements, opinions and data contained in all publications are solely those of the individual author(s) and contributor(s) and not of MDPI and/or the editor(s). MDPI and/or the editor(s) disclaim responsibility for any injury to people or property resulting from any ideas, methods, instructions or products referred to in the content.

