Article

Biodiversity and Soil Jointly Drive Ecosystem Multifunctionality in Larch Forests

College of Forestry, Hebei Agricultural University, Baoding 071001, China
*
Author to whom correspondence should be addressed.
Forests 2025, 16(5), 745; https://doi.org/10.3390/f16050745 (registering DOI)
Submission received: 24 March 2025 / Revised: 15 April 2025 / Accepted: 24 April 2025 / Published: 26 April 2025
(This article belongs to the Section Forest Ecology and Management)

Abstract

:
Forests can simultaneously provide a variety of ecosystem functions and services (ecosystem multifunctionality, EMF). Different stand types, influenced by biotic and abiotic factors, play a key role in determining EMF. To clarify the impact of stand type, as well as biotic and abiotic factors, on EMF, this study quantified EMF across three stand types: Betula platyphylla pure forest (BP), B. platyphylla–Larix principis-rupprechtii mixed forest (BL), and L. principis-rupprechtii pure forest (LP). The multiple-threshold approach was employed to quantify EMF, while structural equation modeling was used to analyze the primary factors influencing EMF. The results indicated the following: (1) BL had higher stand productivity than both BP and LP; (2) BL exhibited significantly higher functional diversity and soil fertility maintenance compared to LP, with no significant difference between BP and BL; (3) BP demonstrated a significantly stronger nutrient cycling function than LP, with no significant difference between LP and BL; (4) the ranking of EMF at all threshold levels was BL > BP > LP; (5) soil was an effective driver of EMF across all threshold levels; and (6) both the niche complementarity effect and the mass ratio effect jointly drove EMF at the low threshold (<50%), with the influence of both effects diminishing as the threshold increased. This study enhances our understanding of the key drivers of EMF in forest ecosystems and provides valuable insights for informing multifunctional forest management practices.

1. Introduction

Ecosystem multifunctionality (EMF) refers to the ability of ecosystems to simultaneously provide a range of functions and services [1]. In forest ecosystems, this concept is referred to as forest multifunctionality [2], which encompasses regulating, provisioning, supporting, and cultural functions [3]. Timber production, a key objective of forest management [4], has led most research to focus on quantifying stand productivity (SP) [5]. The intricate interactions between various trophic levels, as well as between above- and belowground components, form the foundation for the realization of various ecosystem functions [6]. Plant functional diversity significantly influences these interactions among plants and other trophic levels [7], serving as a key driver across multi-trophic levels. Soil organic carbon (SOC) accumulation and nutrient recycling [8] are essential for supporting and regulating forest ecosystems. Compared to other ecosystems, there are fewer studies on EMF, especially in complex, dynamic systems like forests [9]. Historically, research has tended to focus on specific aspects of forest ecosystem functions. Therefore, a comprehensive evaluation of EMF, alongside an analysis of its influencing factors, is essential. Differences exist in the functions provided by different stand types [10]. For example, Tian et al. [8] revealed that mixed forests offer higher ecological functions and EMF compared to pure forests. Monoculture plantations are susceptible to both biotic and abiotic factors [11], whereas mixed forests exhibit higher biodiversity and SP [12], enabling them to provide more ecosystem functions and services than pure forests [13].
Biotic (biodiversity) and abiotic (topography, climate, soil, etc.) factors influence EMF [14]. Biodiversity includes aboveground components, such as species, structural, functional, and phylogenetic diversity [15], as well as belowground components like soil microbial diversity. It primarily affects EMF through two mechanisms: the niche complementarity effect and the mass ratio effect [16]. The former demonstrates that increased biodiversity leads to greater functional diversity among tree species, improving resource use and space efficiency, thereby enhancing ecosystem functions [17]. In contrast, the mass ratio effect suggests that the trait of dominant species dictates the performance of the forest ecosystem [18]. For example, thicker trees have been shown to positively influence EMF [19]. Li et al. [20] identified the niche complementarity effect as a potential mechanism for EMF. However, Yue et al. [21] found that, in their study of biodiversity–EMF relationships in secondary forests in Northeast China, variations in multifunctionality were primarily influenced by the mass ratio effect.
Climate significantly influences tree growth, with mean annual temperature (MAT, °C) and mean annual precipitation (MAP, mm) in the growing season being key variables [22]. These factors impact ecosystem functioning both directly and indirectly. Directly, they accelerate the activity of consumers and decomposers; indirectly, they alter the community composition [23]. As confirmed by Wang et al. [24], a higher MAP was negatively correlated with EMF, while a higher MAT directly limited the EMF of Pinus yunnanensis secondary forests. Ecosystems with higher EMF levels are generally more resilient to environmental changes [25], whereas pure forests with a single tree species tend to be more susceptible to environmental change [26]. Changes in soil stoichiometric characteristics can influence the rates of various ecosystem functions. Changes in pH can cause soil acidification and inhibit the decomposition of organic carbon, affecting plant growth and ecosystem functions [23]. Different types of litter can improve soil quality, typically benefiting ecosystems [27]. Additionally, altitude and slope can influence forest diversity and function by altering soil physicochemical properties and microclimate conditions [28]. These findings suggest that EMF levels vary across stand types [1]. Therefore, studying changes in ecological function and EMF across forest types is crucial for optimizing EMF and ensuring sustainable forest management practices [29].
This study investigated three forest types: Betula platyphylla pure forest (BP), B. platyphylla–Larix principis-rupprechtii mixed forest (BL), and L. principis-rupprechtii pure forest (LP). The primary objectives were the following: (1) to analyze the relationships between forest productivity, functional diversity, nutrient cycling, soil fertility maintenance, and variations in EMF across these forest types; (2) to elucidate the roles of biotic and abiotic factors in EMF at different thresholds; and (3) to identify the main mechanism driving EMF. The following three hypotheses were tested: Hypothesis H1. Mixed forests exhibit higher productivity than pure forest; Hypothesis H2. Biodiversity and soil factors jointly determine forest EMF; and Hypothesis H3. The primary mechanism driving EMF is niche complementarity.

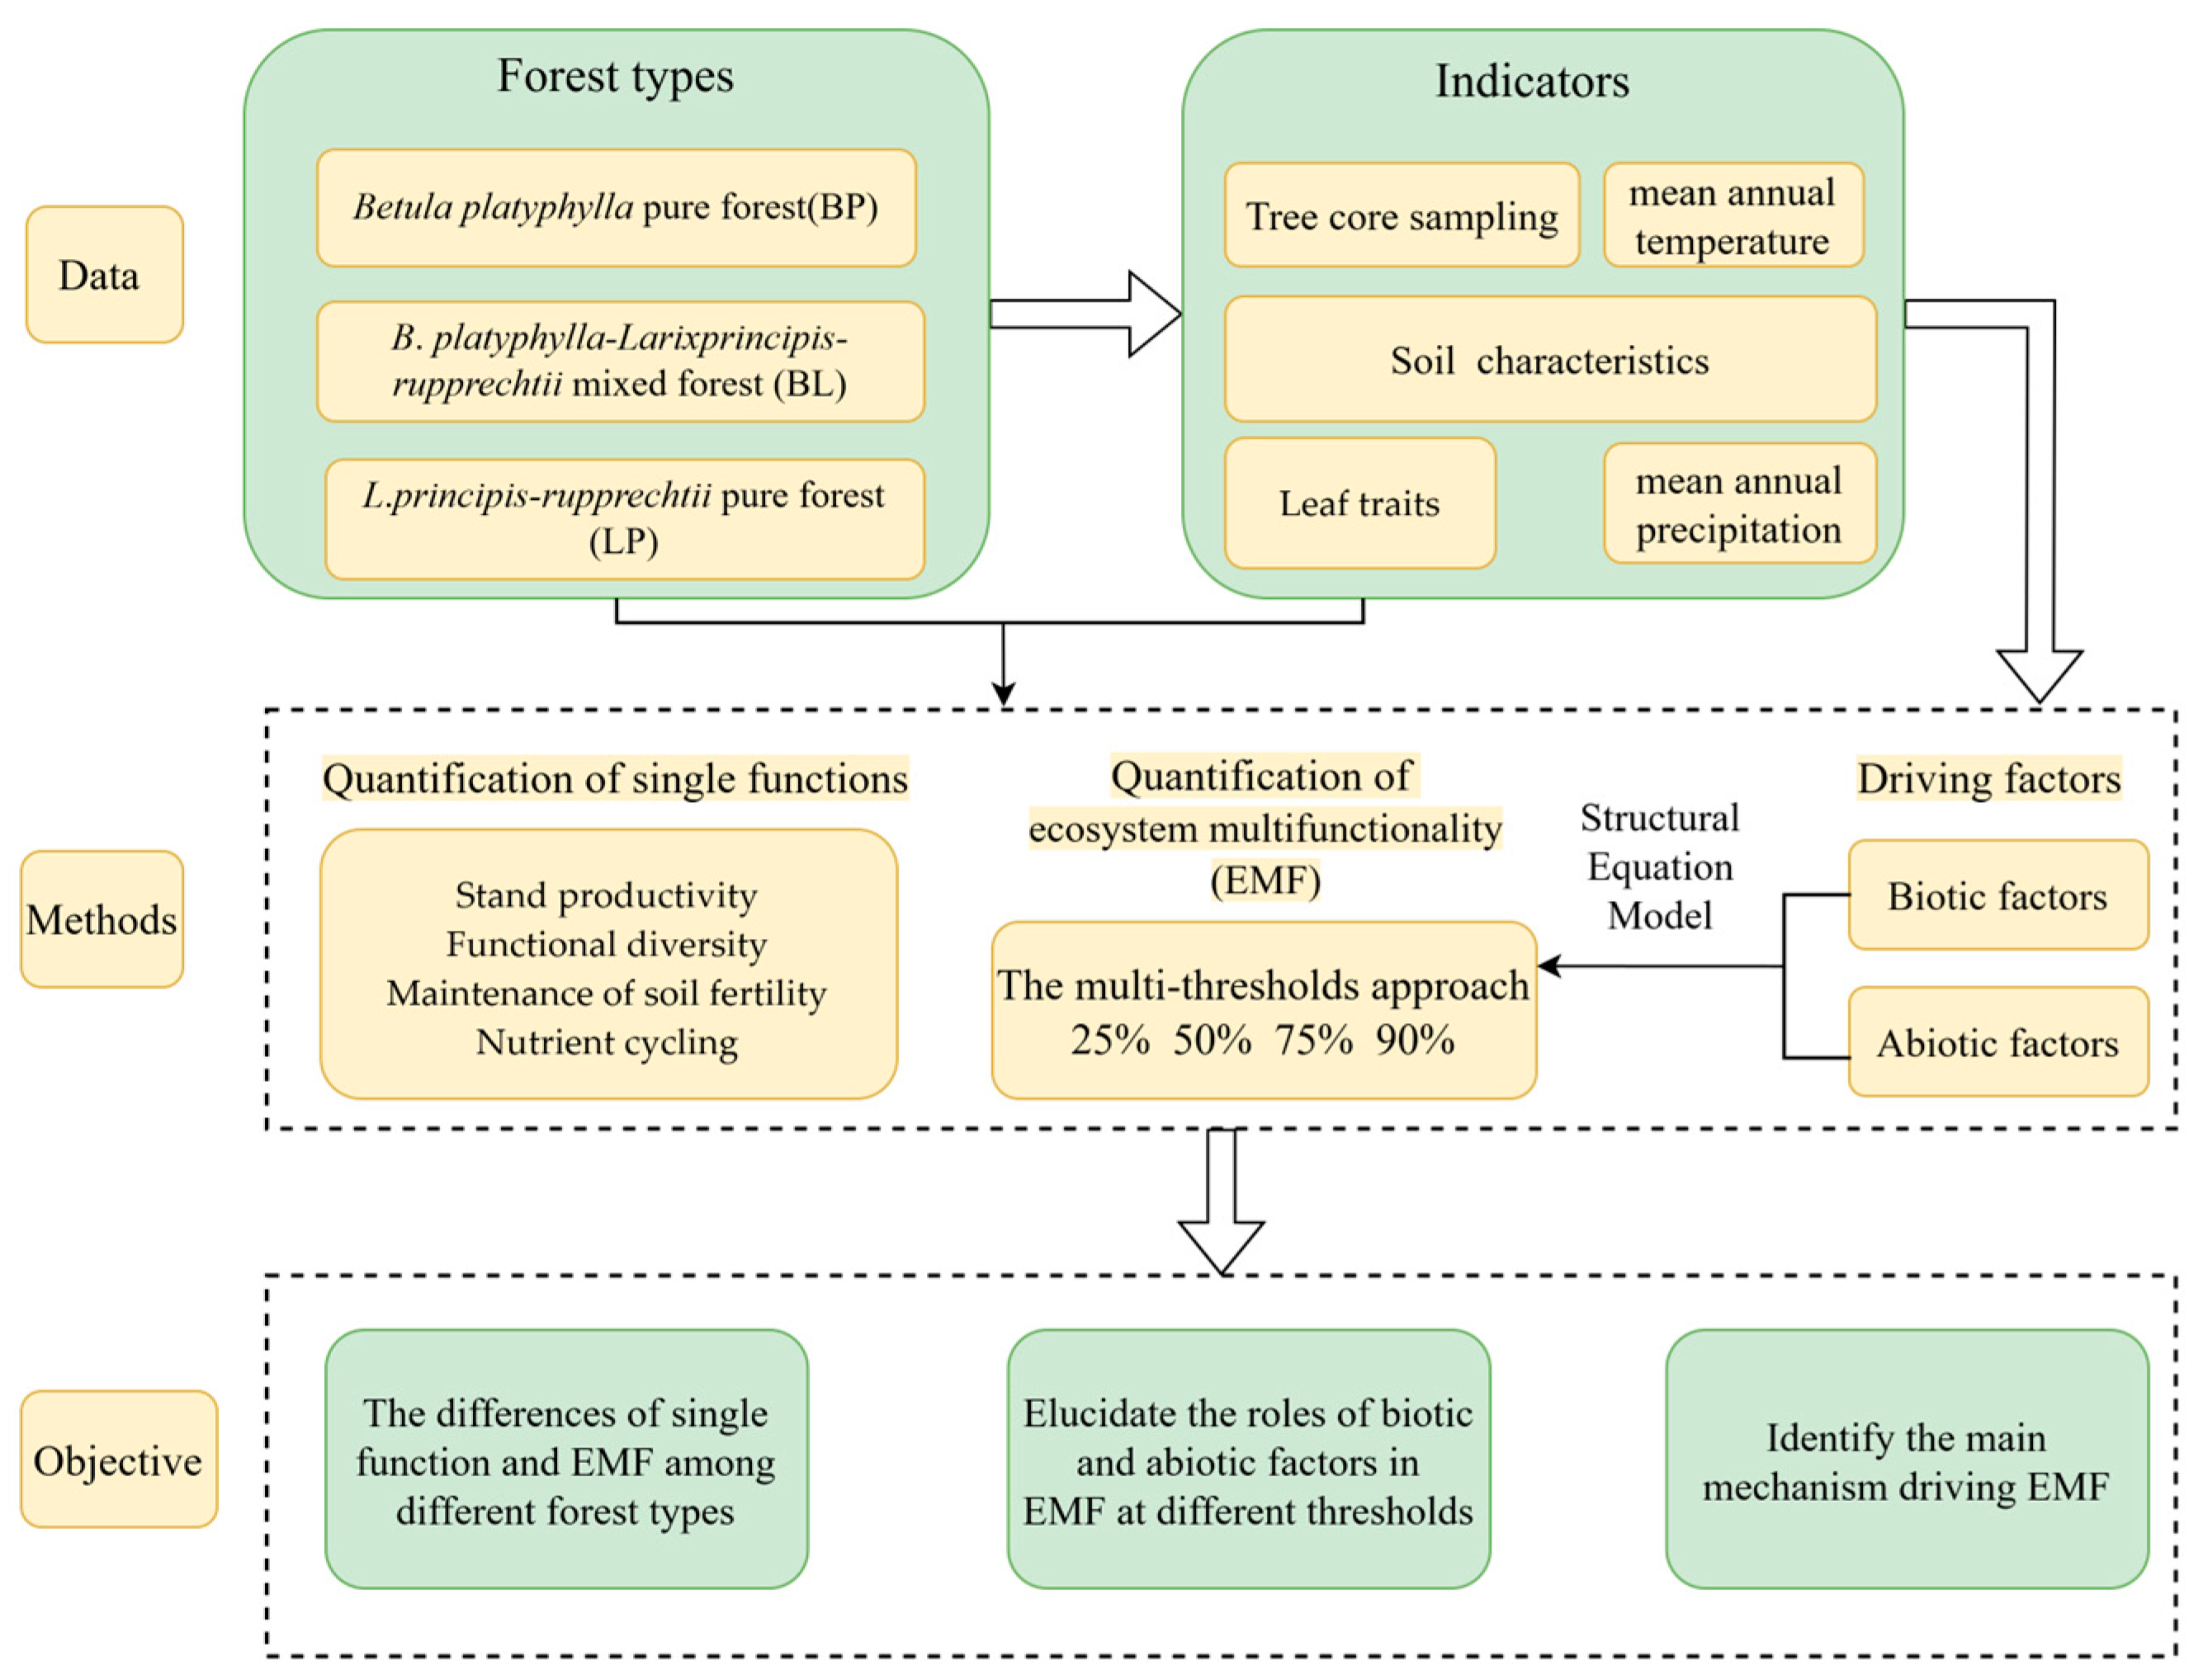
2. Materials and Methods

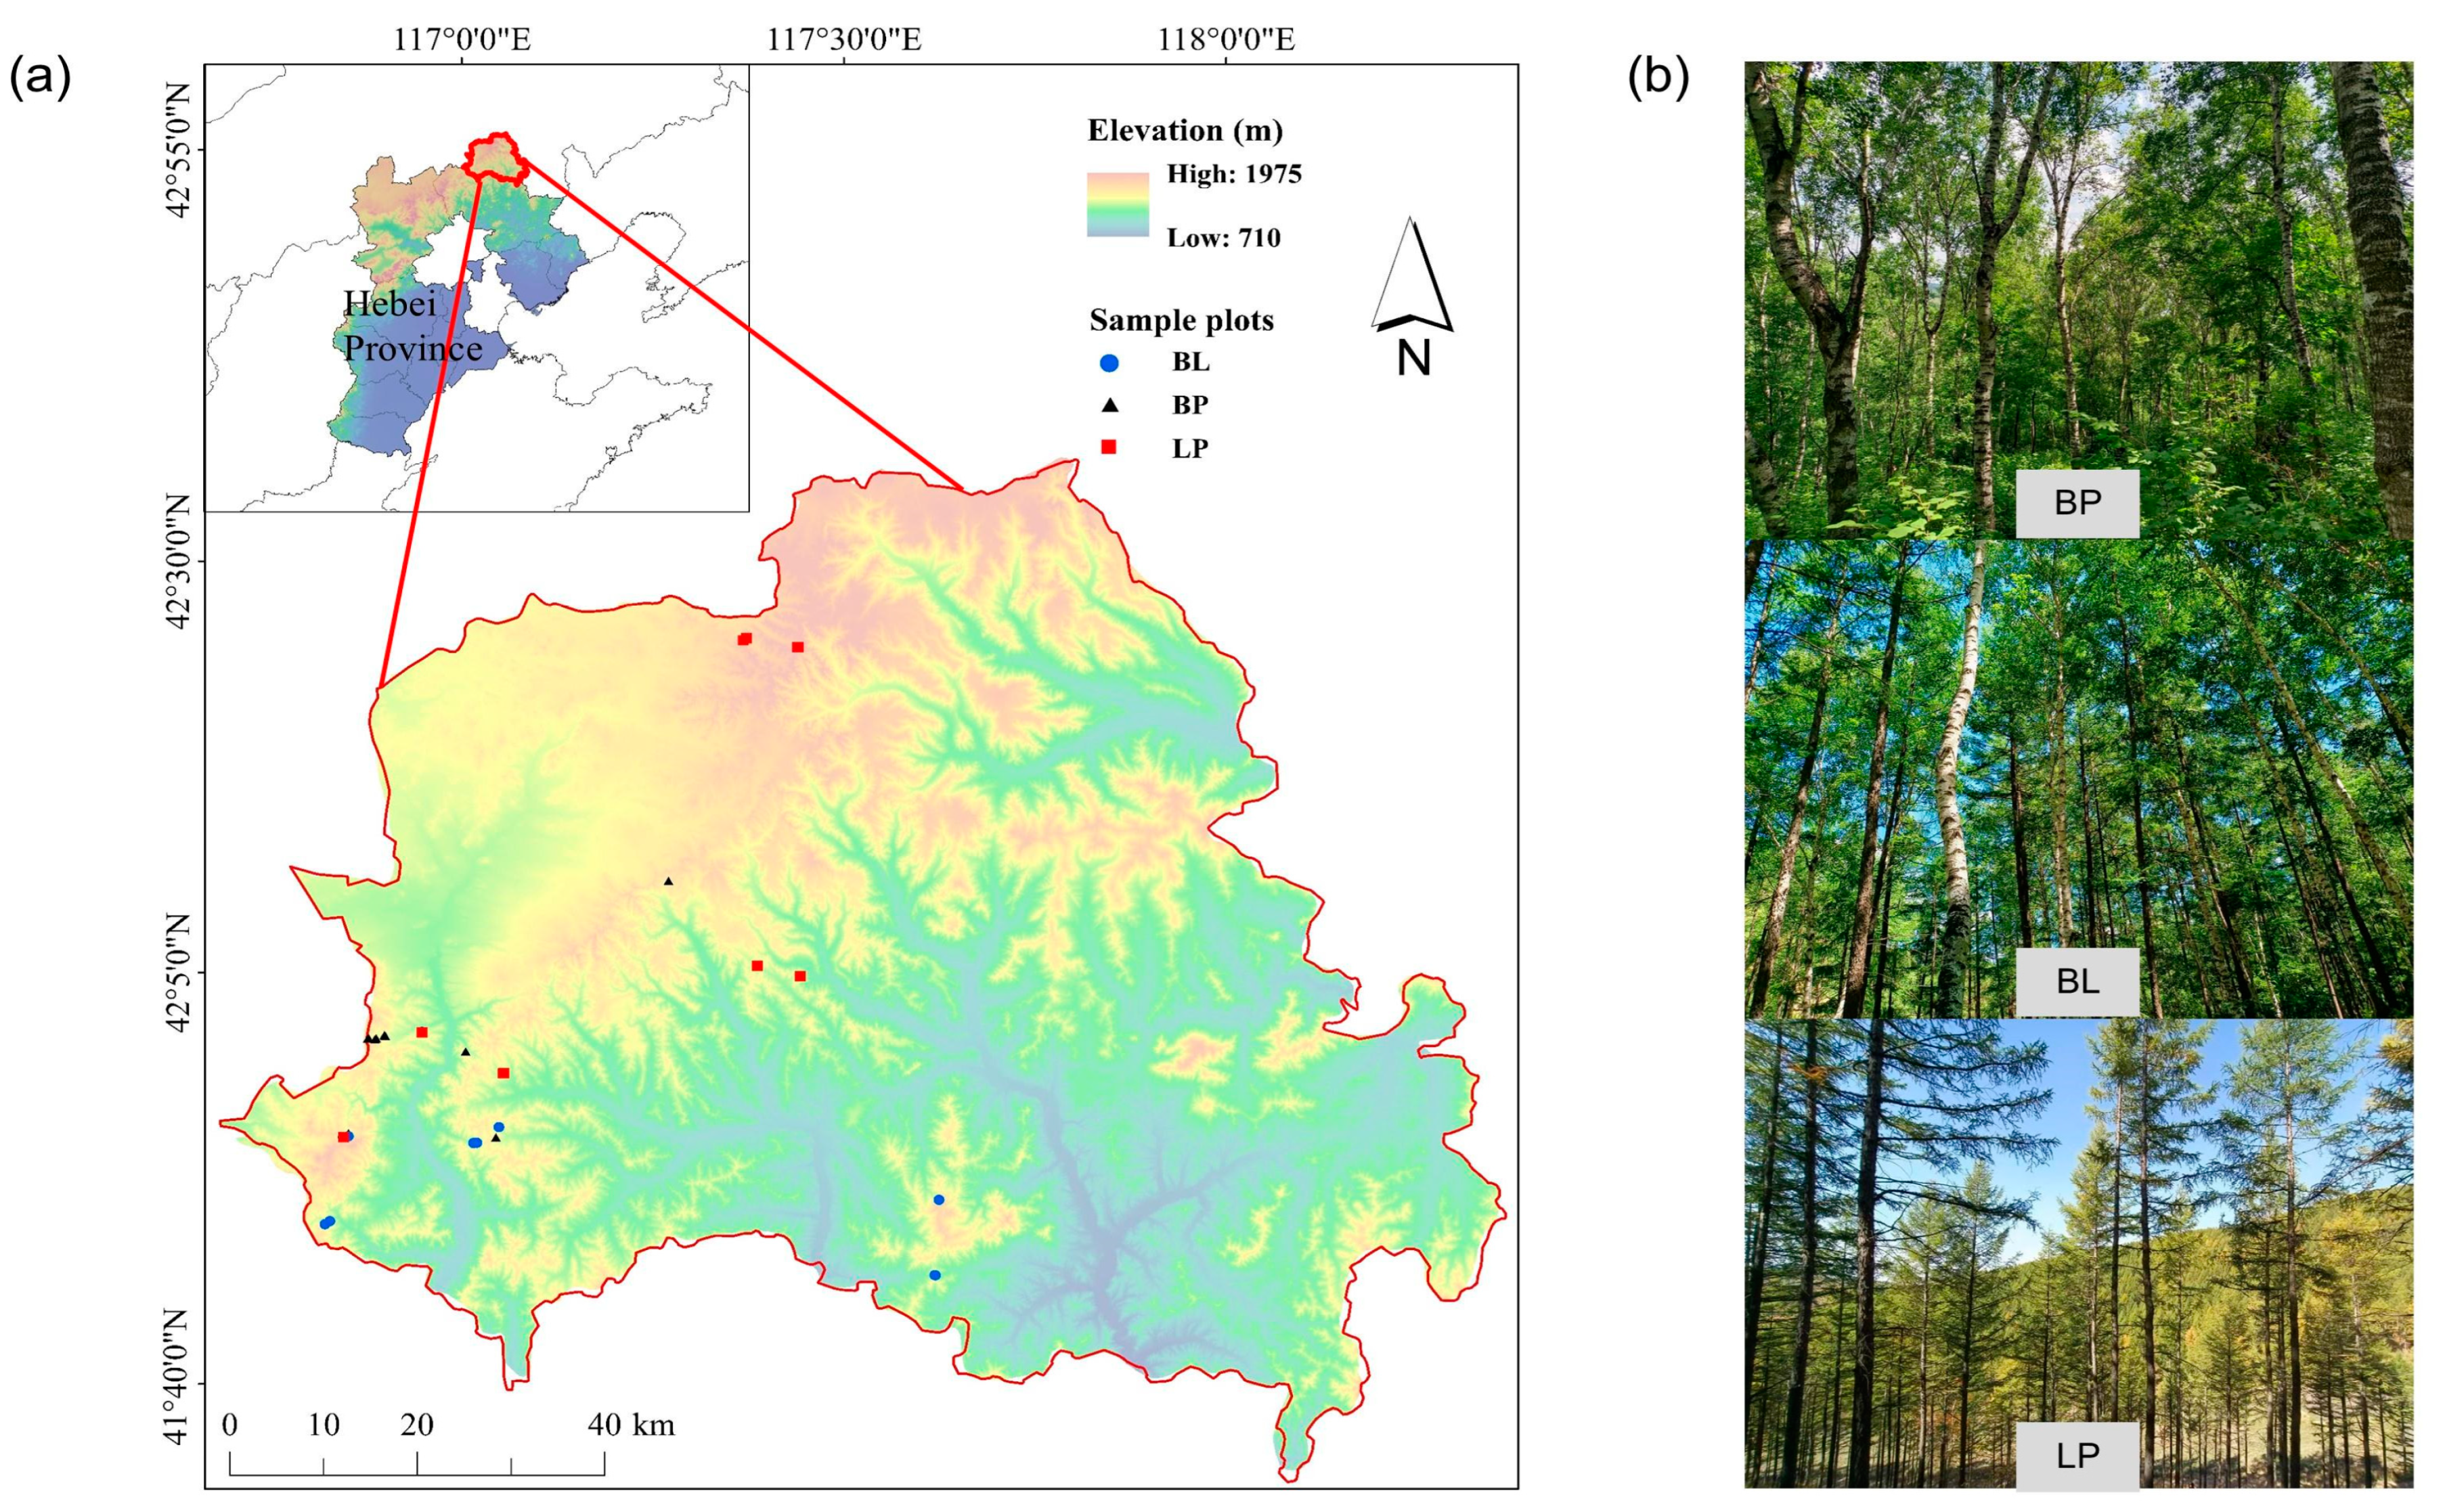
2.1. Study Area and Sample Plots

The research was conducted in the Mulan Forest Farm (41°35′~42°40′ N, 116°32′~118°14′ E) and the Saihanba Mechanical Forest Farm (42°22′~42°31′ N, 116°53′~117°31′ E), both located in Weichang County, Hebei Province, China [30]. The Mulan Forest Farm is characterized by hilly and mountainous terrain, with elevations ranging from 710 to 1975 m. This region experiences significant diurnal temperature fluctuation and is subject to a semi-arid to semi-humid continental monsoon climate [31]. The MAT is −1.4 °C, and the MAP ranges from 400 to 500 mm, predominantly occurring from June to August. The Saihanba Mechanical Forest Farm has elevations between 1010 and 1940 m. The MAT is −1.3 °C, and the MAP is 479 mm. The main soil types in the study area are gray forest soil and mountain brown soil (Figure 1). The humus layer in the LP is notably thicker due to the accumulation of pine needles. In contrast, the BP stand contains less undecomposed surface litter, and its soil exhibits a more favorable nutrient status (Table 1). Both forest farms have similar dominant tree species, including L. principis-rupprechtii, B. platyphylla, Acer pictum, and Quercus mongolica. LP exhibits indistinct vertical canopy stratification, while BP consists of sub-canopy and main canopy trees. In contrast, BL presents a more complex vertical canopy structure.
The forest farm in the study area was established in the 1960s. High-density artificial afforestation was initially implemented through sowing and seedling planting, with forest growth subsequently promoted by multiple thinning operations. However, the early-stage adoption of traditional forest management practices proved inadequate. Trees were harvested during the cutting season primarily for economic gain, which led to a decline in overall forest quality. To address this issue, several restoration measures have been introduced, including the replanting of dominant tree species and the development of mixed-species forests. The main management practices applied were near-nature management, which aimed to optimize stand structure. Specifically, from young stands to mature forests, various tending measures such as release cutting, multiple thinning operations, and artificial regeneration promotion techniques were implemented to facilitate the transformation of plantations into near-natural forests. The above measures have achieved good ecological benefits. According to the ninth national forest inventory, the study area is predominantly covered by L. principis-rupprechtii, which occupies 38,182 ha (51.1% of the total forest area), followed by B. platyphylla, covering 16,039 ha (21.4%). The unit volume of L. principis-rupprechtii is the highest, at 172 m3/ha, followed by B. platyphylla at 124 m3/ha.
From July to September 2023, a total of 36 plots were investigated using a stratified random sampling approach (Figure 2). Each plot had similar site conditions. A total of 10 BP, 14 BL, and 12 LP plots were established, each covering an area of 30 m × 30 m. BP is natural secondary forest, LP is plantation forest, and BL is a mixed forest formed by replanting larch in a degraded birch forest.
For each plot, trees with a diameter at breast height (DBH) exceeding 5 cm were measured. The recorded survey parameters involved trees species, DBH, tree height, crown width, and relative coordinates (X, Y). Table 2 shows the details of the sample plots.
The research scheme is shown in Figure 3.

2.2. Quantification of Single Functions

2.2.1. Stand Productivity

For tree core sampling, trees within each plot were categorized into 2 cm diameter classes. The number of trees cores to be collected from each plot was determined based on the diameter distribution [31]. Two cores were carefully extracted from each tree at breast height (1.3 m), one in the eastern and one in the northern direction, using growth cones and preserving the bark as intact as possible. In total, 840 core samples were collected. These samples were then dried, fixed, and polished. Cross-dating was performed [31], and the widths of the annual rings were measured with an accuracy of 0.001 mm using the WinDENDRO image analysis system 2022b (Regent Instruments Inc., Québec, QC, Canada) [32]. The annual ring width series was analyzed using COFECHA 3.0 software (The University of Arizona, Tucson, AZ, USA) [33].
Stand productivity (SP) characterizes a forest’s capacity to use energy and materials from the external environment, which is closely related to various forest functions [34]. Therefore, SP was selected as one of the main ecosystem functions for analysis in this study. Annual ring width growth was converted into basal area increments (BAI, cm2/year) using the following equation to quantify SP [35]:
B A I i = π R t 2 π R t T 2 T
BAIi is the average annual BAI of the ith sampled tree over a period of T years (cm2/year), T is the length of study period, and Rt and RtT are the tree’s radius at t years and tT years, respectively. To calculate the BAI, weighting is applied based on the trees’ diameter class, utilizing the ratio of DBHc to DBHss. DBHss refers to the average of the squared diameters within a specific diameter class, while DBHc is defined as the squared diameter of the central tree.

2.2.2. Functional Diversity

Leaves from each tree species were collected using pruning shears, and five indicators related to functional diversity were measured: leaf area (LA, cm2), specific leaf area (SLA, cm2/g), leaf dry matter content (LDMC, g/g), leaf nitrogen content (LNC, g/kg), and leaf phosphorus content (LPC, g/kg) [36]. From each sample tree, five mature, healthy, and undamaged leaves were selected [37]. The collected fresh leaves were promptly transported to the laboratory for analysis. Measurements of leaf traits were conducted following standardized protocols [38].
Functional traits are important indicators of how plants respond to environmental changes, as they are closely related to resource utilization and affect other ecosystem functions [39]. Functional diversity (FD), derived from these traits, plays a crucial role in ecosystem functioning. Communities with higher FD tend to have higher functional performance [40]. As a classical measure of FD, we analyze the following indicators:
Functional evenness (FEve): This index assesses the evenness of species distribution within functional space (Equations (2)–(4)) [41]. A higher FEve indicates more uniform resource utilization across species.
F E v e = i = 1 S 1 min P E W i 1 S 1 1 S 1 1 1 S 1
P E W i = E W i i = 1 S 1 E W i
E W i = d i s t i , j w i + w j
EWi is the evenness weight, dist (i, j) is the Euclidean distance between species i and j, wi is the relative abundance of species i, and PEwi refers to the partial weighted uniformity of the branch.
Functional richness (FRic): FRic reflects the niche that the community occupies and the extent of resource utilization [42]. A higher FRic indicates a greater resource utilization rate in the community. FRic is calculated using Equation (5):
F R i c = S F i c R c
SFic is the niche space occupied by species in community i, and Rc denotes the absolute range of trait c.
Functional dispersion (FDis): FDis calculates the greatest dispersion of functional abundance distribution within the community (Equations (6) and (7)). A higher FDis suggests greater trait disparity among species in the community [43].
F D i s = i = 1 S ( w i × d i s t i ) i = 1 S w i
c k = i = 1 S w i × x i , k i = 1 S w i
S is the total number of species in the plot, wi is the relative abundance of species i, disti is the distance from species i to the center of mass ck, and xi,k is the kth trait value of species i.
Rao’s quadratic entropy (RaoQ): RaoQ measures FD by a similarity matrix based on species functional attributes [44].
R a o Q = i = 1 S 1 i = i + 1 S d i j p i p j
S is species richness, dij is the overlap of the probability density function of two trait values, and pipj is calculated by multiplying the proportions of species i (pi) and j (pj).

2.2.3. Maintenance of Soil Fertility

Five soil collection points were set up at equal intervals along the diagonal of each sample plot. The surface litter was removed prior to excavating the soil profile. At a depth of 0–20 cm, soil samples were collected using a ring knife and aluminum box [45]. After thorough mixing, the dried samples were passed through a 20-mesh sieve for further analysis, including measurements of pH, SOC, total nitrogen (TN), total phosphorus (TP), total potassium (TK), available phosphorus (AP), available nitrogen (AN), and available potassium (AK). All soil traits were quantified following established methods [8,26]. These chemical properties were used for the calculation of soil fertility maintenance function (SF) and subsequent nutrient cycling function after measurement.
SOC is an essential element of the carbon pools in terrestrial ecosystems. It is mainly derived from the decomposition of litter [46], and the secretion and activity of plant roots [47]. SOC content can reflect soil fertility and quality. The weighted average of SOC at a depth of 0–20 cm was used as an indicator to quantify the fertility maintenance function of forest soil [28].

2.2.4. Nutrient Cycling

The capacity for nutrient cycling (NC) in forest ecosystems, defined as the movement, transformation, and utilization of nutrients, revolves around the cycling processes between plants, litter, and soil [48]. Plant leaves capture carbon through photosynthesis, absorb nutrients such as nitrogen and phosphorus from the soil via their roots, and return these nutrients to the soil through litter decomposition [49]. Consequently, the contents of LNC, LPC, AN, AP, TN, and TP were utilized as quantitative indicators of nutrient cycling in this study [39]. These indicators represent vital nutrients for plant growth and are involved in the nutrient cycling process both above and below ground in forest ecosystem [50].
N C = i = 1 n N i , k n
n is the number of plots selected for different forest types, and Ni,k is the kth nutrient index content of the ith plot.

2.3. Quantifying Ecosystem Multifunctionality

The single function approach, turnover approach, averaging approach, and threshold approach are widely utilized for quantifying EMF [1]. The single function approach is limited by its lack of qualitative information, whereas the turnover approach fails to offer a direct assessment of EMF [51]. The averaging approach tends to ignore the correlation between each index [52]. Therefore, this study adopts the multi-thresholds approach for calculating EMF. Following preliminary analysis, eight representative indicators were identified: SP, CWM_SLA, CWM_LDMC, SOC, TN, AN, TP, AP, LNC, and LPC. These indicators are essential for driving forest function, productivity, and soil nutrient cycling [53].
The multi-thresholds approach is expressed as a percentage of the maximum observed function value, representing the number of functions that exceed a set threshold [54]. In order to avoid the bias caused by over-weight assignment of some categories [55], all selected indicators were first standardized [54]. Subsequently, cluster analysis was performed to determine the optimal number of clusters, which was found to be three categories (Supplementary Materials, Figure S1). Based on this, EMF values were calculated for the 25%, 50%, 75%, and 90% thresholds using the weighting method, namely, EMF_25, EMF_50, EMF_75, and EMF_90.
E M F = i = 1 n r i f i > t i
n is the number of ecosystem function indicators, fi is the measured value of the ith indicator in the plot, ri converts fi into a positive value, and ti is the thresholds.

2.4. Selection of Driving Factors of EMF

2.4.1. Biotic Factors

The standard deviation of basal area (Sdba) was used to represent stand structure properties [54]. Tree diversity (TD) was characterized by the overall weighted coefficient of variation (CVD) in DBH, maximum tree height (MH), and SLA [8]. The equations listed below were used for the calculations:
C V D = S D D Mean D × 100 %
C W M = i = 1 n B A i × T r a i t i
SDD and MeanD are the standard deviation and average value of DBH, respectively, and CWM refers to the community trait. The following are several metrics for species i: BAi is the relative basal area, Traiti is the trait value, and n is the number of species.

2.4.2. Abiotic Factors

The following factors were analyzed as representatives of the environment: soil nutrients (TN, TP, TK, AK, AN, and AP), pH, MAT, and MAP. The soil nutrients were first analyzed using principal component analysis (PCA) to obtain a set of nearly orthogonal variables [54], with the first principal component (SoilPC1) serving as the representative indicator (Supplementary Materials, Table S1). The contribution of climatic factors to tree growth is most significant during the growing season, which extends from June to August [56]. Consequently, we focused on the effects of MAT and MAP from June to August on EMF. MAT and MAP were estimated using Climate AP v3.10 [57], based on longitude, latitude, and elevation data.

2.5. Statistical Analysis

Before statistical analysis, all indicators were normalized to ensure data normality [54]. One-way ANOVA was conducted to evaluate differences in single functions and EMF among the three forest types [58]. The ‘FD’ package (v1.1.1) [59] was used to compute CWM, FEve, FDis, FRic, and RaoQ. The interactions between single functions and their driving factors were tested by Pearson’s correlation coefficient. The ‘vif’ function in the ‘car’ package (v2019) was used to compute the variance inflation factor (VIF) [60] to address multicollinearity among variables. All VIF values were below 5, indicating that multicollinearity was not present. Finally, the ‘piecewiseSEM’ package (v2016) was employed to investigate the factors of EMF and their interactions under thresholds of 25%, 50%, 75%, and 90% [61]. Fisher’s C, AIC, and p-value (p > 0.05) suggested that the model provided a good fit [1]. All statistical analyses were performed using R 4.4.0 [62].

3. Results

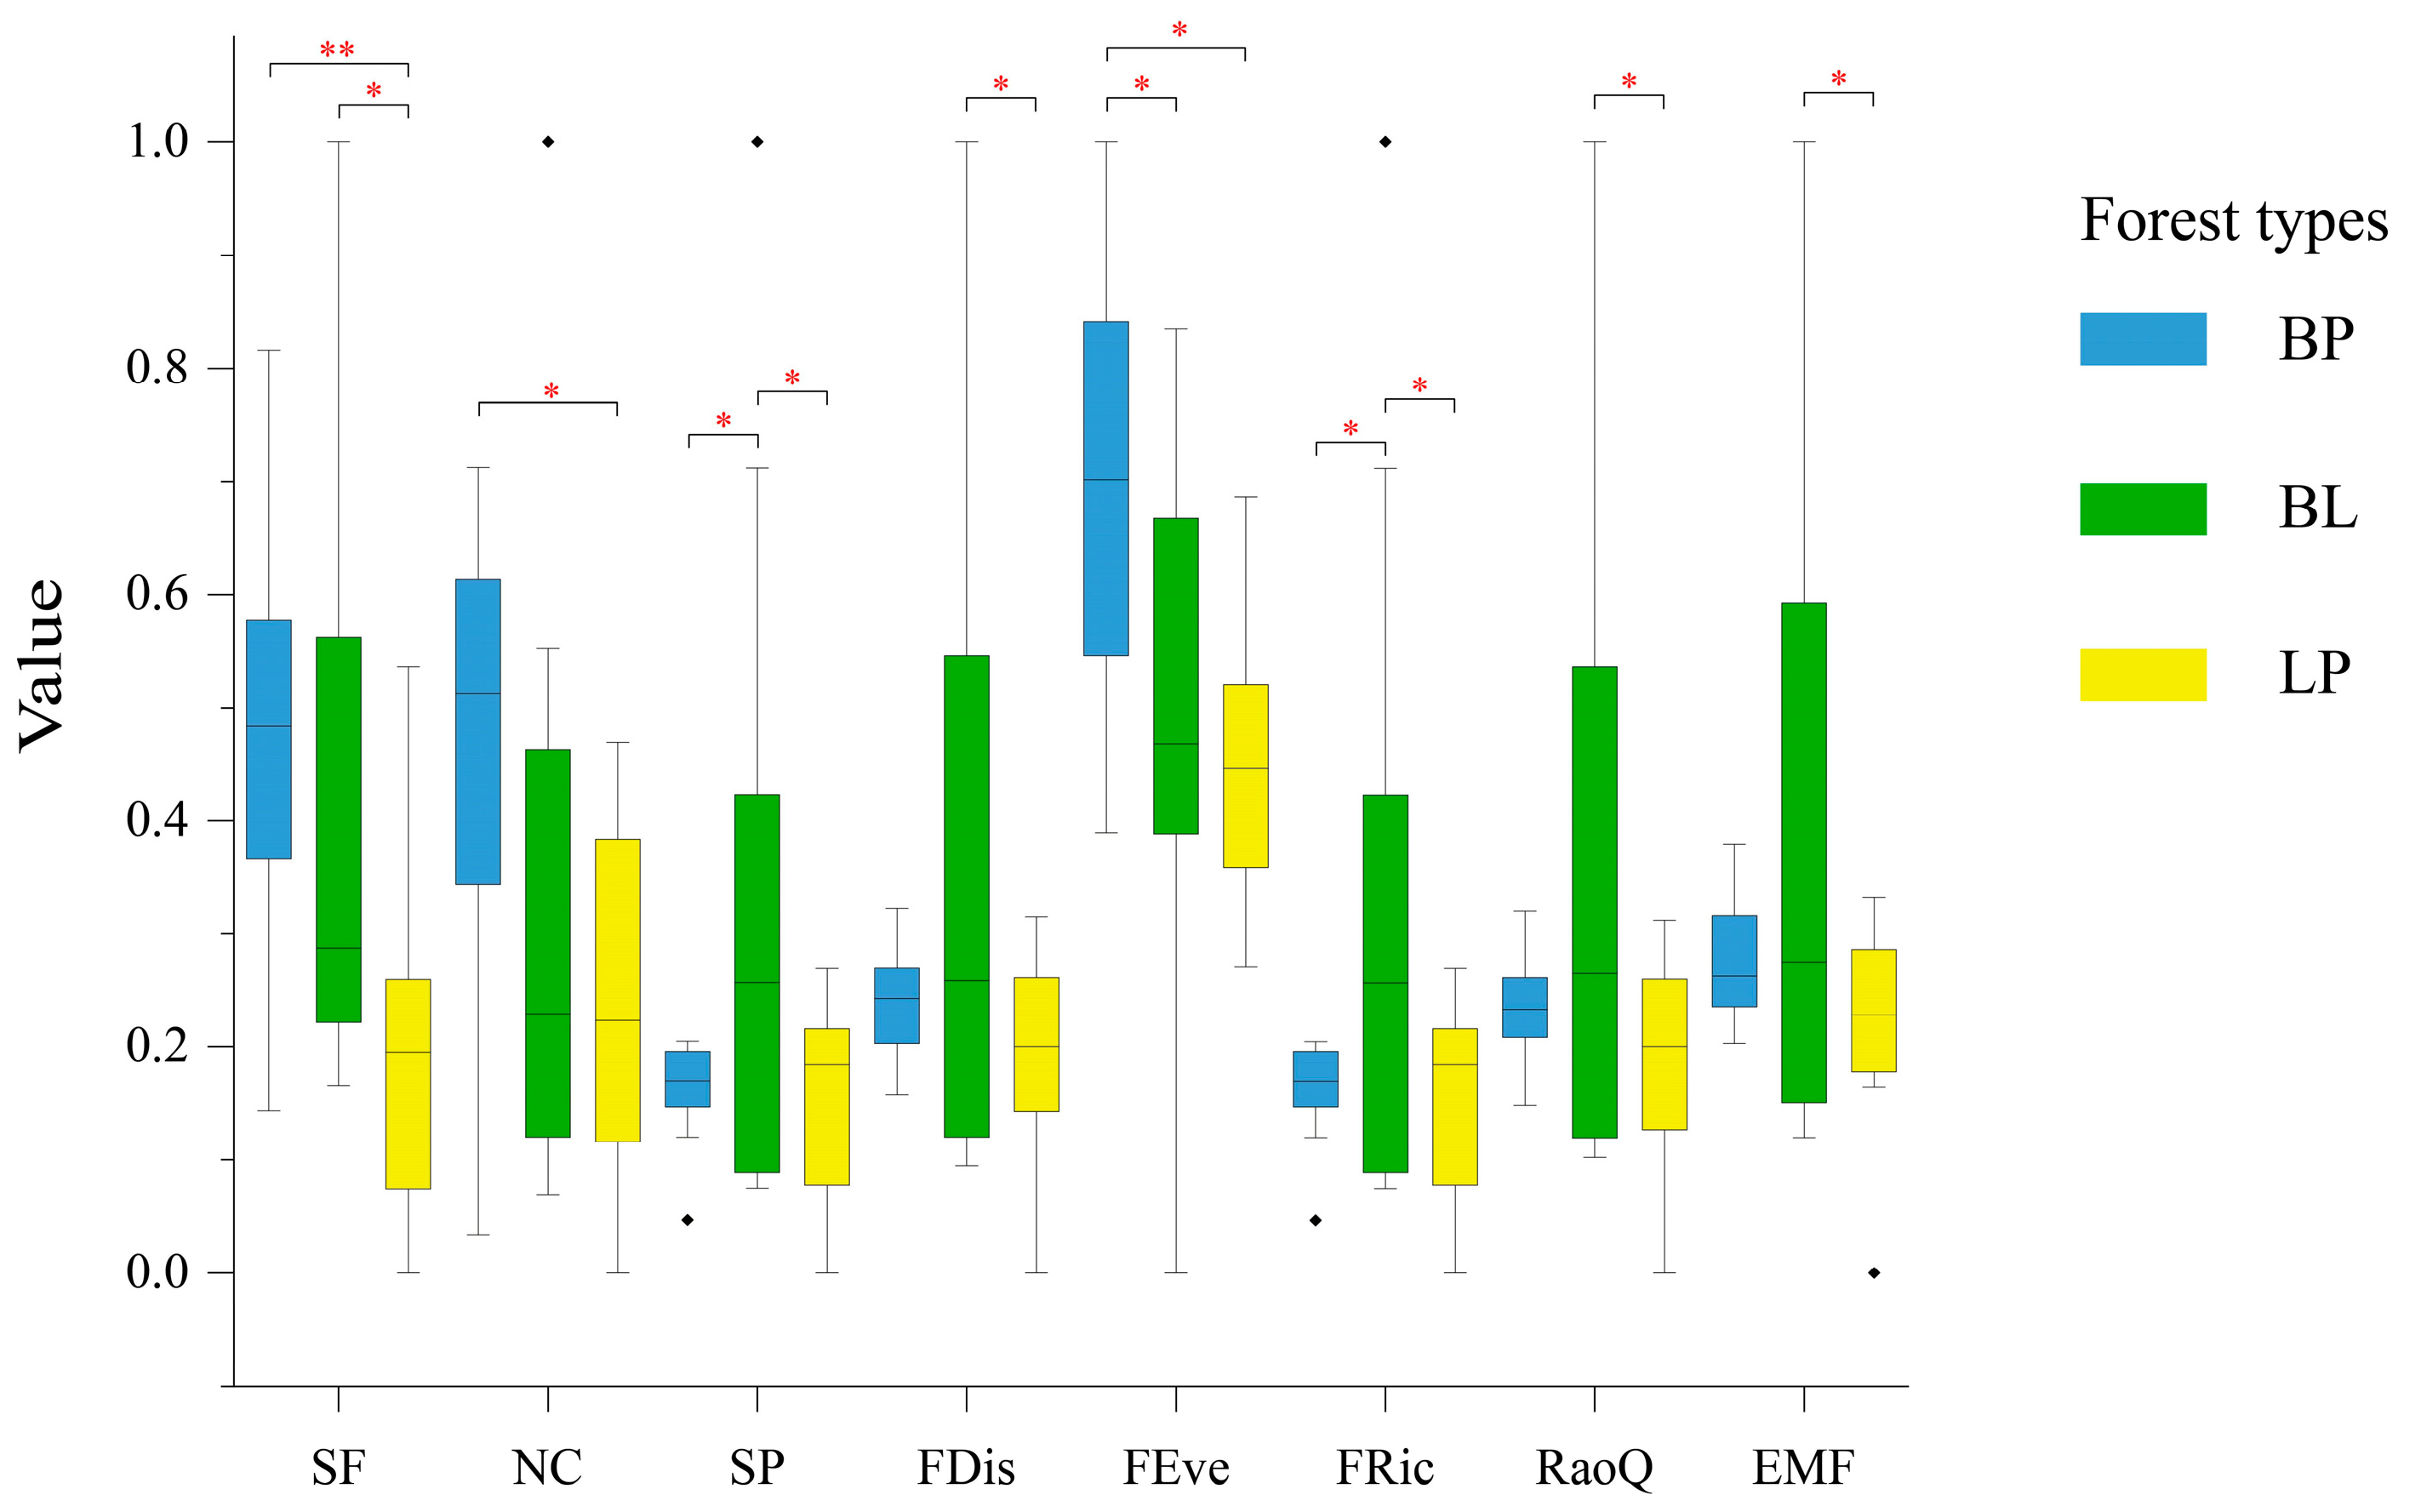
3.1. Comparisons of Single Function and EMF Across Forest Types

Compared to pure forests, mixed forests exhibited significant advantages in stand productivity (SP), functional dispersion (FDis), functional richness (FRic), and Rao’s quadratic entropy (RaoQ) (p < 0.05; Figure 4). Betula platyphylla pure forest (BP) was significantly higher than L. principis-rupprechtii pure forest (LP) in soil fertility maintenance (SF), nutrient cycling (NC), and functional evenness (FEve) (p < 0.05; Figure 4). The ecosystem multifunctionality (EMF) of mixed B. platyphylla–Larix principis-rupprechtii forest (BL) was the highest among the three forest types (Figure 4). As the thresholds increased, the number of functions declined. BL outperformed pure forests across all thresholds (Figure 5), especially at higher thresholds. This indicated that mixed forests offered greater benefits in maintaining EMF.

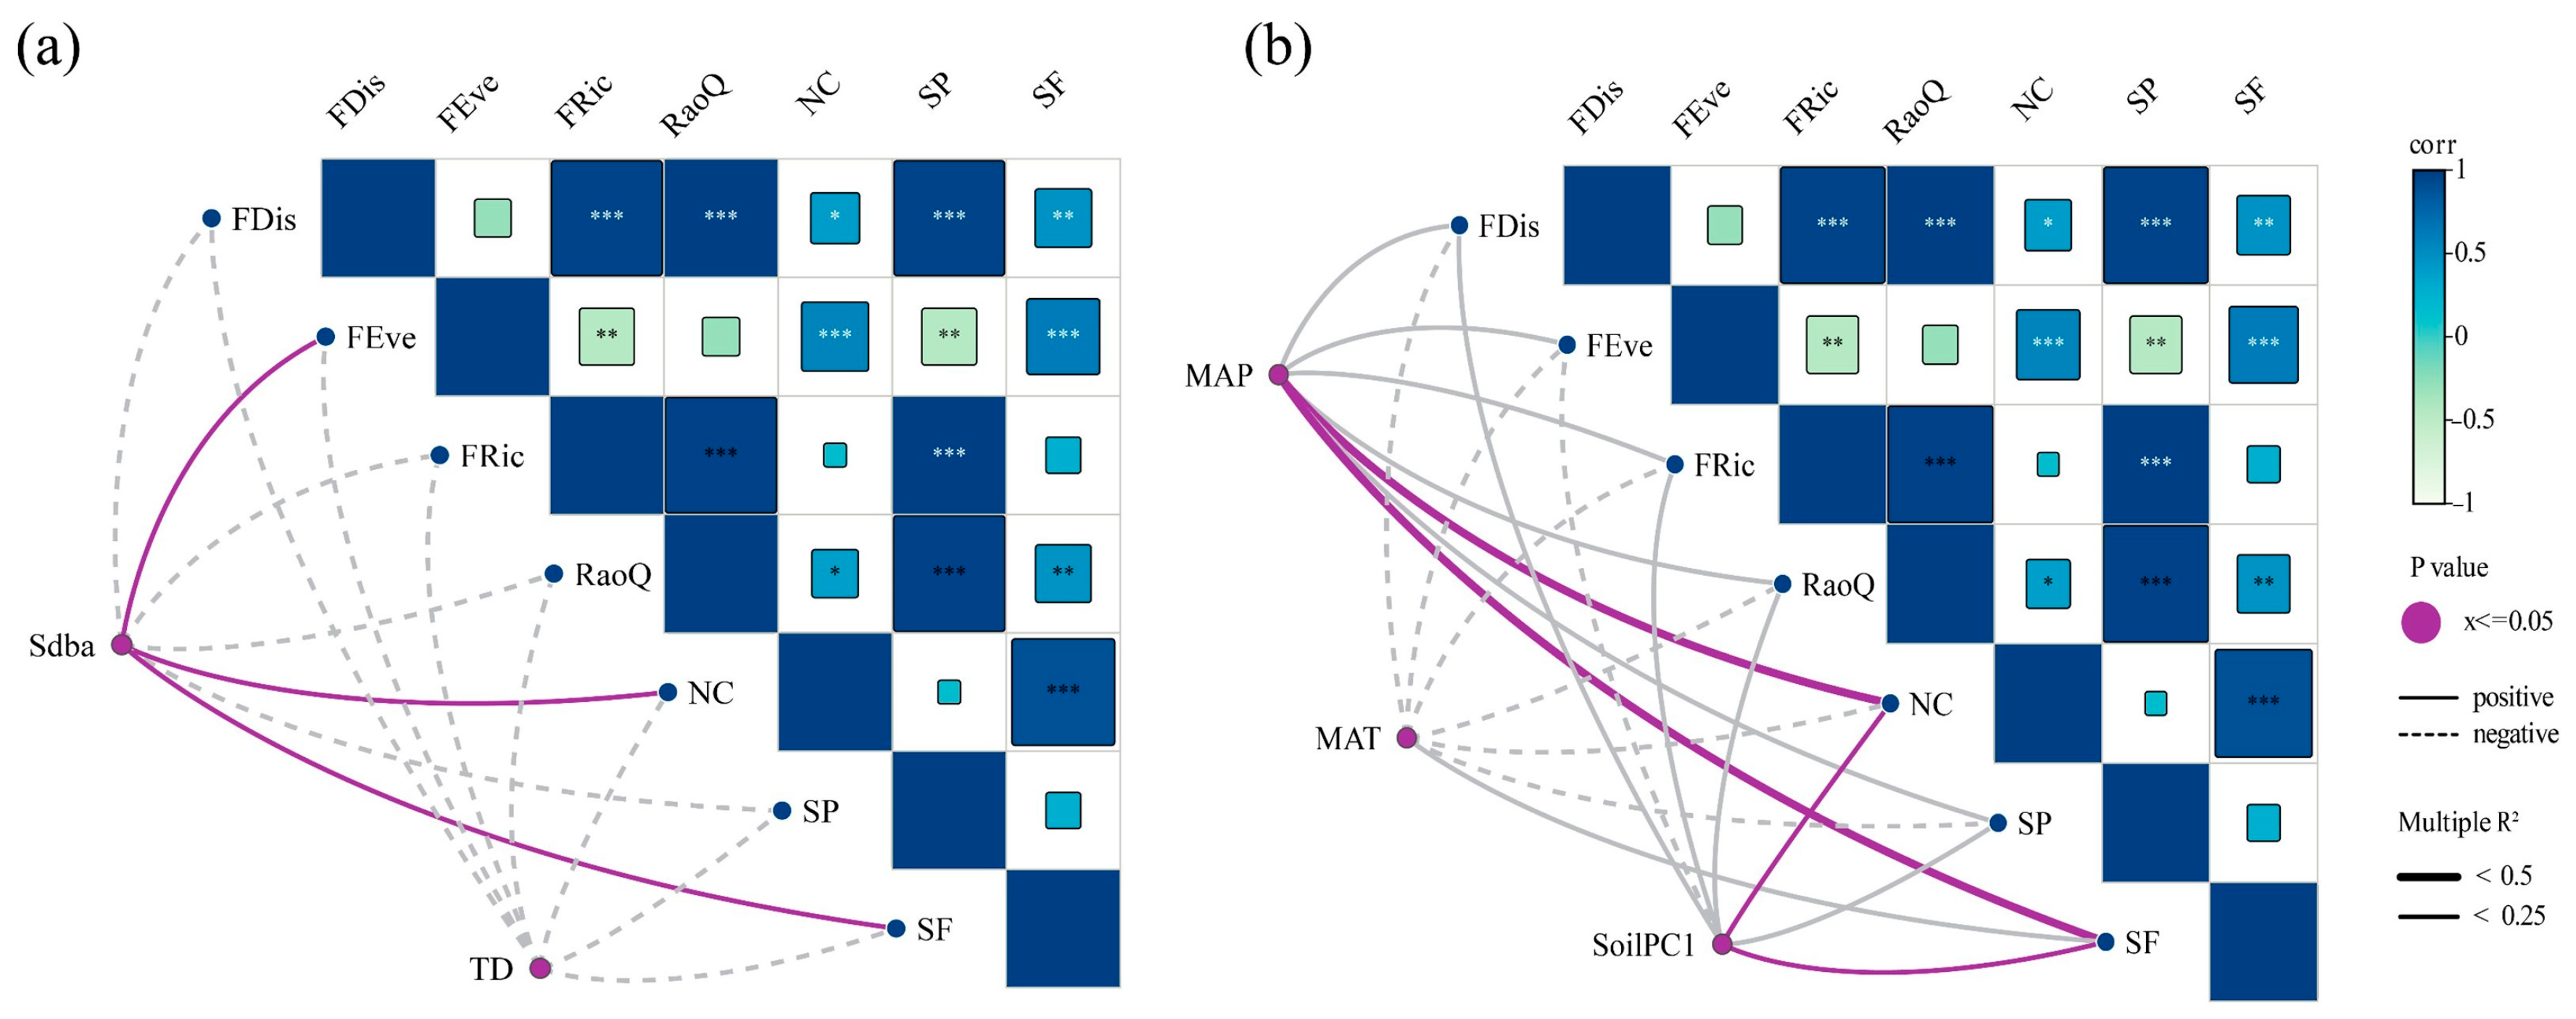
3.2. Effects of Biotic and Abiotic Factors on Single Function

NC and SF were markedly influenced by both biotic and abiotic factors (p < 0.05; Figure 6). The standard deviation of the basal area (Sdba) exhibited a positive correlation with FEve, NC, and SF (p < 0.05; Figure 6a), but a negative correlation with other individual functions. Tree diversity (TD) was negatively correlated with all individual functions. The average precipitation during the growing season (MAP) and soil nutrients had a significant positive influence on NC and SF (p < 0.05; Figure 6b), while the average temperature during the growing season (MAT) negatively affected all functions except SF.

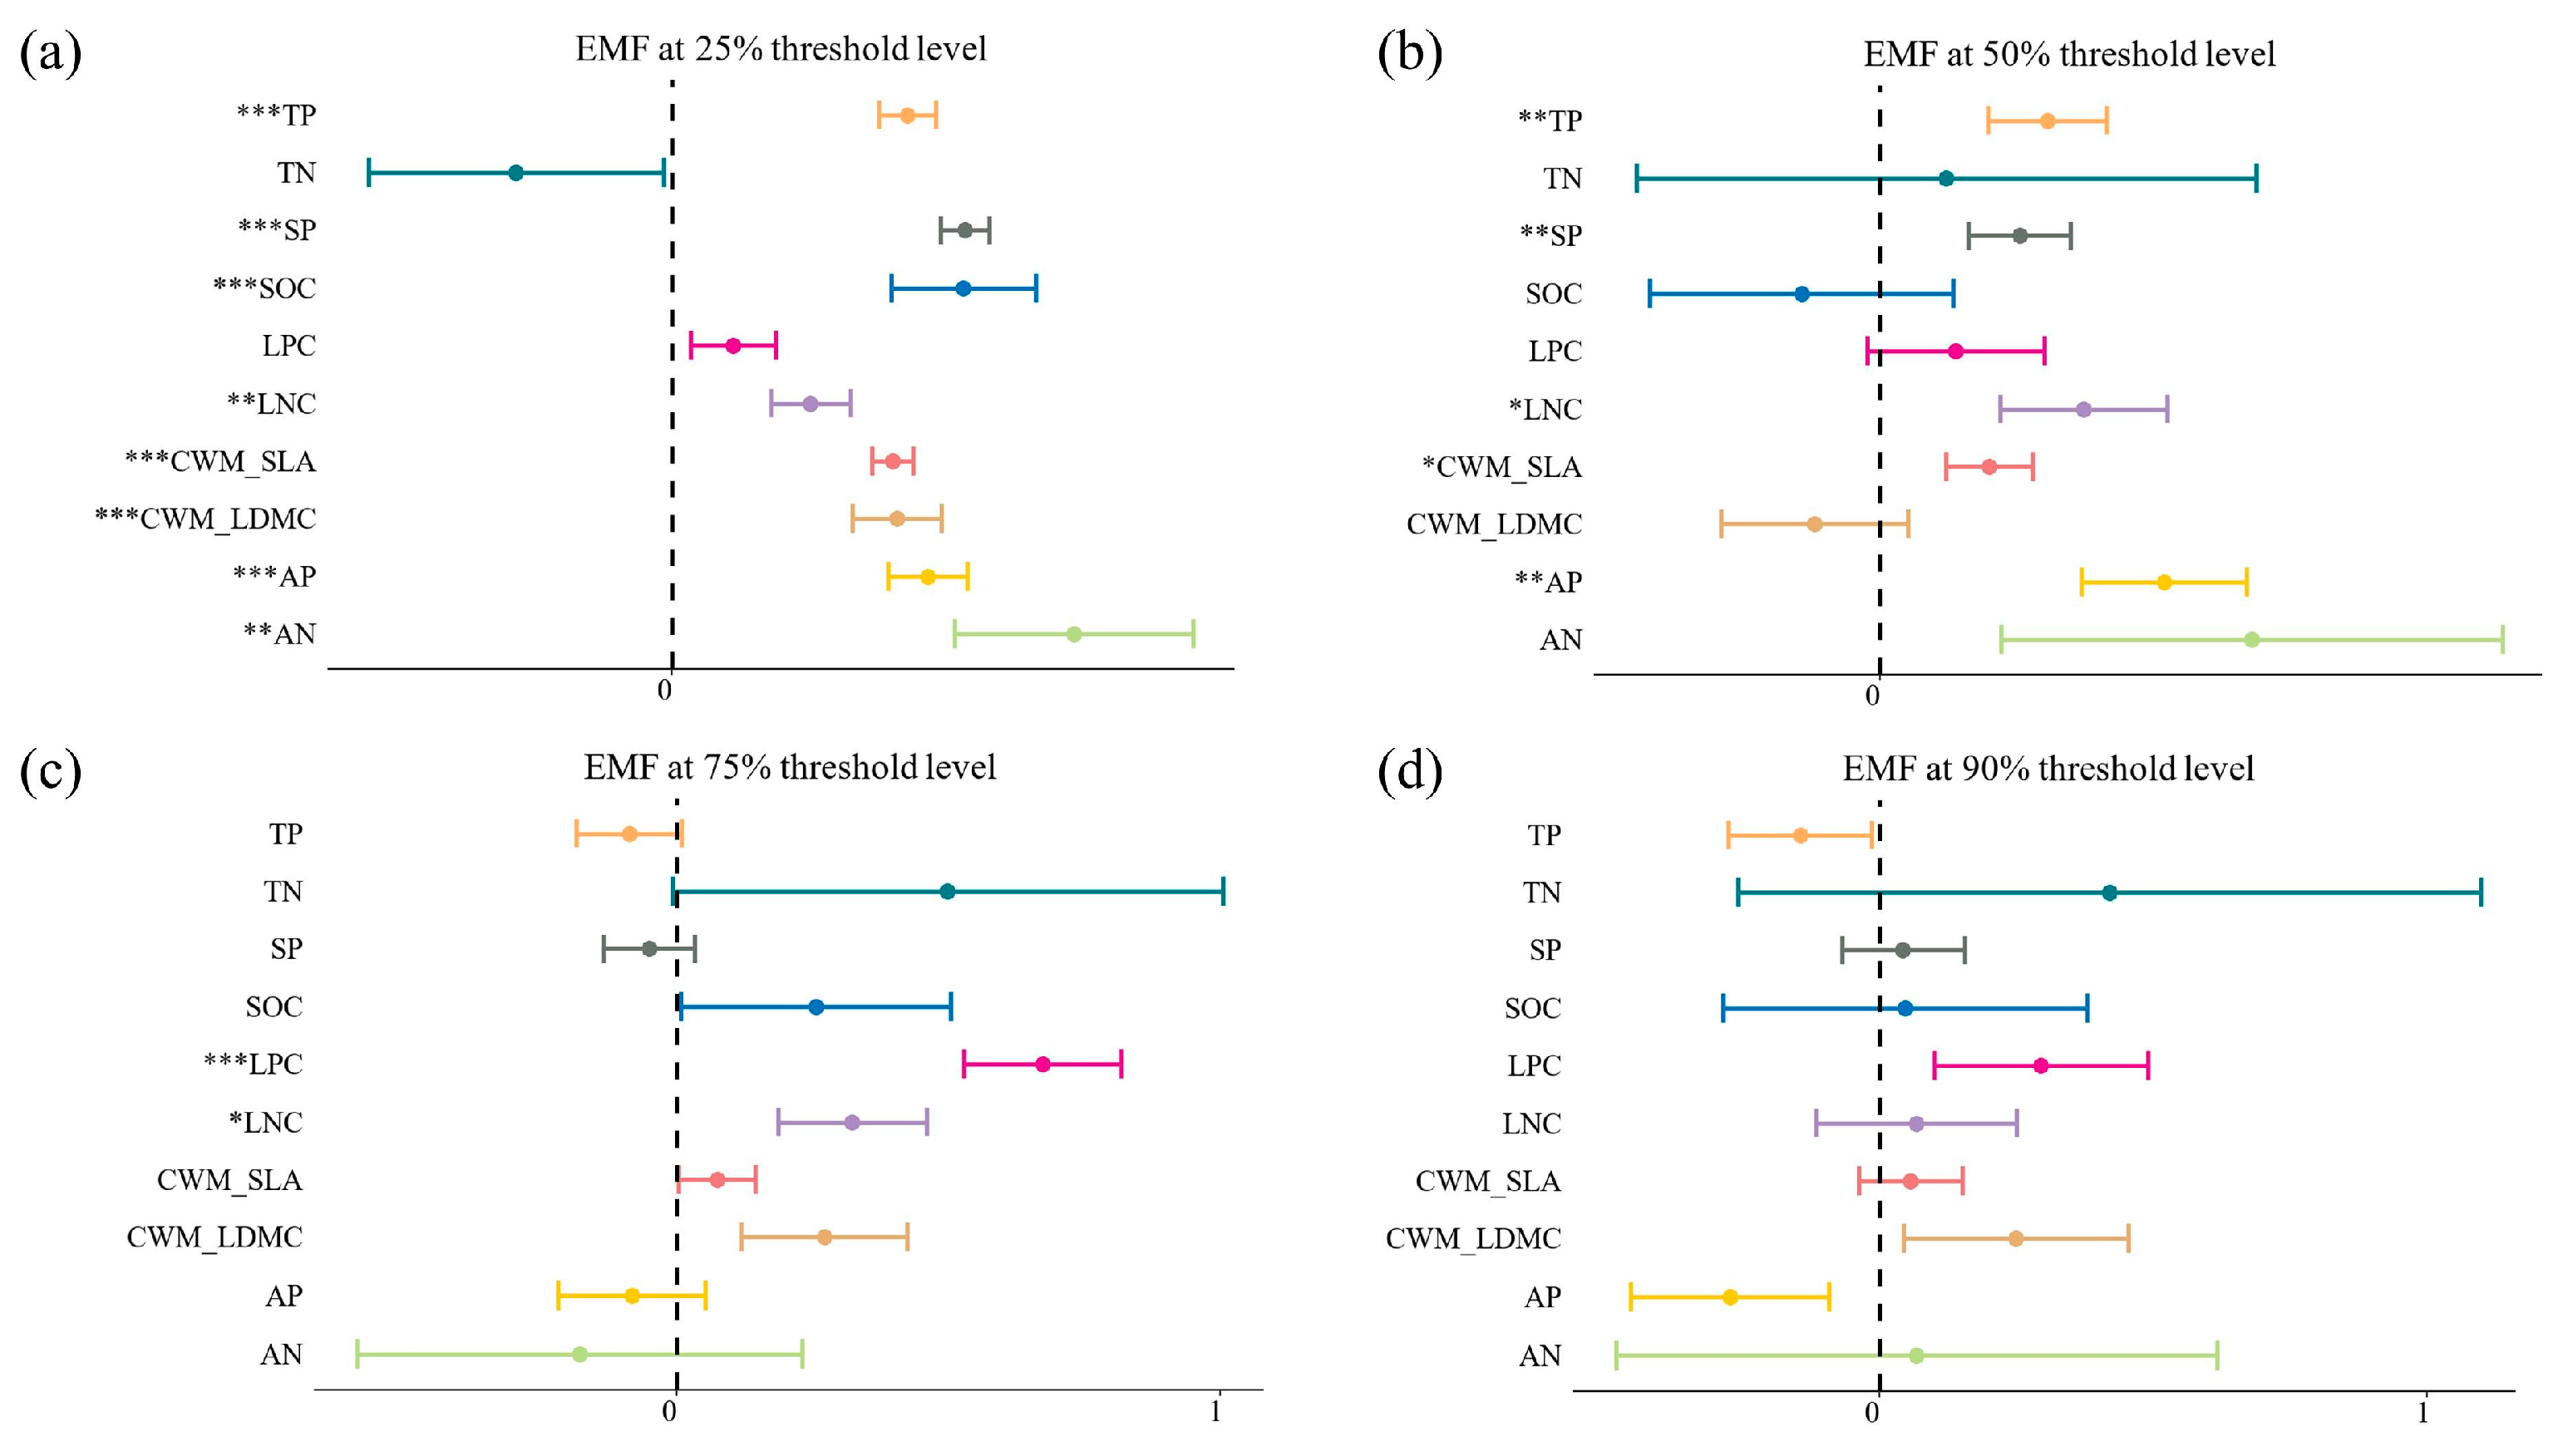
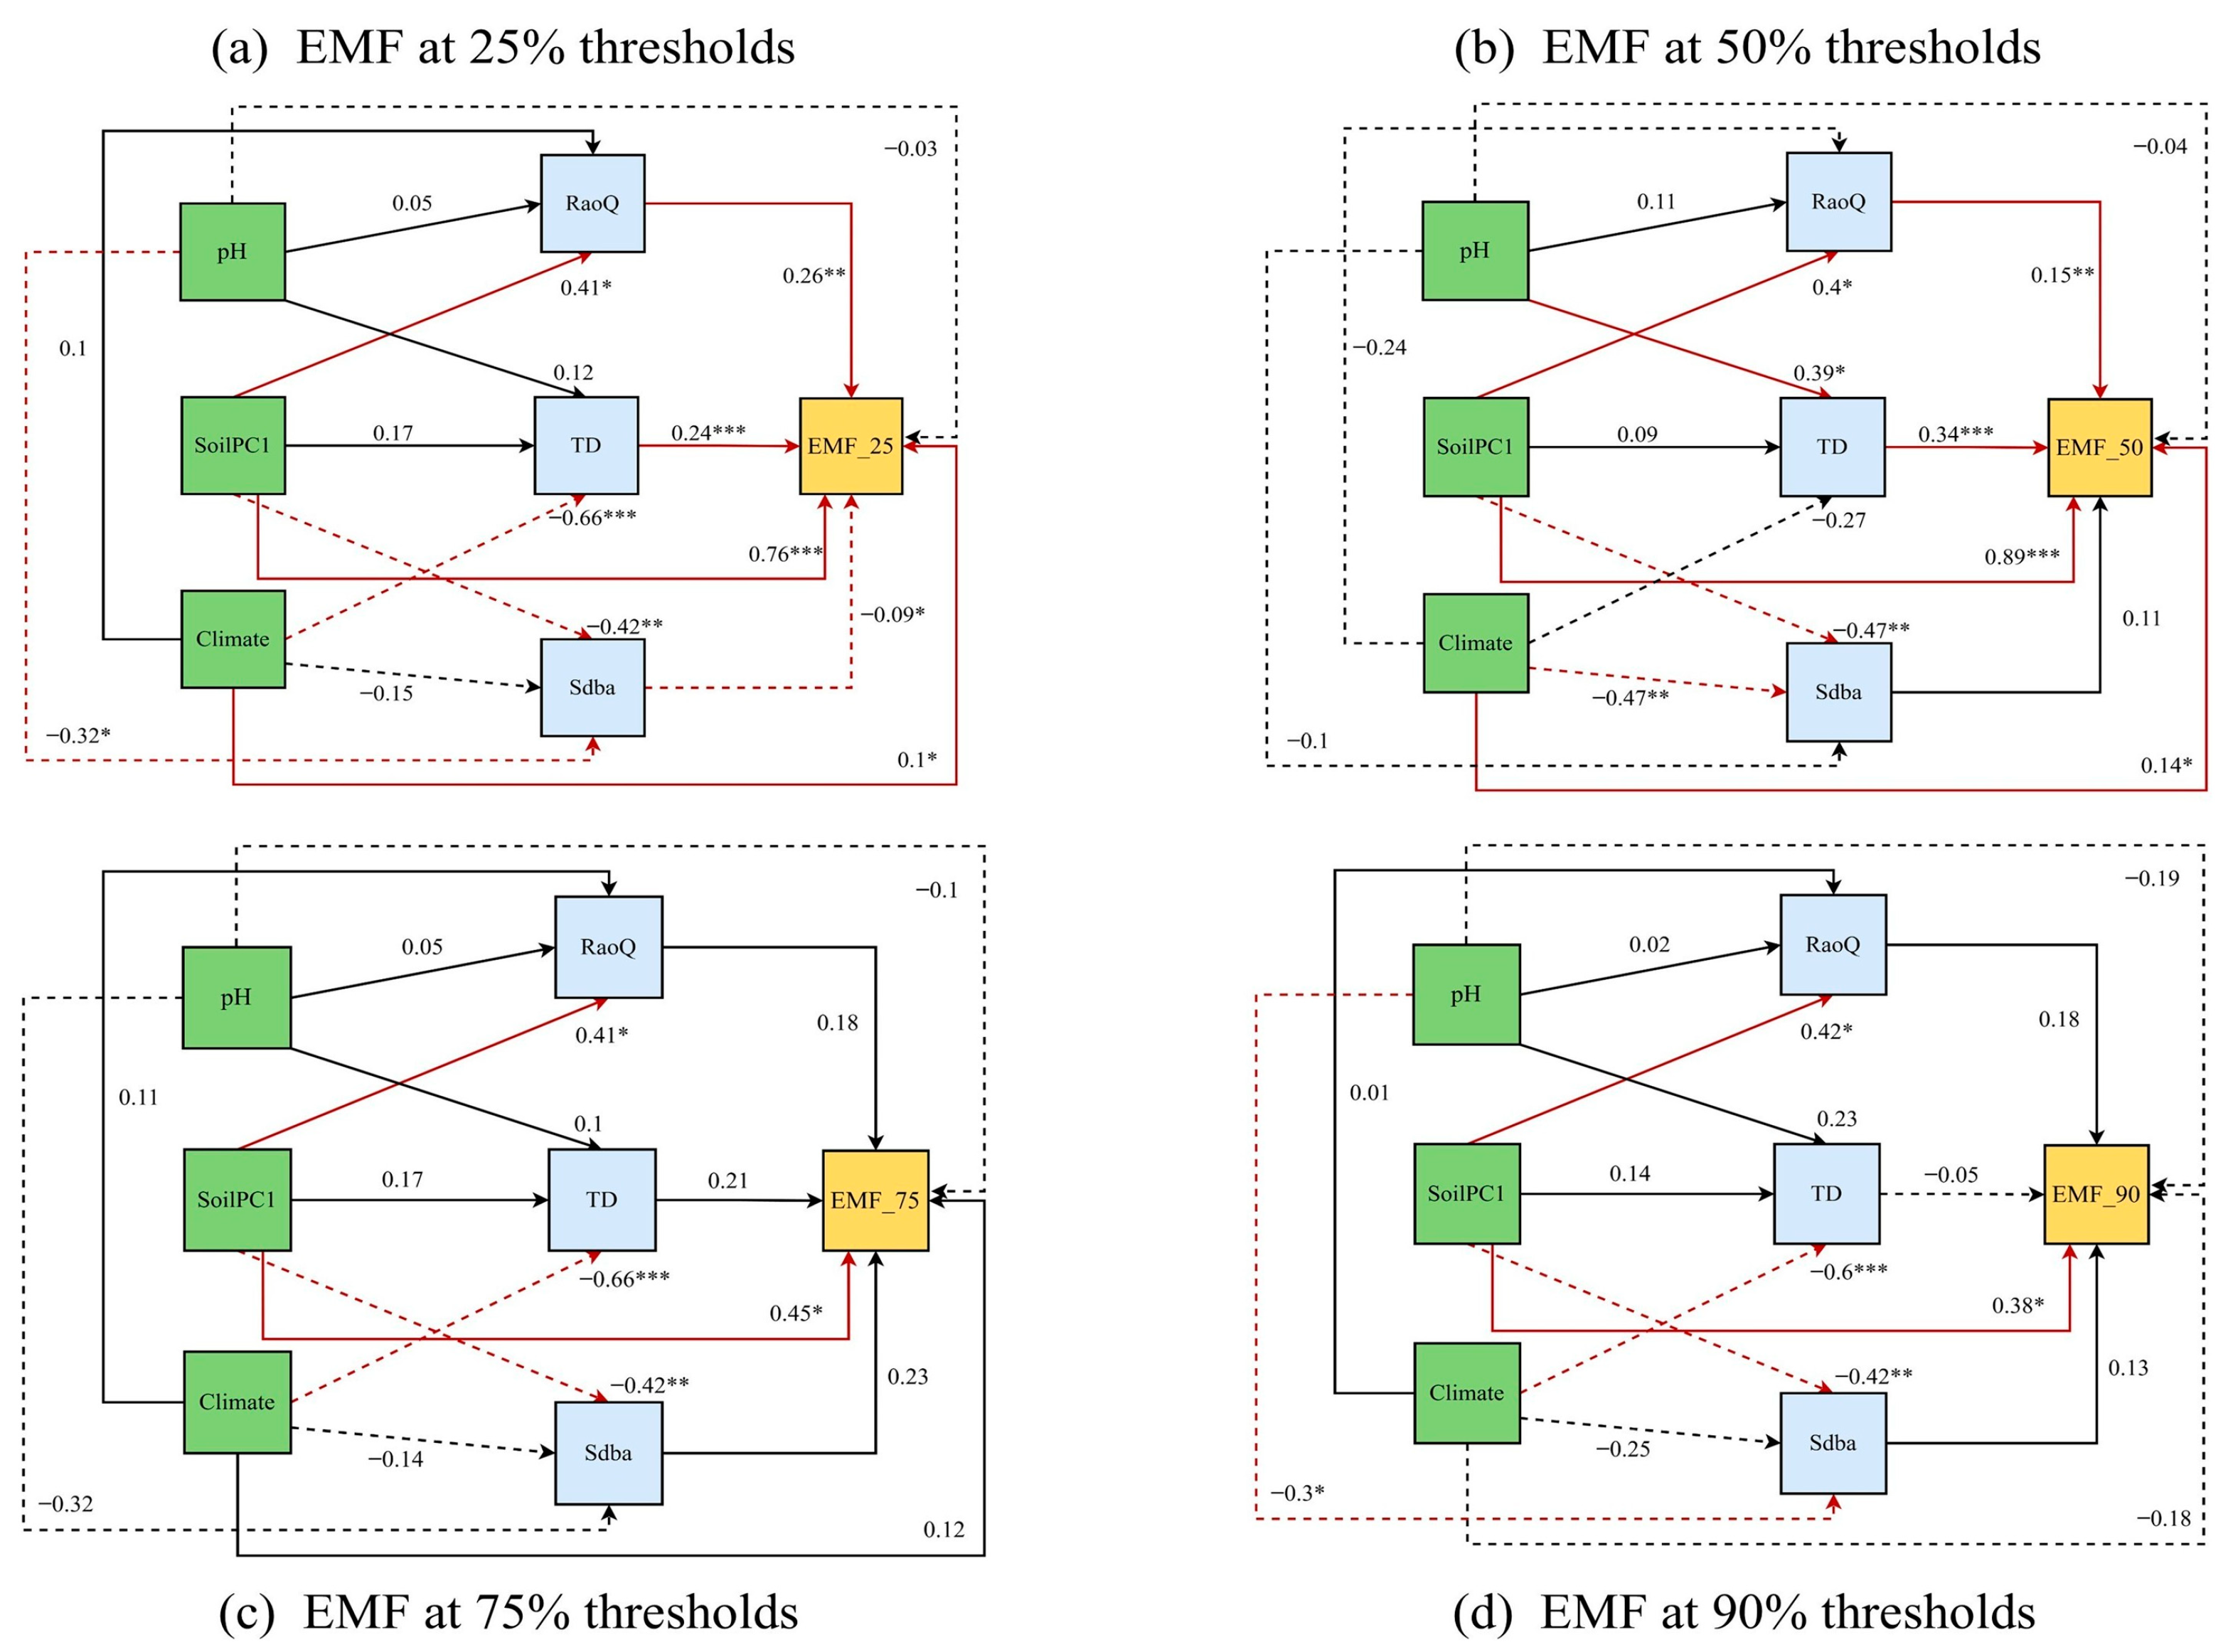
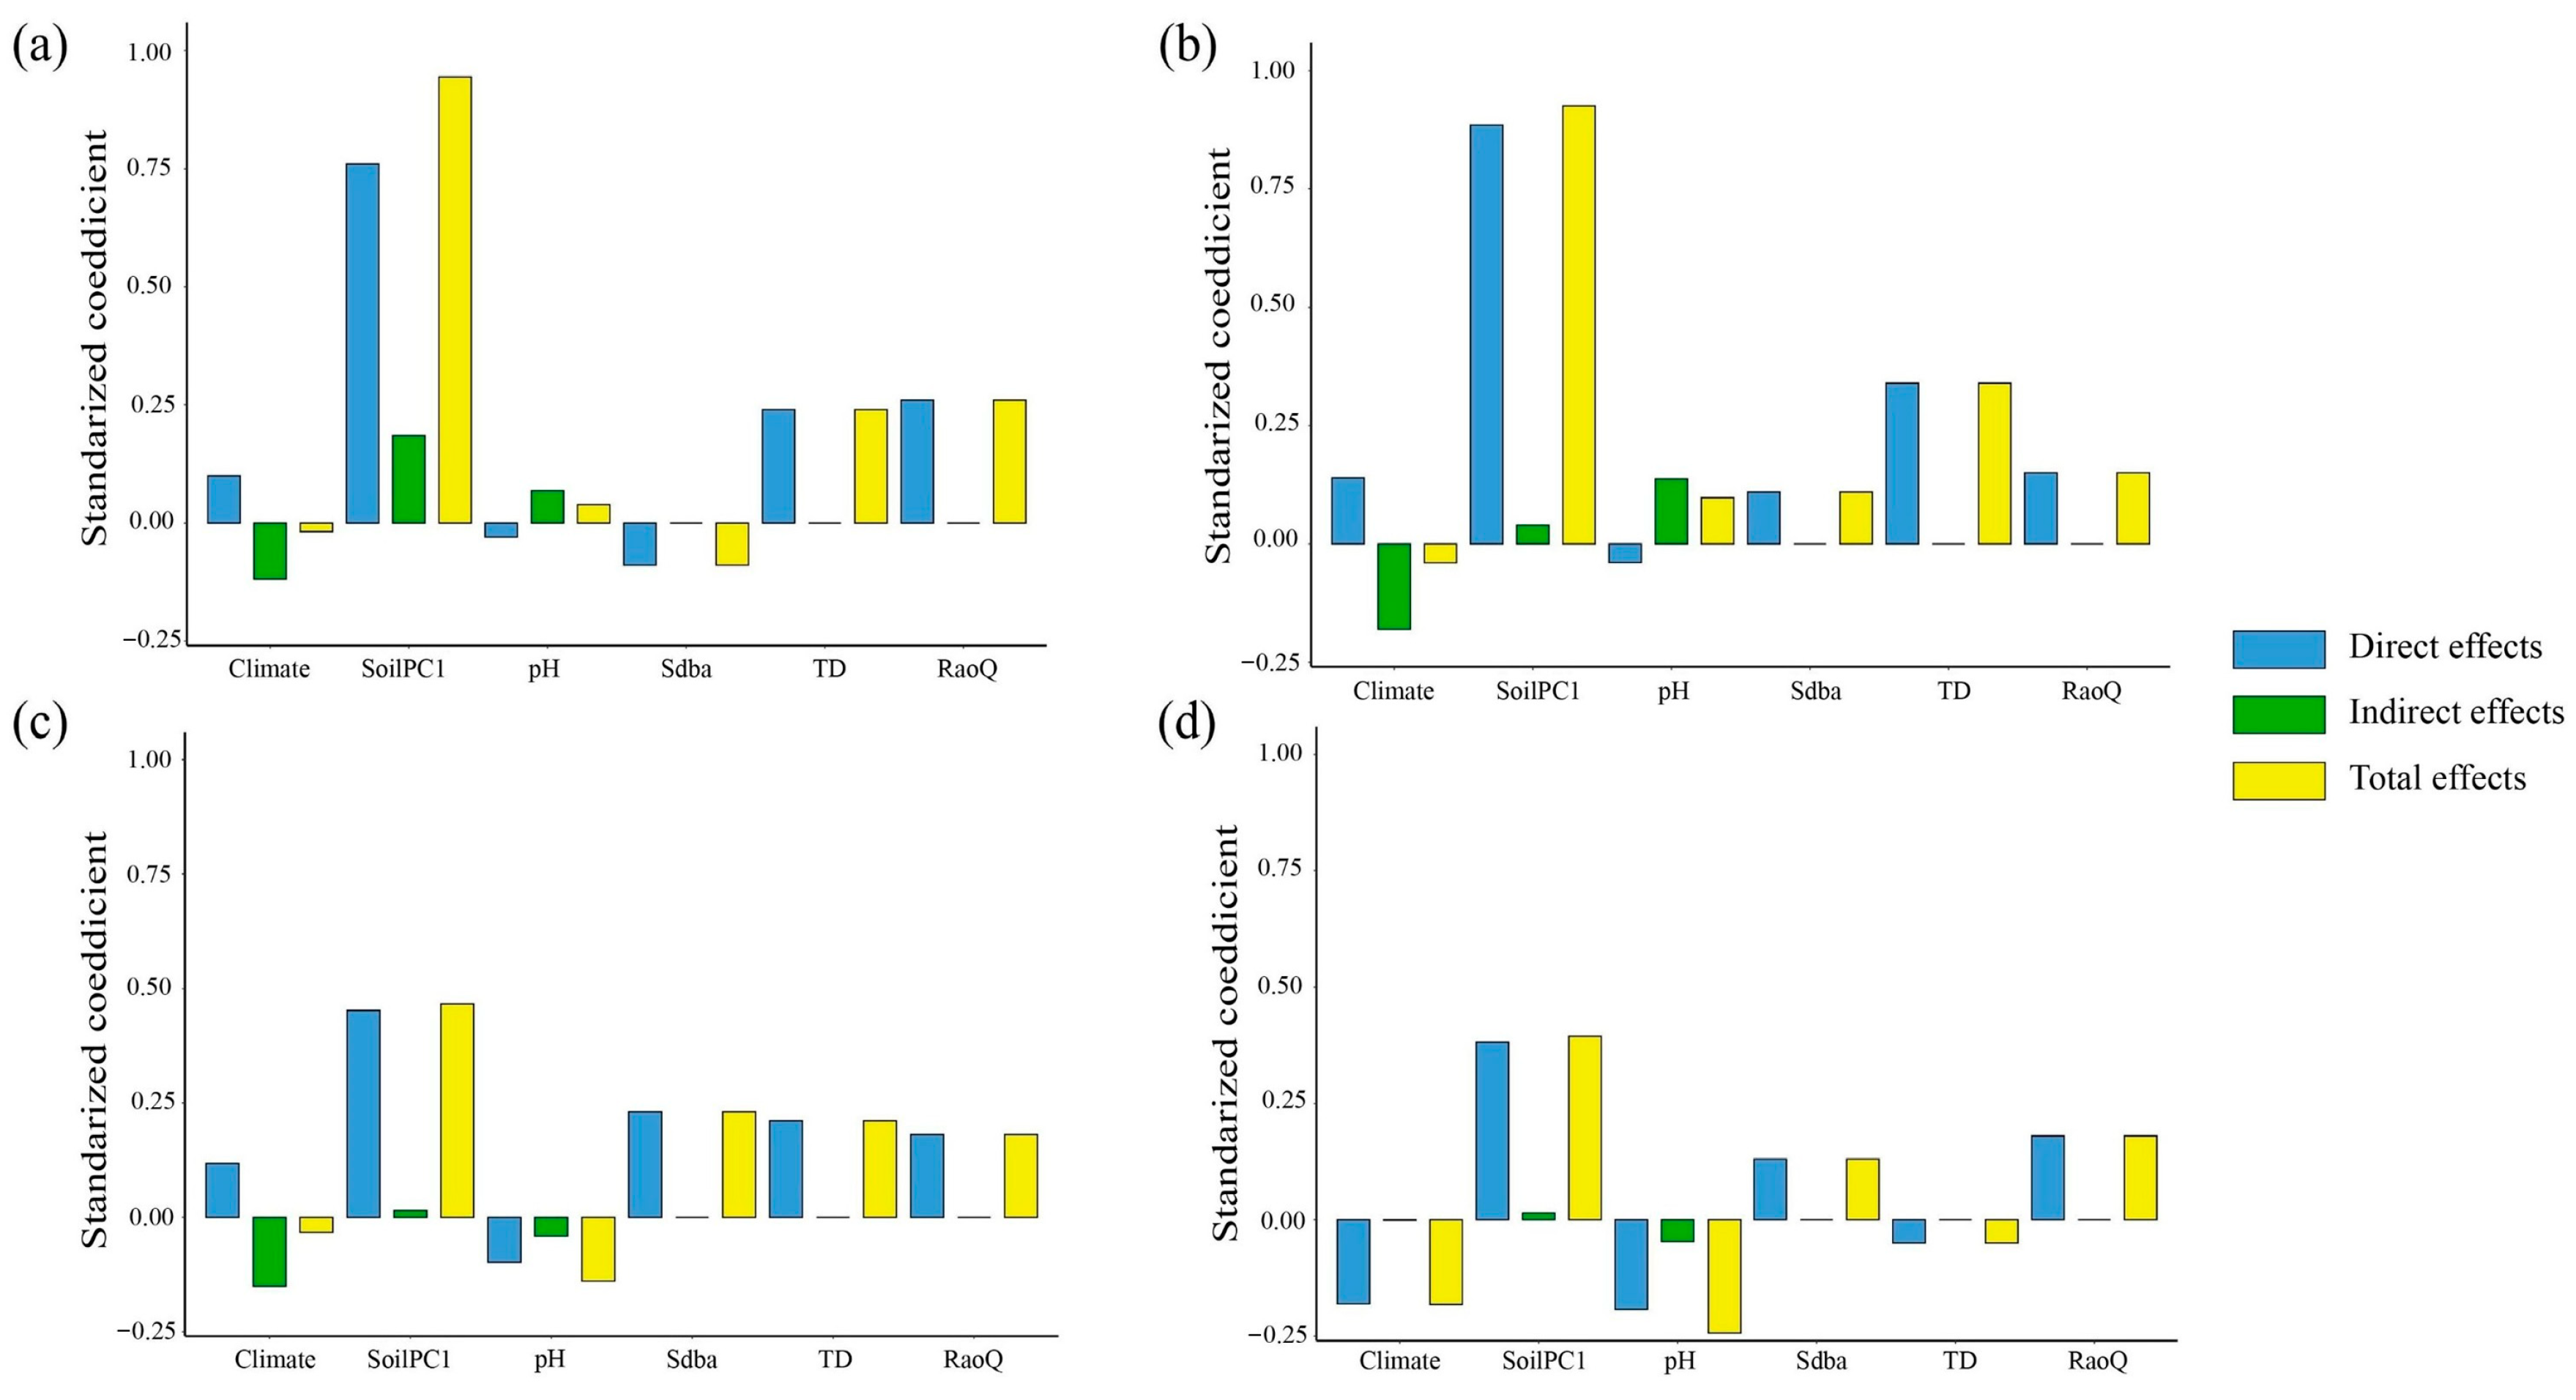
3.3. Effects of Biotic and Abiotic Factors on EMF

The linear regression model showed that, except for total nitrogen (TN) and leaf phosphorus content (LPC), most indicators had significant positive effects on EMF at the 25% threshold (p < 0.05; Figure 7a). At the 50% threshold, total phosphorus (TP), community weighted mean of specific leaf area (CWM_SLA), leaf nitrogen content (LNC), and SP exhibited a strong positive relationship with EMF (p < 0.05; Figure 7b). At the 75% threshold, an increase in the nutrient content of leaves significantly enhanced EMF (p < 0.05; Figure 7c). However, at the 90% threshold, no function exhibited a notable effect on EMF (Figure 7d).
The structural equation model results illustrated that, at different thresholds (from 25% to 90%), the predictors accounted for 97%, 93%, 31%, and 29% of the variation in EMF, respectively (Figure 8). Soil nutrient content (SoilPC1) exhibited a notable direct positive correlation with EMF at the 25%, 50%, and 75% thresholds (p < 0.05; Figure 8), and it indirectly influenced EMF through Sdba (Figure 9), which exerted a more substantial overall effect on EMF. Climate had a significant positive correlation with EMF at lower threshold levels (p < 0.05; Figure 8). Nevertheless, pH had no notable effect on EMF at all thresholds (Figure 8). TD and RaoQ significantly enhanced EMF at lower thresholds (25%–50%) (p < 0.05; Figure 8a,b), while Sdba was negatively correlated with EMF at the 25% threshold (p < 0.05; Figure 8a).

4. Discussion

4.1. Comparisons of Single Function and EMF Across Forest Types

In this study, mixed forest showed a significantly higher SP than pure forest (p < 0.05; Figure 4), supporting our Hypothesis H1. This phenomenon may be attributed to the contrasting shade tolerance and canopy structure between B. platyphylla and L. principis-rupprechtii. The niche complementarity between these species reduces interspecific competition compared to intraspecific competition, thereby enhancing resource utilization efficiency and stand productivity [63]. Similarly, Feng et al. [26] found that mixed coniferous and broad-leaved forests exhibit higher stand productivity due to stronger interspecific complementary effects. Therefore, mixed larch and birch forests may be a more effective way to improve stand productivity.
FD, a key component of biodiversity, represents the distribution of plant functional traits within multidimensional niche spaces [1] and has received significant attention in EMF studies. Species mixture effects tend to be more pronounced in conifer–broadleaf mixtures due to differences in leaf morphology, as well as variations in SLA, LDMC, LNC, and LPC [64]. The FDis, FRic, and RaoQ values of BL were significantly higher than those of pure forests, a result consistent with Li et al. [65], further emphasizing the importance of FD in mixed-forest ecosystems. In our study, BP and BL exhibited significantly higher soil fertility maintenance functions (SF) compared to LP (p < 0.05; Figure 4). This may be due to the wider root distribution in broad-leaved and mixed forests compared to pure coniferous forests, as well as the increased microbial activity in the soil, which enhances litter decomposition [66]. Higher SOC levels are also associated with greater SF [67]. Soil and leaf nutrients jointly regulate the forest nutrient cycling capacity. In this study, BP exhibited significantly higher NC than LP (p < 0.05; Figure 4). This can be attributed to higher nitrogen and phosphorus levels, as well as the larger SLA and higher nutrient content of leaves, which improve the photosynthesis capacity [64]. As a broad-leaved tree species, birch leaves store more organic matter. Nevertheless, no significant effect of stand composition on NC was observed, which was different from the conclusion of Li et al. [68]. This may be due to the predominant presence of larch in the selected mixed forests.
The EMF of BL was the highest among the three forest types (Figure 4) and outperformed pure forest at all thresholds (Figure 5), confirming Hypothesis H1. Our results align with most previous studies comparing artificial pure forests and mixed forests. Mixed forests can offer a greater variety of ecosystem functions [29]. Higher tree species and stand structure diversity are essential for maintaining EMF [1]. Given that tree species compositions in plantations are often simplified, selecting suitable tree species for mixing is crucial for improving the EMF of forests.

4.2. Effects of Biological Factors on EMF

Our findings showed that the main driving mechanisms of EMF show a difference at different threshold levels. At lower thresholds, the niche complementarity effect and the mass ratio effect exerted a synergistic influence on EMF [8], and, at higher thresholds, the mass ratio effect plays a decisive role, which is contrary to Hypothesis H3. At the 25% threshold, structural attributes negatively impacted EMF (p < 0.05; Figure 8). However, both TD and FD exhibited strong positive influences on EMF_25 and EMF_50 (p < 0.05), with no significant impact on the higher EMF. As the thresholds increased, the number of functions decreased, and biodiversity did not significantly influence EMF, weakening the niche complementarity effect. At the 75% threshold, the mass ratio effect emerged as the primary driving mechanism for EMF. Therefore, in order to achieve multi-functional forest management, it is essential that we enhance biodiversity by selecting suitable tree species for mixing and increasing the stand structure complexity. This approach would help increase EMF.
Under different thresholds, various aspects of diversity can serve distinct functions. Stand structure attributes (Sdba) were positively correlated with EMF_50, EMF_75, and EMF_90, while a notable negative correlation was found with EMF_25 (p < 0.05; Figure 8). Additionally, Sdba significantly influenced multiple single functions, such as NC and SF (p < 0.05; Figure 6a), highlighting the important role of stand structure in maintaining EMF. These results can be attributed to the fact that trees of different sizes have different resource requirements, and stand structure attributes allow for the occupation of different growth spaces, thereby reducing direct competition and forming a heterogeneous canopy structure [6,54]. This spatial differentiation facilitates more efficient resource use, including light and space, thus enhancing key forest ecosystem functions [20].
Biodiversity often plays a positive role in enhancing forest ecosystem functions [69]. At 25%, 50%, and 75% thresholds, a positive association was found between TD and EMF (Figure 8), although the strength of these correlations differed across various thresholds. The multiple functions of forest are mainly driven by tree species diversity. As tree species diversity decreases, its effect on EMF diminishes, and the mass ratio effect weakens [1]. At the 90% threshold, a negative correlation was observed between TD and EMF, likely due to the fact that, with the increase in threshold, only some indicators have a higher performance, leading to lower resource availability and intensified competition, which ultimately reduces EMF [54].
Functional diversity indicators can reflect more differences in traits and niches [53]. TD largely influences ecosystem function by altering the composition of functional traits among trees [70]. In this study, RaoQ was used as the measure of FD. The results showed a positively correlated between RaoQ and EMF at all thresholds (Figure 8), with mixed forest exhibiting a higher EMF compared to pure forest (Figure 4). This result aligns with findings by Li et al. [20] and supports the niche complementary effect [71]. The leaf morphology of B. platyphylla and L. principis-rupprechtii differed significantly, and mixing these species results in more efficient light utilization, positively impacting ecosystem function and stability [72]. A linear regression analysis revealed that specific tree leaf traits were significantly associated with EMF (p < 0.05; Figure 7) at low and medium thresholds (<75%). As the thresholds increased, EMF exhibited a decreasing trend. According to the mass ratio hypothesis, the characteristics of dominant species significantly shape ecosystem functions [6]. Leaf traits, which reflect a tree’s capacity to capture light energy and nutrients, promote resource complementary and contribute to ecosystem function [73]. Highly diverse ecosystems allow a greater variety of functional traits to complement each other, enhancing species’ efficiency in resource utilization. Therefore, we can formulate effective species diversity protection strategies based on regional forest classification [74], to maintain forest EMF.

4.3. Effects of Abiotic Factors on EMF

The above results have confirmed that biodiversity and soil factors were the driving factors of EMF, which is consistent with the Hypothesis H2. The relationship between environment and EMF is both dynamic and complex [75], particularly under the influence of global climate change [8]. Our study indicated a significant direct association between climate and EMF at low thresholds (p < 0.05; Figure 8). Adequate water and light can promote plant growth and improve soil microbial activity, thereby enhancing the EMF of the stand. Notably, previous studies have revealed that the effect of biodiversity on EMF is likely to be influenced, or even altered, by environmental factors [23]. Specifically, climate mediated this effect through TD and stand structure attributes, altering the relationship between biodiversity and EMF at the 25% and 90% thresholds (Figure 8 and Figure 9).
Soil plays a crucial role in tree growth, serving as a main driver of EMF [23]. At the 25% thresholds, TP, AP, and AN exhibited a significant positive impact on EMF (p < 0.05; Figure 7a). At the 50% thresholds, TP and AP maintained similar effects (p < 0.05; Figure 7b). However, as the threshold increased, the influence of soil nutrients on EMF diminished. At the 75% and 90% thresholds, this influence became negligible (Figure 7c,d). Additionally, the SEM results indicated that soil nutrients positively impacted EMF at all thresholds, with a significant increase observed alongside FD (p < 0.05; Figure 8). These findings show that richer soil nutrients promote tree growth, thereby enhancing overall forest ecosystem function [76]. At different thresholds, a notable negative correlation was found between SoilPC1 and Sdba (p < 0.05; Figure 8), indicating that soil nutrients may indirectly affect forest ecosystem function by affecting the stand structure [77].

5. Conclusions

The study explored the influence mechanisms of stand type, biodiversity, and environmental factors on EMF under different thresholds. By quantifying the differences in single functions and EMF across the three stand types, we found that most individual functions in the mixed forest exceeded those in the pure forest. For example, SP was notably higher in the mixed forest compared to the corresponding pure forest. FD and SF in BL were considerably greater than in LP, although no significant difference was observed between BL and BP. Furthermore, the NC in BP surpassed that of LP, with no significant variation between LP and BL. At different thresholds, the EMF of BL was notably greater than that of BP and LP. Forest EMF was determined by both biotic and abiotic factors. At low thresholds (<50%), the mass ratio and niche complementarity hypothesis jointly influenced EMF. As the threshold increased, the effects of these two effects on EMF weakened. At the 75% threshold, the mass ratio effect became the main driver of EMF. Environmental factors could indirectly affect EMF by altering functional traits, structural attributes, and tree species composition. The mixed species of L. principis-rupprechtii and B. platyphylla, with their differing functional traits, enhance the EMF’s capacity to resist climate change. Therefore, assessing the various functions and driving factors of larch forests in North China is crucial for biodiversity conservation and improving stand stability. In the context of the multi-functional management of L. principis-rupprechtii forest, selecting birch species for mixing, increasing functional diversity, protecting the natural forest structure, and implementing near-natural management practices are key strategies to enhance EMF.

Supplementary Materials

The following supporting information can be downloaded at: https://www.mdpi.com/article/10.3390/f16050745/s1, Table S1: Principal component analysis of the soil nutrients; Figure S1: Dendrogram of the relationships between different ecosystem functions and the optimal number of clusters.

Author Contributions

Conceptualization, Y.Z. and Z.Z.; methodology, software, and visualization, Y.Z.; investigation, and data curation, Y.Z., R.W., C.L., Q.L. and M.L.; writing—original draft, Y.Z.; writing—review and editing, and funding acquisition, Z.Z. All authors have read and agreed to the published version of the manuscript.

Funding

This research was funded by the State Key Research and Development Program, grant number 2022YFD2200503; the Key R & D Program of Hebei Province of China, grant number 22326803D; the Natural Science Foundation of Hebei, grant number C2023204170; the National Natural Science Foundation of China, grant number 32401557; and Hebei Provincial Forestry and Grassland Science and Technology Innovation Program Project, grant number 2001021.

Data Availability Statement

The data presented in this study are available on request from the corresponding author.

Acknowledgments

The authors thank everyone who helped with the field survey and the anonymous reviewers for their valuable comments.

Conflicts of Interest

The authors declare no conflicts of interest.

References

  1. Lan, J.; Lei, X.; He, X.; Gao, W.; Guo, H. Multiple mechanisms drive biodiversity-ecosystem service multifunctionality but the dominant one depends on the level of multifunctionality for natural forests in northeast China. For. Ecol. Manag. 2023, 542, 121101. [Google Scholar] [CrossRef]
  2. Schuldt, A.; Assmann, T.; Brezzi, M.; Buscot, F.; Eichenberg, D.; Gutknecht, J.; Härdtle, W.; He, J.-S.; Klein, A.-M.; Kühn, P.; et al. Biodiversity across trophic levels drives multifunctionality in highly diverse forests. Nat. Commun. 2018, 9, 2989. [Google Scholar] [CrossRef]
  3. Du, X.; Lei, X.; He, X.; Lan, J.; Guo, H.; Xu, Q. Ecosystem service multifunctionality of mixed conifer-broad-leaved forests under climate change and forest management based on matrix growth modelling. For. Ecosyst. 2024, 11, 100231. [Google Scholar] [CrossRef]
  4. Caicoya, A.T.; Vergarechea, M.; Blattert, C.; Klein, J.; Eyvindson, K.; Burgas, D.; Snäll, T.; Mönkkönen, M.; Astrup, R.; Di Fulvio, F.; et al. What drives forest multifunctionality in central and northern Europe? Exploring the interplay of management, climate, and policies. Ecosyst. Serv. 2023, 64, 101575. [Google Scholar] [CrossRef]
  5. Carrasco, G.; Almeida, A.C.; Falvey, M.; Olmedo, G.F.; Taylor, P.; Santibañez, F.; Coops, N.C. Effects of climate change on forest plantation productivity in Chile. Global Change Biol. 2022, 28, 7391–7409. [Google Scholar] [CrossRef]
  6. Yuan, Z.; Ali, A.; Ruiz-Benito, P.; Jucker, T.; Mori, A.S.; Wang, S.; Zhang, X.; Li, H.; Hao, Z.; Wang, X.; et al. Above- and below-ground biodiversity jointly regulate temperate forest multifunctionality along a local-scale environmental gradient. J. Ecol. 2020, 108, 2012–2024. [Google Scholar] [CrossRef]
  7. Albrecht, J.; Classen, A.; Vollstädt, M.G.R.; Mayr, A.; Mollel, N.P.; Schellenberger Costa, D.; Dulle, H.I.; Fischer, M.; Hemp, A.; Howell, K.M.; et al. Plant and animal functional diversity drive mutualistic network assembly across an elevational gradient. Nat. Commun. 2018, 9, 3177. [Google Scholar] [CrossRef] [PubMed]
  8. Tian, J.; Ni, T.; Miao, Z.; Hao, Y.; Ma, A.; Dong, L.; Li, F. Effects of biotic and abiotic factors on ecosystem multifunctionality of plantations. Ecol. Process. 2024, 13, 44. [Google Scholar] [CrossRef]
  9. Mensah, S.; Salako, K.V.; Assogbadjo, A.; Glèlè Kakaï, R.; Sinsin, B.; Seifert, T. Functional trait diversity is a stronger predictor of multifunctionality than dominance: Evidence from an Afromontane forest in South Africa. Ecol. Indic. 2020, 115, 106415. [Google Scholar] [CrossRef]
  10. Del Río, M.; Löf, M.; Bravo-Oviedo, A.; Jactel, H. Understanding the complexity of mixed forest functioning and management: Advances and perspectives. For. Ecol. Manag. 2021, 489, 119138. [Google Scholar] [CrossRef]
  11. Jactel, H.; Moreira, X.; Castagneyrol, B. Tree diversity and forest resistance to insect pests: Patterns, mechanisms, and prospects. Annu. Rev. Entomol. 2021, 66, 277–296. [Google Scholar] [CrossRef] [PubMed]
  12. Pretzsch, H.; Steckel, M.; Heym, M.; Biber, P.; Ammer, C.; Ehbrecht, M.; Bielak, K.; Bravo, F.; Ordóñez, C.; Collet, C.; et al. Stand growth and structure of mixed-species and monospecific stands of Scots pine (Pinus sylvestris L.) and oak (Q. robur L., Quercus petraea (Matt.) Liebl.) analysed along a productivity gradient through Europe. Eur. J. Forest Res. 2020, 139, 349–367. [Google Scholar] [CrossRef]
  13. Van Der Plas, F.; Manning, P.; Allan, E.; Scherer-Lorenzen, M.; Verheyen, K.; Wirth, C.; Zavala, M.A.; Hector, A.; Ampoorter, E.; Baeten, L.; et al. Jack-of-all-trades effects drive biodiversity-ecosystem multifunctionality relationships in European forests. Nat. Commun. 2016, 7, 11109. [Google Scholar] [CrossRef] [PubMed]
  14. Jucker, T.; Bongalov, B.; Burslem, D.F.R.P.; Nilus, R.; Dalponte, M.; Lewis, S.L.; Phillips, O.L.; Qie, L.; Coomes, D.A. Topography shapes the structure, composition and function of tropical forest landscapes. Ecol. Lett. 2018, 21, 989–1000. [Google Scholar] [CrossRef]
  15. Soliveres, S.; Van Der Plas, F.; Manning, P.; Prati, D.; Gossner, M.M.; Renner, S.C.; Alt, F.; Arndt, H.; Baumgartner, V.; Binkenstein, J.; et al. Biodiversity at multiple trophic levels is needed for ecosystem multifunctionality. Nature 2016, 536, 456–459. [Google Scholar] [CrossRef]
  16. Wang, S.; Isbell, F.; Deng, W.; Hong, P.; Dee, L.E.; Thompson, P.; Loreau, M. How complementarity and selection affect the relationship between ecosystem functioning and stability. Ecology 2021, 102, e03347. [Google Scholar] [CrossRef]
  17. Kou, X.; Liu, H.; Chen, H.; Xu, Z.; Yu, X.; Cao, X.; Liu, D.; Wen, L.; Zhuo, Y.; Wang, L. Multifunctionality and maintenance mechanism of wetland ecosystems in the littoral zone of the northern semi-arid region lake driven by environmental factors. Sci. Total. Environ. 2023, 870, 161956. [Google Scholar] [CrossRef]
  18. Wang, J.; Liu, H.; Yang, Q.; Shen, G.; Zhu, X.; Xu, Y.; Wang, X. Topography and structural diversity regulate ecosystem multifunctionality in a subtropical evergreen broad-leaved forest. Front. For. Glob. Change 2023, 6, 1309660. [Google Scholar] [CrossRef]
  19. Lutz, J.A.; Furniss, T.J.; Johnson, D.J.; Davies, S.J.; Allen, D.; Alonso, A.; Anderson-Teixeira, K.J.; Andrade, A.; Baltzer, J.; Becker, K.M.L.; et al. Global importance of large-diameter trees. Global Ecol. Biogeogr. 2018, 27, 849–864. [Google Scholar] [CrossRef]
  20. Li, S.; Liu, W.; Lang, X.; Huang, X.; Su, J. Species richness, not abundance, drives ecosystem multifunctionality in a subtropical coniferous forest. Ecol. Indic. 2021, 120, 106911. [Google Scholar] [CrossRef]
  21. Yue, Q.; Hao, M.; Geng, Y.; Wang, X.; Von Gadow, K.; Zhang, C.; Zhao, X.; Gao, L. Evaluating alternative hypotheses behind biodiversity and multifunctionality relationships in the forests of Northeastern China. For. Ecosyst. 2022, 9, 100027. [Google Scholar] [CrossRef]
  22. Wardle, D.A.; Bardgett, R.D.; Klironomos, J.N.; Setälä, H.; Van Der Putten, W.H.; Wall, D.H. Ecological linkages between aboveground and belowground biota. Science 2004, 304, 1629–1633. [Google Scholar] [CrossRef] [PubMed]
  23. Jing, X.; Sanders, N.J.; Shi, Y.; Chu, H.; Classen, A.T.; Zhao, K.; Chen, L.; Shi, Y.; Jiang, Y.; He, J.-S. The links between ecosystem multifunctionality and above- and belowground biodiversity are mediated by climate. Nat. Commun. 2015, 6, 8159. [Google Scholar] [CrossRef]
  24. Wang, L.; Huang, X.; Su, J. Tree species diversity and stand attributes differently influence the ecosystem functions of Pinus yunnanensis secondary forests under the climate context. Sustainability 2022, 14, 8332. [Google Scholar] [CrossRef]
  25. Zhao, F.; Hao, M.; Yue, Q.; Lin, S.; Zhao, X.; Zhang, C.; Fan, X.; Von Gadow, K. Community diversity and composition affect ecosystem multifunctionality across environmental gradients in boreal and temperate forests. Ecol. Indic. 2024, 159, 111692. [Google Scholar] [CrossRef]
  26. Feng, Y.; Schmid, B.; Loreau, M.; Forrester, D.I.; Fei, S.; Zhu, J.; Tang, Z.; Zhu, J.; Hong, P.; Ji, C.; et al. Multispecies forest plantations outyield monocultures across a broad range of conditions. Science 2022, 376, 865–868. [Google Scholar] [CrossRef]
  27. Carmona-Yáñez, M.D.; Lucas-Borja, M.E.; Zema, D.A.; Jing, X.; Kooch, Y.; Garrido Gallego, P.; Plaza-Alvarez, P.A.; Zhou, G.; Delgado-Baquerizo, M. Influence of management and stand composition on ecosystem multifunctionality of Mediterranean tree forests. Trees 2023, 37, 1801–1816. [Google Scholar] [CrossRef]
  28. Lan, J.; Lei, X.; He, X.; Gao, W.; Guo, H. Stand density, climate and biodiversity jointly regulate the multifunctionality of natural forest ecosystems in northeast China. Eur. J. Forest Res. 2023, 142, 493–507. [Google Scholar] [CrossRef]
  29. Xu, H.; Yu, M.; Cheng, X. Abundant fungal and rare bacterial taxa jointly reveal soil nutrient cycling and multifunctionality in uneven-aged mixed plantations. Ecol. Indic. 2021, 129, 107932. [Google Scholar] [CrossRef]
  30. Zeng, X.; Wang, D.; Zhang, D.; Lu, W.; Li, Y.; Liu, Q. Developing the additive systems of stand basal area model for broad-leaved mixed forests. Plants 2024, 13, 1758. [Google Scholar] [CrossRef]
  31. Li, J.; Chen, D.; Yang, X.; Fan, N.; Wang, Y.; Zhang, Z. Effects of stand density, age, and drought on the size-growth relationship in Larix principis-rupprechtii forests. Forests 2024, 15, 413. [Google Scholar] [CrossRef]
  32. Duchesne, L.; Houle, D.; Ouimet, R.; Caldwell, L.; Gloor, M.; Brienen, R. Large apparent growth increases in boreal forests inferred from tree-rings are an artefact of sampling biases. Sci. Rep. 2019, 9, 6832. [Google Scholar] [CrossRef]
  33. Holmes; Richard, L. Computer—assisted quality control in tree -ring dating and measirement. Tree-Ring Bull 1983, 43, 51–67. [Google Scholar]
  34. Malhi, S.S.; Brandt, S.A.; Kutcher, H.R.; Ulrich, D. Effects of broad-leaf crop frequency and fungicide application in various rotations on nitrate nitrogen and extractable phosphorus in a dark brown soil. Commun. Soil Sci. Plan. 2011, 42, 2795–2812. [Google Scholar] [CrossRef]
  35. Zhang, J.; Liu, Q.; Wang, D.; Zhang, Z. Soil microbial community, soil quality, and productivity along a chronosequence of Larix principis-rupprechtii forests. Plants 2023, 12, 2913. [Google Scholar] [CrossRef]
  36. Rawat, M.; Arunachalam, K.; Arunachalam, A.; Alatalo, J.; Pandey, R. Associations of plant functional diversity with carbon accumulation in a temperate forest ecosystem in the Indian Himalayas. Ecol. Indic. 2019, 98, 861–868. [Google Scholar] [CrossRef]
  37. Zhang, Y.; Zhao, J.; Xu, J.; Chai, Y.; Liu, P.; Quan, J.; Wu, X.; Li, C.; Yue, M. Effects of water availability on the relationships between hydraulic and economic traits in the Quercus wutaishanica forests. Front. Plant Sci. 2022, 13, 902509. [Google Scholar] [CrossRef]
  38. Zhang, J.; Li, M.; Cheng, R.; Ge, Z.; Liu, C.; Zhang, Z. Stand structure and functional traits determine productivity of Larix principis-rupprechtii forests. Forests 2024, 15, 924. [Google Scholar] [CrossRef]
  39. Huang, X.; Li, S.; Su, J. Selective logging enhances ecosystem multifunctionality via increase of functional diversity in a Pinus yunnanensis forest in Southwest China. For. Ecosyst. 2020, 7, 55. [Google Scholar] [CrossRef]
  40. Huxley, J.D.; White, C.T.; Humphries, H.C.; Weber, S.E.; Spasojevic, M.J. Plant functional traits are dynamic predictors of ecosystem functioning in variable environments. J. Ecol. 2023, 111, 2597–2613. [Google Scholar] [CrossRef]
  41. Villéger, S.; Mason, N.W.H.; Mouillot, D. New multidimensional functional diversity indices for a multifaceted framework in functional ecology. Ecology 2008, 89, 2290–2301. [Google Scholar] [CrossRef] [PubMed]
  42. Mason, N.W.H.; Mouillot, D.; Lee, W.G.; Wilson, J.B. Functional richness, functional evenness and functional divergence: The primary components of functional diversity. Oikos 2005, 111, 112–118. [Google Scholar] [CrossRef]
  43. Jiang, L.; Zayit, A.; Sattar, K.; Wang, S.; He, X.; Hu, D.; Wang, H.; Yang, J. The Influence of intraspecific trait variation on plant functional diversity and community assembly processes in an arid desert region of northwest China. Forests 2023, 14, 1536. [Google Scholar] [CrossRef]
  44. Xiao, Y.; Liu, M.; Miao, L.; Yang, C.; Wang, Q.; Wang, M. Plant diversity and ecosystem multifunctionality of different degraded grasslands in alpine meadows of Maqu. Ecol. Res. 2024, 39, 54–71. [Google Scholar] [CrossRef]
  45. Ramazanoglu, E.; Almarie, V.; Suzer, M.H.; Shan, J.; Wei, Z.; Cullu, M.A.; Bol, R.; Senbayram, M. Interactive effects of soil salinity and nitrogen fertilizer types on nitrous oxide and ammonia fluxes. Geoderma. Reg. 2024, 38, e00831. [Google Scholar] [CrossRef]
  46. Qiu, X.; Wang, H.; Peng, D.; Liu, X.; Yang, F.; Li, Z.; Cheng, S. Thinning drives C: N: P stoichiometry and nutrient resorption in Larix principis-rupprechtii plantations in North China. For. Ecol. Manag. 2020, 462, 117984. [Google Scholar] [CrossRef]
  47. Wang, H.; Wu, J.; Li, G.; Yan, L. Changes in soil carbon fractions and enzyme activities under different vegetation types of the northern Loess Plateau. Ecol. Evol. 2020, 10, 12211–12223. [Google Scholar] [CrossRef]
  48. Rahman, M.M.; Tsukamoto, J.; Tokumoto, Y.; Shuvo, M.A.R. The role of quantitative traits of leaf litter on decomposition and nutrient cycling of the forest ecosystems. J. For. Environ. Sci. 2013, 29, 38–48. [Google Scholar] [CrossRef]
  49. Deng, X.; Xiao, W.; Zeng, L.; Lei, L.; Xu, J.; Xin, X.; Pei, S. Trade-off of NSC allocation in response to the phosphorus limitation caused by increased stand age in Pinus massoniana. For. Ecol. Manag. 2024, 561, 121883. [Google Scholar] [CrossRef]
  50. Conradi, T.; Van Meerbeek, K.; Ordonez, A.; Svenning, J. Biogeographic historical legacies in the net primary productivity of Northern Hemisphere forests. Ecol. Lett. 2020, 23, 800–810. [Google Scholar] [CrossRef]
  51. Chen, Q.-L.; Ding, J.; Zhu, D.; Hu, H.-W.; Delgado-Baquerizo, M.; Ma, Y.-B.; He, J.-Z.; Zhu, Y.-G. Rare microbial taxa as the major drivers of ecosystem multifunctionality in long-term fertilized soils. Soil Biol. Biochem. 2020, 141, 107686. [Google Scholar] [CrossRef]
  52. Maestre, F.T.; Quero, J.L.; Gotelli, N.J.; Escudero, A.; Ochoa, V.; Delgado-Baquerizo, M.; García-Gómez, M.; Bowker, M.A.; Soliveres, S.; Escolar, C.; et al. Plant species richness and ecosystem multifunctionality in global drylands. Science 2012, 335, 214–218. [Google Scholar] [CrossRef] [PubMed]
  53. Sanaei, A.; Ali, A.; Yuan, Z.; Liu, S.; Lin, F.; Fang, S.; Ye, J.; Hao, Z.; Loreau, M.; Bai, E.; et al. Context-dependency of tree species diversity, trait composition and stand structural attributes regulate temperate forest multifunctionality. Sci. Total. Environ. 2021, 757, 143724. [Google Scholar] [CrossRef] [PubMed]
  54. Che, Y.; Jin, G. Plant-soil microbial diversity and structural attributes jointly dominate the multifunctionality of the temperate forest. Ecol. Indic. 2024, 166, 112282. [Google Scholar] [CrossRef]
  55. Manning, P.; Van Der Plas, F.; Soliveres, S.; Allan, E.; Maestre, F.T.; Mace, G.; Whittingham, M.J.; Fischer, M. Redefining ecosystem multifunctionality. Nat. Ecol. Evol. 2018, 2, 427–436. [Google Scholar] [CrossRef]
  56. Zhang, X.; Li, X.; Manzanedo, R.D.; D’Orangeville, L.; Lv, P.; Wang, C.; Xu, C.; Hou, M.; Huang, X.; Rademacher, T. High risk of growth cessation of planted larch under extreme drought. Environ. Res. Lett. 2021, 16, 014040. [Google Scholar] [CrossRef]
  57. Wang, T.; Wang, G.; Innes, J.L.; Seely, B.; Chen, B. ClimateAP: An application for dynamic local downscaling of historical and future climate data in Asia Pacific. Front. Agric. Sci. Eng. 2017, 4, 448. [Google Scholar] [CrossRef]
  58. Zheng, J.; Zhang, B.; Zhang, F.; Zhao, T.; Wang, Q.; Han, G.; Zhao, M. Effects of fencing on near-term ecosystem multifunctionality in a typical steppe in Inner Mongolia. Agric. Ecosyst. Environ. 2023, 342, 108238. [Google Scholar] [CrossRef]
  59. Grenié, M.; Gruson, H. fundiversity: Easy Computation of Functional Diversity Indices. 2024. Available online: https://funecology.github.io/fundiversity/ (accessed on 23 April 2025).
  60. Fox, J.; Weisberg, S. An R Companion to Applied Regression; Sage Publications: Thousand Oaks, CA, USA, 2019. [Google Scholar]
  61. Lefcheck, J.S. PiecewiseSEM: Piecewise structural equation modelling in r for ecology, evolution, and systematics. Methods Ecol. Evol. 2016, 7, 573–579. [Google Scholar] [CrossRef]
  62. R Core Team. R: A Language and Environment for Statistical Computing; R Foundation for Statistical Computing: Vienna, Austria, 2024. [Google Scholar]
  63. Brunner, A.; Forrester, D.I. Tree species mixture effects on stem growth vary with stand density—An analysis based on individual tree responses. For. Ecol. Manag. 2020, 473, 118334. [Google Scholar] [CrossRef]
  64. Wright, I.J.; Reich, P.B.; Westoby, M.; Ackerly, D.D.; Baruch, Z.; Bongers, F.; Cavender-Bares, J.; Chapin, T.; Cornelissen, J.H.C.; Diemer, M.; et al. The worldwide leaf economics spectrum. Nature 2004, 428, 821–827. [Google Scholar] [CrossRef]
  65. Li, X.; Wang, H.; Luan, J.; Chang, S.X.; Gao, B.; Wang, Y.; Liu, S. Functional diversity dominates positive species mixture effects on ecosystem multifunctionality in subtropical plantations. For. Ecosyst. 2022, 9, 100039. [Google Scholar] [CrossRef]
  66. Liu, Y.; Sui, X.; Hua, H.; Liu, X.; Chang, Q.; Xu, R.; Li, M.; Mu, L. Soil aggregate stability and organic carbon content among different forest types in temperate ecosystems in northeastern China. Forests 2024, 15, 279. [Google Scholar] [CrossRef]
  67. Xu, S.; Yang, Y.; Sun, G.; Zhang, Q.; Wang, Y.; Zeng, H.; Simpson, M.J.; Wang, J. Aridity affects soil organic carbon concentration and chemical stability by different forest types and soil processes across Chinese natural forests. Sci. Total. Environ. 2024, 944, 174002. [Google Scholar] [CrossRef] [PubMed]
  68. Li, F.L.; McCormack, M.L.; Liu, X.; Hu, H.; Feng, D.F.; Bao, W.K. Vertical fine-root distributions in five subalpine forest types shifts with soil properties across environmental gradients. Plant Soil 2020, 456, 129–143. [Google Scholar] [CrossRef]
  69. Luo, Y.; Cadotte, M.W.; Liu, J.; Burgess, K.S.; Tan, S.; Ye, L.; Zou, J.; Chen, Z.; Jiang, X.; Li, J.; et al. Multitrophic diversity and biotic associations influence subalpine forest ecosystem multifunctionality. Ecology 2022, 103, e3745. [Google Scholar] [CrossRef]
  70. Tilman, D.; Fargione, J.; Wolff, B.; D’Antonio, C.; Dobson, A.; Howarth, R.; Schindler, D.; Schlesinger, W.H.; Simberloff, D.; Swackhamer, D. Forecasting agriculturally driven global environmental change. Science 2001, 292, 281–284. [Google Scholar] [CrossRef]
  71. Li, J.; Hao, M.-H.; Fan, C.-Y.; Zhang, C.-Y.; Zhao, X.-H. Effect of tree species and functional diversity on ecosystem multifunctionality in temperate forests of northeast China. Chin. J. Plant Ecol. 2023, 47, 1507–1522. [Google Scholar] [CrossRef]
  72. Niklaus, P.A.; Baruffol, M.; He, J.; Ma, K.; Schmid, B. Can niche plasticity promote biodiversity-productivity relationships through increased complementarity? Ecology 2017, 98, 1104–1116. [Google Scholar] [CrossRef]
  73. Gross, N.; Bagousse-Pinguet, Y.L.; Liancourt, P.; Berdugo, M.; Gotelli, N.J.; Maestre, F.T. Functional trait diversity maximizes ecosystem multifunctionality. Nat. Ecol. Evol. 2017, 1, 0132. [Google Scholar] [CrossRef]
  74. Ivanova, N. Global overview of the application of the braun-blanquet approach in research. Forests 2024, 15, 937. [Google Scholar] [CrossRef]
  75. Yin, S.; Du, H.; Mao, F.; Li, X.; Zhou, G.; Xu, C.; Sun, J. Spatiotemporal patterns of net primary productivity of subtropical forests in China and its response to drought. Sci. Total. Environ. 2024, 913, 169439. [Google Scholar] [CrossRef] [PubMed]
  76. Villa, P.M.; Ali, A.; Martins, S.V.; Neto, S.N.D.; Rodrigues, A.C.; Teshome, M.; Carvalho, F.A.; Heringer, G.; Gastauer, M. Stand structural attributes and functional trait composition overrule the effects of functional divergence on aboveground biomass during Amazon forest succession. Forest Ecol. Manag. 2020, 477, 118481. [Google Scholar] [CrossRef]
  77. Fotis, A.T.; Murphy, S.J.; Ricart, R.D.; Krishnadas, M.; Whitacre, J.; Wenzel, J.W.; Queenborough, S.A.; Comita, L.S. Above-ground biomass is driven by mass-ratio effects and stand structural attributes in a temperate deciduous forest. J. Ecol. 2018, 106, 561–570. [Google Scholar] [CrossRef]
Figure 1. Soil conditions in the study area. OL, OF, and OH represent undecomposed, semi-decomposed, and coarse humus litter layers, respectively.
Forests 16 00745 g001
Figure 2. (a) The geographical location of study areas and sample plots and (b) three stand types. BP, Betula platyphylla pure forest; BL, B. platyphylla–Larix principis-rupprechtii mixed forest; LP, L. principis-rupprechtii pure forest.
Forests 16 00745 g002
Figure 3. Schematic diagram of the research method.
Forests 16 00745 g003
Figure 4. Differences between single functions and EMF among different forest types. Forest types include Betula platyphylla pure forest (BP), mixed B. platyphylla–Larix principis-rupprechtii forest (BL), and L. principis-rupprechtii pure forest (LP). SF, soil fertility maintenance; NC, nutrient cycling; SP, stand productivity; FDis, functional dispersion; FEve, functional evenness; FRic, functional richness; RaoQ, Rao’s quadratic entropy; EMF, ecosystem multifunctionality. The square brackets represent the comparison between the two forest types, with significant differences. *—p < 0.05, **—p < 0.01.
Forests 16 00745 g004
Figure 5. The number of individual functions exceeding specific thresholds for the three forest types, as calculated using the multiple-threshold approach. Forest types include Betula platyphylla pure forest (BP), mixed B. platyphylla–Larix principis-rupprechtii forest (BL), and L. principis-rupprechtii pure forest (LP).
Forests 16 00745 g005
Figure 6. The influencing factors of single ecosystem function and the Pearson correlation coefficient matrix for each ecosystem function: (a) biotic factors and (b) abiotic factors. The thickness of the lines is proportional to the coefficient of determination in the linear regression model. Solid line represents positive effect, while dashed line represents negative effect. Purple line indicates significant effects, and gray line indicates insignificant effects. NC, nutrient cycling function; SF, soil fertility maintaining ability; SP, stand productivity; FEve, functional evenness; FRic, functional richness; FDis, functional dispersion; RaoQ, Rao’s quadratic entropy; Sdba, the standard deviation of basal area; SoilPC1, soil nutrient content; MAT, the average temperature during the growing season; MAP, the average precipitation during the growing season. *—p < 0.05, **—p < 0.01, ***—p < 0.001.
Forests 16 00745 g006
Figure 7. Standardized regression coefficient of the linear model. Panels (ad) represent EMF at 25%, 50%, 75%, and 90% thresholds, respectively. EMF, ecosystem multifunctionality; SOC, the soil organic carbon; TN, total nitrogen; TP, total phosphorus; AN, available phosphorus; AP, available nitrogen; CWM, community weighted mean; SLA, specific leaf area; LDMC, leaf dry matter content; LNC, leaf nitrogen content; LPC, leaf phosphorus content; SP, stand productivity. Different colors represent different indicators. *—p < 0.05, **—p < 0.01, ***—p < 0.001.
Forests 16 00745 g007
Figure 8. Path diagram of the structural equation model between EMF and driving factors. The figure displays the effects of biotic and abiotic factors on forest EMF. Panels (ad) represent EMF at 25%, 50%, 75%, and 90% thresholds (EMF_25, EMF_50, EMF_75, and EMF_90), respectively. EMF, ecosystem multifunctionality; pH, soil pH; SoilPC1, soil nutrient content; Climate, a composite variable of MAT and MAP; RaoQ, Rao’s quadratic entropy index; TD, tree diversity; Sdba, the standard deviation of basal area. In the figure, red line represents a significant path (p < 0.05), black line represents non-significant path, solid line indicates positive impact, and dashed line represents negative impact. Model fit statistics: Chi-Squared = 3.814, p = 0.282, AICC = −111.471. *—p < 0.05, **—p < 0.01, ***—p < 0.001.
Forests 16 00745 g008
Figure 9. The direct and indirect influence of abiotic and biotic factors on EMF at different thresholds. Panels (ad) represent EMF at 25%, 50%, 75%, and 90% thresholds (EMF_25, EMF_50, EMF_75, and EMF_90), respectively. All abbreviations are as explained in Figure 8.
Forests 16 00745 g009
Table 1. Soil characteristics of the sampling plots.
Stand TypeSOC
(g/kg)
TN
(g/kg)
TP
(g/kg)
TK
(g/kg)
AN
(mg/kg)
AP
(mg/kg)
AK
(mg/kg)
pH
BP83.64 ± 7.693.84 ± 0.360.63 ± 0.0617.76 ± 0.68401.61 ± 34.1811.06 ± 1.00154.89 ± 11.816.38 ± 0.06
BL72.28 ± 7.683.34 ± 0.350.63 ± 0.0818.79 ± 0.69326.84 ± 34.597.78 ± 0.63163.66 ± 13.006.17 ± 0.06
LP49.82 ± 5.142.88 ± 0.190.48 ± 0.0522.16 ± 0.75308.32 ± 22.087.57 ± 0.48135.48 ± 7.446.26 ± 0.04
Note: SOC, the soil organic carbon; TN, total nitrogen; TP, total phosphorus; TK, soil total potassium; AN, available phosphorus; AP, available nitrogen; AK, available potassium; pH, soil pH.
Table 2. Basic stand information of the sampling plots.
Stand TypeAge (Years)Altitude (m)Mean DBH (cm)Mean Height (m)Density (Trees/ha)
BP341486 ± 3013.52 ± 1.1411.88 ± 0.73906 ± 103
BL391379 ± 3617.23 ± 1.2614.01 ± 0.791094 ± 233
LP331528 ± 6317.76 ± 1.4615.61 ± 1.091400 ± 223
Note: BP, Betula platyphylla pure forest; BL, B. platyphylla–Larix principis-rupprechtii mixed forest; LP, L. principis-rupprechtii pure forest.
Disclaimer/Publisher’s Note: The statements, opinions and data contained in all publications are solely those of the individual author(s) and contributor(s) and not of MDPI and/or the editor(s). MDPI and/or the editor(s) disclaim responsibility for any injury to people or property resulting from any ideas, methods, instructions or products referred to in the content.

