A Configurational Analysis of Green Development in Forestry Enterprises Based on the Technology–Organization–Environment (TOE) Framework


Abstract
1. Introduction
2. Literature Review
2.1. Corporate Development Efficiency Assessment Based on Three-Stage DEA
2.2. Research on Enterprise Development Pathways Using the TOE Framework and Dynamic QCA
- Hypothesis 1: The realization of green development in forestry enterprises results from the combined effects of multiple conditions rather than a single factor.
- Hypothesis 2: There are different configurations of condition variables for achieving high-level green development in forestry enterprises.
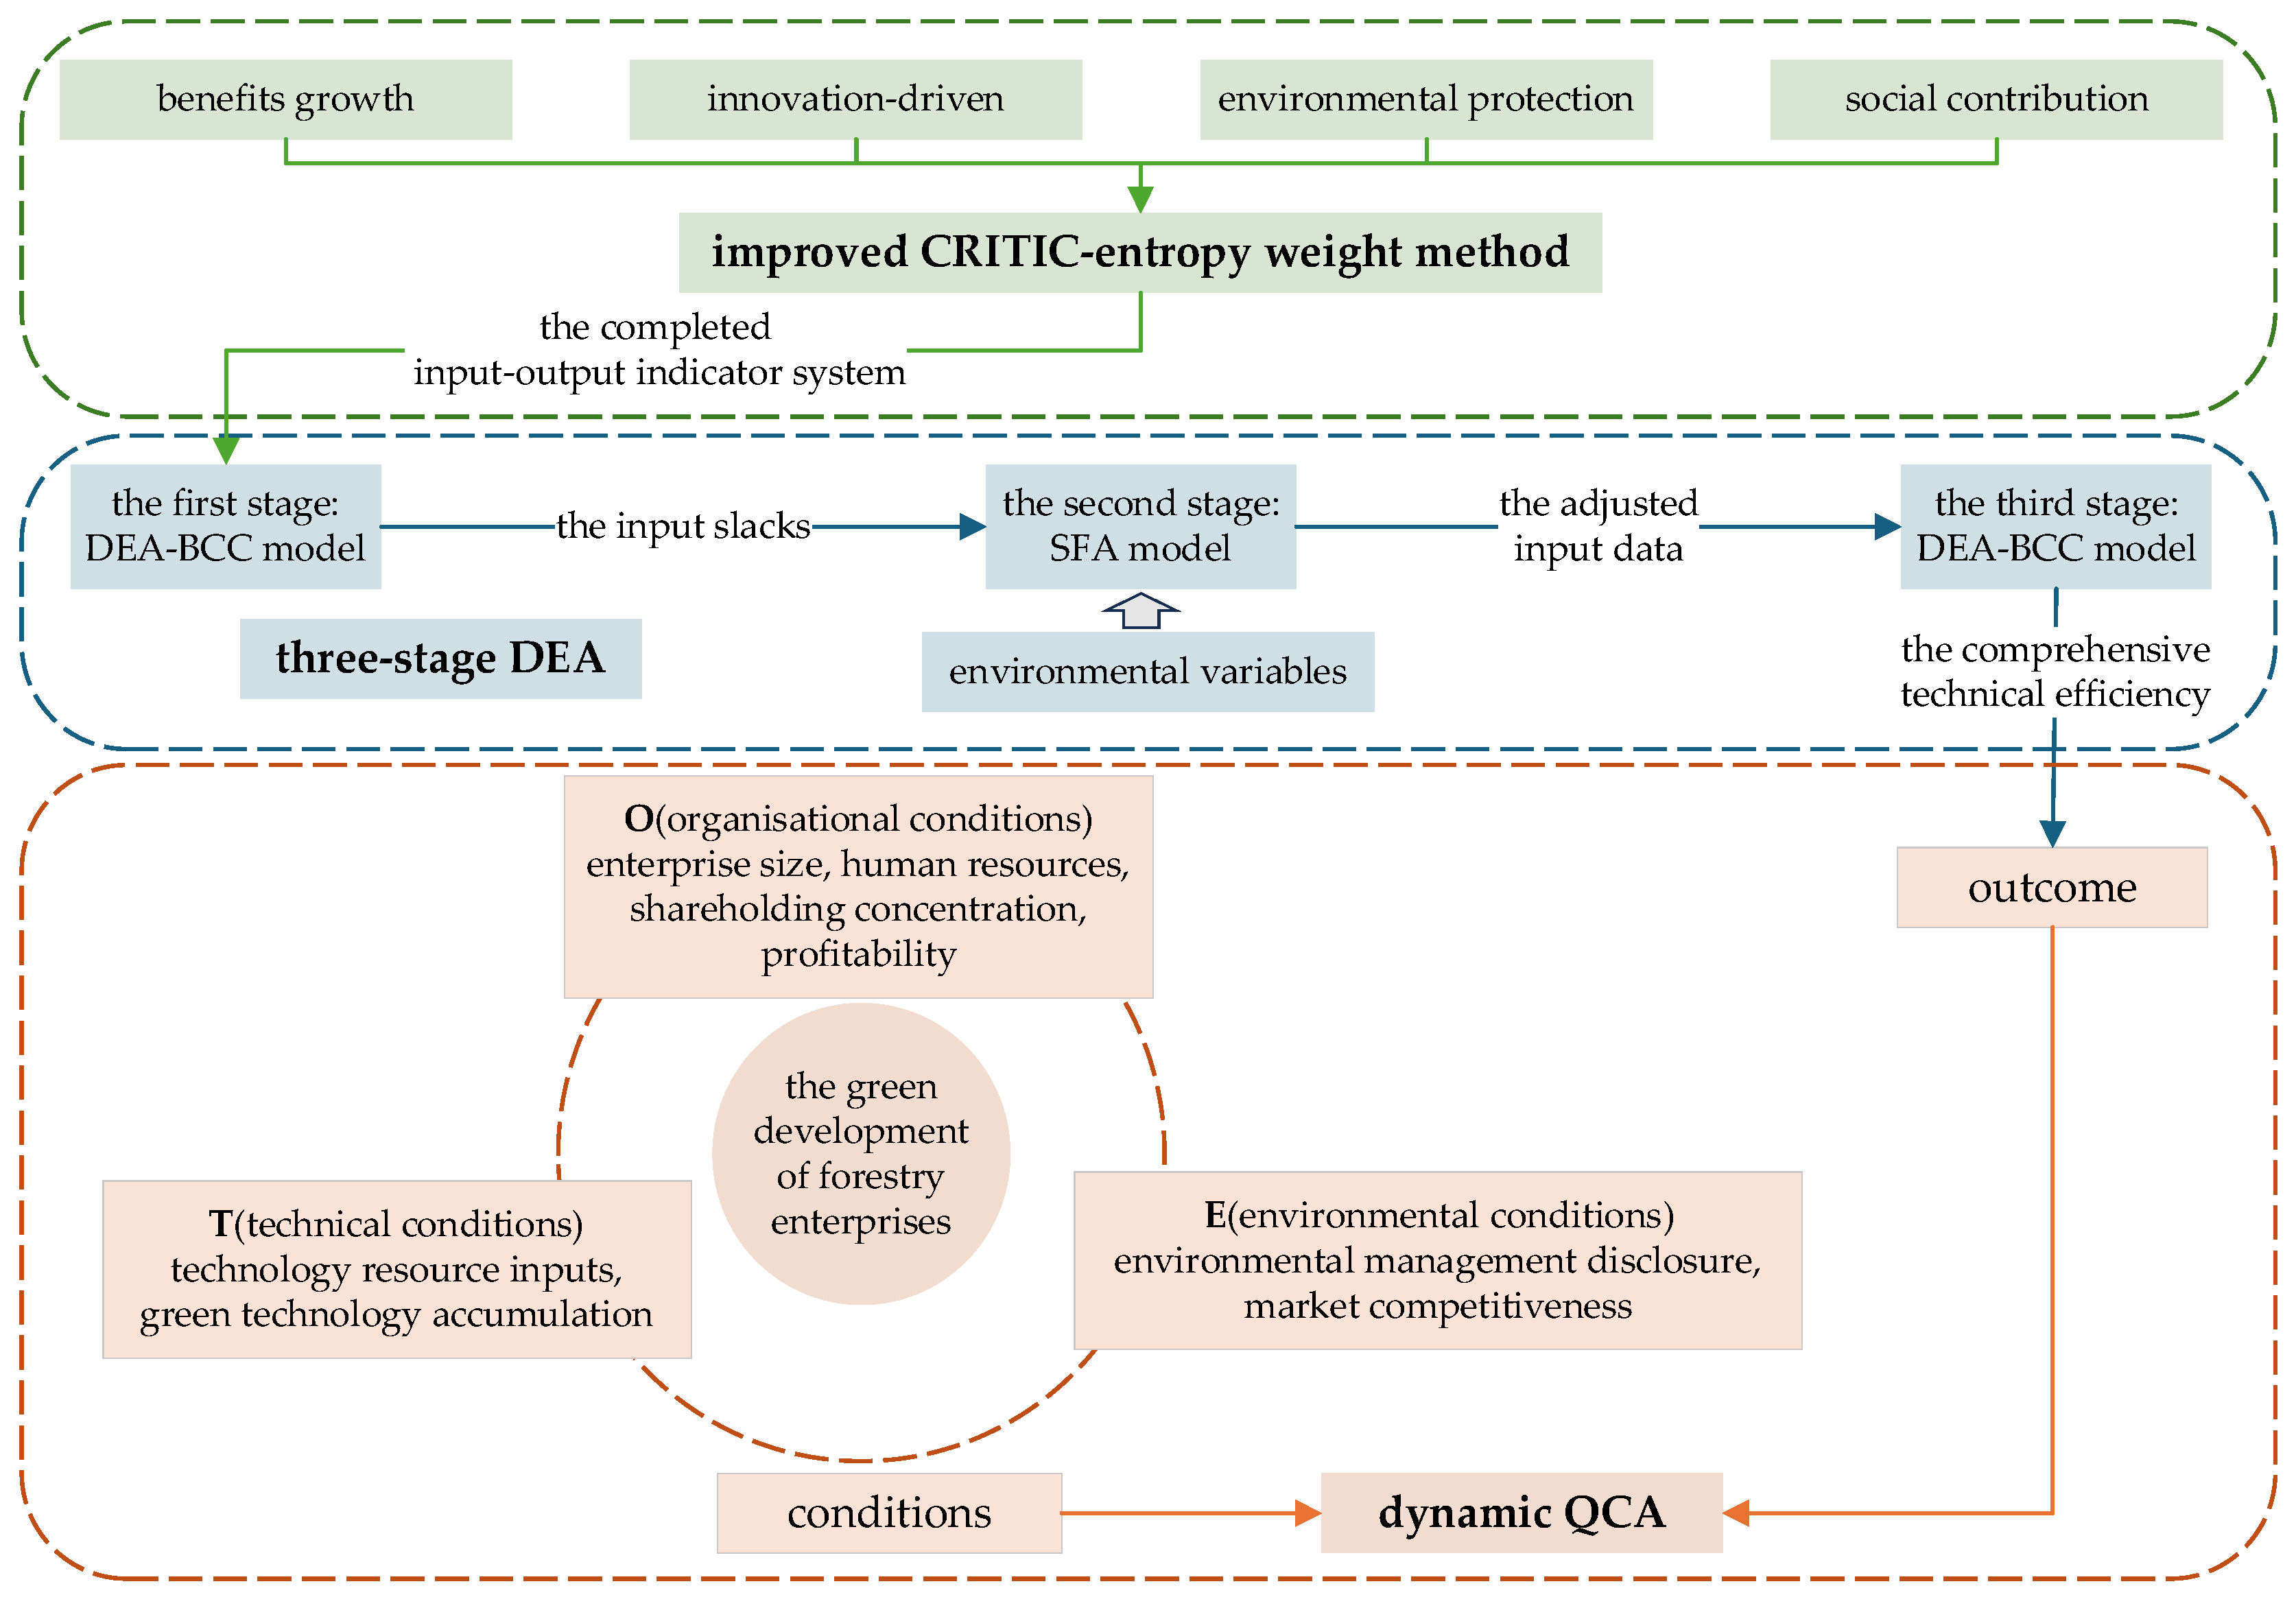
3. Materials and Methods
3.1. Research Objects and Data Sources
3.1.1. Research Objects
3.1.2. Data Sources
3.2. Research Methods
3.2.1. Improved CRITIC–Entropy Weight Method
Part 1: Normalization of Indicators
- Positive indicators:
- Negative indicators:
- Neutral indicators:
Part 2: Improved CRITIC–Entropy Weight Method
- The improved CRITIC method:
- The entropy weight method:
- The portfolio weight:
3.2.2. Three-Stage DEA Model
- 1.
- The first stage: the traditional DEA model
- 2.
- The second stage: SFA model
- 3.
- The third stage: the adjusted DEA model
3.2.3. Dynamic QCA
4. Development of the Indicator System
4.1. The Input–Output Indicator Framework
4.2. Environmental Variables
4.3. Dynamic QCA Causal Variables
- 1.
- Technological conditions:
- Investment in technical resources. Technology is a critical factor for enterprises to maintain a competitive edge in the market. Investment in research and development (R&D) serves as the foundation for enterprises to innovate processes and improve product quality, thereby reflecting their innovation capacity.
- Accumulation of green technology. A higher number of green patents not only demonstrates an enterprise’s strength and achievements in sustainable development but also highlights its proactive behavior to address environmental challenges.
- 2.
- Organizational conditions:
- Firm size. Large enterprises generally excel in resource acquisition and allocation, while small enterprises benefit from greater flexibility.
- Human resources. Highly educated personnel typically possess strong learning abilities and open-mindedness, enabling enterprises to navigate complex and dynamic market environments and adapt to evolving technologies.
- Equity concentration. Appropriate equity concentration ensures that decision-making bodies can make accurate strategic decisions while mitigating the risks of excessive concentration or overly dispersed equity.
- Profit-making capability. Strong profit-making capability directly reflects a company’s sound financial performance and provides essential funding to support its strategic initiatives.
- 3.
- Environmental conditions:
- Environmental management disclosure. This is a reflection of the company’s environmental transparency and helps build trust among stakeholders. Environmental disclosure positively impacts firm value, as evidenced by data from the environmental management disclosure tables of listed companies [43].
- Market competitiveness. The market competitiveness of a company affects its strategic decisions as well as the effectiveness of the company’s strategic implementation, and we measure this indicator with the Lerner index [44].
5. Results
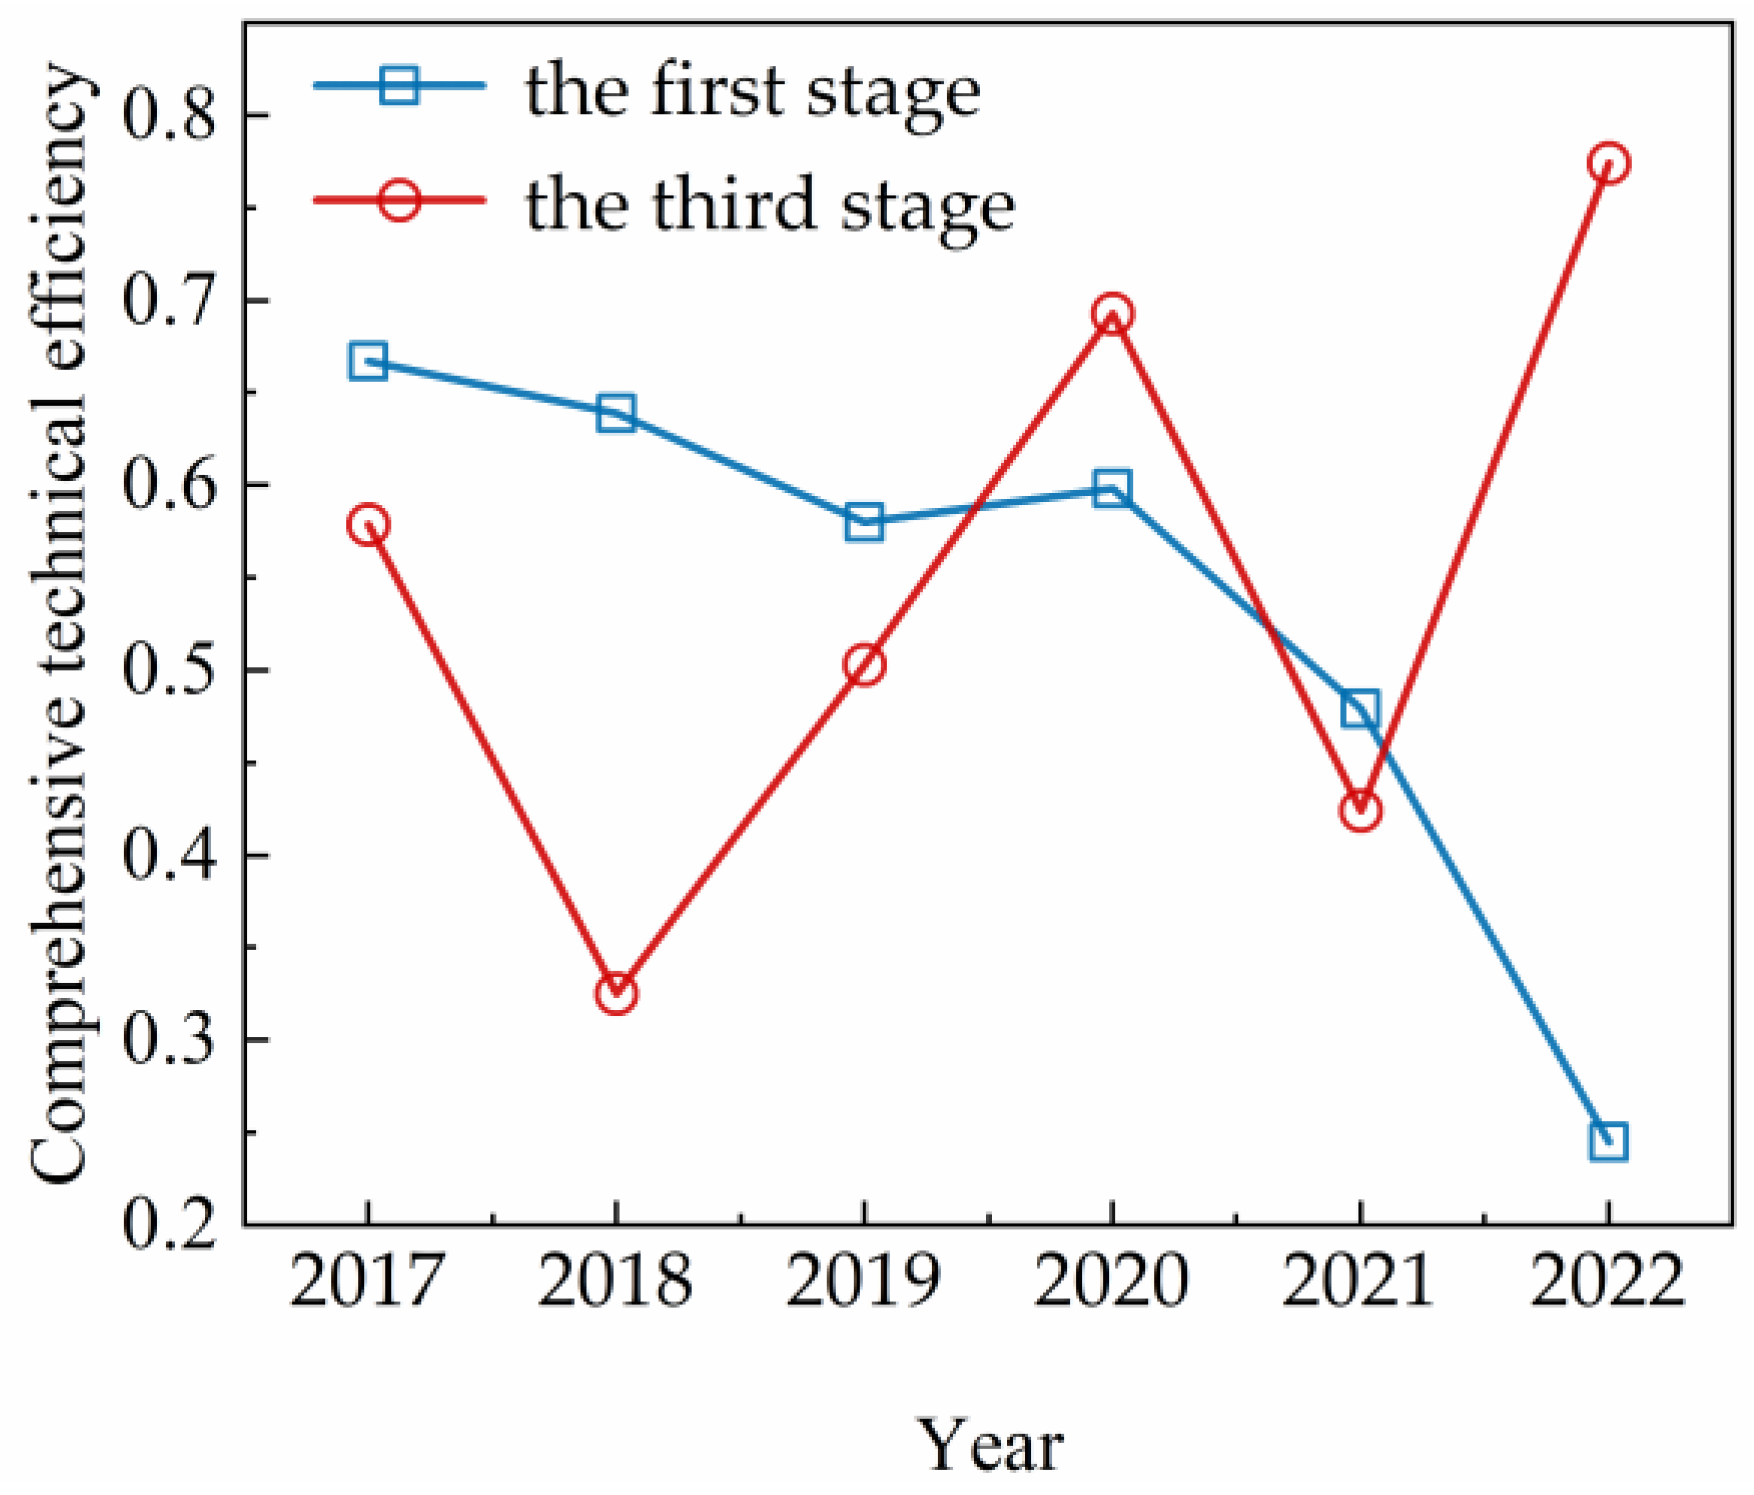
5.1. Three-Stage DEA Results
5.1.1. The First Stage: DEA-BCC
5.1.2. The Second Stage: SFA
5.1.3. The Third Stage: DEA-BCC
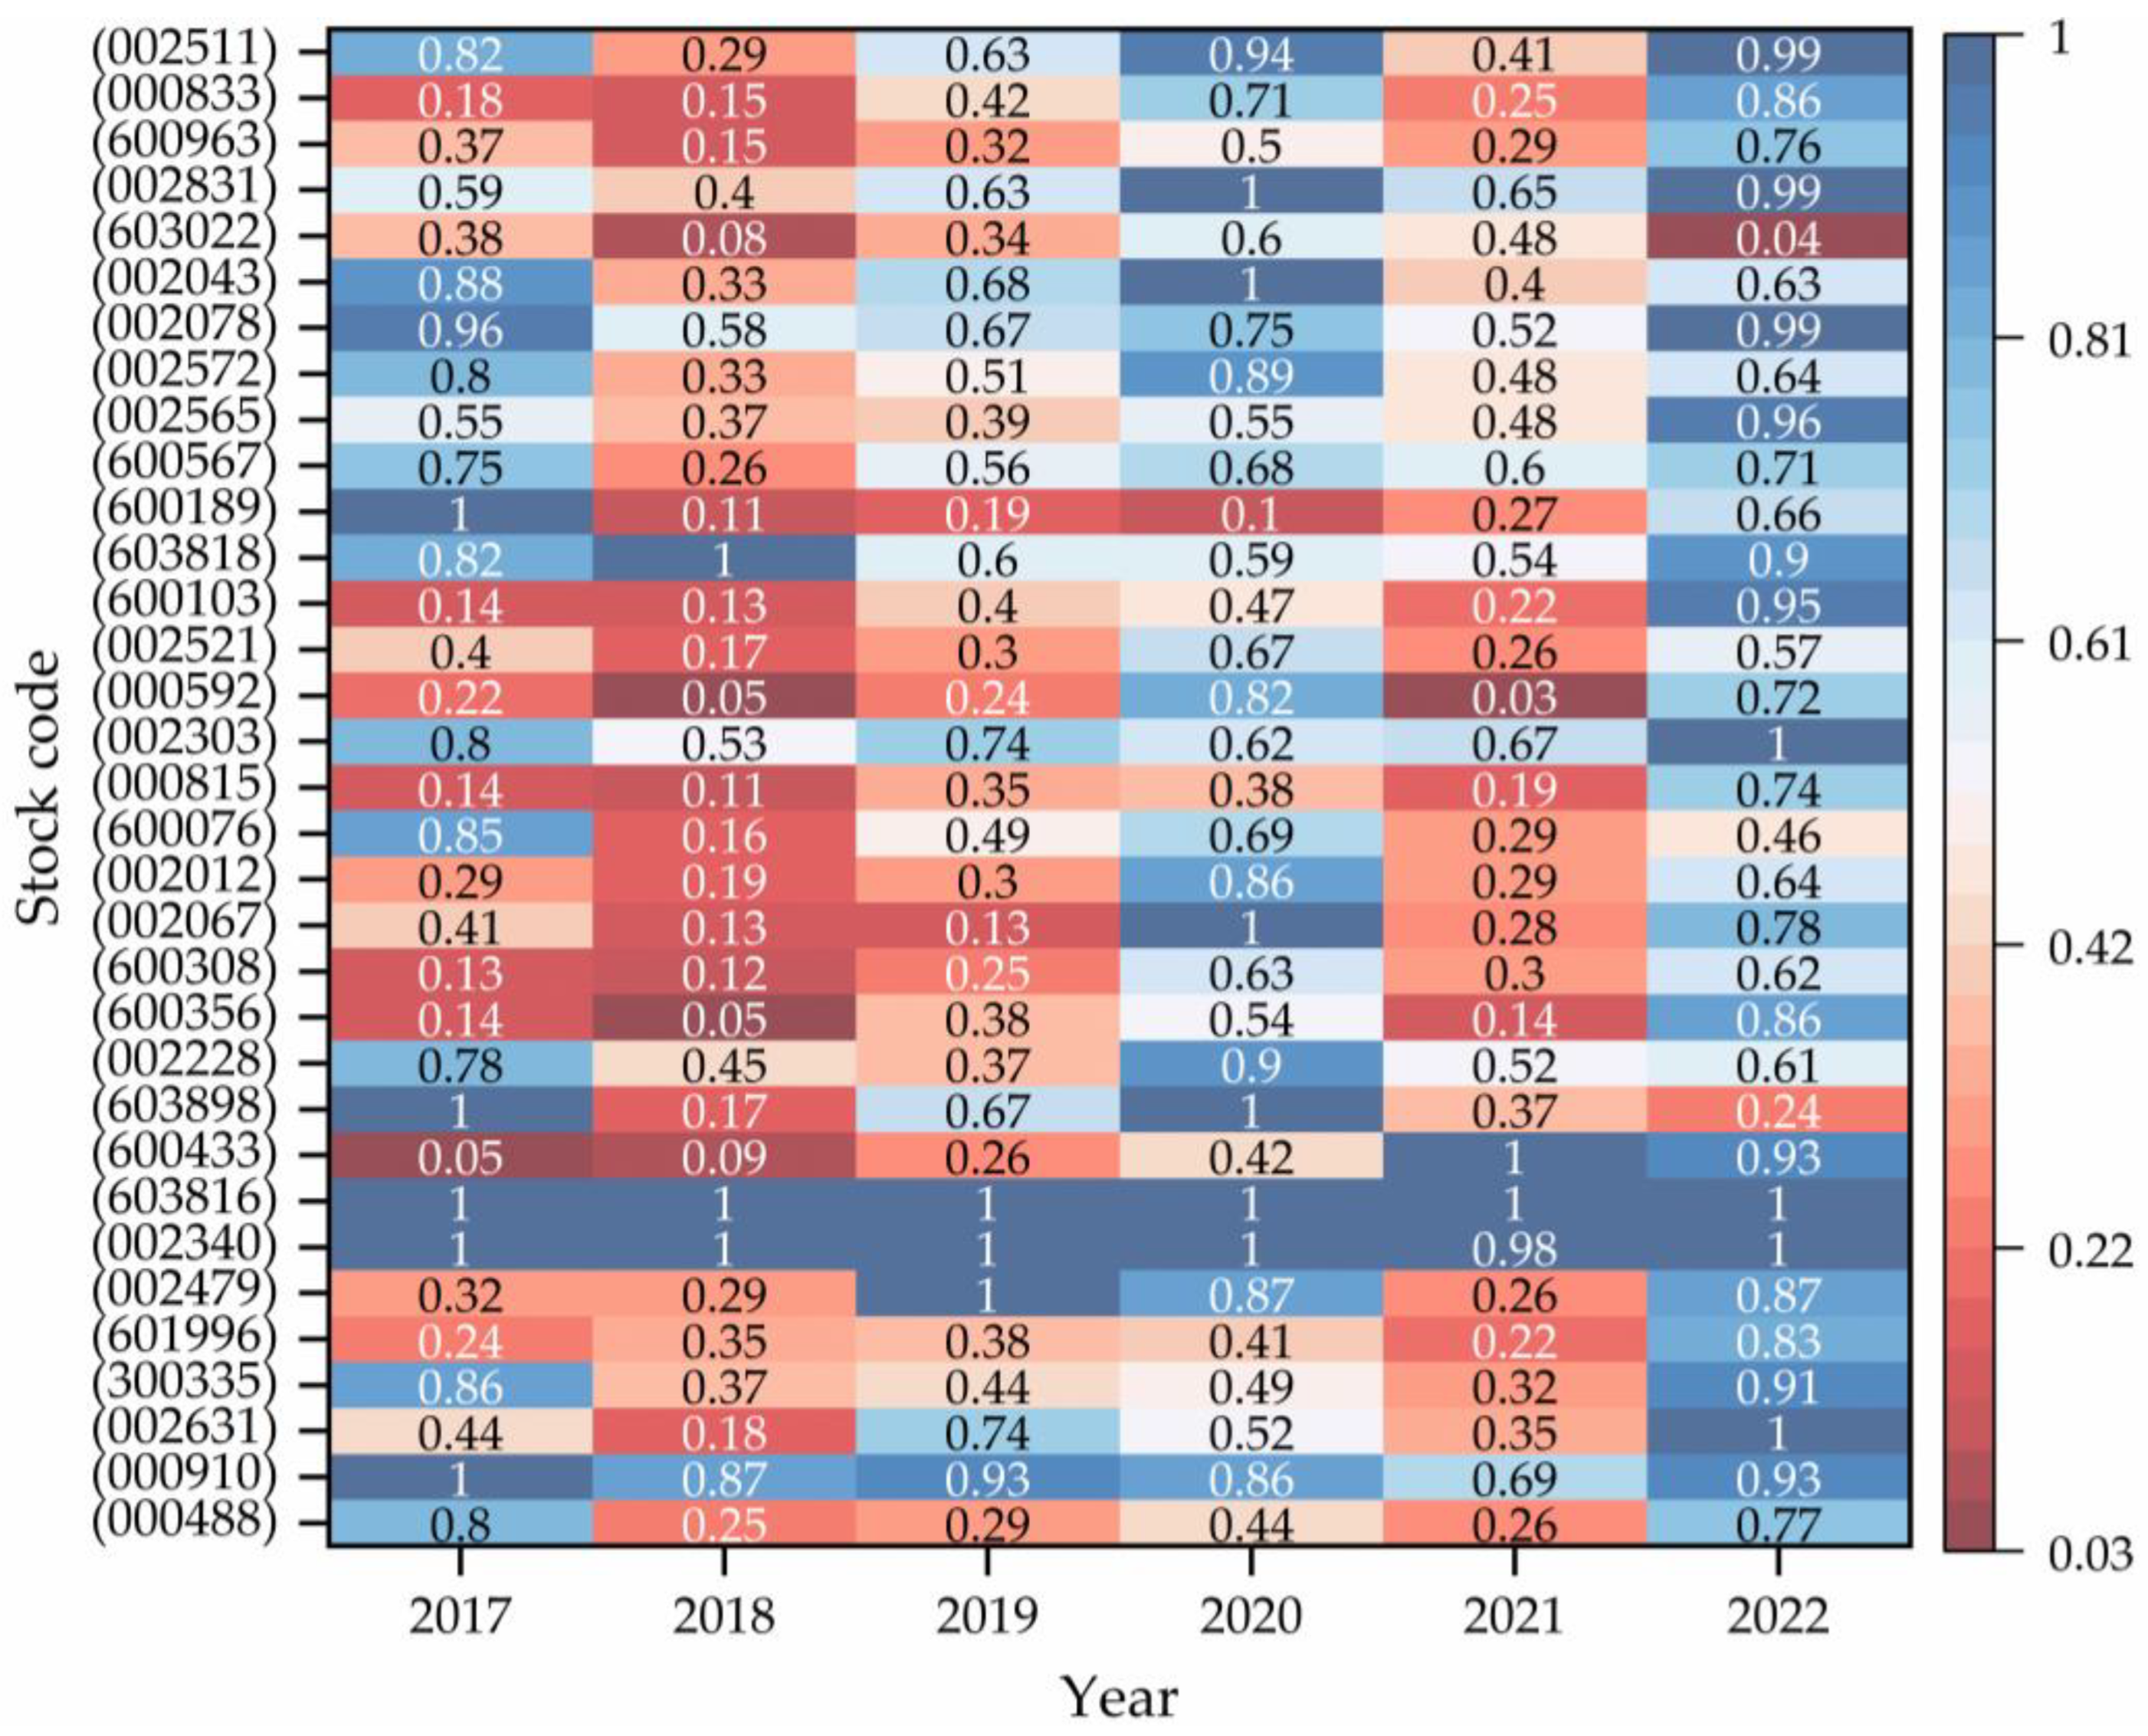
5.2. Analysis of Configuration Path
5.2.1. Calibration of Variables
5.2.2. Analysis of Necessary Conditions
5.2.3. Sufficiency Analysis of Conditional Configuration
- 1.
- Inter-Group Results
- 2.
- Intra-Group Results
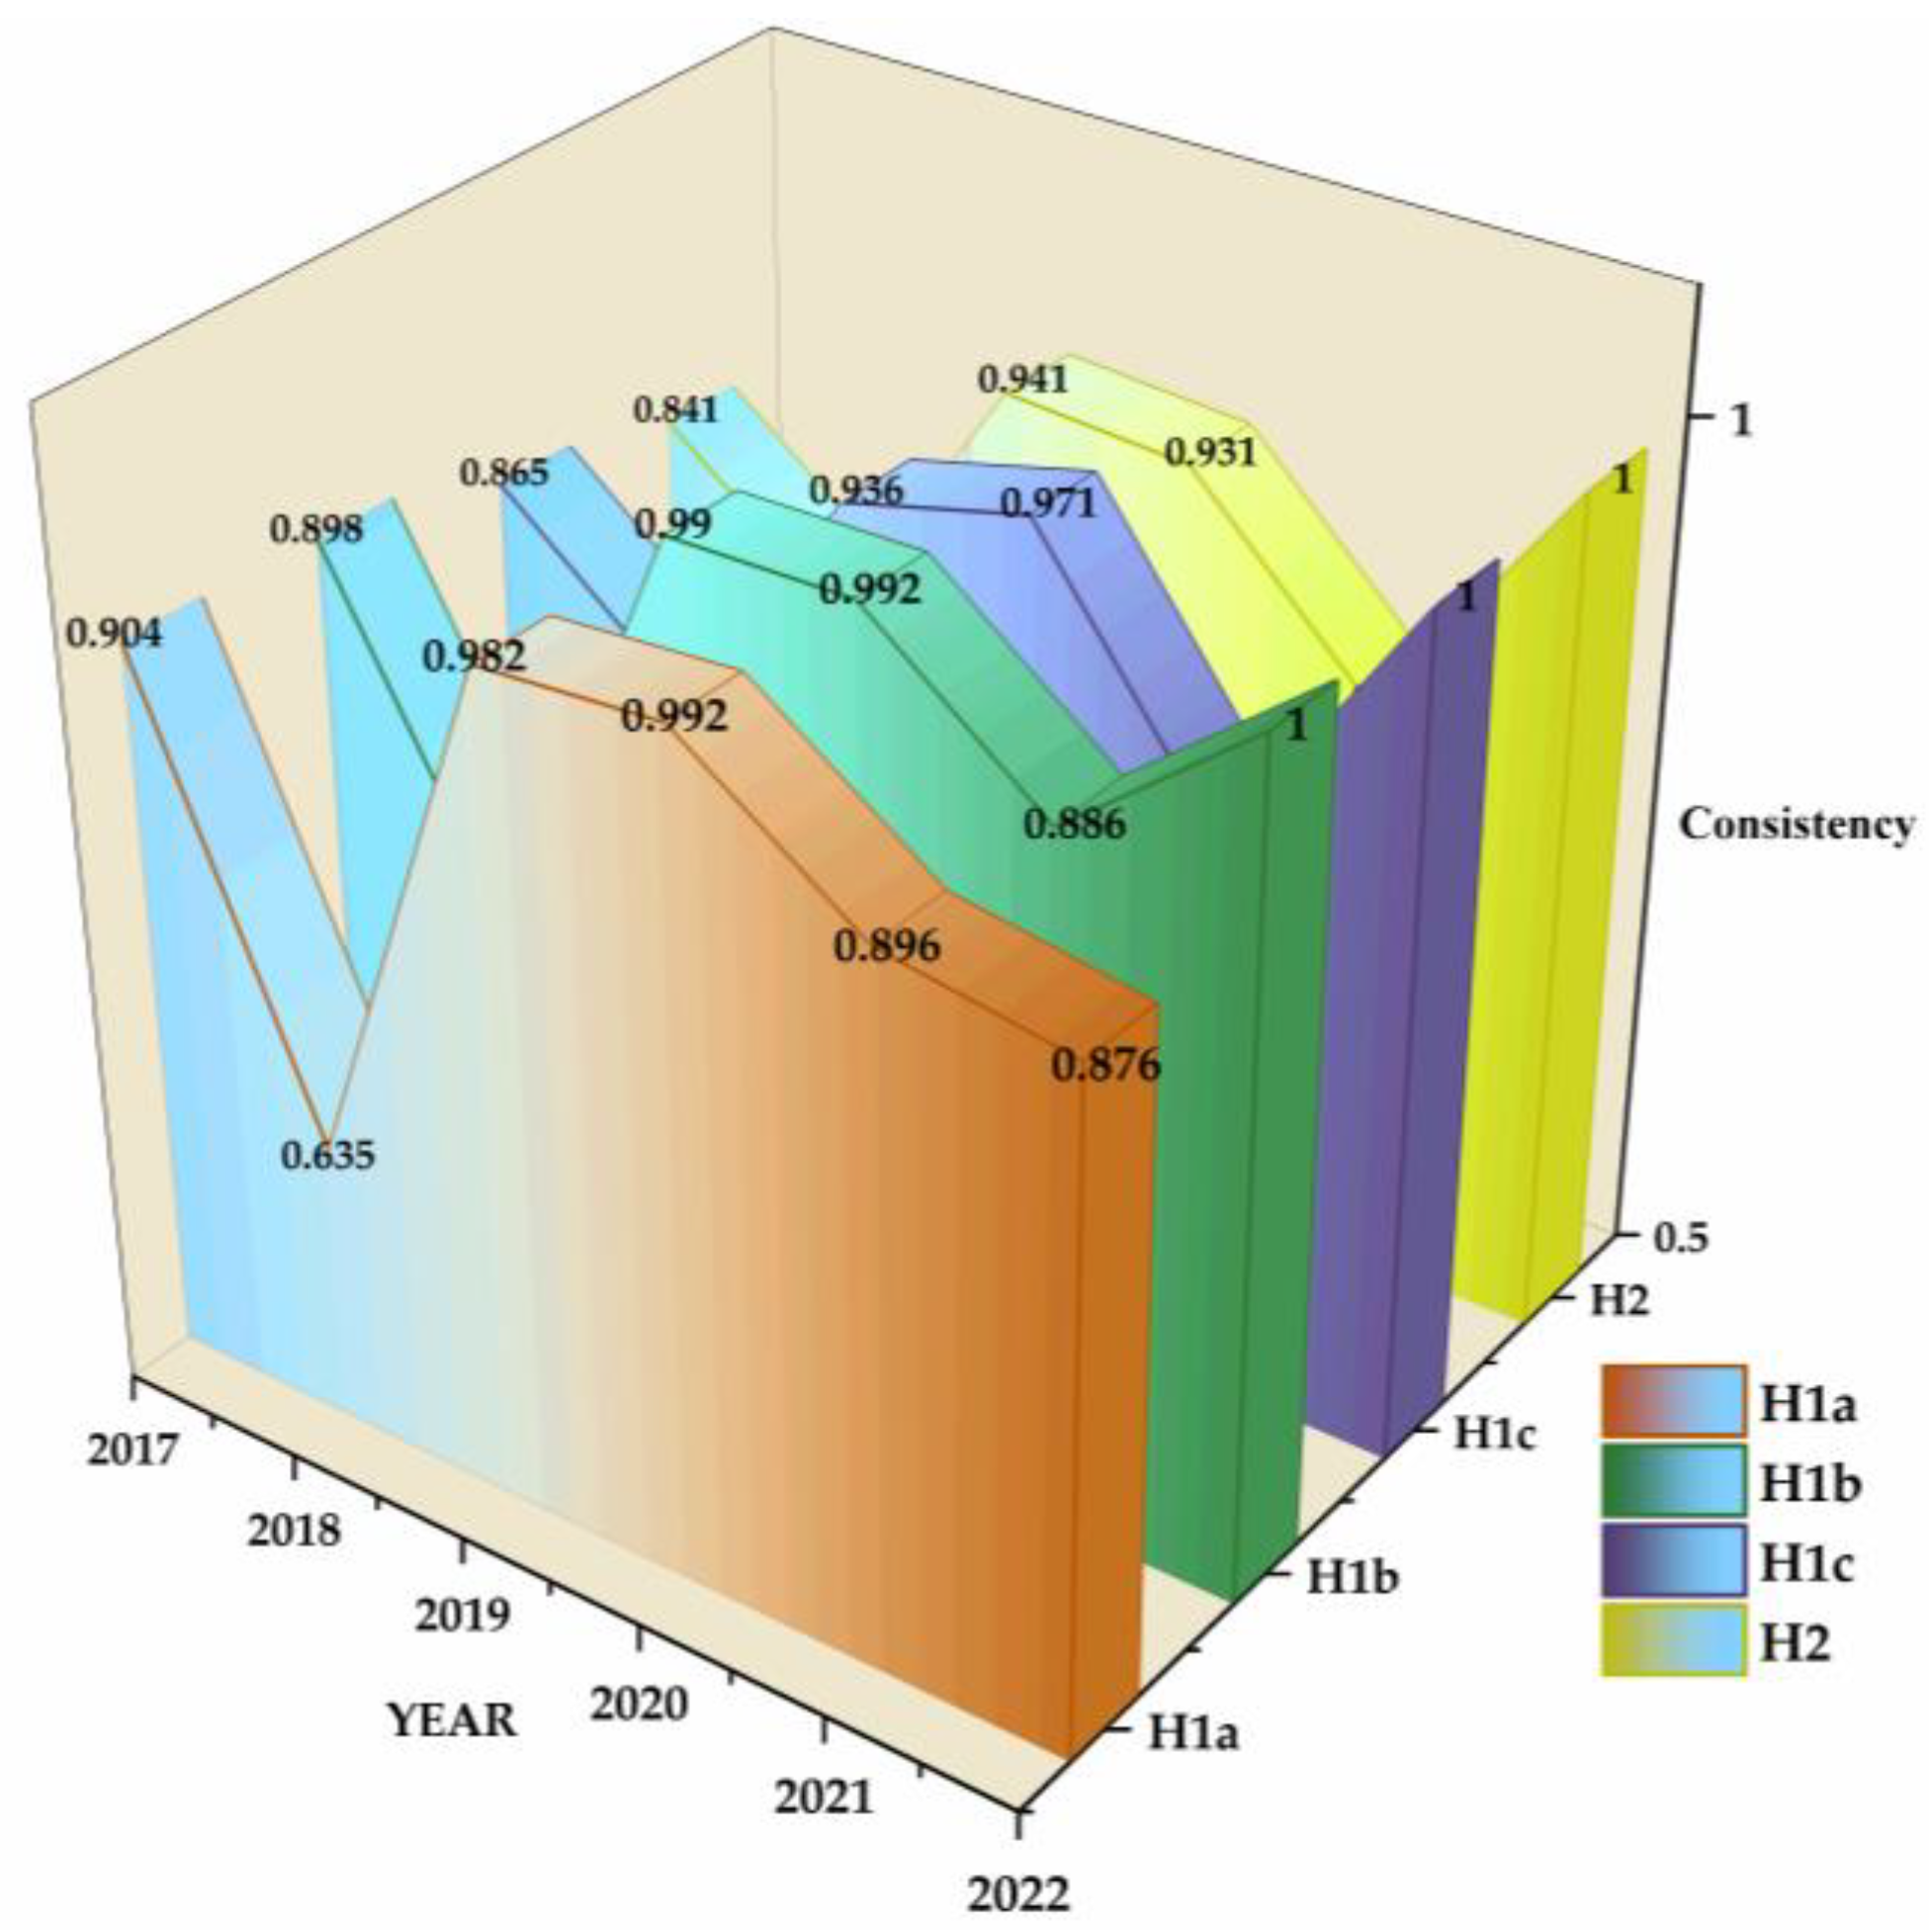
5.2.4. Robustness Test
6. Discussion
7. Conclusions
7.1. Research Conclusions
- 1.
- Analysis of Necessary Conditions.
- 2.
- Sufficiency Analysis of Conditional Configuration.
- 3.
- Dimensional analysis of space–time.
7.2. Suggestions
- To achieve green development, enterprises must strengthen their market position and enhance economic efficiency, as financial resources are crucial for this transition. Profitability emerged as a core condition across all four configurations, suggesting that enterprises maintaining a certain level of profitability are better positioned to succeed in green development. For instance, they can cultivate a green brand image, reinforce green supply chain management, enhance product value added, and improve both market competitiveness and financial performance. These strategic measures can transform green development into a sustainable competitive advantage for enterprises.
- Enterprises must deepen their commitment to technological research and innovation. Technological resource investment emerged as a core condition in the first three configurations, underscoring technology’s pivotal role in driving green development. However, firms should adopt a strategic approach to avoid the so-called “R&D trap.” It is essential to precisely define research priorities, ensuring that R&D investments align with existing technological capabilities, organizational structure, and market conditions. Furthermore, fostering industry–academia collaboration and facilitating the adoption of green technologies can accelerate technological advancement and enhance firms’ green innovation capacity.
- Enterprises must fully capitalize on their scale advantages to optimize resource allocation and promote sustainable growth. A crucial first step is to conduct a comprehensive internal assessment, allowing firms to strategically leverage their size and market position. For example, selectively recruiting specialized talent can help cultivate a workforce that not only possesses a deep understanding of green development principles but also demonstrates strong implementation capabilities. Beyond human capital, equity ownership structure plays a pivotal role in shaping decision-making dynamics and long-term strategic orientation—particularly in green development, which demands a forward-looking and sustained commitment. To address this, enterprises should refine their equity structures to align with their strategic objectives, ensuring both flexibility and long-term focus. Furthermore, establishing dedicated green development committees can serve as a transformative measure, enhancing decision-making efficiency and ensuring the effective execution of green development strategies.
7.3. Limitations and Prospects
Author Contributions
Funding
Data Availability Statement
Conflicts of Interest
References
- Ni, L.K.; Ahmad, S.F.; Alshammari, T.O.; Liang, H.S.; Alsanie, G.; Irshad, M.; Alyafi-AlZahri, R.; Binsaeed, R.H.; Al-Abyadh, M.H.A.; Abu Bakir, S.M.M.; et al. The role of environmental regulation and green human capital towards sustainable development: The mediating role of green innovation and industry upgradation. J. Clean. Prod. 2023, 421, 138497. [Google Scholar] [CrossRef]
- Lee, J.H.; Woo, J. Green New Deal Policy of South Korea: Policy Innovation for a Sustainability Transition. Sustainability 2020, 12, 10191. [Google Scholar] [CrossRef]
- Hickel, J.; Kallis, G. Is Green Growth Possible? New Political Econ. 2020, 25, 469–486. [Google Scholar] [CrossRef]
- Huang, J. Resources, innovation, globalization, and green growth: The BRICS financial development strategy. Geosci. Front. 2024, 15, 101741. [Google Scholar] [CrossRef]
- Huang, J.; Chen, J. Spatial spillover and impacting factors of green development: A study based on China’s provincial data. PLoS ONE 2023, 18, e0282865. [Google Scholar] [CrossRef]
- Su, J.L.; Ma, Z.Q.; Wang, Y.; Wang, X.X. Evaluation and Spatial Correlation Analysis of Green Economic Growth Efficiency in Yangtze River Delta Urban Agglomeration. Sustainability 2023, 15, 2583. [Google Scholar] [CrossRef]
- Ji, K.X.; Liu, X.T.; Xu, J. Digital Economy and the Sustainable Development of China’s Manufacturing Industry: From the Perspective of Industry Performance and Green Development. Sustainability 2023, 15, 5121. [Google Scholar] [CrossRef]
- Dai, X.W.; Chen, Y.; Zhang, C.Y.; He, Y.Q.; Li, J.J. Technological Revolution in the Field: Green Development of Chinese Agriculture Driven by Digital Information Technology (DIT). Agriculture 2023, 13, 199. [Google Scholar] [CrossRef]
- Yu, S.; Mu, Y.T. Evaluation of green development in mariculture: The case of Chinese oyster aquaculture. Aquaculture 2023, 576, 739838. [Google Scholar] [CrossRef]
- He, L.Y.; Sun, Y.M.; Xia, Y.F.; Zhong, Z.Q. Construction of a green development performance index of industrial enterprises: Based on the empirical study of 458 listed industrial enterprises in China. Ecol. Indic. 2021, 132, 108239. [Google Scholar] [CrossRef]
- Li, X.W.; Dai, J.C.; Li, J.R.; He, J.R.; Liu, X.; Huang, Y.C.; Shen, Q. Research on the Impact of Enterprise Green Development Behavior: A Meta-Analytic Approach. Behav. Sci. 2022, 12, 35. [Google Scholar] [CrossRef] [PubMed]
- Yu, X. An assessment of the green development efficiency of industrial parks in China: Based on non-desired output and non-radial DEA model. Struct. Change Econ. Dyn. 2023, 66, 81–88. [Google Scholar] [CrossRef]
- Lubsanova, N.B.; Maksanova, L.B.Z.; Eremko, Z.S.; Bardakhanova, T.B.; Mikheeva, A.S. The Eco-Efficiency of Russian Regions in North Asia: Their Green Direction of Regional Development. Sustainability 2022, 14, 12776. [Google Scholar] [CrossRef]
- Sadri, E.; Harsej, F.; Hajiaghaei-Keshteli, M.; Siyahbalaii, J. Evaluation of the components of intelligence and greenness in Iranian ports based on network data envelopment analysis (DEA) approach. J. Model. Manag. 2022, 17, 1008–1027. [Google Scholar] [CrossRef]
- Song, Q.; Chen, X.H.; Gu, H. How Technological, Organizational, and Environmental Factors Drive Enterprise Digital Innovation: Analysis Based on the Dynamic FsQCA Approach. Sustainability 2023, 15, 12248. [Google Scholar] [CrossRef]
- Shang, M.; Jia, C.J.; Zhong, L.L.; Cao, J.W. What determines the performance of digital transformation in manufacturing enterprises? A study on the linkage effects based on fs/QCA method. J. Clean. Prod. 2024, 450, 141856. [Google Scholar] [CrossRef]
- Farrell, M.J. The measurement of productive efficiency. J. R. Stat. Soc. Ser. Stat. Soc. 1957, 120, 253–281. [Google Scholar] [CrossRef]
- Zhao, H.; Zhao, H.; Guo, S. Operational efficiency of Chinese provincial electricity grid enterprises: An evaluation employing a three-stage data envelopment analysis (DEA) model. Sustainability 2018, 10, 3168. [Google Scholar] [CrossRef]
- Mehrotra, A.; Agarwal, R. Analysing impact of IT investments on banks’ performance using multi-stage DEA. Int. J. Inf. Decis. Sci. 2023, 15, 201–220. [Google Scholar] [CrossRef]
- Torres-Pruñonosa, J.; San-Jose, L.; Clemente-Almendros, J.A.; Retolaza, J.L. Are listed banks only pretending to be more social? Socio-Econ. Plan. Sci. 2024, 95, 101997. [Google Scholar] [CrossRef]
- Sun, J.; Rosli, A.B.; Daud, A. Operational Efficiency of Pharmaceutical Companies in China: Based on Three-Stage DEA with Undesirable Outputs. Sustainability 2025, 17, 207. [Google Scholar] [CrossRef]
- Zhou, G.; Xu, Y.; Zhang, F. Measurement of innovation efficiency in logistic enterprises: Evidence from China based on the three-stage DEA-Malmquist index model approach. Am. J. Econ. Sociol. 2024, 83, 331–381. [Google Scholar] [CrossRef]
- Hajiagha, S.H.R.; Amoozad Mahdiraji, H.; Hashemi, S.S.; Garza-Reyes, J.A.; Joshi, R. Public Hospitals Performance Measurement through a Three-Staged Data Envelopment Analysis Approach: Evidence from an Emerging Economy. Cybern. Syst. 2023, 54, 1–26. [Google Scholar] [CrossRef]
- Guerrini, A.; Romano, G.; Campedelli, B.; Moggi, S.; Leardini, C. Public vs. Private in Hospital Efficiency: Exploring Determinants in a Competitive Environment. Int. J. Public Adm. 2018, 41, 181–189. [Google Scholar] [CrossRef]
- Kumar Bhardwaj, A.; Garg, A.; Gajpal, Y. Determinants of Blockchain Technology Adoption in Supply Chains by Small and Medium Enterprises (SMEs) in India. Math. Probl. Eng. 2021, 2021, 5537395. [Google Scholar] [CrossRef]
- Wong, L.W.; Leong, L.Y.; Hew, J.J.; Tan, G.W.H.; Ooi, K.B. Time to seize the digital evolution: Adoption of blockchain in operations and supply chain management among Malaysian SMEs. Int. J. Inf. Manag. 2020, 52, 101997. [Google Scholar] [CrossRef]
- Abed, S.S. Social commerce adoption using TOE framework: An empirical investigation of Saudi Arabian SMEs. Int. J. Inf. Manag. 2020, 53, 102118. [Google Scholar] [CrossRef]
- Maroufkhani, P.; Wan Ismail, W.K.; Ghobakhloo, M. Big data analytics adoption model for small and medium enterprises. J. Sci. Technol. Policy Manag. 2020, 11, 171–201. [Google Scholar] [CrossRef]
- Mikalef, P.; Pateli, A.; Batenburg, R.S.; Van De Wetering, R. Purchasing alignment under multiple contingencies: A configuration theory approach. Ind. Manag. Data Syst. 2015, 115, 625–645. [Google Scholar] [CrossRef]
- Speldekamp, D.; Knoben, J.; Saka-Helmhout, A. Clusters and firm-level innovation: A configurational analysis of agglomeration, network and institutional advantages in European aerospace. Res. Policy 2020, 49, 103921. [Google Scholar] [CrossRef]
- Mas-Machuca, M.; Akhmedova, A.; Marimon, F. Quality management: A compulsory requirement to achieve effectiveness. Total Qual. Manag. Bus. Excell. 2021, 32, 220–239. [Google Scholar] [CrossRef]
- Jiang, H.J.; Cui, Z.P.; Yin, H.; Yang, Z.B. BIM Performance, Project Complexity, and User Satisfaction: A QCA Study of 39 Cases. Adv. Civ. Eng. 2021, 2021, 6654851. [Google Scholar] [CrossRef]
- Liu, Q.; Kim, Y.G. Exploring the Path of Green Innovation and High-Quality Development of Influential Regional Enterprises Based on the Analysis of the Dynamic QCA Method and MATLAB Sustainability Prediction. Systems 2024, 12, 232. [Google Scholar] [CrossRef]
- Li, L.; Zeng, Y.; Xia, D. How Does the Digital Innovation Ecosystem Enable Green Regional Development? A Dynamic QCA Study in China. Systems 2024, 12, 551. [Google Scholar] [CrossRef]
- Lu, H.A.; Zhao, Y.M.; Zhou, X.; Wei, Z.K. Selection of Agricultural Machinery Based on Improved CRITIC-Entropy Weight and GRA-TOPSIS Method. Processes 2022, 10, 266. [Google Scholar] [CrossRef]
- Zafar, S.; Alamgir, Z.; Rehman, M.H. An effective blockchain evaluation system based on entropy-CRITIC weight method and MCDM techniques. Peer Peer Netw. Appl. 2021, 14, 3110–3123. [Google Scholar] [CrossRef]
- Fried, H.O.; Lovell, C.K.; Schmidt, S.S.; Yaisawarng, S. Accounting for environmental effects and statistical noise in data envelopment analysis. J. Product. Anal. 2002, 17, 157–174. [Google Scholar] [CrossRef]
- Banker, R.D.; Charnes, A.; Cooper, W.W. Some models for estimating technical and scale inefficiencies in data envelopment analysis. Manag. Sci. 1984, 30, 1078–1092. [Google Scholar] [CrossRef]
- Wang, Z.; Liu, Q.; Zhang, B. What kinds of building energy-saving retrofit projects should be preferred? Efficiency evaluation with three-stage data envelopment analysis (DEA). Renew. Sustain. Energy Rev. 2022, 161, 112392. [Google Scholar] [CrossRef]
- Qiu, L.; Yu, R.; Hu, F.; Zhou, H.; Hu, H. How can China’s medical manufacturing listed firms improve their technological innovation efficiency? An analysis based on a three-stage DEA model and corporate governance configurations. Technol. Forecast. Soc. Change 2023, 194, 122684. [Google Scholar] [CrossRef]
- Rihoux, B.; Marx, A. Qualitative Comparative Analysis at 25: State of Play and Agenda. Political Res. Q. 2013, 66, 167–171. [Google Scholar] [CrossRef]
- Beynon, M.J.; Jones, P.; Pickernell, D. Country-level entrepreneurial attitudes and activity through the years: A panel data analysis using fsQCA. J. Bus. Res. 2020, 115, 443–455. [Google Scholar] [CrossRef]
- Li, Z.; Liao, G.; Albitar, K. Does corporate environmental responsibility engagement affect firm value? The mediating role of corporate innovation. Bus. Strategy Environ. 2020, 29, 1045–1055. [Google Scholar] [CrossRef]
- Peress, J. Product Market Competition, Insider Trading, and Stock Market Efficiency. J. Financ. 2010, 65, 1–43. [Google Scholar] [CrossRef]
- Fiss, P.C. Building Better Causal Theories: A Fuzzy Set Approach to Typologies in Organization Research. Acad. Manag. J. 2011, 54, 393–420. [Google Scholar] [CrossRef]
- Zeng, F.J.; Chen, Y.Z.; Wei, B.; Wang, P.; Yang, S.Q. Exploring the Multiple Paths of Digital Government Development: A Dynamic QCA Analysis Based on Organizational Transformation. IEEE Access 2024, 12, 18451–18472. [Google Scholar] [CrossRef]
- Fan, Z.T.; Meng, Q.G.; Wei, N. Fiscal Slack or Environmental Pressures: Which Matters More for Technological Innovation Assimilation? A Configurational Approach. Int. Public Manag. J. 2020, 23, 380–404. [Google Scholar] [CrossRef]
- Weng, D.; Huang, Y.; Dai, Y. How Can State-Owned Forest Farms Promote Sustainable Forest–Village Cooperation? A Configuration Analysis Based on the Resource Orchestration Perspective. Forests 2025, 16, 154. [Google Scholar] [CrossRef]
- Schneider, M.R.; Schulze-Bentrop, C.; Paunescu, M. Mapping the institutional capital of high-tech firms: A fuzzy-set analysis of capitalist variety and export performance. J. Int. Bus. Stud. 2010, 41, 246–266. [Google Scholar] [CrossRef]
- Fan, X.N.; Ren, S.N.; Liu, Y. The Driving Factors of Green Technology Innovation Efficiency-A Study Based on the Dynamic QCA Method. Sustainability 2023, 15, 9845. [Google Scholar] [CrossRef]
- Greckhamer, T. CEO compensation in relation to worker compensation across countries: The configurational impact of country-level institutions. Strateg. Manag. J. 2016, 37, 793–815. [Google Scholar] [CrossRef]
- Li, Y.; You, X.; Sun, X.; Chen, J. Dynamic assessment and pathway optimization of agricultural modernization in China under the sustainability framework: An empirical study based on dynamic QCA analysis. J. Clean. Prod. 2024, 479, 144072. [Google Scholar] [CrossRef]
- Wang, M.X.; Zhao, H.H.; Cui, J.X.; Fan, D.; Lv, B.; Wang, G.; Li, Z.H.; Zhou, G.J. Evaluating green development level of nine cities within the Pearl River Delta, China. J. Clean. Prod. 2018, 174, 315–323. [Google Scholar] [CrossRef]
- Long, R.; Li, H.; Wu, M.; Li, W. Dynamic evaluation of the green development level of China’s coal-resource-based cities using the TOPSIS method. Resour. Policy 2021, 74, 102415. [Google Scholar] [CrossRef]
- Liu, D.; Jin, J.; Zhang, X.; Qiu, X.; He, R.; Yang, J. Assessment of the green development level and the identification of obstacles to grass-based livestock husbandry in the farming–pastoral ecotone of northern China. Ecol. Inform. 2025, 87, 103112. [Google Scholar] [CrossRef]
- Jiang, Q.; Liu, Z.; Liu, W.; Li, T.; Cong, W.; Zhang, H.; Shi, J. A principal component analysis based three-dimensional sustainability assessment model to evaluate corporate sustainable performance. J. Clean. Prod. 2018, 187, 625–637. [Google Scholar] [CrossRef]


| Name | Stock Code | Location (City, Province) |
|---|---|---|
| Shandong Chenming Paper Holdings Limited | 000488 | Weifang, Shandong |
| Zhongfu Straits (Pingtan) Development Company Limited | 000592 | Fuzhou, Fujian |
| Mcc Meili Cloud Computing Industry Investment Co., Ltd. | 000815 | Zhongwei, Ningxia |
| Guangxi Yuegui Guangye Holdings Co., Ltd. | 000833 | Guigang, Guangxi |
| Dare Power Dekor Home Co., Ltd. | 000910 | Zhenjiang, Jiangsu |
| Zhejiang Kan Specialities Material Co., Ltd. | 002012 | Lishui, Zhejiang |
| Dehua Tb New Decoration Material Co., Ltd. | 002043 | Huzhou, Zhejiang |
| Zhejiang Jingxing Paper Joint Stock Co., Ltd. | 002067 | Jiaxing, Zhejiang |
| Shandong Sun Paper Co., Ltd. | 002078 | Jining, Shandong |
| Xiamen Hexing Packaging Printing Co., Ltd. | 002228 | Xiamen, Fujian |
| Mys Group Co., Ltd. | 002303 | Shenzhen, Guangdong |
| Gem Co., Ltd. | 002340 | Shenzhen, Guangdong |
| Zhejiang Fuchunjiang Environmental Thermoelectric Co., Ltd. | 002479 | Hangzhou, Zhejiang |
| C&S Paper Co., Ltd. | 002511 | Zhongshan, Guangdong |
| Qifeng New Material Co., Ltd. | 002521 | Zibo, Shandong |
| Shanghai Shunho New Materials Technology Co., Ltd. | 002565 | Shanghai |
| Suofeiya Home Collection Co. Ltd. | 002572 | Guangzhou, Guangdong |
| Der Future Science And Technology Holding Group Co., Ltd. | 002631 | Suzhou, Jiangsu |
| Shenzhen Yuto Packaging Technology Co., Ltd. | 002831 | Shenzhen, Guangdong |
| Guangzhou Devotion Thermal Technology Co., Ltd. | 300335 | Guangzhou, Guangdong |
| Kangxin New Materials Co., Ltd. | 600076 | Weifang, Shandong |
| Fujian Qingshan Paper Industry Co., Ltd. | 600103 | Fuzhou, Fujian |
| Jilin Quanyangquan Co., Ltd. | 600189 | Changchun, Jilin |
| Shandong Huatai Paper Industry Shareholding Co., Ltd. | 600308 | Dongying, Shandong |
| Mudanjiang Hengfeng Paper Co., Ltd. | 600356 | Mudanjiang, Heilongjiang |
| Guangdong Guanhao High-Tech Co., Ltd. | 600433 | Zhanjiang, Guangdong |
| Shanying International Holdings Co., Ltd. | 600567 | Ma’anshan, Anhui |
| Yueyang Forest & Paper Co., Ltd. | 600963 | Yueyang, Hunan |
| Guangxi Fenglin Wood Industry Group Co., Ltd. | 601996 | Nanning, Guangxi |
| Shanghai Xintonglian Packing Co., Ltd. | 603022 | Shanghai |
| Jason Furniture (Hangzhou) Co., Ltd. | 603816 | Hangzhou, Zhejiang |
| Qu Mei Home Furnishings Group Co., Ltd. | 603818 | Beijing |
| Guangzhou Holike Creative Home Co., Ltd. | 603898 | Guangzhou, Guangdong |
| Target Layer | Criteria Layer | Index Layer | Nature of Indicators |
|---|---|---|---|
| Benefit growth | Operating ability | Current assets turnover ratio (A1) | + |
| Total assets turnover ratio (A2) | + | ||
| Solvency | Current ratio (A3) | ± | |
| Quick ratio (A4) | ± | ||
| Profitability | Return on assets (A5) | + | |
| Return on total assets (A6) | + | ||
| Operating profit margin (A7) | + | ||
| Growth capacity | Growth rate of prime business income (A8) | + | |
| Total asset growth rate (A9) | + | ||
| Innovation-driven development | Innovation inputs | Research and development (R&D) expenditure intensity (B1) | + |
| Number of innovative personnel (B2) | + | ||
| Proportion of innovative personnel (B3) | + | ||
| Number of highly educated personnel (B4) | + | ||
| Proportion of highly educated personnel (B5) | + | ||
| Innovation outputs | Number of patents obtained (B6) | + | |
| Environmental protection | Green production | Energy intensity (per 10,000 Yuan revenue) (C1) | − |
| Energy consumption per capita (C2) | − | ||
| Green governance | Environmental investment (C3) | + | |
| Social contribution | Employee rights | Growth rate of employee compensation payable (D1) | + |
| Number of employees (D2) | + | ||
| Average employee compensation (D3) | + | ||
| Growth rate of average employee compensation (D4) | + |
| Target Layer | Criteria Layer | Index Layer | Description of Indicators |
|---|---|---|---|
| Environmental variables | Regional development | Regional GDP per capita (E1) | GDP per capita in the province where the enterprise is located |
| Time in business | Enterprise age (E2) | Years since establishment | |
| Government support | Government investment (E3) | Government grants received by the enterprise during the year |
| Type | Variables | Indicators | Explanations |
|---|---|---|---|
| Conditions | Technical conditions | Investment in technical resources (X1) | The proportion of R&D investment in operating revenue |
| Accumulation of green technology (X2) | Number of green patent grants | ||
| Organizational conditions | Firm size (X3) | Logarithm of total asset scale | |
| Human resources (X4) | Proportion of highly educated employees | ||
| Equity concentration (X5) | Shareholding ratio of the largest shareholder | ||
| Profit-making capability (X6) | Return on equity | ||
| Environmental conditions | Environmental management disclosure (X7) | The environmental management disclosure of listed Companies in the CSMAR database | |
| Market competitiveness (X8) | Lerner Index: proportion of the remaining part (excluding operating costs, selling expenses and administrative expenses) in operating revenue | ||
| Outcome | Green development | Comprehensive technical efficiency (Y) | The comprehensive technical efficiency obtained from the third stage DEA-BCC |
| Year | Comprehensive Technical Efficiency | Pure Technical Efficiency | Scale Efficiency | IRS | - | DRS |
|---|---|---|---|---|---|---|
| 2017 | 0.667 | 0.754 | 0.839 | 17 | 13 | 3 |
| 2018 | 0.639 | 0.700 | 0.864 | 17 | 13 | 3 |
| 2019 | 0.580 | 0.624 | 0.913 | 10 | 10 | 13 |
| 2020 | 0.598 | 0.673 | 0.883 | 14 | 8 | 11 |
| 2021 | 0.479 | 0.548 | 0.837 | 9 | 7 | 17 |
| 2022 | 0.245 | 0.712 | 0.321 | 0 | 2 | 31 |
| A2 | B4 | C3 | D2 | |
|---|---|---|---|---|
| Constant term | 0.35 | 0.49 | 0.17 | 0.80 |
| E1 | 0.04 | 0.028 | −0.03 | 0.05 |
| E2 | 0.35 | −0.21 | 0.10 | −0.46 |
| E3 | −0.02 | 0.00 | 0.24 | 0.08 |
| σ2 | 0.21 *** (3.59) | 0.11 *** (3.67) | 0.05 *** (4.02) | 0.23 *** (3.60) |
| γ | 0.96 *** (70.77) | 0.93*** (44.94) | 0.43 *** (2.63) | 0.96 *** (76.56) |
| Log likelihood function | 121.61 | 154.84 | 52.22 | 122.43 |
| LR test of the one-sided error | 143.34 *** | 80.49 *** | 11.54 *** | 139.28 *** |
| Variables | Fuzzy Calibration | ||
|---|---|---|---|
| Complete Affiliation | Crossover | Complete Disaffiliation | |
| X1 | 4.782 | 2.394 | 0.723 |
| X2 | 88.200 | 4.000 | 0.000 |
| X3 | 24.515 | 22.491 | 21.519 |
| X4 | 21.065 | 13.504 | 6.705 |
| X5 | 52.982 | 28.900 | 11.283 |
| X6 | 21.587 | 6.439 | −3.565 |
| X7 | 8.000 | 3.000 | 0.000 |
| X8 | 20.426 | 11.390 | 1.381 |
| Y | 1.000 | 0.528 | 0.117 |
| Conditions | Y | ~Y | ||||||
|---|---|---|---|---|---|---|---|---|
| CON | COV | CON’ | COV’ | CON | COV | CON’ | COV’ | |
| X1 | 0.645 | 0.652 | 0.119 | 0.456 | 0.601 | 0.605 | 0.263 | 0.492 |
| ~X1 | 0.610 | 0.605 | 0.141 | 0.504 | 0.654 | 0.647 | 0.082 | 0.462 |
| X2 | 0.543 | 0.695 | 0.141 | 0.601 | 0.489 | 0.624 | 0.293 | 0.619 |
| ~X2 | 0.706 | 0.581 | 0.128 | 0.372 | 0.761 | 0.624 | 0.137 | 0.366 |
| X3 | 0.685 | 0.723 | 0.186 | 0.432 | 0.529 | 0.556 | 0.226 | 0.564 |
| ~X3 | 0.580 | 0.553 | 0.086 | 0.474 | 0.737 | 0.700 | 0.125 | 0.384 |
| X4 | 0.611 | 0.629 | 0.232 | 0.480 | 0.603 | 0.617 | 0.257 | 0.510 |
| ~X4 | 0.628 | 0.613 | 0.232 | 0.462 | 0.637 | 0.620 | 0.116 | 0.462 |
| X5 | 0.632 | 0.660 | 0.220 | 0.498 | 0.584 | 0.607 | 0.205 | 0.498 |
| ~X5 | 0.624 | 0.601 | 0.116 | 0.492 | 0.673 | 0.646 | 0.125 | 0.438 |
| X6 | 0.715 | 0.703 | 0.244 | 0.300 | 0.584 | 0.572 | 0.116 | 0.402 |
| ~X6 | 0.565 | 0.577 | 0.260 | 0.456 | 0.697 | 0.709 | 0.192 | 0.324 |
| X7 | 0.619 | 0.641 | 0.217 | 0.492 | 0.601 | 0.620 | 0.128 | 0.480 |
| ~X7 | 0.633 | 0.614 | 0.196 | 0.468 | 0.652 | 0.631 | 0.199 | 0.432 |
| X8 | 0.671 | 0.659 | 0.238 | 0.342 | 0.606 | 0.593 | 0.168 | 0.444 |
| ~X8 | 0.586 | 0.599 | 0.226 | 0.444 | 0.651 | 0.664 | 0.189 | 0.426 |
| No. | Case | Index | 2017 | 2018 | 2019 | 2020 | 2021 | 2022 |
|---|---|---|---|---|---|---|---|---|
| 1 | X1/~Y | Inter-group consistency | 0.545 | 0.450 | 0.612 | 0.729 | 0.646 | 0.875 |
| Inter-group coverage | 0.545 | 0.831 | 0.737 | 0.459 | 0.783 | 0.349 | ||
| 2 | X2/~Y | Inter-group consistency | 0.380 | 0.359 | 0.490 | 0.705 | 0.573 | 0.593 |
| Inter-group coverage | 0.584 | 0.842 | 0.731 | 0.529 | 0.836 | 0.291 | ||
| 3 | X3/~Y | Inter-group consistency | 0.417 | 0.457 | 0.550 | 0.605 | 0.567 | 0.725 |
| Inter-group coverage | 0.494 | 0.782 | 0.663 | 0.395 | 0.711 | 0.314 | ||
| 4 | X4/Y | Inter-group consistency | 0.423 | 0.570 | 0.636 | 0.544 | 0.749 | 0.739 |
| Inter-group coverage | 0.605 | 0.349 | 0.601 | 0.771 | 0.446 | 0.892 | ||
| 5 | X4/~Y | Inter-group consistency | 0.513 | 0.446 | 0.602 | 0.815 | 0.688 | 0.763 |
| Inter-group coverage | 0.636 | 0.849 | 0.733 | 0.559 | 0.788 | 0.270 | ||
| 6 | ~X4/Y | Inter-group consistency | 0.745 | 0.754 | 0.718 | 0.689 | 0.645 | 0.395 |
| Inter-group coverage | 0.639 | 0.304 | 0.583 | 0.885 | 0.518 | 0.850 | ||
| 7 | X5/Y | Inter-group consistency | 0.636 | 0.816 | 0.800 | 0.582 | 0.715 | 0.485 |
| Inter-group coverage | 0.655 | 0.390 | 0.696 | 0.851 | 0.544 | 0.858 | ||
| 8 | X5/~Y | Inter-group consistency | 0.606 | 0.538 | 0.552 | 0.664 | 0.529 | 0.821 |
| Inter-group coverage | 0.541 | 0.799 | 0.619 | 0.469 | 0.774 | 0.425 | ||
| 9 | X6/Y | Inter-group consistency | 0.896 | 0.845 | 0.857 | 0.676 | 0.797 | 0.466 |
| Inter-group coverage | 0.777 | 0.369 | 0.717 | 0.944 | 0.585 | 0.881 | ||
| 10 | ~X6/Y | Inter-group consistency | 0.327 | 0.566 | 0.527 | 0.599 | 0.671 | 0.675 |
| Inter-group coverage | 0.460 | 0.311 | 0.483 | 0.780 | 0.430 | 0.883 | ||
| 11 | X7/Y | Inter-group consistency | 0.408 | 0.720 | 0.651 | 0.588 | 0.727 | 0.694 |
| Inter-group coverage | 0.628 | 0.353 | 0.576 | 0.841 | 0.473 | 0.952 | ||
| 12 | X8/Y | Inter-group consistency | 0.800 | 0.820 | 0.807 | 0.661 | 0.746 | 0.433 |
| Inter-group coverage | 0.806 | 0.351 | 0.641 | 0.839 | 0.507 | 0.892 | ||
| 13 | ~X8/Y | Inter-group consistency | 0.415 | 0.524 | 0.534 | 0.576 | 0.720 | 0.701 |
| Inter-group coverage | 0.475 | 0.295 | 0.520 | 0.829 | 0.496 | 0.868 |
| Case | H1a | H1b | H1c | H2 |
|---|---|---|---|---|
| Investment in technical resources | ● | ● | ● | ⊗ |
| Accumulation of green technology | ⊗ | ● | ⊗ | |
| Firm size | • | • | • | |
| Human resources | ⊗ | ⊗ | ● | • |
| Equity concentration | ● | ● | ⊗ | ● |
| Profit-making capability | ● | ● | ● | ● |
| Environmental management disclosure | ⊗ | ⊗ | • | ⊗ |
| Market competitiveness | • | • | ⊗ | ● |
| Consistency | 0.882 | 0.903 | 0.899 | 0.876 |
| PRI | 0.657 | 0.701 | 0.680 | 0.664 |
| Original coverage | 0.266 | 0.247 | 0.187 | 0.219 |
| Unique coverage | 0.034 | 0.006 | 0.053 | 0.052 |
| Inter-group consistency distance | 0.168 | 0.147 | 0.122 | 0.122 |
| Intra-group consistency distance | 0.174 | 0.156 | 0.102 | 0.174 |
| Overall consistency | 0.861 | |||
| Overall PRI | 0.700 | |||
| Overall coverage | 0.393 | |||
| Configurations | Typical Cases |
|---|---|
| H1a | Qu Mei Home Furnishings Group Co., Ltd. (2017), |
| Guangzhou Holike Creative Home Co., Ltd. (2017, 2020), | |
| Mys Group Co., Ltd. (2017, 2018, 2019), | |
| Shenzhen Yuto Packaging Technology Co., Ltd. (2017) | |
| H1b | Mys Group Co., Ltd. (2017, 2018, 2019), |
| Shenzhen Yuto Packaging Technology Co., Ltd. (2017, 2020, 2021) | |
| H1c | Shanying International Holdings Co., Ltd. (2021), |
| Yueyang Forest & Paper Co., Ltd. (2022) | |
| H2 | Jason Furniture (Hangzhou) Co., Ltd. (2017, 2018, 2019) |
| Region | H1a | H1b | H1c | H2 |
|---|---|---|---|---|
| Eastern regions | 0.280 | 0.242 | 0.171 | 0.190 |
| Other regions | 0.218 | 0.218 | 0.338 | 0.323 |
Disclaimer/Publisher’s Note: The statements, opinions and data contained in all publications are solely those of the individual author(s) and contributor(s) and not of MDPI and/or the editor(s). MDPI and/or the editor(s) disclaim responsibility for any injury to people or property resulting from any ideas, methods, instructions or products referred to in the content. |
© 2025 by the authors. Licensee MDPI, Basel, Switzerland. This article is an open access article distributed under the terms and conditions of the Creative Commons Attribution (CC BY) license (https://creativecommons.org/licenses/by/4.0/).
Share and Cite
Xu, D.; Huang, B.; Shi, S.; Zhang, X. A Configurational Analysis of Green Development in Forestry Enterprises Based on the Technology–Organization–Environment (TOE) Framework. Forests 2025, 16, 744. https://doi.org/10.3390/f16050744
Xu D, Huang B, Shi S, Zhang X. A Configurational Analysis of Green Development in Forestry Enterprises Based on the Technology–Organization–Environment (TOE) Framework. Forests. 2025; 16(5):744. https://doi.org/10.3390/f16050744
Chicago/Turabian StyleXu, Dayu, Beining Huang, Si Shi, and Xuyao Zhang. 2025. "A Configurational Analysis of Green Development in Forestry Enterprises Based on the Technology–Organization–Environment (TOE) Framework" Forests 16, no. 5: 744. https://doi.org/10.3390/f16050744
APA StyleXu, D., Huang, B., Shi, S., & Zhang, X. (2025). A Configurational Analysis of Green Development in Forestry Enterprises Based on the Technology–Organization–Environment (TOE) Framework. Forests, 16(5), 744. https://doi.org/10.3390/f16050744