Article

Physiological and Flavonoid Metabolic Responses of Black Locust Leaves to Drought Stress in the Loess Plateau of China

1
College of Life Sciences, Northwest Agriculture and Forestry University, Yangling 712100, China
2
College of Natural Resources and Environment, Northwest A&F University, Yangling 712100, China
3
College of Soil and Water Conservation and Engineering, Northwest Agriculture and Forestry University, Yangling 712100, China
*
Authors to whom correspondence should be addressed.
These authors contributed equally to this work.
Forests 2025, 16(4), 695; https://doi.org/10.3390/f16040695
Submission received: 27 February 2025 / Revised: 28 March 2025 / Accepted: 15 April 2025 / Published: 17 April 2025
(This article belongs to the Section Forest Ecophysiology and Biology)

Abstract

:
Drought threatens the stability of artificial black locust forests on the Loess Plateau, yet there is limited research on the physiological and metabolic responses of mature black locust to drought stress. This study employed a throughfall exclusion system—i.e., moderate drought (40% throughfall reduction), extreme drought (80% throughfall reduction), and 0% throughfall reduction for control—to analyze leaf microstructure, relative water content (RWC), osmotic adjustment substances, hormone levels, and flavonoid metabolites in black locust under controlled drought stress. The results demonstrated that as drought stress intensified, stomatal aperture and density decreased, while trichome density and length exhibited significant increases. MDA, proline, IAA, and osmotic adjustment substances (soluble protein, reducing sugar, and total sugar) first increased and then decreased as drought stress intensified. A total of 245 flavonoid compounds were identified through metabolomic analysis, among which 91 exhibited differential expression under drought treatments. Notably, 37 flavonoids, including flavonols and glycosylated derivatives, were consistently upregulated. These findings suggest that drought stress can lead to the accumulation of flavonoids. This study explored the physiological and metabolic responses of mature black locust trees to drought stress, offering insights for selecting drought-resistant species in vegetation restoration and informing ecological management practices in arid regions.

1. Introduction

The Chinese Loess Plateau is located in the middle reaches of the Yellow River Basin in Northern China, characterized as an arid and semi-arid region. It is a typical climate-sensitive and water-scarce region with uneven rainfall distribution. In the past, due to irrational human activities, the vegetation in this area has been severely damaged [1]. To alleviate the severe ecological problems of vegetation degradation and soil erosion on the Loess Plateau, since the 1980s, the Chinese government has implemented several large-scale afforestation projects in this area, which has significantly improved the vegetation coverage and ecosystem structure and functions [2]. However, observation-based evidence has shown that with the intensification of global warming, over the past five decades, the severity and frequency of drought across the entire Loess Plateau have generally shown an upward trend [3]. In addition, the configuration of artificial forest plantings has failed to fully consider the characteristics of water balance [4]. The high planting density use of and water-demanding species have led to the excessive consumption of soil water resources, surpassing the water carrying capacity of the plantation ecosystem in the region [5]. Field research has found that the growth of a plantation shows a significant decline in later stages, with some mortality observed in certain tree stands under extreme drought events [6,7]. Therefore, drought stress has become one of the main threats to vegetation growth and ecosystem stability in this region [8,9].
Studying the hydrological, physiological, and biochemical responses of mature forests to drought stress can clarify the sensitivity and adaptability of forest systems to drought. Water content is a key factor influencing plant physiology [10], and the water cycle is a vital component of the biosphere [11]. Water serves not only as the main solvent for key activities such as photosynthesis, signal transduction, and material transport but also as an important raw material involved in these processes [12]. When plants are subjected to drought stress, the water balance within their bodies is disrupted, and the rate of water loss far exceeds the rate of water absorption [13,14,15]. Drought stress can cause damage to plants through numerous intricate pathways. For example, it inhibits plant growth by interfering with the normal processes of cell division and elongation. The leaf area is reduced, which in turn weakens the plant’s ability to capture solar energy. Additionally, drought interferes with various metabolic pathways, affecting carbohydrate, protein, and lipid metabolism. A particularly critical consequence is the excessive accumulation of reactive oxygen species (ROS) within plant tissues [16]. These highly oxidative compounds can damage cellular components, particularly the cell membrane, compromising their structural integrity and functionality, which may ultimately result in cell death [17].
Plants have evolved a multi-level defense system to adapt to drought stress, operating through morphological, physiological, and molecular adaptations. At the morphological level, plants maintain water balance through structural modifications, including leaf area reduction, increased leaf thickness and cutinization, stomatal closure, and enhanced epidermal hair density [18]. Regarding physiological regulation, plants activate drought resistance mechanisms by modulating leaf water content and regulating osmotic adjustment substances, such as antioxidants, proline, soluble sugars, soluble proteins, and endogenous hormones [19]. These physiological adaptations enable plants to scavenge excessive ROS and mitigate oxidative damage to cellular membranes under drought conditions [20]. At the molecular level, plants have developed sophisticated signaling pathways and regulatory mechanisms through long-term evolution. These molecular responses involve complex metabolic networks that produce intermediates and end-products functioning as regulatory and signaling molecules in the plant’s adaptive mechanisms [21].
Black locust (Robinia pseudoacacia L.), the world’s second most extensively planted broad-leaved tree species [22,23], has been recognized for its significant potential in forest ecosystem restoration due to its rapid growth rate and exceptional drought tolerance. This species has been extensively utilized in afforestation efforts across the Loess Plateau, where it currently dominates vegetation composition, accounting for over 90% of the region’s total forest cover [24,25,26,27]. However, recent studies have revealed concerning ecological manifestations in these plantations, including retarded stand growth, canopy desiccation, and even whole-plant mortality events, primarily attributed to persistent drought stress under changing climatic conditions [28]. This is mainly due to prolonged soil water scarcity, which results in branch withering and productivity decline and ultimately leads to prematurely senescent trees [10,29]. The degradation of black locust plantations has severely affected the ecosystem’s stability and ecological functions. In regional ecological studies, specific aspects of black locust’s drought stress response mechanisms, such as morphological changes, water-related physiological and biochemical responses, and ecological adaptability, have become research hotspots.
In recent years, remarkable progress has been made in the study of plant responses to drought stress. A significant positive correlation was found between the number of tree deaths per unit and the annual precipitation decline in the mature black locust forest in the Loess Plateau [19]. And previous studies of black locust seedlings have found that under drought stress, black locust seedlings can respond rapidly [30,31]. They reduce the relative water content (RWC) of leaves, decrease photosynthesis, and regulate the activity of the antioxidant enzyme system to scavenge excessive reactive oxygen species (ROS) in the body and mitigate oxidative damage [28,32,33]. At present, there is an obvious lack of research on mature black locust forests [22]. Mature trees have a more complex vascular system and hydraulic structure, which are different from the response mechanisms of seedlings [34,35]. Understanding the responses of mature black locustforests to drought stress in terms of leaf microstructure, physiology, and flavonoid compounds is critical for forest management, ecological restoration, and predicting forest ecosystem responses to climate change.
Recent studies have increasingly highlighted the crucial role of flavonoid metabolism in plant drought stress responses [36,37]. Substantial evidence indicates that flavonoids contribute to drought adaptation through multiple mechanisms including maintaining cellular osmotic balance, enhancing plant water retention capacity, and serving as biomarkers for biotic and abiotic stress tolerance [38,39]. Flavonoids directly neutralize reactive oxygen species (ROS) through their phenolic hydroxyl groups and by maintaining cell membrane integrity through lipid peroxidation inhibition [40,41]. However, the role of flavonoid compounds in helping black locust cope with drought stress has not been reported [42,43].
In this study, the morphological and physiological responses of black locust leaves, as well as changes in leaf hormones and flavonoids, under varying degrees of drought stress were evaluated. The measurements were conducted at a long-term throughfall exclusion site within a black locust plantation, located in the center of Loess Plateau. The intensity of drought stress applied to black locust was controlled by implementing 40% and 80% drainage exclusion (representing moderate and extreme drought, respectively) (see methods for details). The research findings were derived by comparing the results obtained from the drought treatment groups and those from the control group. The objectives of this study were to (1) quantitatively analyze the leaf microstructure and physiological responses of artificial black locust forests under different drought conditions and (2) analyze the adjustments of endogenous hormones and flavonoids in black locust in response to drought stress. The purpose of this research was to investigate the response of black locust to long-term drought and to provide scientific basis for screening plant hormones and flavonoids to enhance the drought resistance of black locust and to protect the regional ecosystem.

2. Materials and Methods

2.1. Study Site

The study site is located in Wuqi County, Shaanxi Province, situated in the central part of the Chinese Loess Plateau, characterized as a typical hilly and gullied landscape, with elevations ranging from 1233 to 1800 m. This region features a semi-arid temperate and a continental monsoon climate, with an average annual temperature of 8.6 °C, and the mean annual precipitation is 424 mm, mainly occurring from June to September. The soil type is identified as loessial soil. The prevalent vegetation primarily consists of black locust (Robinia pseudoacacia L.), Chinese pine (Pinus tabuliformis), Siberian apricot (Armeniaca sibirica (L.) Lam.), sea buckthorn (Hippophae rhamnoides L.), wormwood (Artemisia dracunculus L.), Dahurian Lespedeza (Lespedeza davurica), and wildrye (Leymus secalinus (Georgi) Tzvelev). A weather station is located approximately 200 m away from the study site. The mean precipitation during the observation period (1 July 2022 to 31 August 2023) was 561.51 mm, while the mean surface air temperature recorded was 11.32 °C. Air temperature (Ta) was measured using a temperature sensor (ATMOS-14; METER Group Inc., Pullman, WA, USA), and precipitation (P) was measured using a tipping bucket rain gauge (6466 m; Davis Instruments, Hayward, CA, USA). The soil water content of the sample plots was measured by laying pipes directly from 20 cm to 500 cm, and soil moisture content measurements were conducted from January 2023 to July 2024 across the experimental groups. The recorded average values were 7.21 Avg for the control group, 6.89 Avg for the MD-treated group, and 6.19 Avg for the ED-treated group. Subsequent experimental procedures were implemented based on these soil moisture content measurements, and the methodology is available in Liu et al. (2024) [44].

2.2. Throughfall Exclusion Experiment

The throughfall exclusion experiment was conducted in a 20-year-old black locust plantation. Three treatments of throughfall exclusion were performed to manipulate the drought conditions as follows: ambient conditions (CK, no exclusion indicating no drought), moderate drought (MD, 40% throughfall reduction), and extreme drought (ED, 80% throughfall reduction). There were three replicate plots for each treatment. Each plot covered an area of approximately 360 m2, and contained about 60 stands of black locust. Throughfall exclusion was achieved by adjusting the distance covered by polyvinyl chloride (PVC) sheets (2 mm in thickness and with a light transmittance of approximately 95%) installed 2 m above the ground as rain-shading barriers in each plot. The experimental plots were randomly placed within the study site, with excluded rainwater systematically discharged away from the plots through drainage channels. It should be acknowledged that the exclusion of rainfall may have influenced other environmental parameters such as soil temperature and leaf temperature; however, these variables were not measured in the current study. Further details on the study site and methodology are available in Liu et al. (2024) [44].

2.3. Leaf Sample Collection

All leaf samples from the black locust were collected in July 2024. Leaves were collected from each tree, resulting in a total of 80 leaves. The leaves were then mixed together to facilitate subsequent experiments. They were then divided into two portions. One portion was placed in a sealed bag with distilled water for the measurement of relative leaf water content. The other portion was flash-frozen in liquid nitrogen and then stored in a container with dry ice while it was transported to the laboratory, where it was preserved at −80 °C in a freezer for subsequent determination of its physiological index and flavonoid metabolite profile.

2.4. Leaf Epidermal Micromorphology

After collecting the leaf samples, 30 of the leaves were used for determining leaf epidermal micromorphology. The leaf margins and midribs were removed to prepare 2 × 2 mm leaf samples, which were then quickly immersed in 4% glutaraldehyde solution for fixation. Subsequently, the fixed leaves were rinsed with 0.1 M PBS buffer. After rinsing with 10%, 30%, 50%, 70%, 80%, and 90% ethanol solution, once each for 15–20 min, gradient dehydration was carried out with 100% ethanol 3 times for 30 min each. Following dehydration, the samples were dried with CO2, adhered to conductive adhesive, sputter-coated with gold, and loaded onto the sample stage. The samples were then observed and photographed using a scanning electron microscope. The length and width of stomata were measured, examined, and photographed from multiple different perspectives with the scanning electron microscope [45,46].
Stomatal length: maximum value of dumbbell-type guard cell.
Stomatal width: perpendicular to the maximum width of the guard cell.

2.5. Leaf Physiological Indices

Leaf relative water content
The leaf relative water content (RWC) was determined according to the fresh, turgid, and dry weight of the leaf sample. The leaf fresh weight was measured immediately after the sample was collected. Then, the turgid weight was measured after the leaves had been soaked in distilled water for 24 h. After that, the treated leaves were placed in an oven and dried at 80 °C for 24 h until they reached a constant weight, which was then recorded as the dry weight [47]. The RWC was calculated as follows,
RWC ( % ) = ( FW -   DW ) ( TW - D W ) × 100 %
where FW is the fresh weight [g]; TW is the turgid weight [g]; and DW is the dry weight [g].
Photosynthetic pigment content
The photosynthetic pigment of leaf samples was extracted by an ethanol spectrophotometer. Fresh leaf samples of 0.1 g were taken and wiped clean, the midrib was removed, and the leaves were cut into pieces and placed in a mortar. Then, 95% ethanol was added while dropping and grinding for extraction. The supernatant was taken, and the absorbance was measured at 649 nm and 665 nm, respectively, using a spectrophotometer (with 95% ethanol for zero adjustment). After the measurement, the chlorophyll pigment content was calculated according to the following formulas [48].
C a = 13.95 × A 665 6.88 × A 649
C b = 24.96 × A 649 7.32 × A 665
C h l o r o p h y l l   c o n t e n t   ( m g / g ) = C ( m g / L ) × T o t a l   v o l u m e   o f   e x t r a c t   ( m L ) × d i l u t i o n   r a t i o f r e s h   w e i g h t   o f   s a m p l e   ( g ) × 1000
Osmotic regulatory substance contents
Malondialdehyde (MDA) was measured using the thiobarbituric acid (TBA) method. Firstly, 0.3 g of fresh sample was extracted by mixing with an appropriate amount of 0.05 mol/L phosphate buffer, and the volume was fixed to 10 mL in the centrifuge tube. Subsequently, the supernatant was taken and mixed with 0.5% TBA in equal proportion. After boiling and cooling, the absorbance was measured at 532 nm, 600 nm, and 450 nm, respectively, using a spectrophotometer. For each treatment group, a control tube was set up. The control samples were first boiled and cooled and then mixed with 0.5% TBA in equal proportion to measure the absorbance value. Each sample plot was replicated three times. In the determination of malondialdehyde (MDA) using the thiobarbituric acid (TBA) method, soluble sugars and other substances in plant tissues can interfere with the measurement. The color reaction products of sugars and TBA exhibit maximum absorption at 450 nm and also show absorption at 532 nm. In contrast, the reaction product of MDA and TBA has a maximum absorption wavelength of 532 nm. By setting up a control, the non-specific absorption of soluble sugars and other substances at 532 nm can be deducted, enabling a more accurate determination of the MDA content [49,50].
Free proline was measured by the acid ninhydrin method. First, 0.2 g of fresh leaf samples were taken and ground with 3% sulfosalicylic acid solution. After that, the tubes were sealed with plastic film and immersed in a boiling water bath for 20 min. After cooling, 5 mL of toluene was added to each tube. After stratification, the toluene layer was aspirated and measured colorimetrically at a wavelength of 520 nm to obtain the absorbance value [49,50].
The total soluble sugar content was determined by the anthrone–sulfuric acid (H2SO4) method. Samples of fresh leaves of 0.5 g were taken and ground with distilled water. The mixture was then heated and centrifuged in a water bath at 80 °C. Next, 5 mL anthrone solution was added to the supernatant and boiled for 20 min. Subsequently, the substance was left undisturbed and cooled to room temperature. The absorbance was measured at 620 nm. Finally, the content of soluble sugar was calculated according to the soluble sugar standard curve [49].
Reducing sugars were assessed using the 3,5-dinitrosalicylic acid (DNS) method. The extraction method was the same as that for total sugar. After the supernatant was evaporated to dryness, it was dissolved in distilled water again. The supernatant was taken and added to 3,5-dinitrosalicylic acid solution, and colorimetric measurement was carried out at 540 nm to obtain the absorbance value. The content of reducing sugar was calculated according to the standard curve [49].
Soluble protein was quantified by the Coomassie brilliant blue G-250 method [51]. First, 0.2 g fresh samples of black locust leaves were taken and wiped clean, cut into small pieces, and then put into a mortar to be ground with distilled water. The mortar was rinsed with distilled water 3–4 times. Subsequently, the mixture was centrifuged at 4000 r·min−1 for 10 min. After that, the clear supernatant was aspirated, 3 mL of Coomassie Brilliant Blue G-250 solution was added, and they were mixed thoroughly. After the mixture had stood still for 2 min, colorimetric measurement was carried out at 595 nm to determine the absorbance. Finally, the content of soluble protein was calculated according to the standard curve.
Total phenol and total flavone content
The total content of phenolic compounds was determined using the Folin–Ciocalteu reagent spectrophotometric method. First, 1 g fresh leaf samples were taken and ground with 80% ethanol for extraction. An appropriate amount of Folin–Jocatechol reagent and sodium carbonate solution were added to the upper liquid. After the mixture was left to react at room temperature for 30 min, colorimetric measurement was carried out at 760 nm to obtain the absorbance value. Finally, the content of total phenol was calculated according to the standard curve [52].
The total flavonoid content was measured by the NaNO2-Al(NO3)3-NaOH colorimetric method. The supernatant was carefully retrieved, and an apt quantity of 5% sodium nitrite was incorporated, permitting a reaction to occur for precisely 6 min. Thereafter, 10% aluminum nitrate solution was added, and the reaction proceeded for an additional 6 min. Subsequently, 5% sodium hydroxide solution was introduced, and the entire mixture was vigorously stirred and allowed to react for 15 min. Finally, colorimetric analysis was performed at 500 nm to procure the absorbance value, from which the relevant content was computed in accordance with the pre-established standard curve [52,53].

2.6. Analysis and Determination of Hormones in Black Locust Leaves

The concentrations of eight hormones, including gibberellic acid (GA1, GA3, GA4, GA7), jasmonic acid (JA), salicylic acid (SA), indoleacetic acid (IAA), and abscisic acid (ABA), were quantified using high-performance liquid chromatography (HPLC) by Wuhan Punes Testing Technology Co, Ltd. (Wuhan, China) Fresh leaf samples from both the treatment and control groups of black locust were combined with a suitable volume of acetonitrile solution along with the internal standard naphthalene and extracted overnight. The resulting precipitate was further extracted with acetonitrile solution. The supernatant was then evaporated to dryness, reconstituted in methanol, filtered, and analyzed via column chromatography to determine the various hormone contents (see Supplementary Materials for details).

2.7. Flavonoid Metabolome Analysis

The flavonoid metabolites were determined by Beijing Biomarker Technologies Co, Ltd. (Beijing, China) A high-performance liquid chromatography (HPLC) system combined with a tandem chromatographic separation module were utilized for analysis. The samples were vacuum-dried and then ground into powder. Fifty milligrams of each sample was dissolved in 1000 μL of an extraction solution, and the mixture was vortexed until homogeneous (with the volume ratio of methanol to acetonitrile to water being 2:2:1). The solution was placed at −20 °C for 1 h, and then centrifuged at 12,000 rpm for 15 min at 4 °C. Five hundred microliters of the supernatant were aspirated into an EP tube. The extract was dried in a vacuum concentrator. To the dried metabolites, 200 μL of an extraction solution (with the volume ratio of acetonitrile to water being 1:1) was added for re-dissolution. The mixture was vortexed until homogeneous and subjected to ultrasonic treatment in an ice-water bath for 10 min. Subsequently, it was centrifuged at 12,000 rpm for 15 min at 4 °C. The supernatant was collected and stored in a sample tube.
The sample extracts were analyzed using a UPLC-ESI-MS/MS system (UPLC, Waters Corporation, Milford, MA, USA Acquity I-Class PLUS; MS, AB Sciex LLC (Framingham, MA, USA) Applied Biosystems QTRAP 6500+). The analytical conditions were as follows: UPLC column, Waters HSS-T3 (1.8 µm, 2.1 mm × 100 mm). The mobile phase consisted of solvent A, pure water with 0.1% formic acid; and solvent B, acetonitrile with 0.1% formic acid. Sample measurements were performed with a gradient program that employed the starting conditions of 90% A/10% B and maintained them for 0.5 min. Over 6.0 min, a linear gradient to 50% A/50% B was programmed, which was then held until 7 min. Over 12.0 min, a linear gradient to 10% A/90% B was programmed, and a composition of 10% A/90% B was maintained for 1 min. Subsequently, a composition of 90% A/10% B was adjusted and maintained for 2 min. The flow velocity was set as 0.35 mL per minute; the column oven was set to 40 °C; the injection volume was 2 μL. The effluent was alternatively connected to an ESI-QTRAP (triple quadrupole linear ion trap)-MS.
The ESI source operation parameters were as follows: source temperature 550 °C; ion spray voltage (IS) 5500 V (positive ion mode)/−4500 V (negative ion mode); the ion source gas I (GSI), gas II (GSII), and curtain gas (CUR) were set at 50, 55, and 20 psi, respectively; the collision-activated dissociation (CAD) was medium. Instrument tuning and mass calibration were performed with 10 and 100 μmol/L polypropylene glycol solutions in QQQ and LIT modes, respectively. QQQ scans were acquired via MRM experiments, with collision gas (nitrogen) set to medium. The DP (declustering potential) and CE (collision energy) for individual MRM transitions were found via further DP and CE optimization. A specific set of MRM transitions were monitored for each period according to the metabolites eluted within this period.
Qualitative data analysis was based on the retrieval of classification and metabolic pathway information regarding the identified compounds in the KEGG, HMDB, and lipidmaps databases. According to the grouping information, the difference multiples were calculated and compared, and the t-test was used to calculate the p-value of the significance of differences for each compound. Orthogonal partial least squares discriminant analysis (OPLS-DA) modeling was performed using the ropls package of the R language (version 4.1.1, http://www.r-project.org/, accessed on 15 March 2023), and 200 permutation tests were carried out to verify the reliability of the model. The variable importance in projection (VIP) value of the model was calculated through multiple cross-validation. The method of combining the difference multiple, the p-value, and the VIP value of the OPLS-DA model was used to screen differential metabolites. The screening criteria were: fold change (FC) > 1, p < 0.05, OPLS-DA model > 0.9, and VIP > 1. The differential metabolites with significant KEGG metabolic pathway enrichment were calculated using the hypergeometric distribution test.

2.8. Data Processing

Data organization was conducted using Microsoft Excel 2021, and statistical analysis was performed with one-way analysis of variance (ANOVA) via SPSS 22.0 (IBM, Armonk, IL, USA). Significant differences among groups were assessed at a p < 0.05 significance level. The graphical representations were created using Origin 2024 (Origin Lab Corporation, Northampton, MA, USA). The heatmap was drawn using the pheatmap package in the R language. The parameters were set to retain two decimal places, and row clustering was performed. The horizontal and vertical parameters were set, and then the heatmap was plotted. The data were tested for normality and homogeneity of variance. Multivariate comparison was not used, single factor analysis of variance was performed, and the analysis was conducted by block average.

3. Results

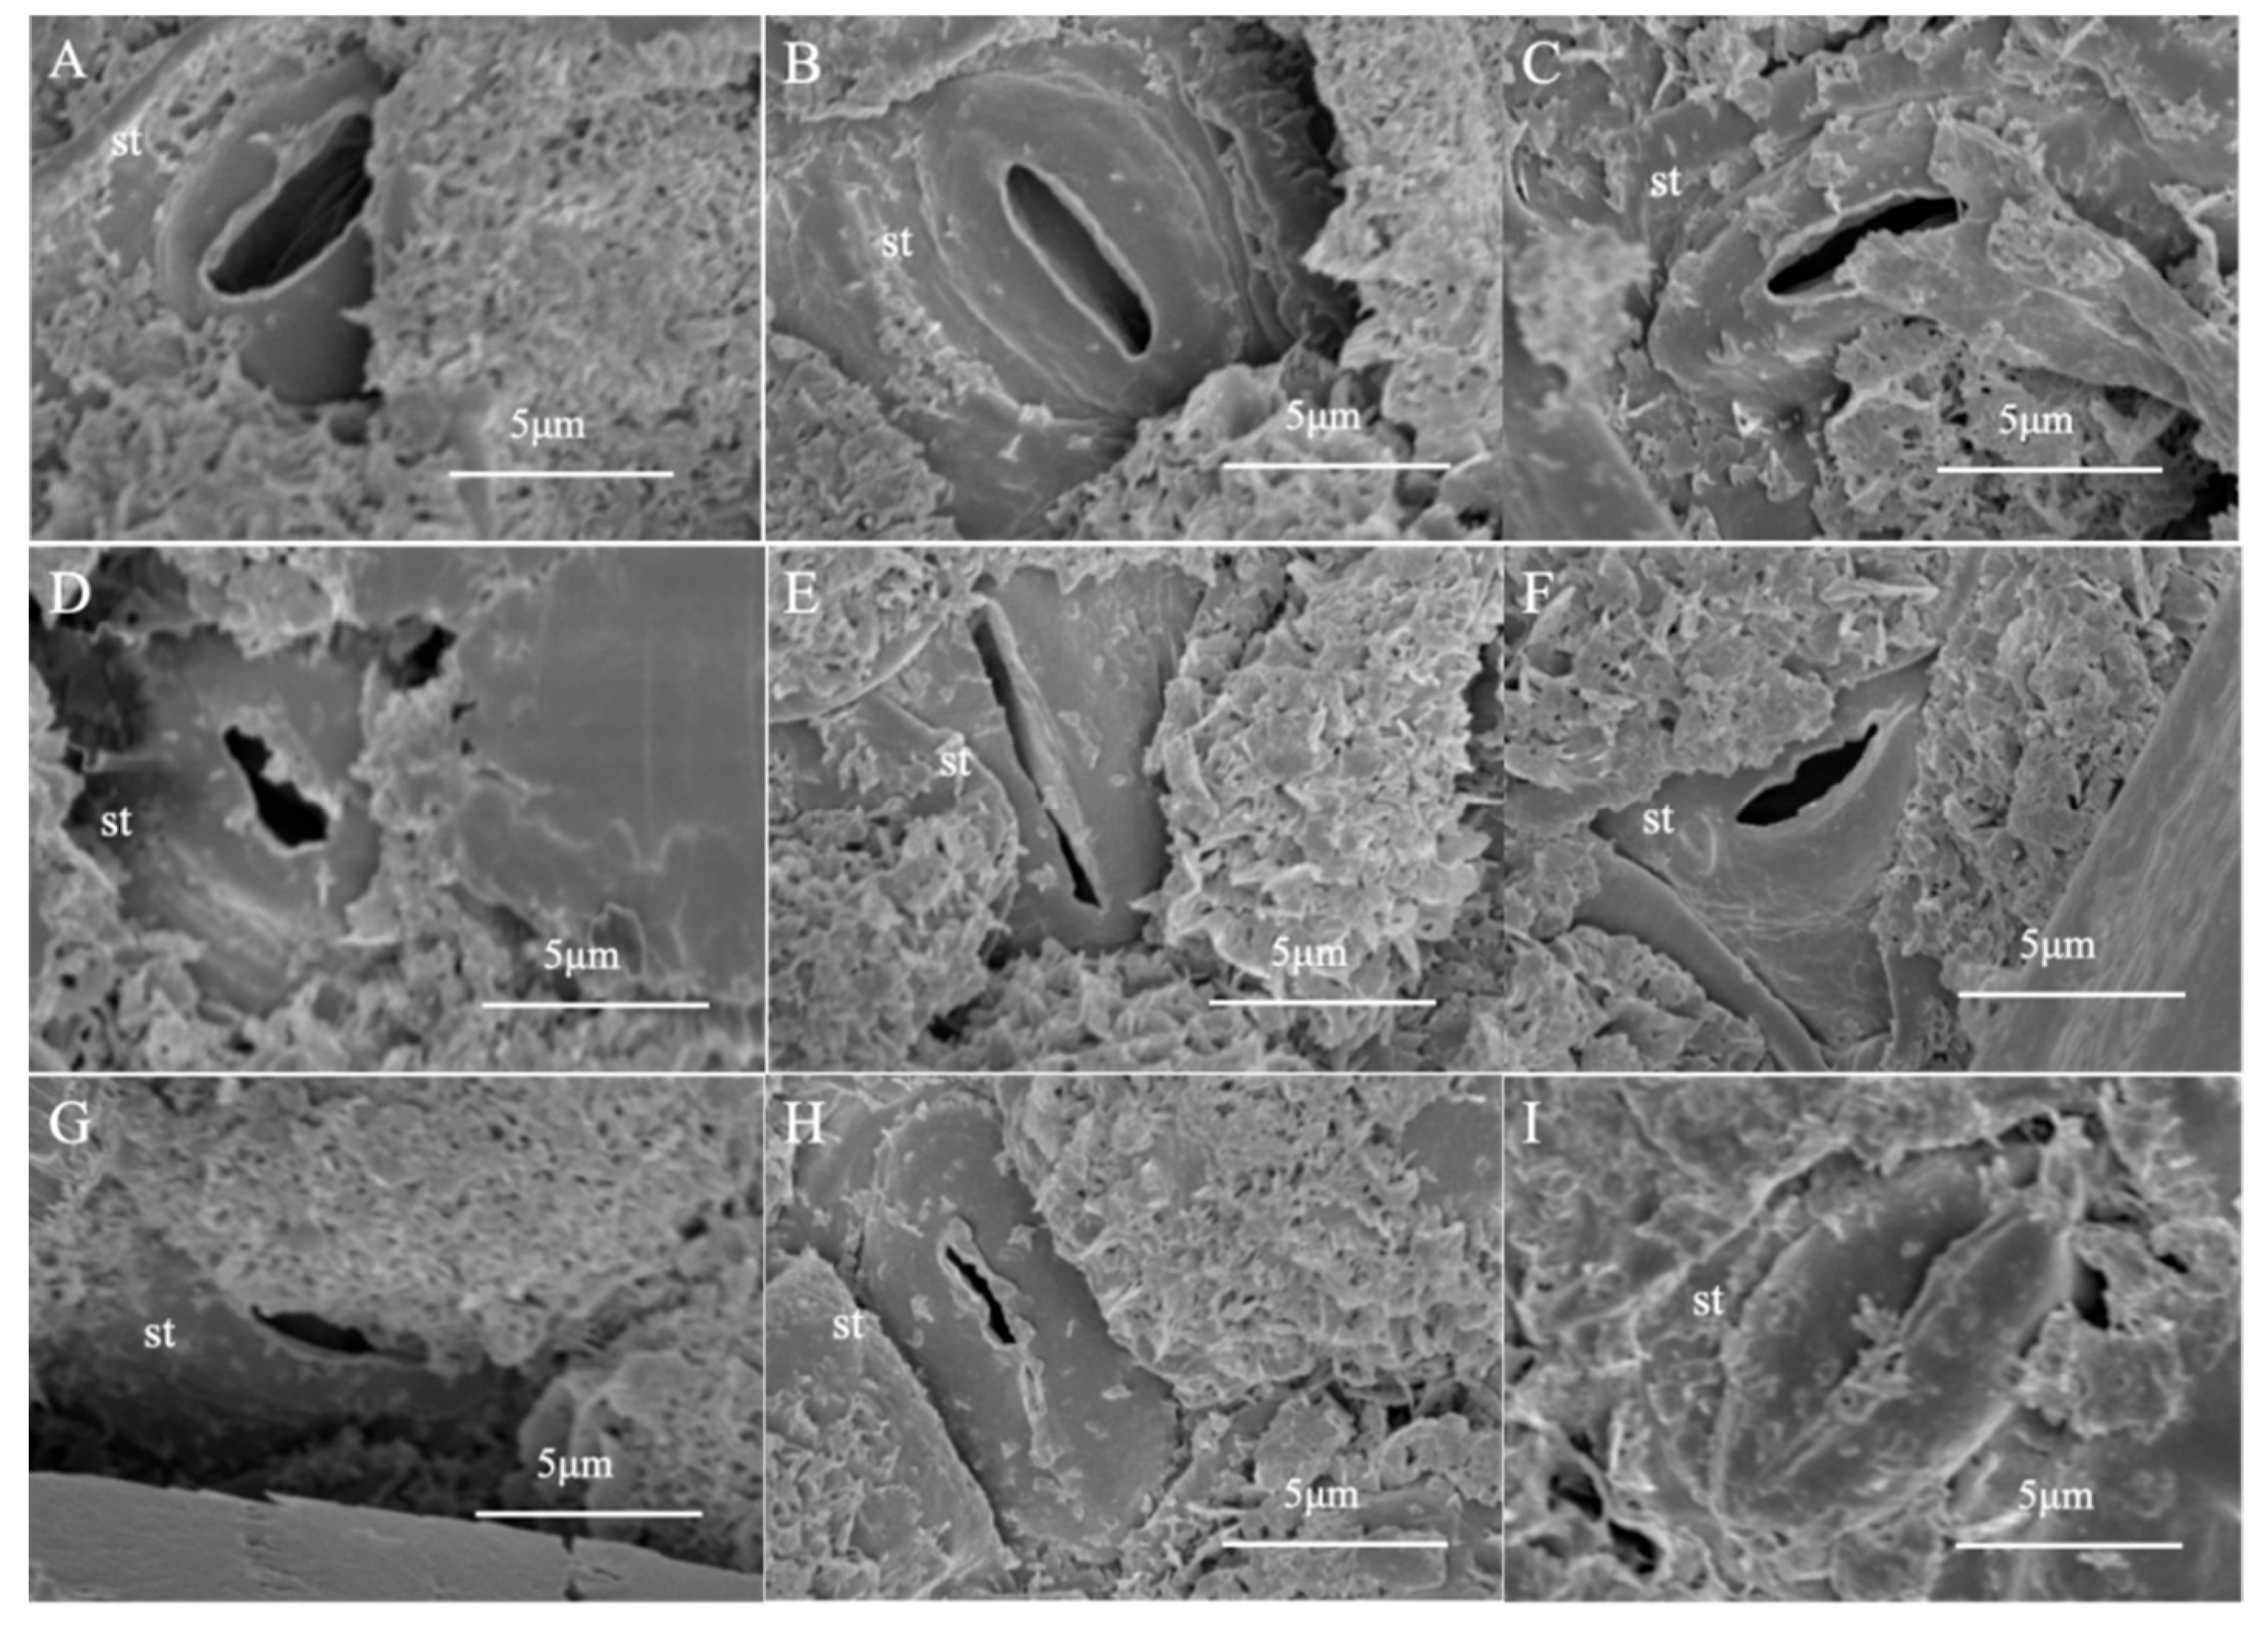
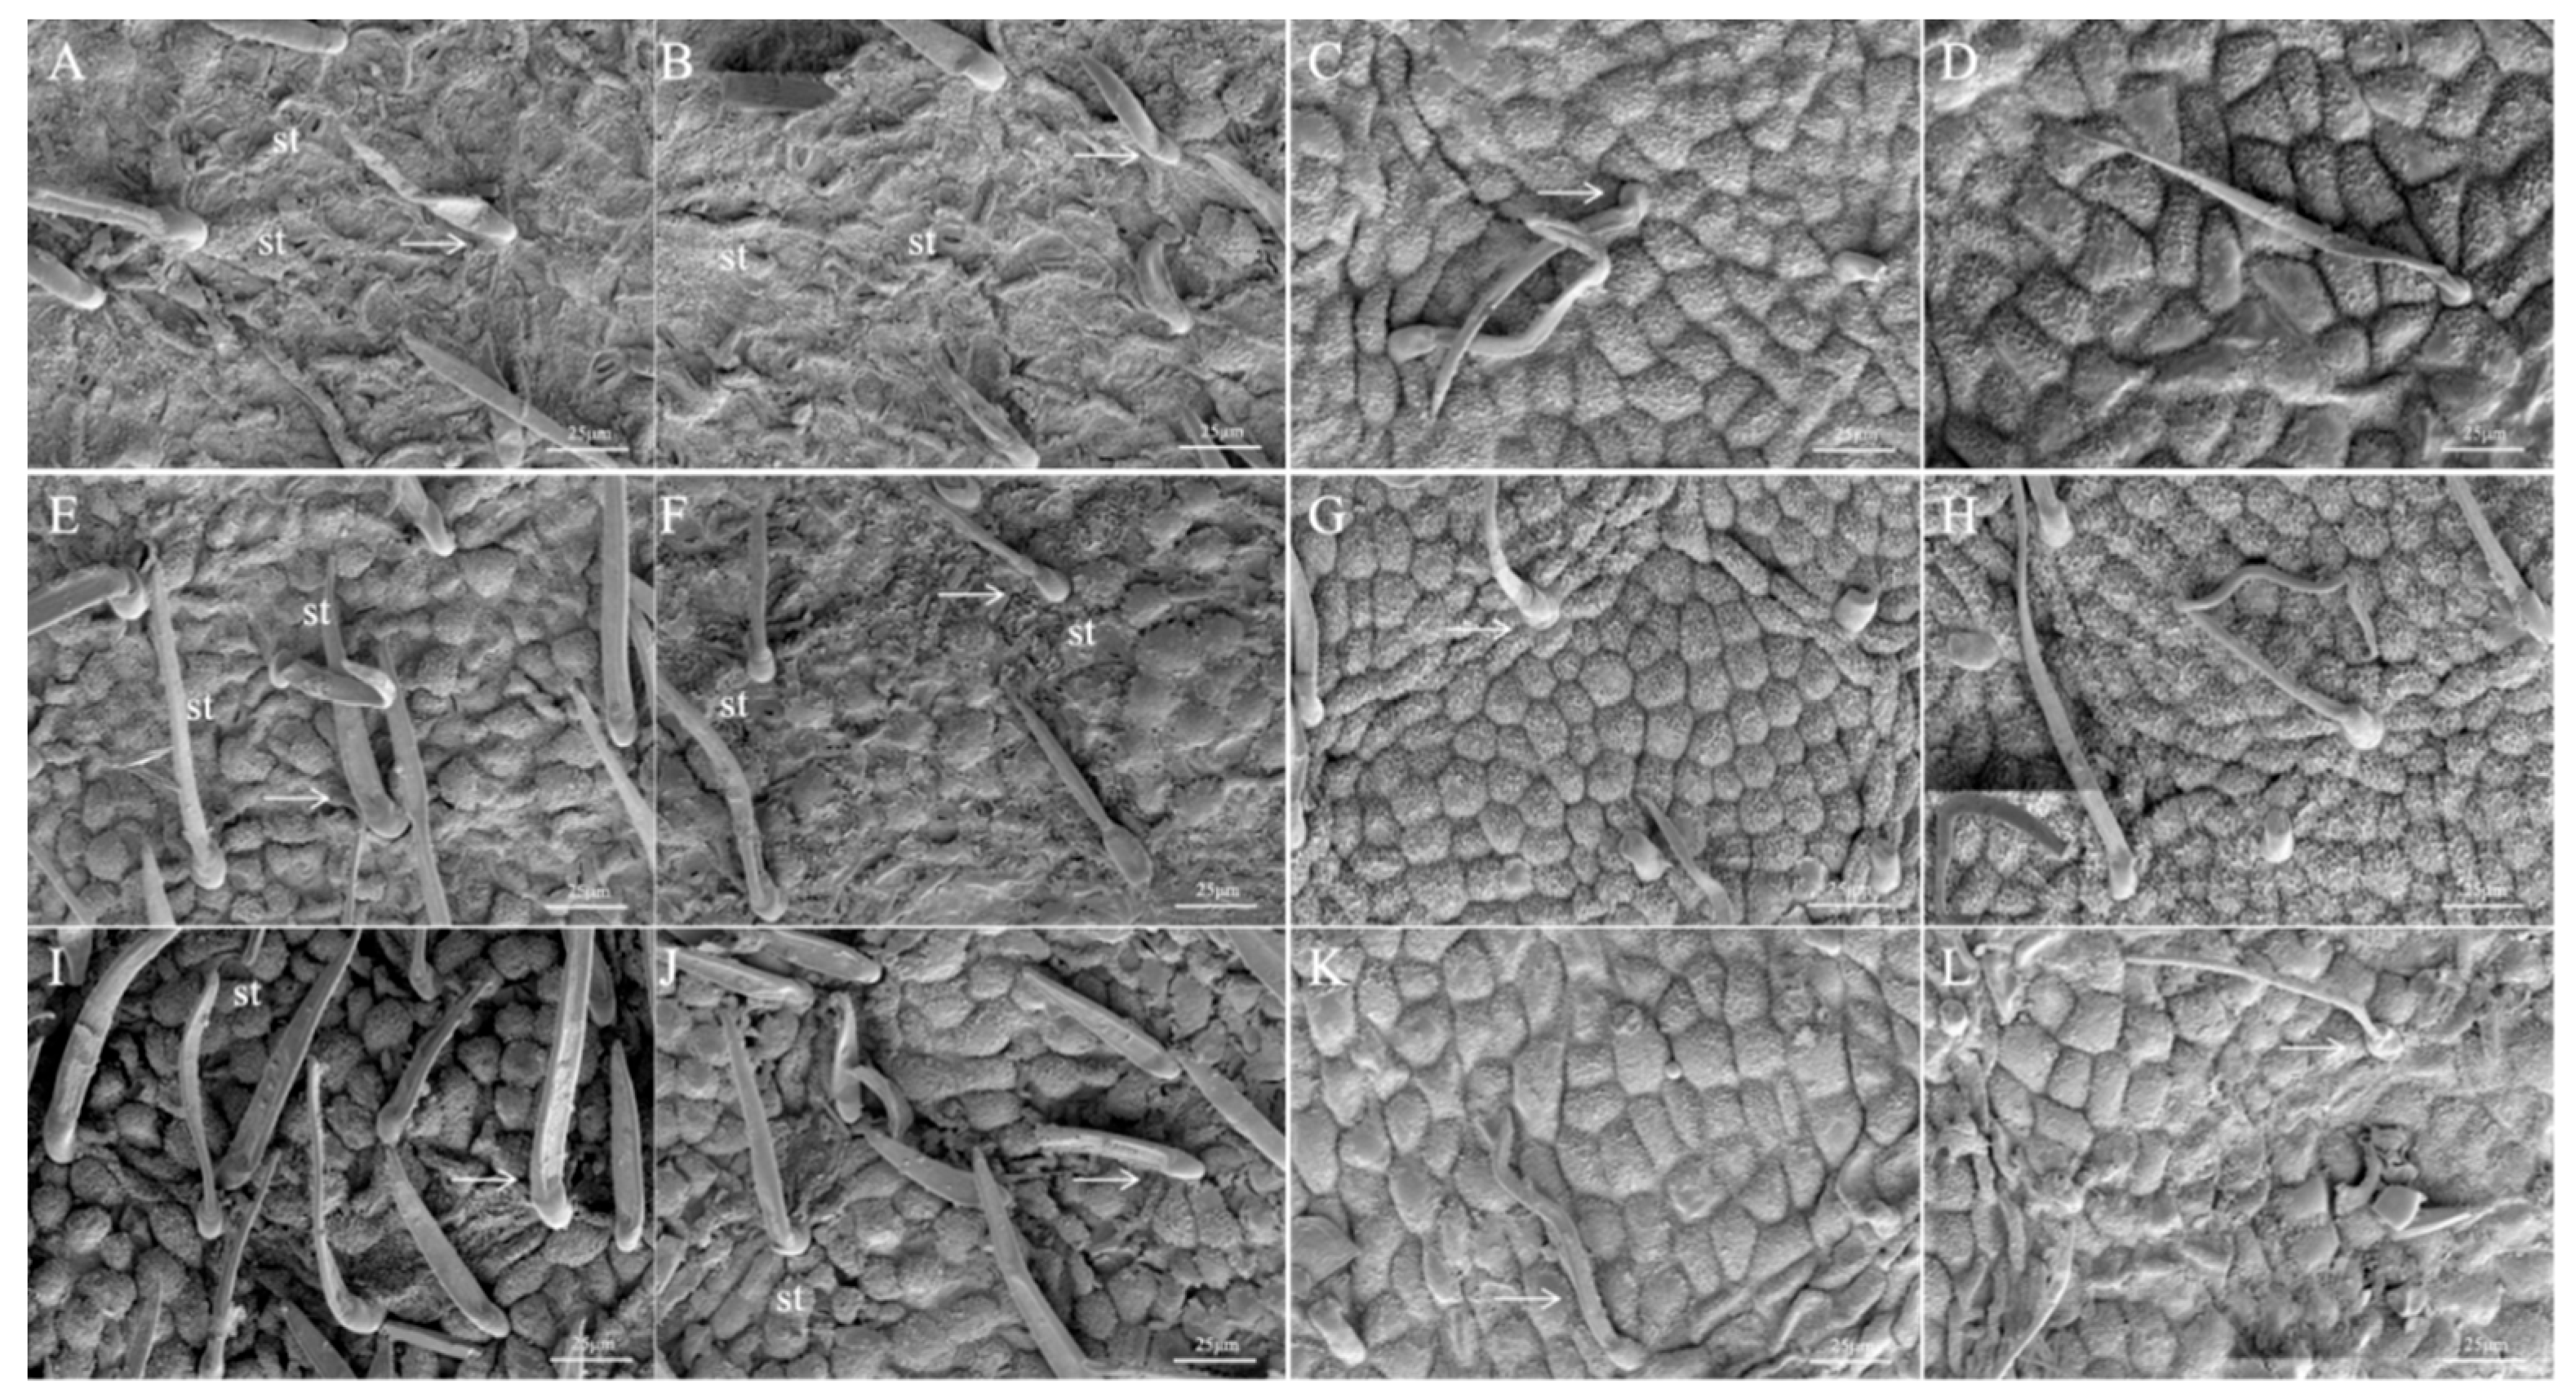
3.1. Effects of Drought Stress on Leaf Structure of Black Locust

The morphological characteristics of black locust leaves in terms of stomata are shown in Figure 1. Microstructural analysis revealed that the stomatal structures are predominantly located on the lower epidermis of the leaves. For CK plots with no water stress, the lower epidermis exhibited a higher density of stomata with clear structures, with each stoma being composed of two morphologically intact guard cells (Figure 1A–C). As drought stress intensified, the stomata on the lower epidermis gradually closed, transitioning from an open to a closed state, indicated by reduced stomatal widths in both MD and ED treatments compared to that in CK (Figure 1D–I). Under ED treatment, stomatal length decreased significantly, with an average of 3.05 μm, which was 49.20% smaller than that in CK. No significant differences in the transverse axis length of the guard cells were observed among treatments. This indicates that the length of stomata on the lower epidermis of black locust leaves is relatively sensitive to drought stress and is significantly affected by stress. However, the morphology of guard cells remains relatively intact, demonstrating a relatively good water retention capacity.
Under normal moisture conditions, the epidermal hairs on the lower epidermis of the leaves were arranged sparsely, but their quantity was higher than that on the upper epidermis (Figure 2A–D). With the deepening of drought stress, both the density and length of the epidermal hairs on the lower epidermis of the leaves showed a gradually increasing trend (Figure 2E,F,I,J). This phenomenon indicates that when subjected to drought stress, black locust increases the number of epidermal hairs to enhance its drought resistance ability and consequently reduce water loss more effectively. The morphology of the epidermal hairs on the upper epidermis (ventral surface of the leaf) became more slender compared with the control group, and the quantity first increased and then decreased with the deepening of stress. Under severe drought treatment, the breakage of epidermal hairs was relatively severe, reflecting that under severe drought (ED) stress, the drought resistance capacity of black locust approached its tolerance limit (Figure 2).

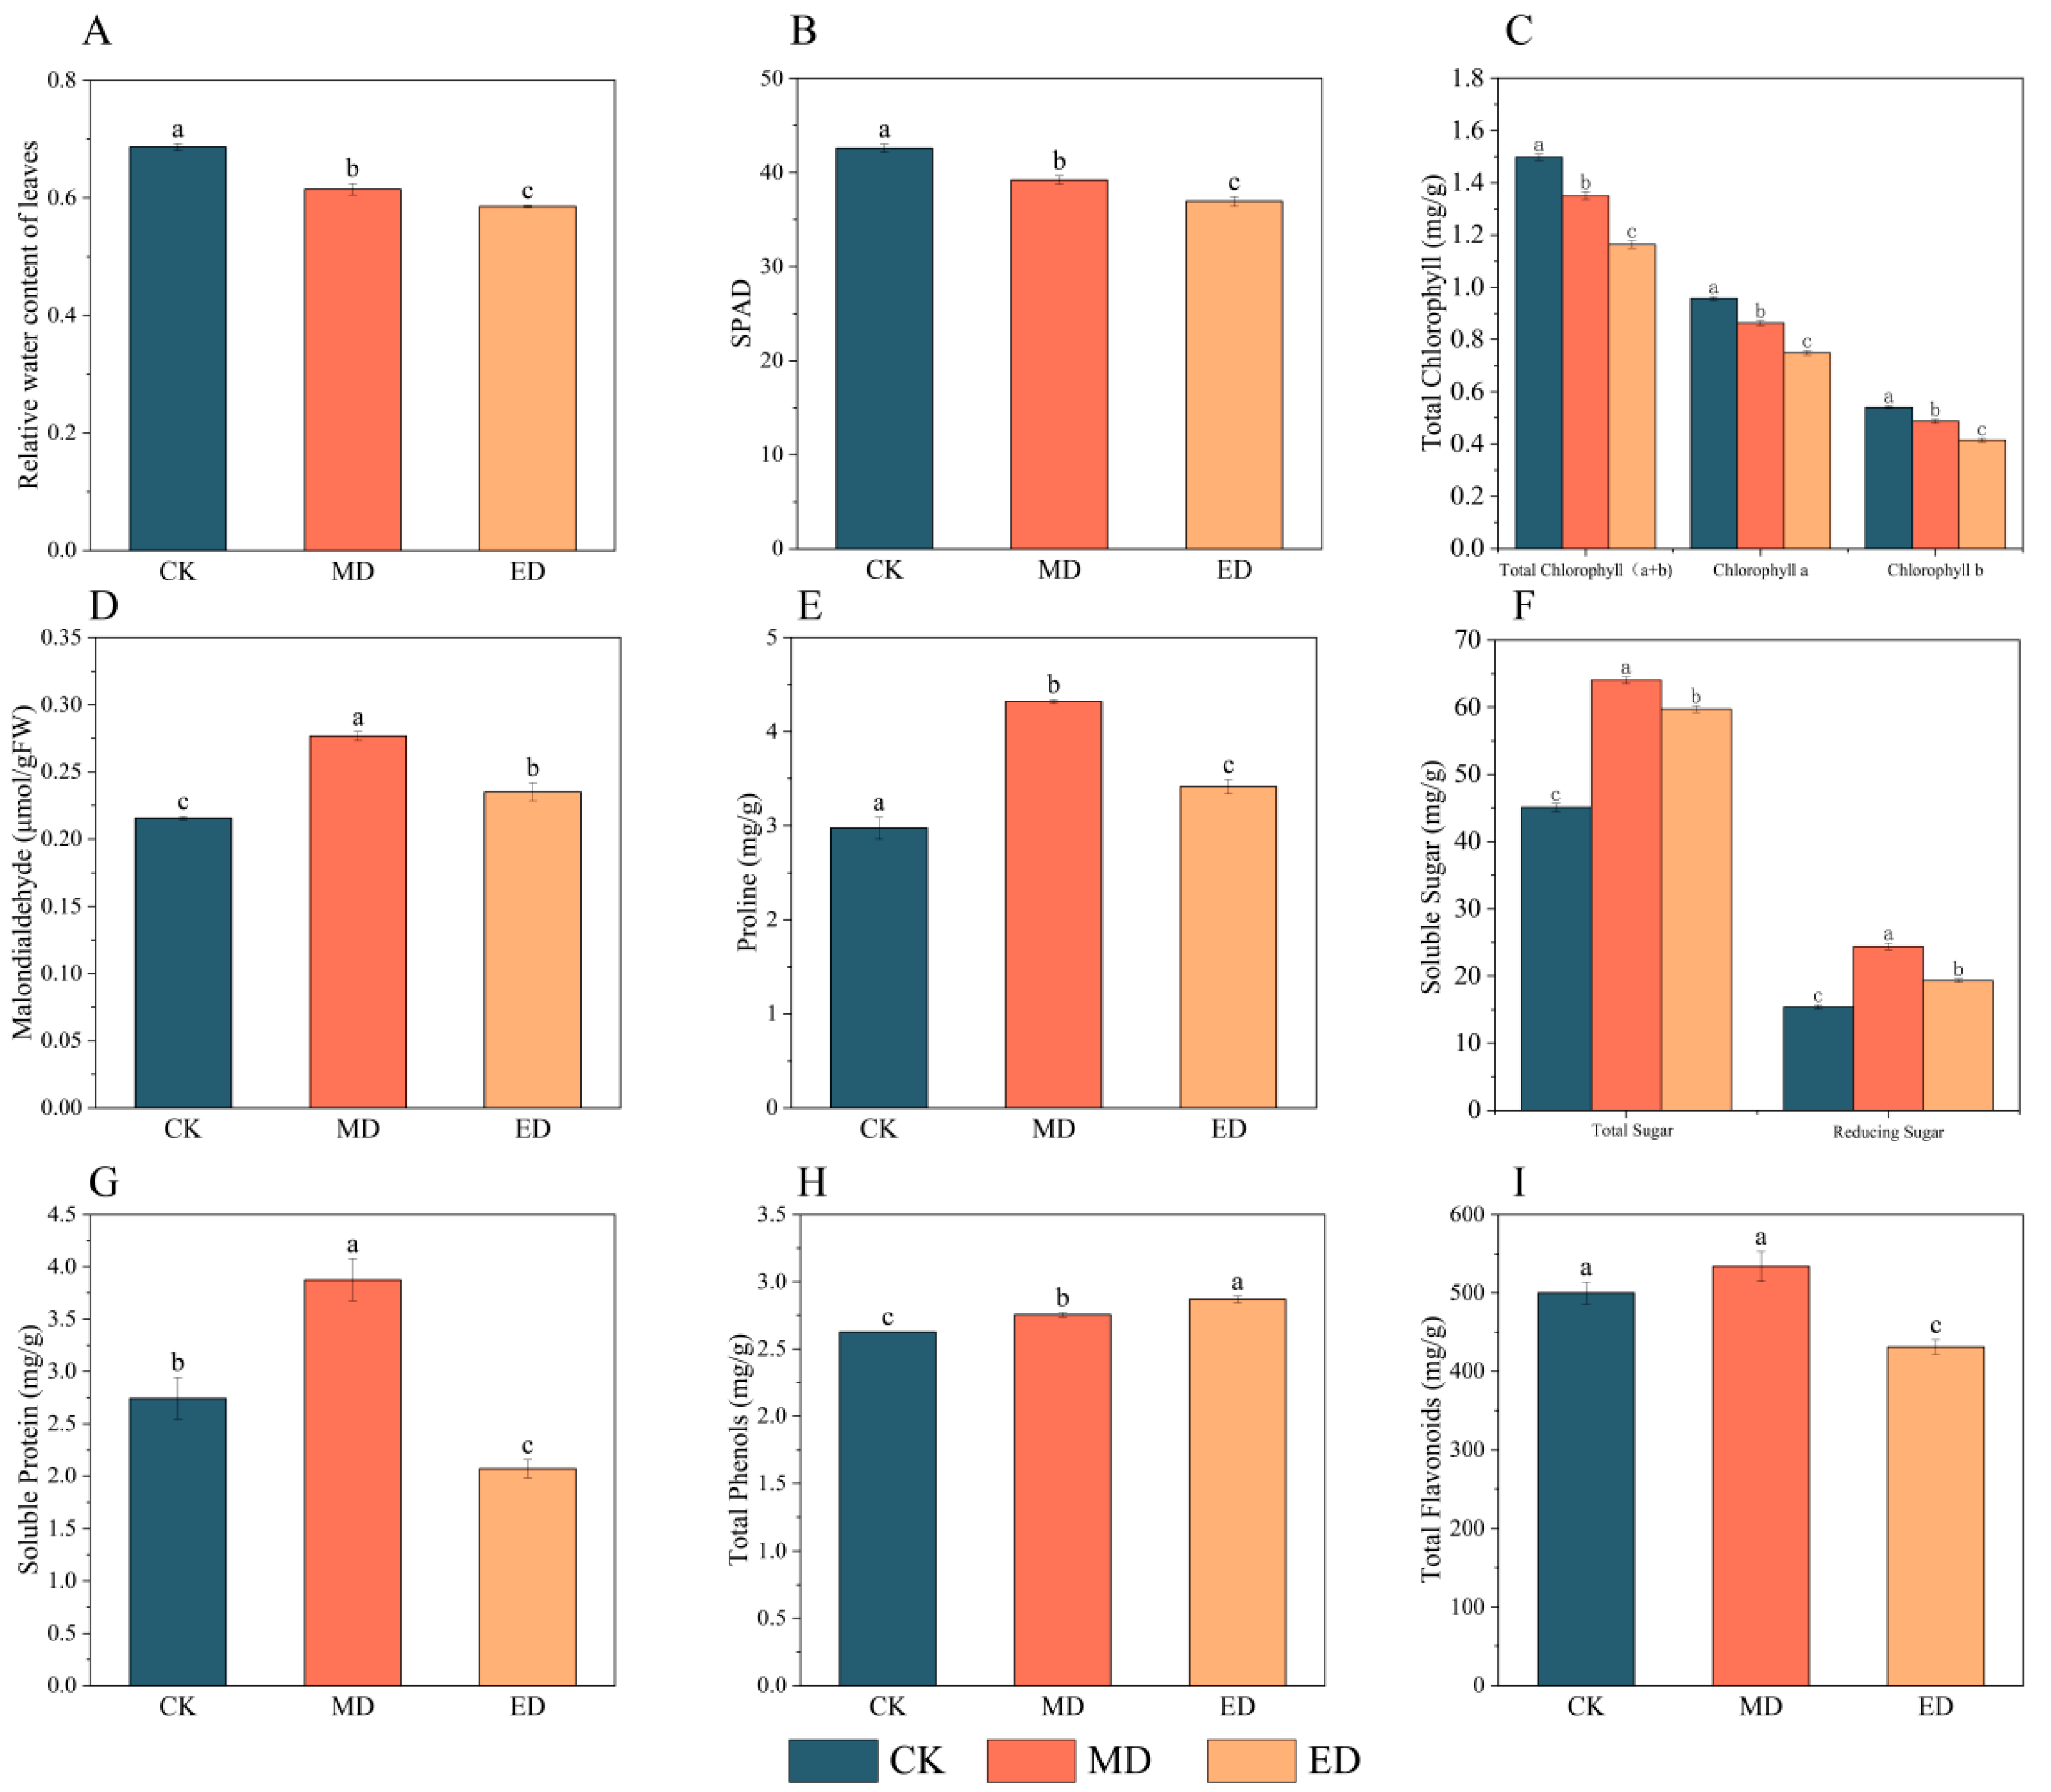
3.2. Effects of Drought Stress on Leaf Physiology of Black Locust

3.2.1. Leaf Relative Water Content

A significant decline in the relative water content (RWC) of black locust leaves was observed as drought stress intensified (p < 0.05) (Figure 3A). RWC decreased to 61.48% and 58.53% under MD and ED, representing 10.39% and 14.69% reductions compared to that in CK (68.61%), respectively.

3.2.2. Photosynthetic Pigment Content

The SPAD value and chlorophyll a (chla) and chlorophyll b (chlb) contents of black locust leaves showed decreasing trends as drought stress intensified. (Figure 3B,C) All of the photosynthetic pigments reached their lowest value in ED, with these values being significantly lower than those in CK (p < 0.05). The SPAD values in MD and ED were 92.09% and 86.73% of that in CK. Under MD and ED, chla and chlb decreased by 9.80% and 21.70% and by 10.10% and 23.51%, respectively, compared with those in CK. The change trend of total chlorophyll (chla + chlb) was the same as that of chlorophyll a and chlorophyll b (Figure 3C). It was in a continuous downward process during the entire drought stress process. Under ED treatment, the total chlorophyll content was the lowest, which was 77.64% of the control.

3.2.3. Malondialdehyde and Osmoregulatory Substances

The contents of osmoregulatory substances in black locust leaves in terms of malondialdehyde (MDA), free proline, total soluble sugar, reducing sugar, and soluble protein showed increasing and decreasing trends with the increase in drought stress, with their highest values found in MD (Figure 3D–G). The MDA contents under drought treatments were significantly higher than that under CK (p < 0.05), with the highest MDA content found under MD (Figure 3D). The MDA levels under MD and ED were 28.17% and 9.04% higher than that under CK, respectively.
Under MD, free proline content reached its maximum value of 4.32 μ m / g , 1.45 times that of CK. Significant differences in the free proline content among different drought treatments were observed (p < 0.05) (Figure 3E). Compared with CK, the total soluble sugar and reducing sugar under MD and ED increased by 44.16% and 32.41% and by 58.52% and 25.47%, respectively. There were significant differences in the contents of total soluble sugar and reducing sugar among different treatments (p < 0.05) (Figure 3F). The highest soluble protein content, found in MD, was 1.41 times that in CK, while the lowest value was found in ED, which was 24.61% lower than that in CK (Figure 3G).

3.2.4. Total Phenol and Total Flavone

Under drought treatments, the total phenol contents in black locust leaves were significantly higher than that in CK and showed an increasing trend with the increasing drought stress. As drought stress intensified, the total flavonoid content initially increased and then decreased, with the highest value observed in the MD treatment. The total flavonoid contents in MD and ED were 6.79% higher and 13.77% lower than that in CK, respectively. (Figure 3H,I).

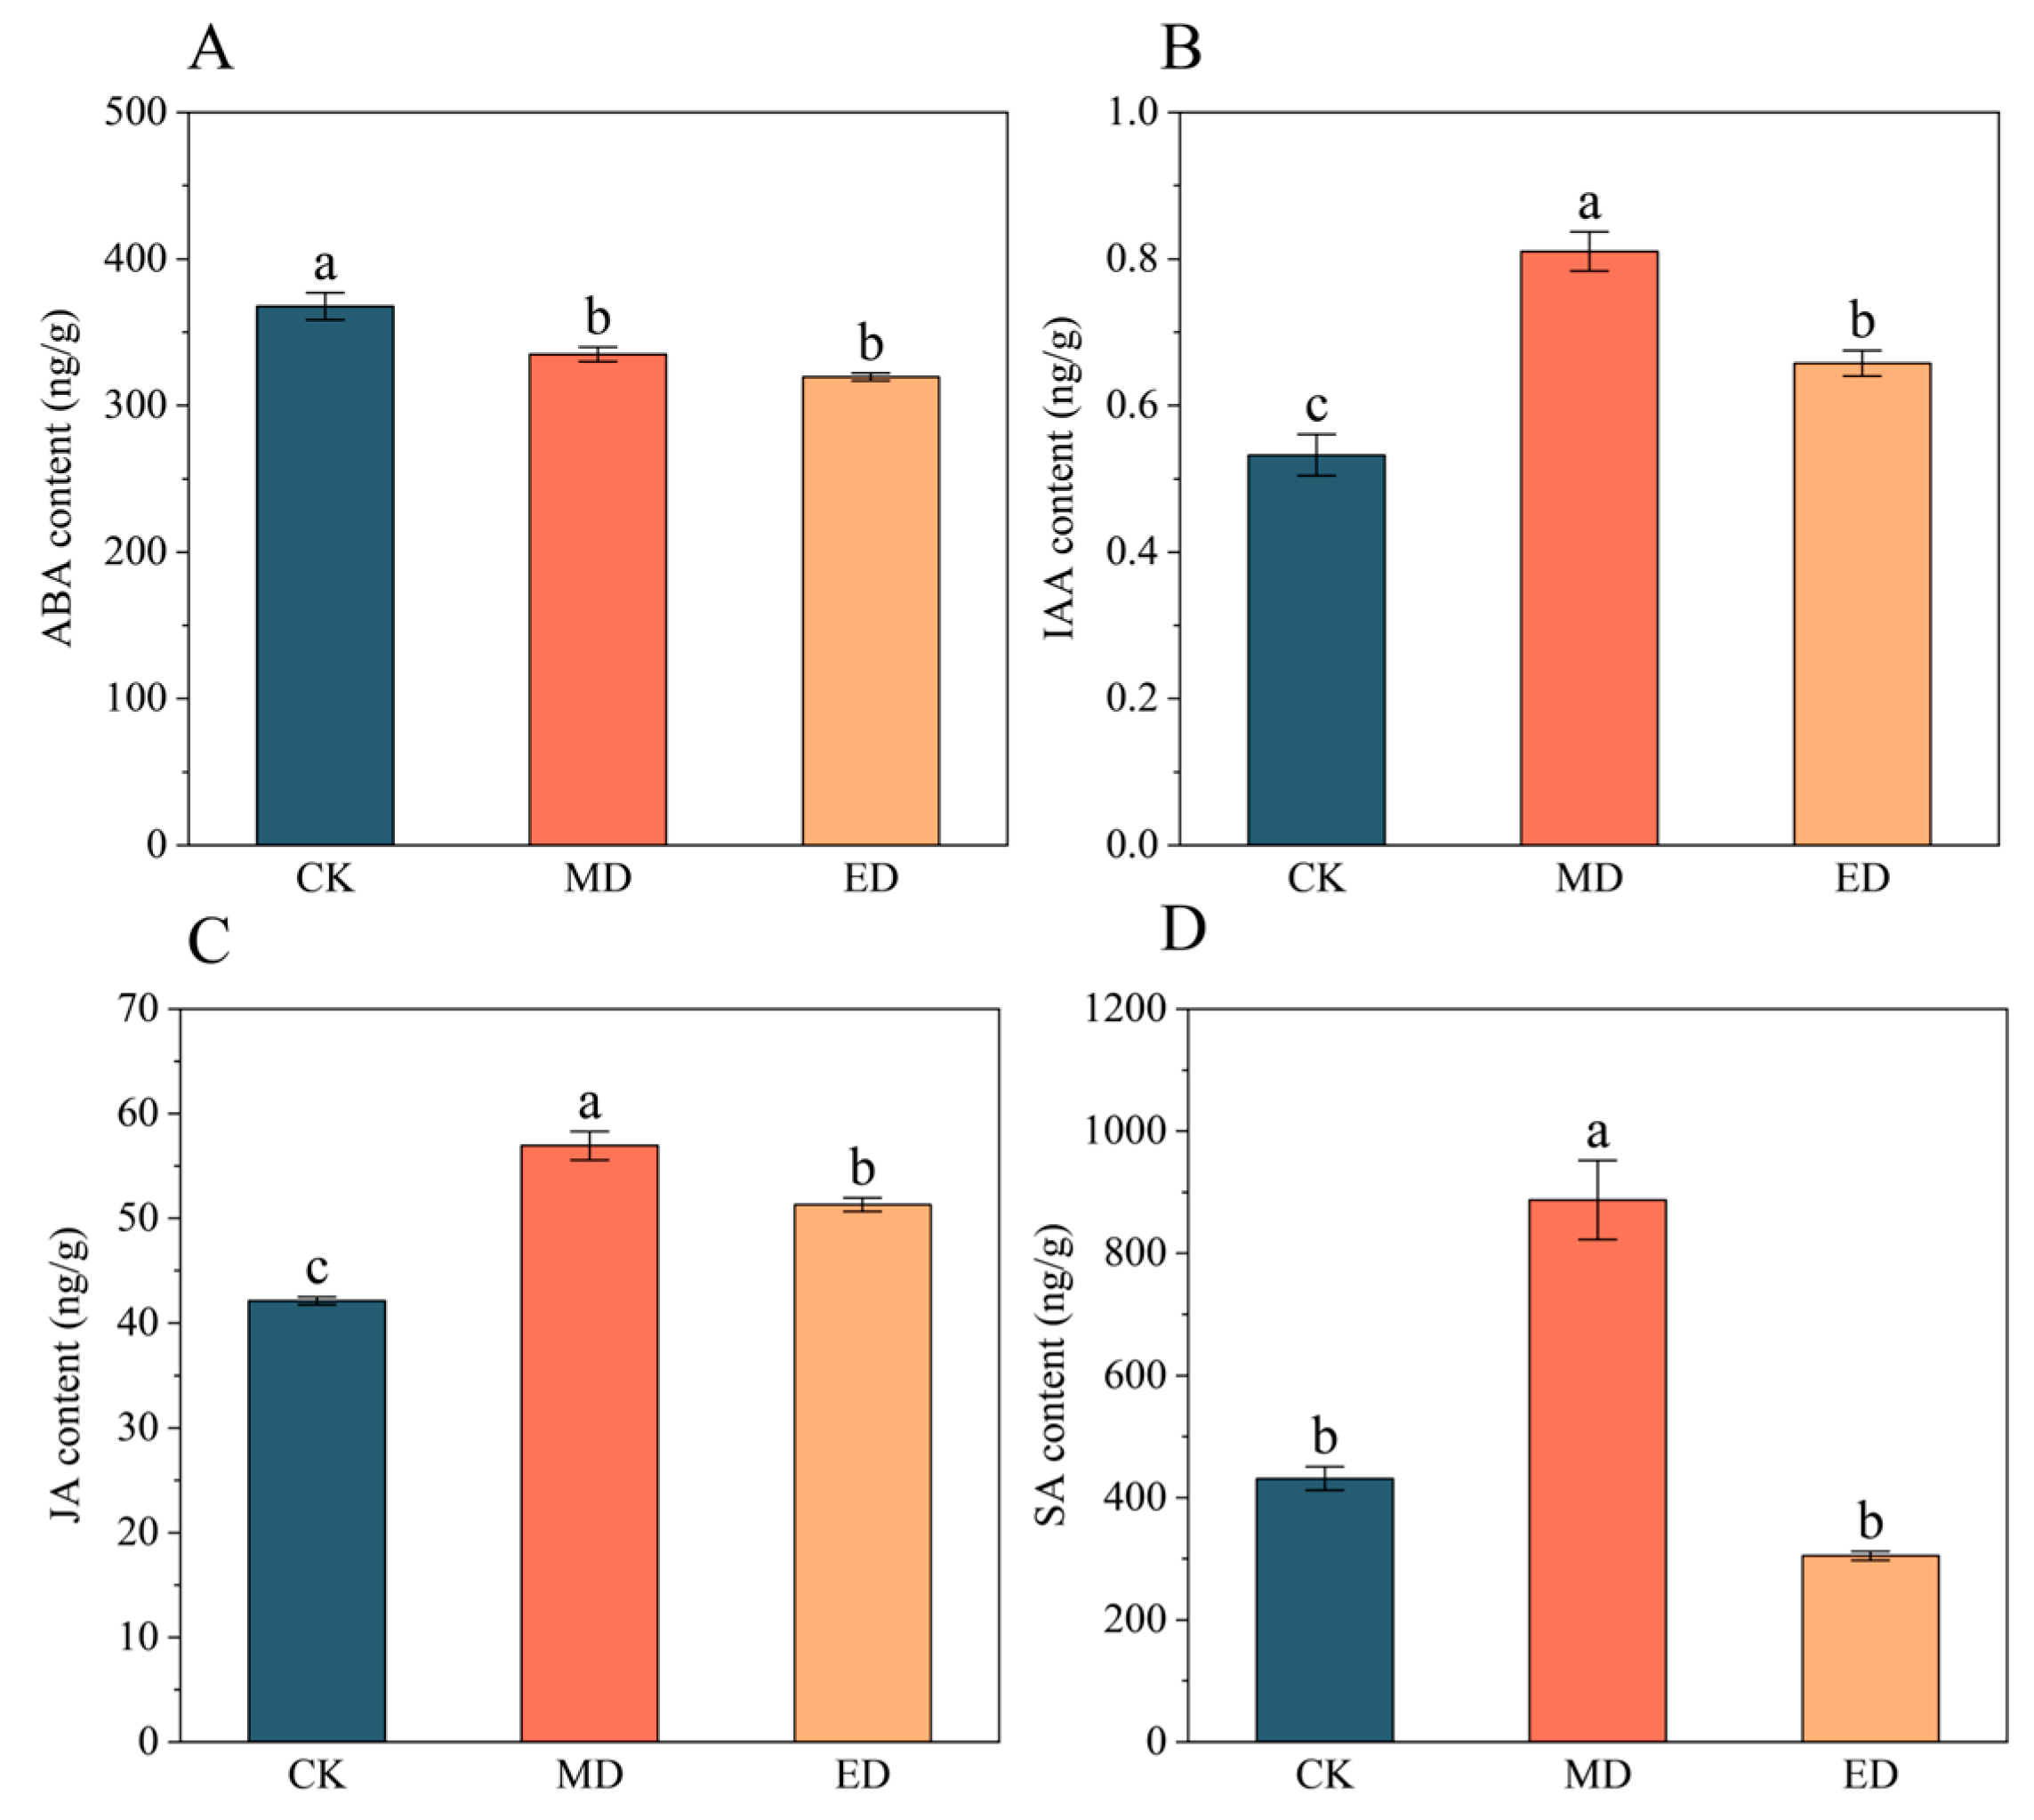
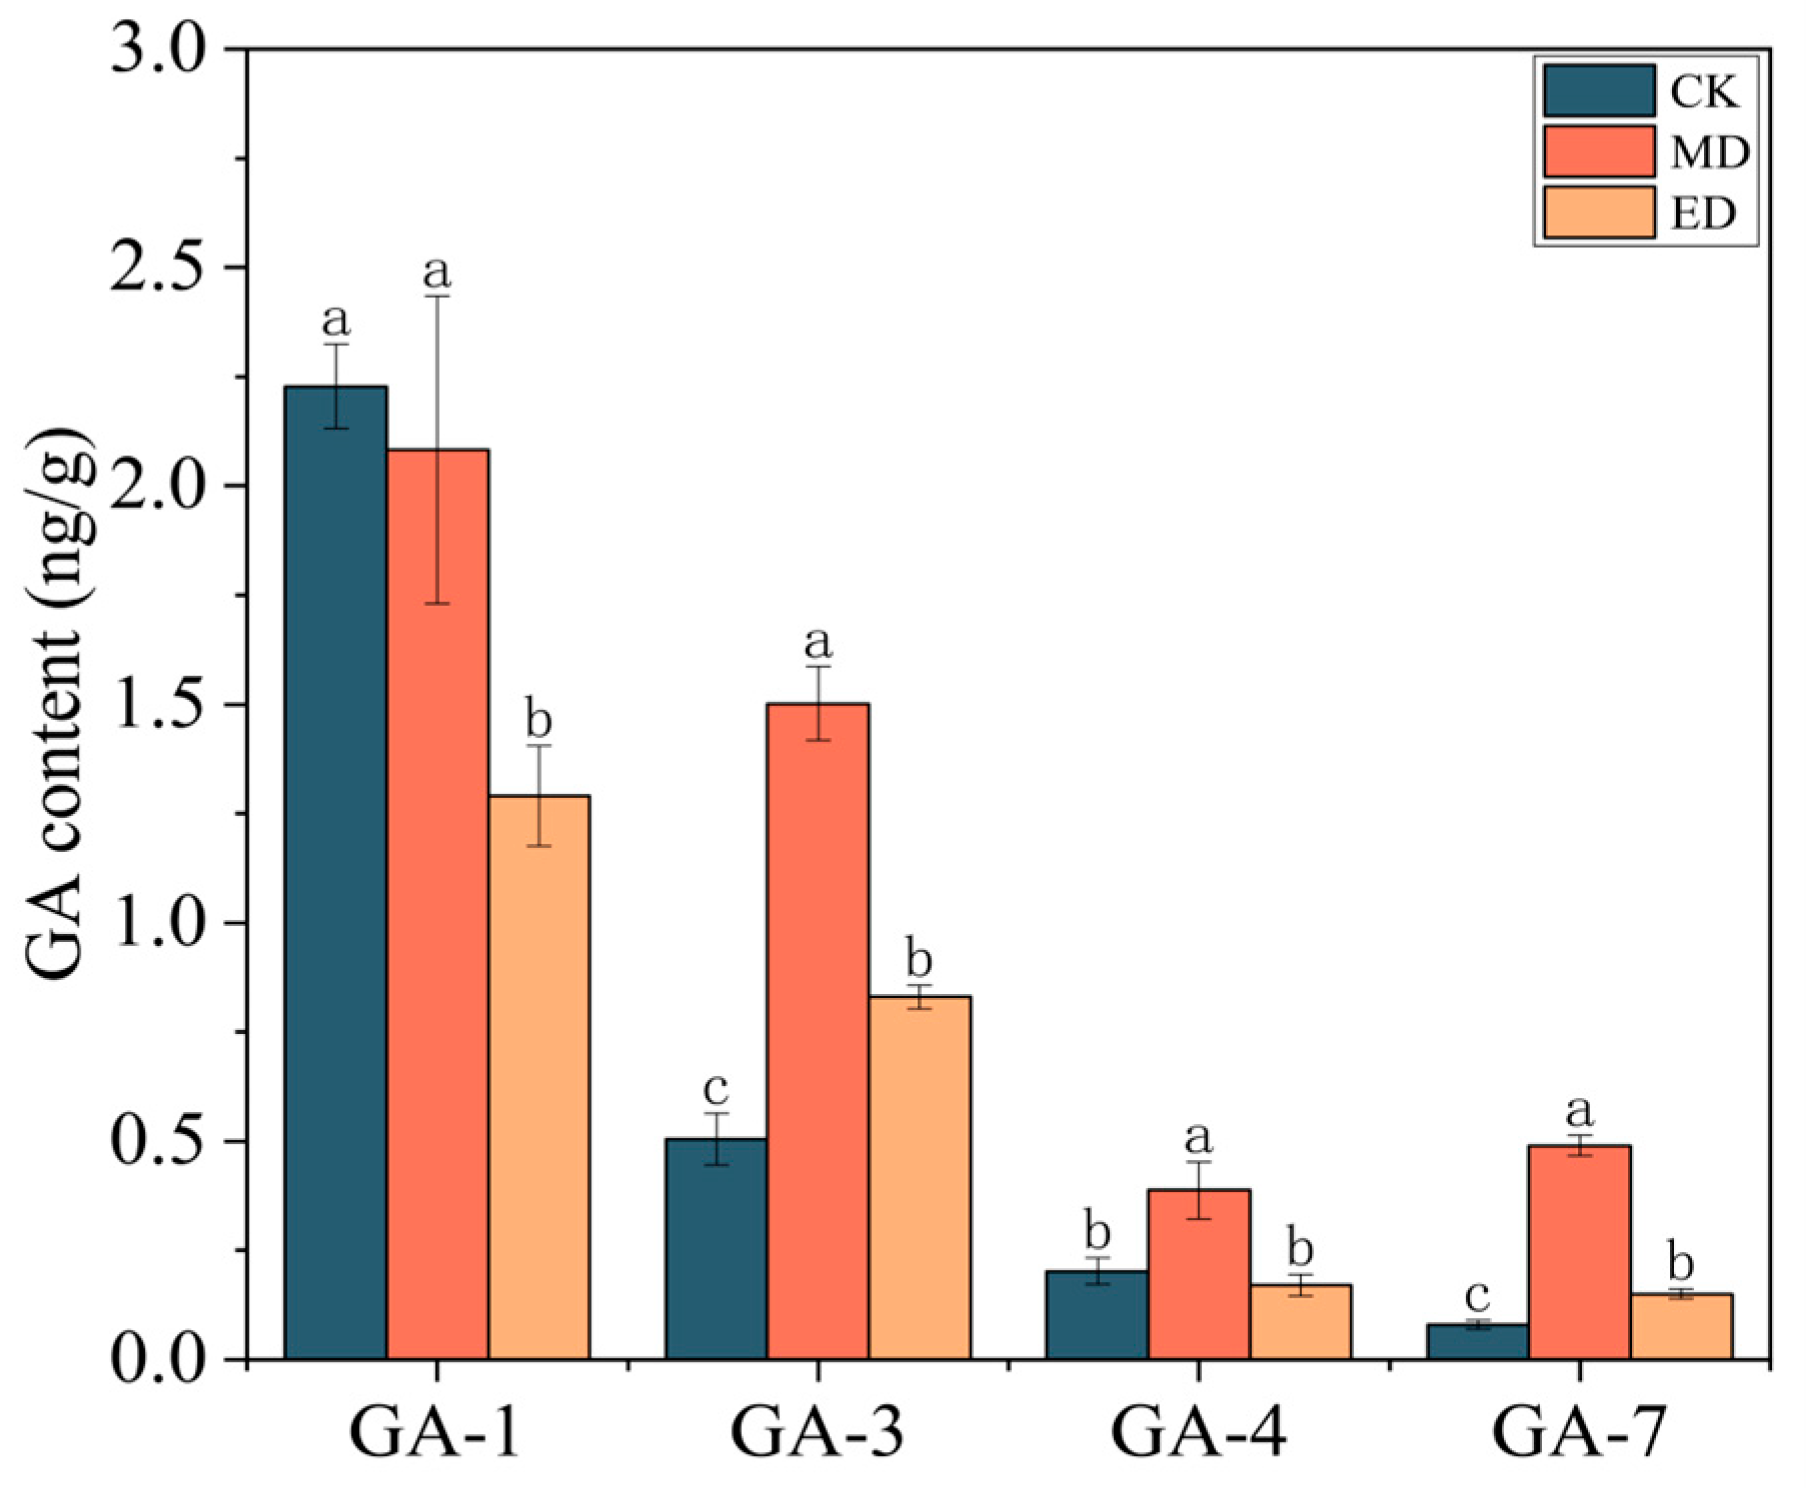
3.3. Hormone Content

In response to drought, abscisic acid (ABA) content in black locust leaves showed a gradually decreasing trend, while indoleacetic acid (IAA), jasmonic acid (JA), and salicylic acid (SA) initially increased and then decreased with the increasing drought stress. (Figure 4A–D) Significantly, the ABA content in CK was 8.90% and 13.10% higher than those in MD and ED treatments (p < 0.05), respectively. In addition, IAA, JA, and SA under MD were significantly higher than those under CK and ED (p < 0.05). The IAA and JA contents under MD treatment increased by 52.11% and 35.11%, respectively, compared with the control group. The contents of IAA and JA in the ED treatment group were increased by 23.47% and 21.76%, respectively. The SA content under MD treatment was 2.06 times that in CK, while under ED, it was 29.32% lower than that in CK.
As drought stress intensified, the content of GA-1 showed a gradually decreasing trend, while the contents of GA-3, GA-4, and GA-7 exhibited a fluctuating pattern, increasing first and then decreasing (Figure 5). Significant differences were observed in gibberellin among treatments. The GA-1 in the ED group was significantly lower than that in the CK group, being only 0.58 times that in the CK group. Under MD and ED treatments, GA-3 was 197.37% and 64.36% higher than that in the CK group, respectively, and GA-4 and GA-7 were 1.91 times and 6.13 times that in the CK group, respectively. Under ED treatment, GA-4 and GA-7 were 16.05% lower and 87.50% higher than that in the CK group, respectively.

3.4. Flavonoids Metabolome

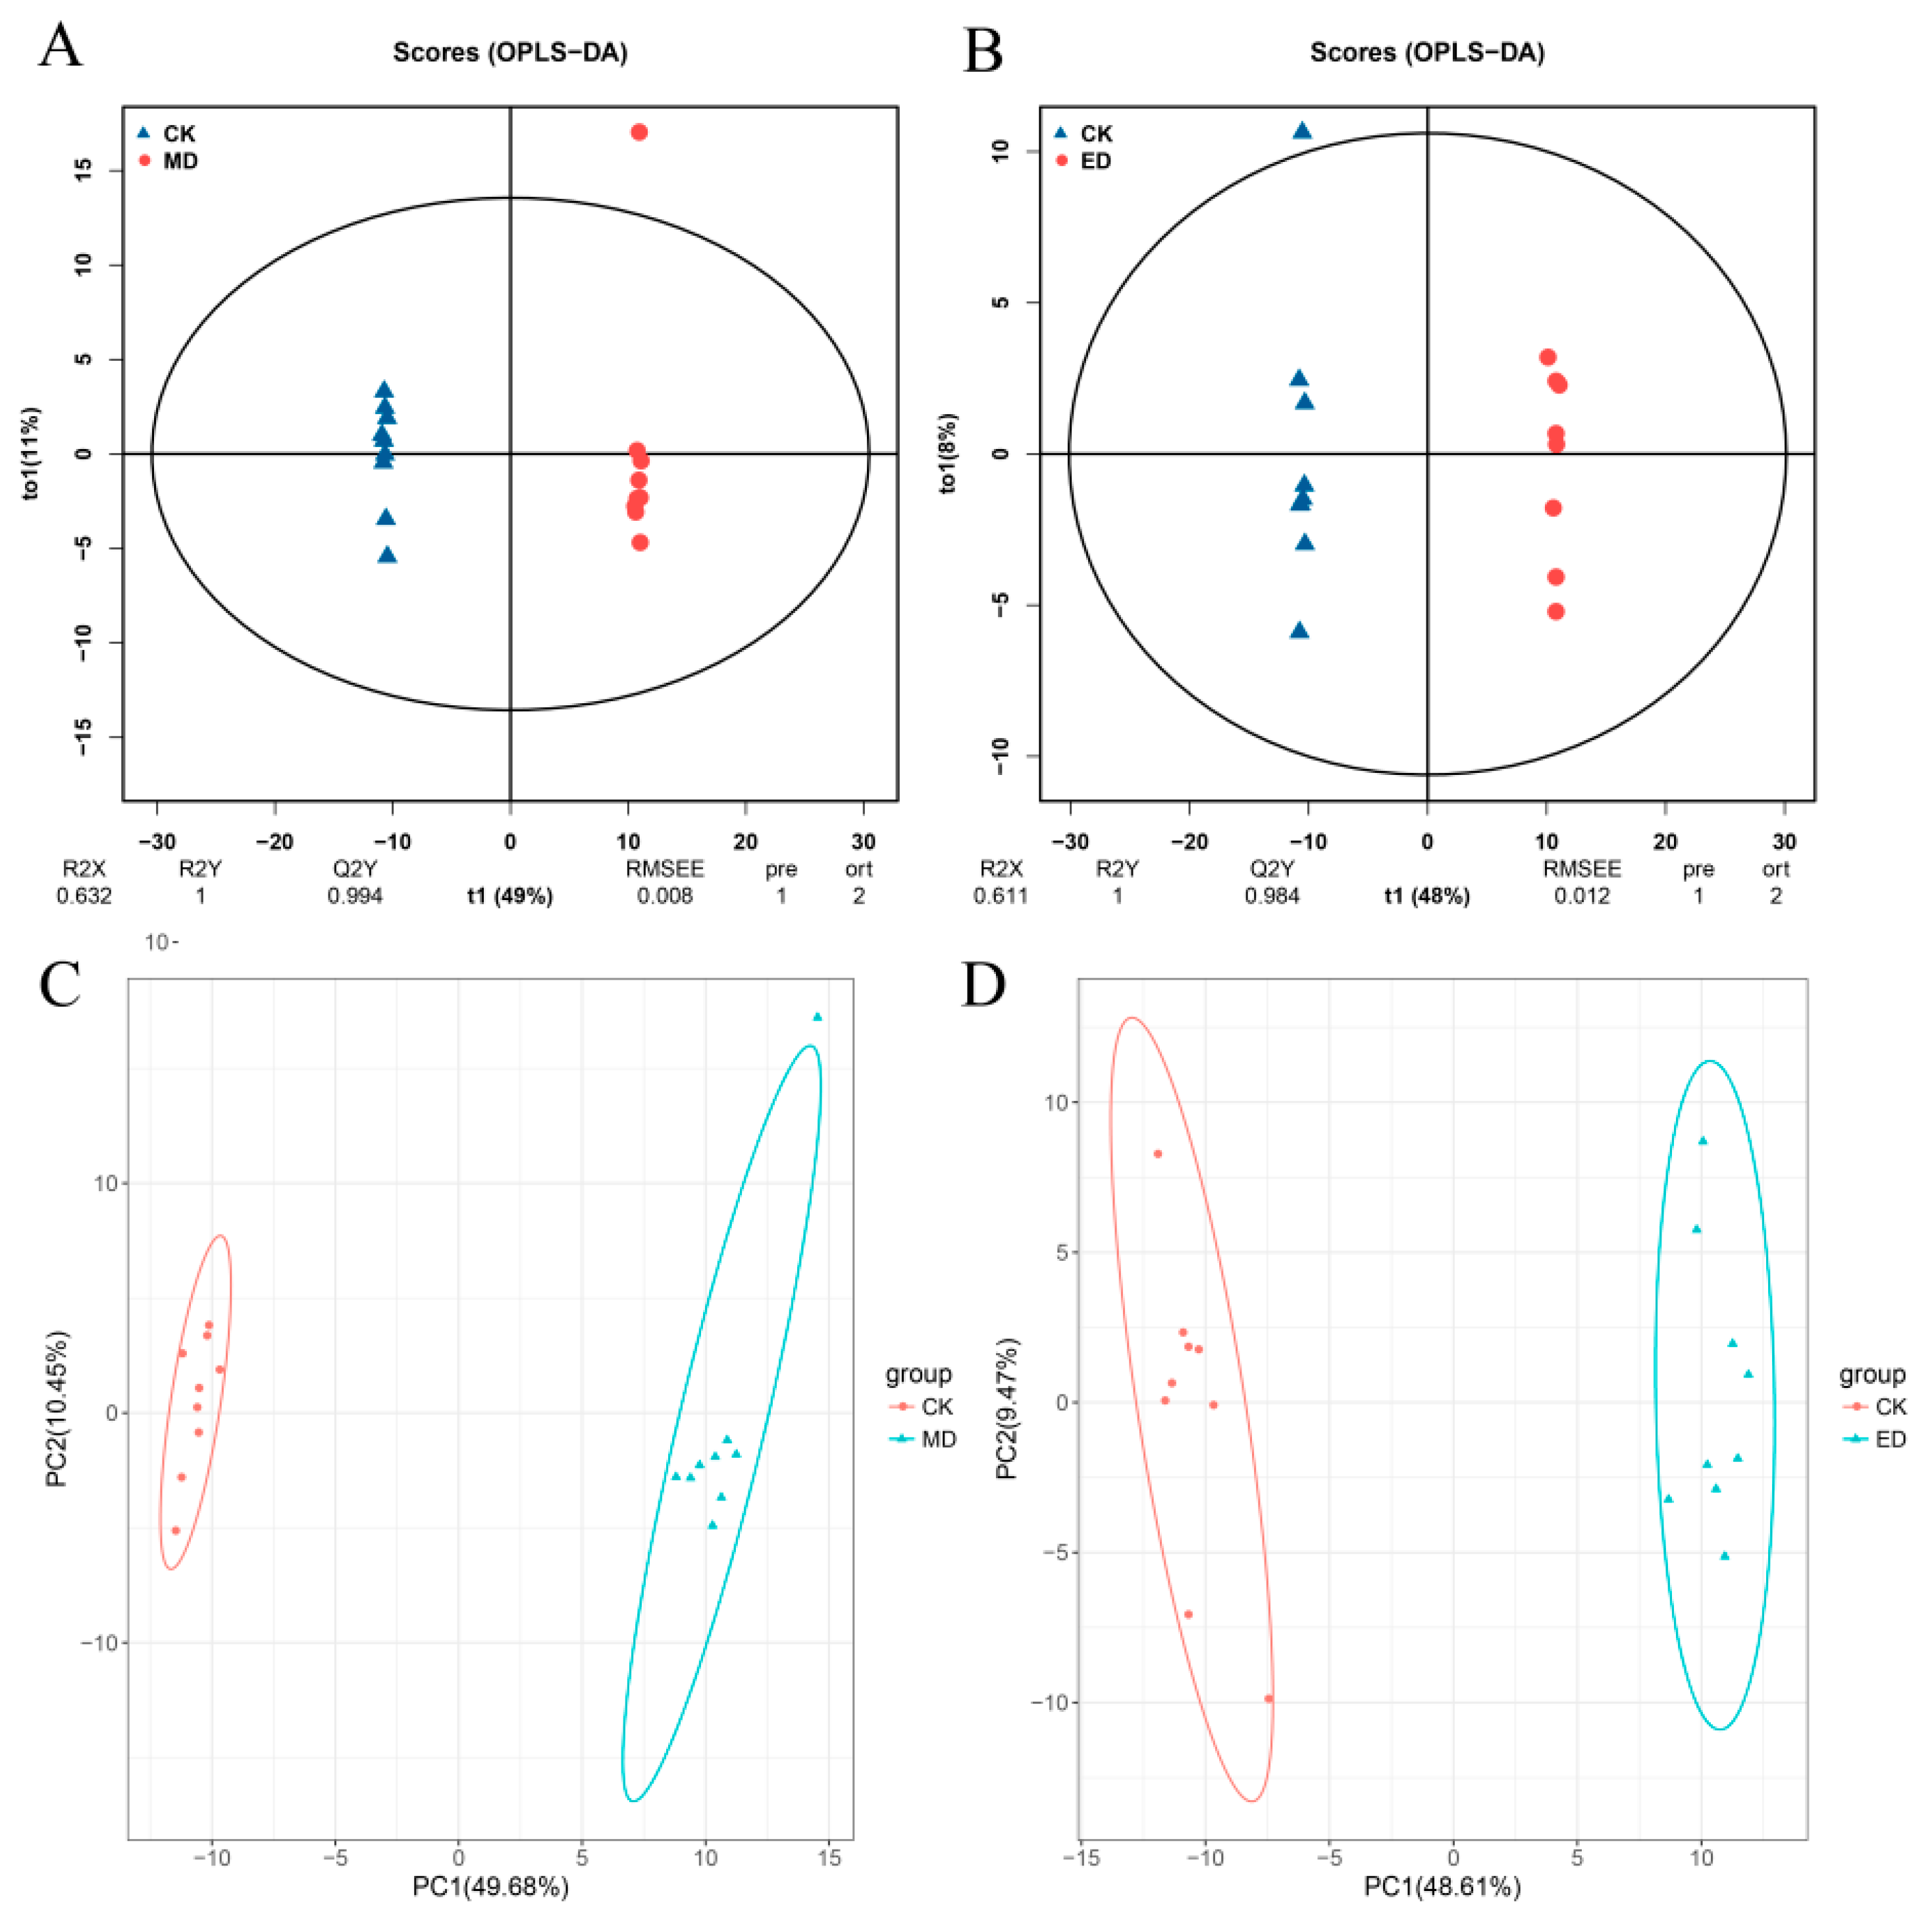
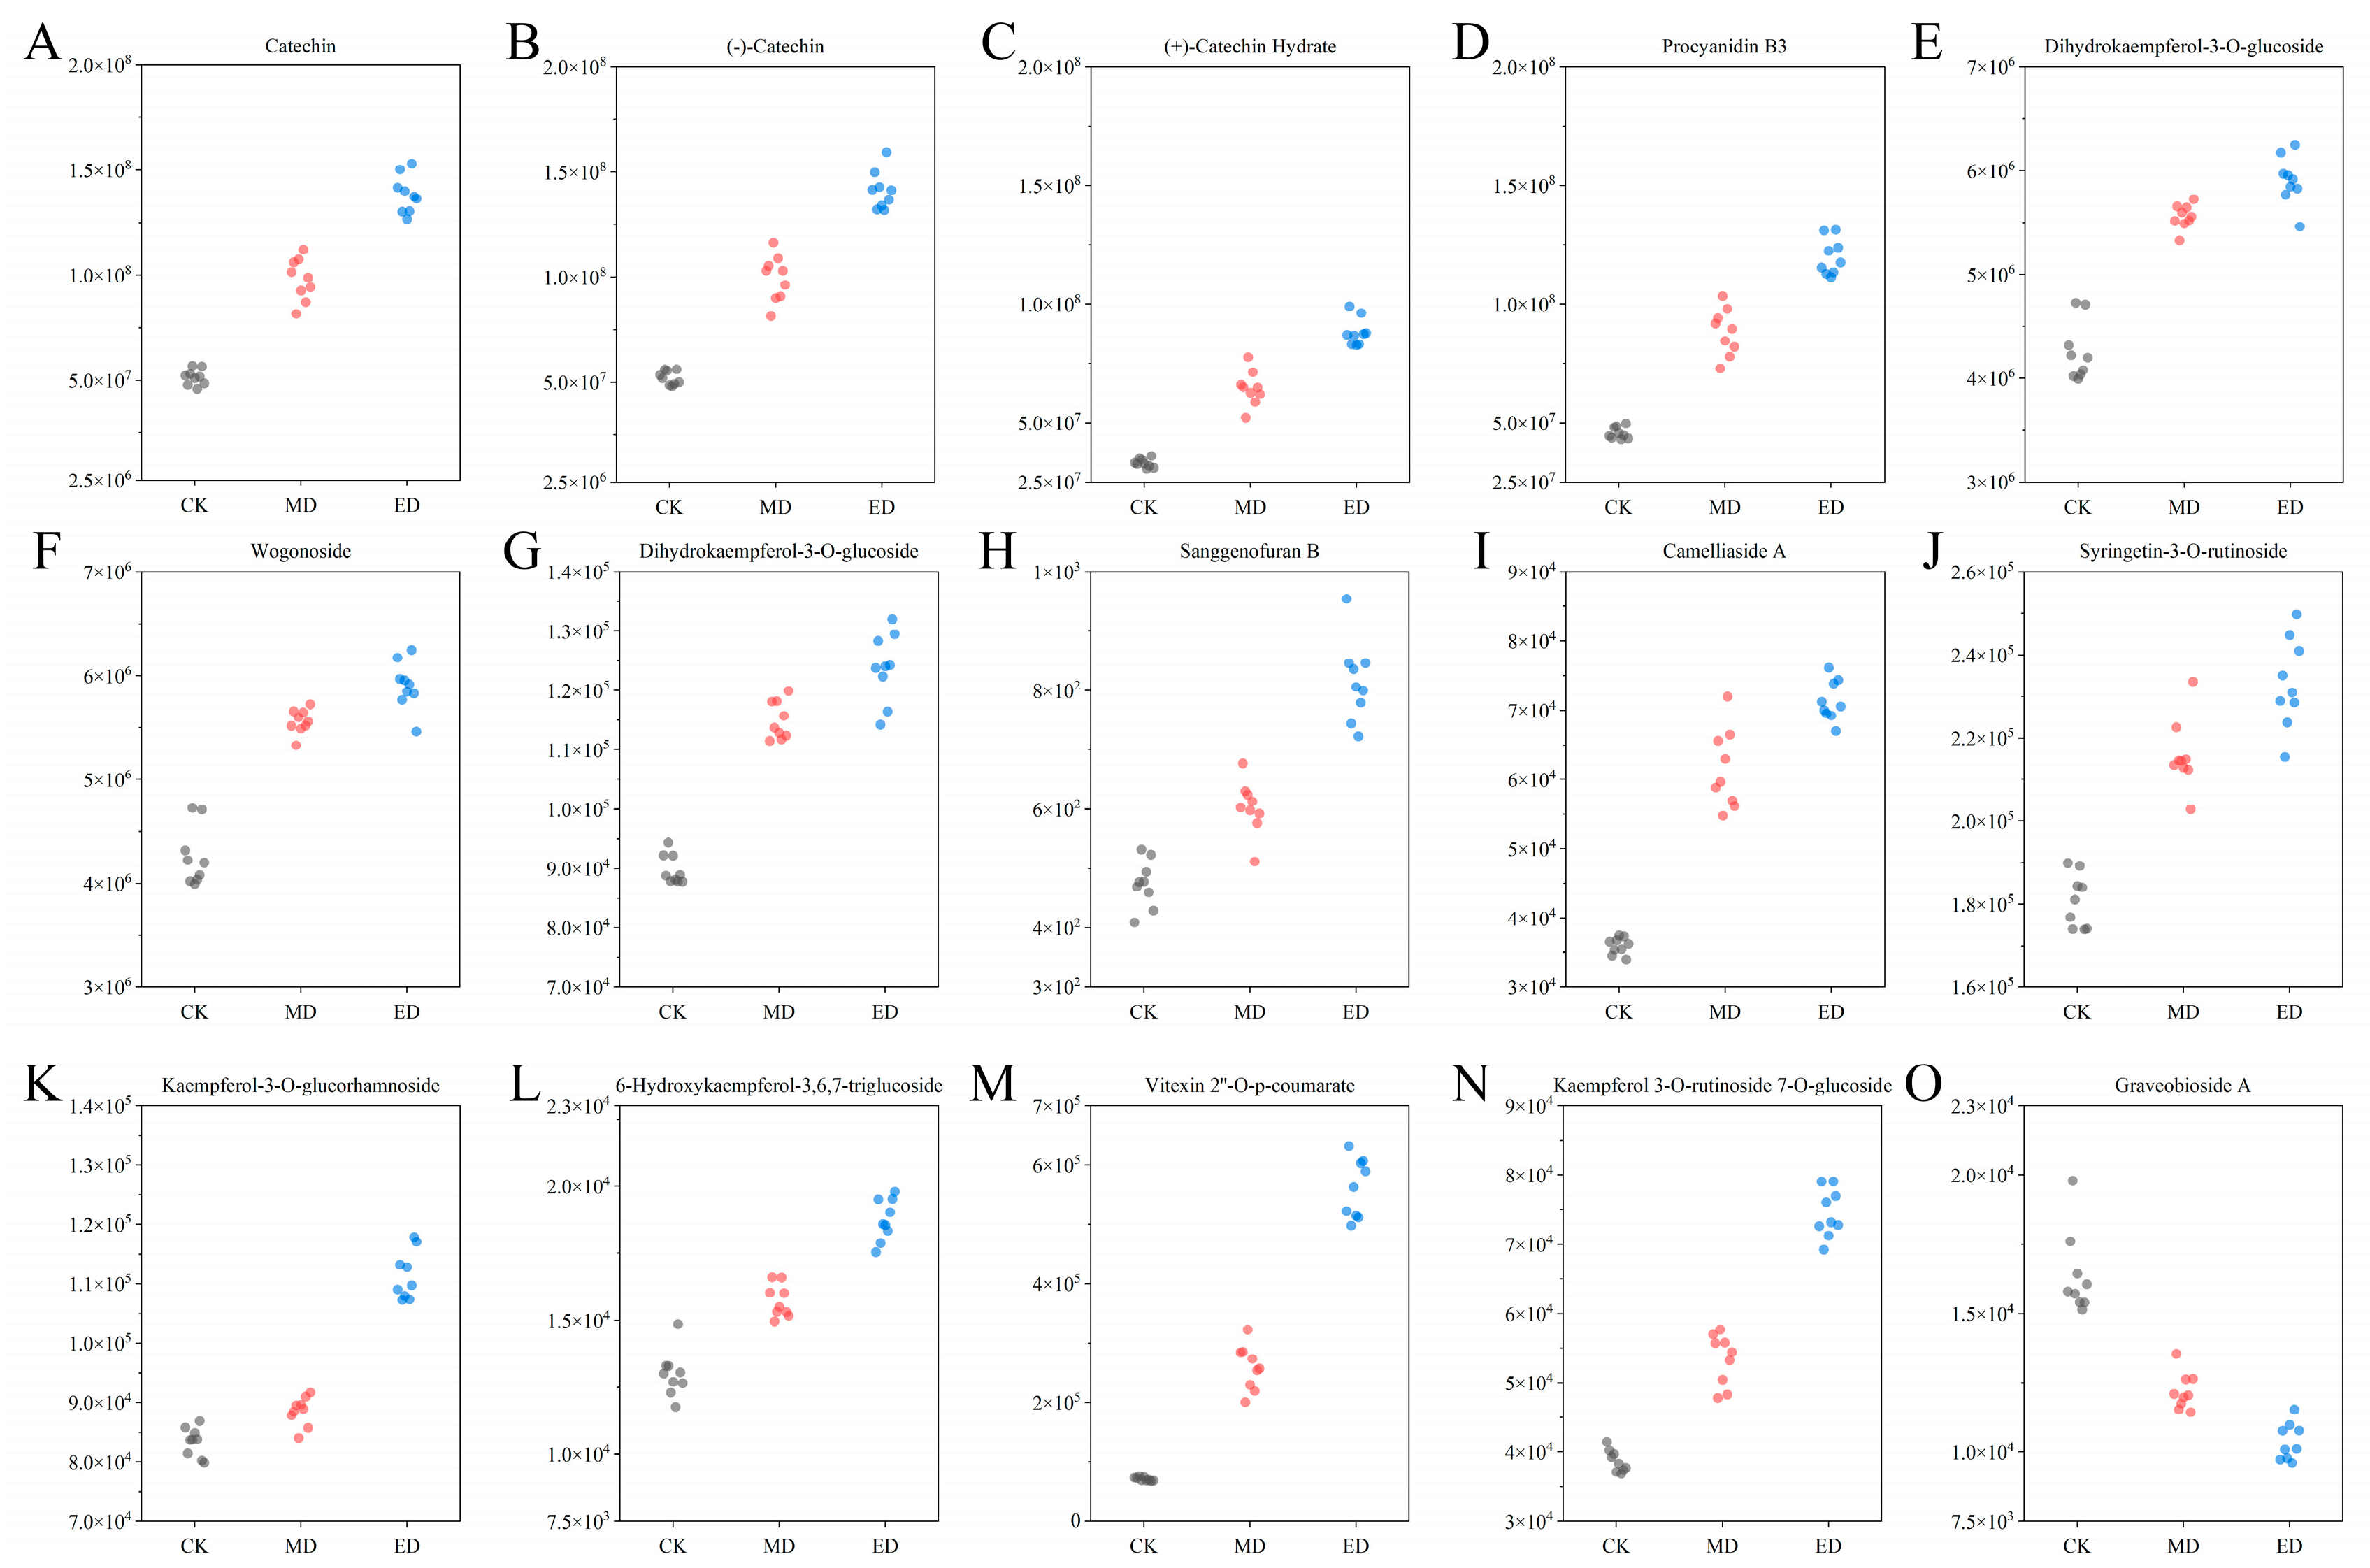
3.4.1. Identification of Differential Metabolites

Broad-spectrum flavonoid analysis identified 245 distinct compounds classified into 16 subclasses, with the specific subclass designations and quantitative distributions detailed in Table S1. The results of the principal component analysis (PCA) indicated that the quality control (QC) samples were highly clustered, suggesting good sample repeatability and high detection quality. There were obvious separations among the various experimental groups.
Both the black locust samples treated with MD and those treated with ED were distributed on the right side of the confidence interval, while the control group samples were on the left side. The differentiating effect among the three groups was significant. When comparing the CK group with the MD experimental group in terms of OPLS-DA, the results were R2X = 0.632, R2Y = 1, and Q2Y = 0.994. When comparing the control group with the severe drought stress (ED) group, the OPLS-DA results were R2X = 0.611, R2Y = 1, and Q2Y = 0.984. With Q2Y values greater than 0.9 in both models, these are considered excellent models. Meanwhile, through principal component analysis, it was found that the contribution rates of principal component 1 (PC1) and principal component 2 (PC2) were 49.68% and 48.61%, respectively. The difference in flavonoids was further analyzed [54] (Figure 6).

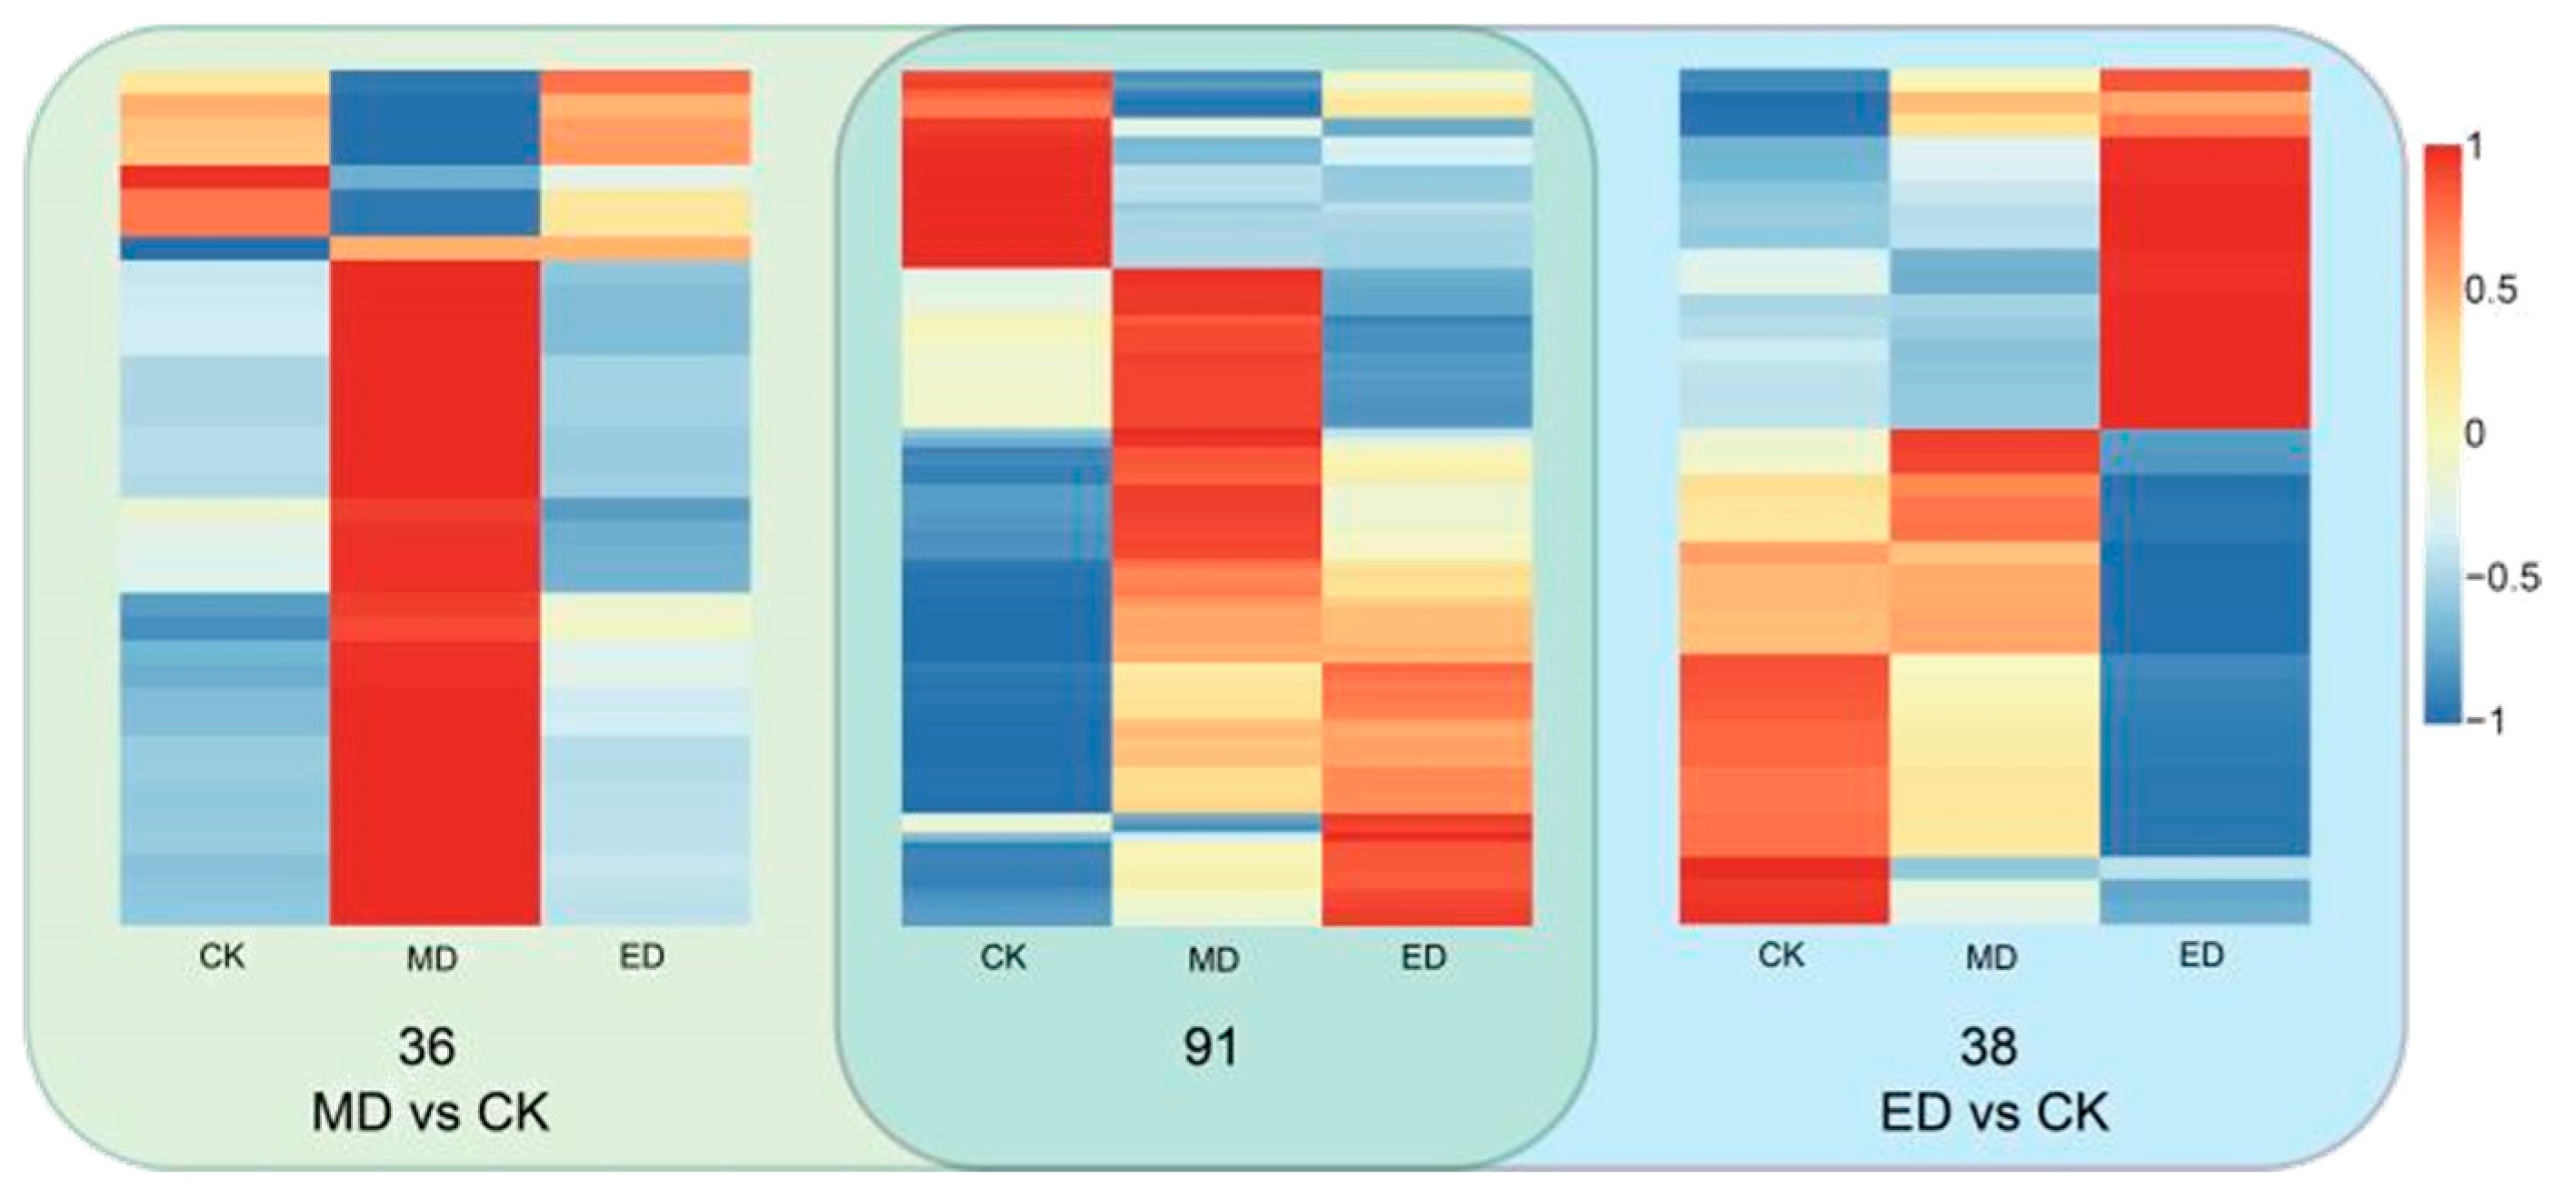
3.4.2. Heat Map Analysis of Flavonoid Differential Metabolites

The number of replacement tests in the OPLS-DA analysis was 200, and the p value of the t-test (p < 0.05) was corrected. Based on the results of the OPLS-DA, with VIP > 1 and p < 0.05 as the criteria, differential metabolites (DEMs) were screened for points of comparison between the CK and MD treatments. A total of 127 differential metabolites were obtained (Figure 7A). Among them, ninety-seven DEMs (categorized into thirteen groups) were upregulated, while thirty DEMs (categorized into nine groups) were downregulated, accounting for 39.59% and 12.24% of the total metabolites, respectively (see Supplementary Materials for details: Tables S1 and S2).
For the comparison of the CK and ED treatments, a total of 129 differential metabolites were obtained (Figure 7B), including 69 upregulated DEMs and 60 downregulated DEMs (see Supplementary Materials for details: Tables S3 and S4), which accounted for 28.16% and 24.49% of the total metabolites, respectively. The top four metabolites with the largest upregulation amplitudes are: 6-Hydroxyflavone, Dihydromyricetin, Vitexin 2’‘-O-p-coumarate, and Procyanidin B3.
There were 91 different metabolites expressed in both the MD–CK comparison group and ED–CK comparison group. Among them, 51 DEMs were upregulated, and 21 DEMs were downregulated in both comparison groups. There were 17 DEMs upregulated in the MD experimental group but downregulated in the ED experimental group. There were 21 DEMs downregulated in the MD experimental group but upregulated in the ED experimental group. There were 36 DEMs differentially expressed only in MD–CK comparison group, while 38 differentially DEMs were expressed only in ED–CK comparison group (Figure 8).
When conducting a simultaneous comparison among the MD treatment group, ED treatment group, and CK group (CK vs. MD vs. ED), a total of 45 substances demonstrated a consistent downregulation pattern of expression (i.e., CK > MD > ED). Among these, one differential expressed metabolite (DEM), namely Graveobioside A, exhibited significant differences across all three comparison pairs: MD vs. CK, ED vs. CK, and MD vs. ED, as indicated by VIP > 1 and p < 0.05.
Conversely, 37 substances displayed a continuous upregulation of expression (i.e., CK < MD < ED). Among these upregulated substances, fourteen DEMs were significantly differentially expressed in all three comparison sets. These fourteen DEMs were classified into nine distinct categories of substances, constituting 5.71% of the overall metabolites. (Figure 9).

4. Discussion

In recent decades, due to global warming, water shortage has become a major threat to the sustainability of plantations in the Loess Plateau region. As the dominant revegetation species in this region, elucidating the physiological response mechanism of black locust to drought stress is of great significance for enhancing the ecological service function of the plantation and providing scientific support for regional ecosystem protection. In this study, a comprehensive physiological and metabolomics analysis was carried out to understand the response mechanism of black locust leaves to drought stress.

4.1. Effects of Drought Stress on Leaf Structure

Understanding the microstructure of leaves is crucial for understanding how higher plants respond to drought stress, as they are the core components of photosynthesis. The size and number of stomata are closely related to water loss through plant transpiration. Higher stomatal density leads to greater CO2 uptake, thereby enhancing the photosynthetic rate. Under drought stress, the stomata typically close, and stomatal density decreases, leading to increased gas exchange resistance and decreased transpiration. In this study, with increasing drought stress, the black locust leaves exhibited a reduction in stomatal length, opening degree, and density. The stomata were mainly located on the lower epidermis of the leaves [55,56,57], with fewer on the upper epidermis. A previous study found that under drought stress, black locust exhibited a reduced transpiration rate, a reduced gas exchange rate, and increased water use efficiency. This adaption helps black locust to conserve water and enhance the plant’s drought resistance [28,58].
In arid conditions, plants strive to maintain normal physiological metabolism. They achieve this by regulating specific physiological mechanisms to adapt to water-deficient environments. Trichomes, hairlike appendages formed by the protrusion of plant epidermal cells, play a crucial role. They can reduce excessive water loss and reflect a portion of sunlight, thereby lowering the temperature on the plant surface to a certain extent [59]. This contributes significantly to enhancing the plant’s resistance to transpiration, enabling plants to better endure drought stress and maintain their physiological functions [60]. In this study, in response to drought, the density and length of trichomes on the lower epidermis of black locust leaves gradually increased, and the number of trichomes on the lower epidermis was greater than that on the upper epidermis [61,62]. These reactions are considered to help black locust reduce water loss, thereby enhancing its drought resistance [63]. However, further research is needed to confirm the correlation between trichomes and drought resistance.

4.2. Effects of Drought Stress on Leaf Physiology of Black Locust

The relative water content (RWC) of leaves serves as a pivotal metric for assessing water status and drought tolerance. When plants encounter drought stress, the water supply is curtailed, causing a decline in RWC. This reduction in RWC leads to a decrease in cell turgor pressure, thereby initiating a cascade of defense mechanisms within the plants [64]. In the present study, as the severity of drought stress escalated, the RWC in black locust leaves exhibited a progressive decline. This finding aligns with those of other relevant investigations. Under water-scarce conditions, plants respond to drought stress by decreasing their RWC [50,65].
The study revealed that the RWC of black locust under MD and ED was 10.39% and 14.69% lower than that under CK conditions (68.61%). This phenomenon is likely attributable to their relatively underdeveloped root systems, which show limited efficiency in water uptake and storage [66]. In contrast, mature trees may employ more-sophisticated regulatory mechanisms to maintain stable RWC levels over extended drought periods, potentially due to their larger root biomass and well-developed vascular systems that enhance their water retention and redistribution capacities [67].
In plants’ complex responses to drought stress, the SPAD value and chlorophyll content are pivotal. Under drought stress, the SPAD value generally drops, mirroring a concomitant reduction in chlorophyll content [12]. This degradation diminishes the efficiency of light energy absorption and conversion. In this study, with the increase in drought stress, the SPAD value and chlorophyll a, chlorophyll b, and chlorophyll a + b contents all decreased significantly, which is consistent with the results of previous studies [68]. When plants are subjected to drought stress, the closure of stomata restricts carbon dioxide supply, directly inhibiting photosynthesis or carbon metabolism and causing a decrease in photosynthetic pigment content. However, different plants respond differently to drought stress due to its severity and other physiological factors.
This decline in photosynthetic pigments not only hampers the plants’ ability to capture and utilize light energy but also has a cascading effect on other physiological processes, such as respiration, nutrient uptake, and hormone regulation, thereby severely affecting the overall growth and survival of plants under drought stress [69].
During drought stress, black locust accumulates reactive oxygen species (ROS), enhancing lipid peroxidation in leaf membranes and affecting the plant’s physiological metabolism [70]. Drought disrupts cellular redox homeostasis, decreasing water availability and disturbing metabolic pathways, thereby triggering the over-generation of superoxide radicals, hydrogen peroxide, and hydroxyl radicals. These highly reactive ROS severely damage cellular constituents, particularly exacerbating membrane lipid peroxidation in leaves. Consequently, leaf physiological metabolism, including nutrient uptake, signal transduction, and energy production, is impaired. Malondialdehyde (MDA), a final product of lipid peroxidation, can serve as a physiological indicator for evaluating the degree of oxidative damage [71,72]. This may indicate that under ED treatment, black locust could have reduced its metabolic functions to minimize MDA production, suggesting that its cells might have collapsed or lost their stress response capacity [73]. The black locust is prone to damage, and prolonged severe drought conditions might result in tree mortality. Under moderate drought, the plant’s defense mechanisms are still actively engaged, but the increasing ROS accumulation and lipid peroxidation gradually overwhelm these defenses [74].
Plants synthesize substantial osmoregulatory substances to maintain osmotic balance between vacuoles and cytoplasm under drought conditions, sustain cellular metabolism, and thereby enhance stress resistance. This study revealed that drought stress lead to elevated contents of proline, reducing sugar, total sugar, and soluble protein in black locust leaves, which aligns with previous studies [75]. In addition, the contents of proline, soluble sugar, and soluble protein peaked under MD compared with those in CK and ED. Previous studies have shown that excessive stress leads to a decrease in the osmotic adjustment ability of crops [76]. A substantial body of research indicates that proline (Pro) is crucial for stabilizing cell structures, protecting cellular components from oxidative stress, and mitigating cytoplasmic acidosis [77]. The accumulation of soluble sugars in leaves can maintain cell turgor and safeguard cell membrane and proteins from stress-related damage, thus enabling plants to better withstand drought. Under extreme stress, gene expression and the translation of soluble proteins are disrupted, hampering protein synthesis. Meanwhile, enhanced proteolysis supplies amino acids for other essential metabolic pathways [78].
Osmotic adjustment substances facilitate cell growth and preserve overall plant vitality by maintaining water uptake and cell turgor. Nevertheless, persistent drought stress disrupts multiple basic physiological processes, severely impairing the plant’s capacity to maintain normal metabolic functions [79,80].
Compared to mature black locust trees, seedlings subjected to drought stress exhibited rapid accumulation of osmoregulatory substances. However, prolonged exposure and intensifying drought severity resulted in distinct trajectories: malondialdehyde (MDA) levels showed a progressive increase, while osmolytes displayed either an initial elevation followed by decline or a continuous increase trend. This pattern suggests that seedlings prioritize specific osmotic adjustments through resource allocation trade-offs, leveraging their accelerated growth rates for rapid drought adaptation. Concurrently, the sustained MDA accumulation indicates compromised antioxidant defenses in seedlings, potentially resulting from insufficient reactive oxygen species (ROS) scavenging capacity, which exacerbates oxidative membrane damage under prolonged water deficit [65,81].

4.3. Effects of Drought Stress on Hormone Content in Black Locust Leaves

Plant hormones regulate plant development and growth in response to drought stress. Abscisic acid (ABA) regulates stress tolerance and stomatal functions, serving as one of the important indicators for evaluating plant drought resistance [82]. Indole-3-acetic acid (IAA) controls plant cell elongation. As of 2022, 136 gibberellins (GAs) have been identified, with GA1, GA3, GA4, and GA7 being the free-active forms. Current research indicates that only these four bioactive GAs possess biological activity, while most other GA species do not. GA1 and GA3 primarily regulate plant growth and development, and under drought stress, they can scavenge excess ROS to mitigate the impact of stress on plant growth. GA4 promotes fruit maturation and leaf senescence, while GA7 mainly enhances plant abiotic stress tolerance [83,84]. Jasmonic acid (JA) and salicylic acid (SA) are involved in plant defense to abiotic stress and immune responses, respectively [85].
Indole-3-acetic acid (IAA) is a crucial plant hormone that promotes plant growth. However, its mode of action is complex, with plants exhibiting diverse sensitivities across different organs and growth stages. Most studies suggest that IAA content decreases under water stress [86]. Nevertheless, in the present study, as the degree of drought stress increased, the IAA content exhibited a trend of first increasing and then decreasing. This trend aligns with previous findings that prolonged and intensified drought stress disrupts the normal regulation of IAA metabolism through the overactivation of stress-related signaling pathways, leading to fluctuations in IAA content. Since IAA is primarily synthesized in the apical growth tissues and leaves of plants, these sites are more susceptible to inhibition under drought stress conditions.
In the present study, the content of abscisic acid (ABA) gradually decreased with the increasing degree of drought stress. Accumulating evidence indicates that as drought stress persists, genes responsible for ABA biosynthesis are downregulated, while those involved in its catabolism are upregulated. This overactivation disrupts the normal regulation of ABA metabolism, ultimately culminating in a reduction in ABA content [87,88].
The results of previous studies on black locust seedlings showed that the ABA content of R black locust seedlings increased significantly after drought stress, and the response time was shorter [68]. Seedlings initially accumulate more ABA as a quick response mechanism to close stomata and conserve water.

4.4. Effects of Drought Stress on Flavonoid Metabolome in Black Locust Leaves

Currently, metabolomics is widely used in plant stress research. Ample studies have shown that flavonoids can enhance plants’ antioxidant activity and improve their drought resistance by regulating the metabolic network [41].
In this study, 245 metabolites from black locust leaves were identified and classified into 16 categories, including flavonols, glycosides, and phenols. Among them, 91 differential metabolites were detected in both the MD (moderate drought) and ED (extreme drought) treatment groups. When under drought stress, thirty-seven flavonoid-related substances in black locust were continuously upregulated, and fourteen of them showed significant differences across the three comparison groups. Using VIP > 1 and p < 0.05 as criteria, we screened the DEMs (differential metabolites) in MD vs. CK and ED vs. CK comparison groups. A total of 127 DEMs were identified in MD vs. CK, and 129 in ED vs. CK, with more upregulated than downregulated substances in both cases. Flavonols, phenols, isoflavones, and glycosides were the most abundant among the upregulated DEMs, and their contents increased significantly under drought stress.
These results indicate that black locust has unique metabolic characteristics under drought stress [89]. LC-MS/MS metabolomic technology enables us to obtain qualitative and quantitative information about a variety of metabolites. The findings of this study provide a theoretical basis for screening and using plant hormones and flavonoids to improve the drought resistance of black locust. Moreover, they offer a scientific basis for optimizing the ecological service functions of artificial black locust forests and protecting the regional ecosystem, which is beneficial for formulating more-effective vegetation restoration and ecological protection strategies in arid areas [90].

5. Conclusions

This study investigated the physio-ecological responses of leaves in a mature black locust plantation to throughfall-reduction drought stress. By analyzing leaf microstructure, physiology, biochemistry, endogenous hormone levels, and flavonoid metabolomic profiles, the adaptation of black locust to varying drought intensities was assessed. Results showed enhanced drought resistance in black locust leaves under drought stress, with physiological indices peaking under moderate drought and declining under severe drought, indicating the species may approach its drought resistance threshold. Hormonal and flavonoid analyses suggested that the black locust maintained growth through drought-resistant regulatory mechanisms. However, prolonged drought stress could lead to tree mortality. By studying black locust’s leaf microstructure, physiology, and flavonoid metabolomic responses to drought stress, this paper clarifies the specific physiological and biochemical responses of black locust under drought stress. Future research should integrate multi-omics data to explain black locust’s drought resistance mechanisms at the molecular level. Also, long-term field observations combined with climate models are needed. This will provide dynamic threshold warnings for the sustainable management of mature black locust plantations, supporting the construction of ecological barriers in arid areas.

Supplementary Materials

The following supporting information can be downloaded at: https://www.mdpi.com/article/10.3390/f16040695/s1, Table S1: CK VS MD up-regulation of 97 DEMs substance classification charts; Table S2. CK VS MD down-regulation of 30 DEMs substance classification charts; Table S3. CK VS ED up-regulation of 69 DEMs substance classification charts; Table S4. CK VS ED down-regulation of 60 DEMs substance classification charts.

Author Contributions

Y.W.: formulated ideas and design methods, collected samples and determined sample properties, analyzed data, made statistical analysis charts, wrote the first draft of the article, and revised the manuscript. N.P.: contributed to investigation and research, participated in experiments, assisted in determining sample properties, conducted data analysis and statistical analysis, and wrote the first draft of the article. B.L.: provided research ideas, participated in sampling experiments, and provided situation analysis and data interpretation. Y.Y.: contributed to investigation and research, participated in experiments and data collection, made diagrams, and proofread manuscripts. C.Y.: provided research ideas, situation analysis, data interpretation, and scientific research support. J.H.: provided access to funding by applying for research grants, provided experimental equipment, directed and coordinated research activities, verified experimental results to ensure repeatability, and revised the manuscript. W.H.: provided experimental equipment, directed and coordinated research activities, verified experimental results to ensure repeatability, conducted data analysis and review, and revised manuscripts. All authors have read and agreed to the published version of the manuscript.

Funding

The study was supported by the National Natural Science Foundation of China (grant numbers: 41971132, 42201125), and by the project “Technology and Demonstration for Improving the Structure and Function of Artificial Forest and Grass Vegetation on the Loess Plateau” (SXLK2022-02-2).

Data Availability Statement

Data are contained within the article.

Acknowledgments

The authors gratefully acknowledge the technical support from College of Life Sciences, Northwest Agriculture and Forestry University D618 for experimental equipment assistance. Special thanks to Wenfang Hao and Junhao He for their constructive suggestions on data interpretation. We also appreciate Pronets Testing and BioMarker for providing data on phytohormones and the flavonoid metabolome in black locust leaves as in-kind contributions. Finally, we extend our gratitude to the anonymous reviewers for their valuable comments.

Conflicts of Interest

No conflicts of interest exist in the submission of this manuscript, and the manuscript is approved by all authors for publication. We have provided all required supporting documentation according to the journal’s Instructions to Authors.

References

  1. Yan, X.; Zhang, Z.; Zhao, X.; Huang, M.; Wu, X.; Guo, T. Differentiated Responses of Plant Water Use Regulation to Drought in Robinia pseudoacacia Plantations on the Chinese Loess Plateau. Agric. Water Manag. 2024, 291, 108659. [Google Scholar] [CrossRef]
  2. Huang, L.; Shao, M. Advances and Perspectives on Soil Water Research in China’s Loess Plateau. Earth-Sci. Rev. 2019, 199, 102962. [Google Scholar] [CrossRef]
  3. Cao, S.; Chen, L.; Liu, Z.; Wang, G. A New Tree-Planting Technique to Improve Tree Survival and Growth on Steep and Arid Land in the Loess Plateau of China. J. Arid Environ. 2008, 72, 1374–1382. [Google Scholar] [CrossRef]
  4. Zhang, Q.; Fu, S.; Guo, H.; Chen, S.; Li, Z. Climatic Warming-Induced Drought Stress Has Resulted in the Transition of Tree Growth Sensitivity from Temperature to Precipitation in the Loess Plateau of China. Biology 2023, 12, 1275. [Google Scholar] [CrossRef]
  5. Wang, Z.-J.; Jiao, J.-Y.; Su, Y.; Chen, Y. The Efficiency of Large-Scale Afforestation with Fish-Scale Pits for Revegetation and Soil Erosion Control in the Steppe Zone on the Hill-Gully Loess Plateau. CATENA 2014, 115, 159–167. [Google Scholar] [CrossRef]
  6. Wu, J.; Miao, C.; Zheng, H.; Duan, Q.; Lei, X.; Li, H. Meteorological and Hydrological Drought on the Loess Plateau, China: Evolutionary Characteristics, Impact, and Propagation. JGR Atmos. 2018, 123, 11569–11584. [Google Scholar] [CrossRef]
  7. Liu, Z.; Wang, Y.; Shao, M.; Jia, X.; Li, X. Spatiotemporal Analysis of Multiscalar Drought Characteristics across the Loess Plateau of China. J. Hydrol. 2016, 534, 281–299. [Google Scholar] [CrossRef]
  8. Graciano, C.; Guiamét, J.J.; Goya, J.F. Impact of Nitrogen and Phosphorus Fertilization on Drought Responses in Eucalyptus grandis Seedlings. For. Ecol. Manag. 2005, 212, 40–49. [Google Scholar] [CrossRef]
  9. Jia, G.; Chen, L.; Yu, X.; Liu, Z. Soil Water Stress Overrides the Benefit of Water-use Efficiency from Rising CO2 and Temperature in a Cold Semi-arid Poplar Plantation. Plant Cell Environ. 2022, 45, 1172–1186. [Google Scholar] [CrossRef] [PubMed]
  10. Zhao, H.; Zhou, Z.; Zhang, F.; Bourque, C.P.-A.; Jia, X.; Li, X.; Liu, P.; Yu, H.; Tian, Y.; Jin, C.; et al. Sensitivity of Gross Primary Production and Evapotranspiration to Heat and Drought Stress in a Young Temperate Plantation in Northern China. For. Ecosyst. 2025, 12, 100275. [Google Scholar] [CrossRef]
  11. Wang, B.; Chen, W.; Tian, D.; Li, Z.; Wang, J.; Fu, Z.; Luo, Y.; Piao, S.; Yu, G.; Niu, S. Dryness Limits Vegetation Pace to Cope with Temperature Change in Warm Regions. Glob. Chang. Biol. 2023, 29, 4750–4757. [Google Scholar] [CrossRef]
  12. Seleiman, M.F.; Al-Suhaibani, N.; Ali, N.; Akmal, M.; Alotaibi, M.; Refay, Y.; Dindaroglu, T.; Abdul-Wajid, H.H.; Battaglia, M.L. Drought Stress Impacts on Plants and Different Approaches to Alleviate Its Adverse Effects. Plants 2021, 10, 259. [Google Scholar] [CrossRef]
  13. Du, C.; Ni, X.; Yan, M.; Meng, Q.; He, J. Physiological and Transcriptome Analysis Reveals the Mechanism of Gymnocarpos przewalskii Response to Drought Stress. BMC Plant Biol. 2025, 25, 155. [Google Scholar] [CrossRef]
  14. Sato, H.; Mizoi, J.; Shinozaki, K.; Yamaguchi-Shinozaki, K. Complex Plant Responses to Drought and Heat Stress under Climate Change. Plant J. 2024, 117, 1873–1892. [Google Scholar] [CrossRef]
  15. Sun, Z.; Yin, Y.; Zhu, W.; Zhou, Y. Morphological, Physiological, and Biochemical Composition of Mulberry (Morus spp.) under Drought Stress. Forests 2023, 14, 949. [Google Scholar] [CrossRef]
  16. Bai, Z.; Yang, X.; Zi, N.; Ren, W.; Yin, J.; Yuan, T.; Wang, M.; Yuan, F.; Liu, Y. Drought Stress Memory Enhances the Tolerance of Alfalfa Medicago sativa L. in Response to a Subsequent Drought: A Physiological and Omics Perspective. Environ. Exp. Bot. 2025, 230, 106088. [Google Scholar] [CrossRef]
  17. Lin, C.; Hu, W.; Qin, X.; Fei, Y.; Hu, D. Effects of Serendipita indica on the Morphological and Physiological Characteristics of Agrostis stolonifera L. Under Drought Stress. Agronomy 2025, 15, 234. [Google Scholar] [CrossRef]
  18. Skelton, R.P.; Midgley, J.J.; Nyaga, J.M.; Johnson, S.D.; Cramer, M.D. Is Leaf Pubescence of Cape Proteaceae a Xeromorphic or Radiation-Protective Trait? Aust. J. Bot. 2012, 60, 104. [Google Scholar] [CrossRef]
  19. Wang, M.; Hu, Y.; Mao, J.; Xu, Y.; Wang, S.; Wang, L.; Qiao, Z.; Liu, S.; Cao, X. Physiological Responses and Metabolic Characteristics of Proso Millet Under Drought Stress During Germination Period. Food Sci. Nutr. 2025, 13, e70001. [Google Scholar] [CrossRef] [PubMed]
  20. Qi, T.; Huang, H.; Wu, D.; Yan, J.; Qi, Y.; Song, S.; Xie, D. Arabidopsis DELLA and JAZ Proteins Bind the WD-Repeat/bHLH/MYB Complex to Modulate Gibberellin and Jasmonate Signaling Synergy. Plant Cell 2014, 26, 1118–1133. [Google Scholar] [CrossRef]
  21. Jan, M.F.; Altaf, M.T.; Liaqat, W.; Liu, C.; Mohamed, H.I.; Li, M. Approaches for the Amelioration of Adverse Effects of Drought Stress on Soybean Plants: From Physiological Responses to Agronomical, Molecular, and Cutting-Edge Technologies. Plant Soil 2025, 1–53. [Google Scholar] [CrossRef]
  22. Puchałka, R.; Dyderski, M.K.; Vítková, M.; Sádlo, J.; Klisz, M.; Netsvetov, M.; Prokopuk, Y.; Matisons, R.; Mionskowski, M.; Wojda, T.; et al. Black Locust (Robinia pseudoacacia L.) Range Contraction and Expansion in Europe under Changing Climate. Glob. Chang. Biol. 2021, 27, 1587–1600. [Google Scholar] [CrossRef] [PubMed]
  23. Nicolescu, V.-N.; Rédei, K.; Mason, W.L.; Vor, T.; Pöetzelsberger, E.; Bastien, J.-C.; Brus, R.; Benčať, T.; Đodan, M.; Cvjetkovic, B.; et al. Ecology, Growth and Management of Black Locust (Robinia pseudoacacia L.), a Non-Native Species Integrated into European Forests. J. For. Res. 2020, 31, 1081–1101. [Google Scholar] [CrossRef]
  24. Chen, L.; Huang, Z.; Gong, J.; Fu, B.; Huang, Y. The Effect of Land Cover/Vegetation on Soil Water Dynamic in the Hilly Area of the Loess Plateau, China. CATENA 2007, 70, 200–208. [Google Scholar] [CrossRef]
  25. Zhao, Y.; Li, M.; Wang, X.; Deng, J.; Zhang, Z.; Wang, B. Influence of Habitat on the Phylogenetic Structure of Robinia pseudoacacia Forests in the Eastern Loess Plateau, China. Glob. Ecol. Conserv. 2020, 24, e01199. [Google Scholar] [CrossRef]
  26. Zhang, Z.; Huang, M.; Yang, Y.; Zhao, X. Evaluating Drought-Induced Mortality Risk for Robinia pseudoacacia Plantations along the Precipitation Gradient on the Chinese Loess Plateau. Agric. For. Meteorol. 2020, 284, 107897. [Google Scholar] [CrossRef]
  27. Ma, C.; Luo, Y.; Shao, M.; Li, X.; Sun, L.; Jia, X. Environmental Controls on Sap Flow in Black Locust Forest in Loess Plateau, China. Sci. Rep. 2017, 7, 13160. [Google Scholar] [CrossRef]
  28. Wang, X.; Fan, Y.; Zhang, C.; Zhao, Y.; Du, G.; Li, M.; Si, B. From Comfort Zone to Mortality: Sequence of Physiological Stress Thresholds in Robinia pseudoacacia Seedlings during Progressive Drought. Front. Plant Sci. 2023, 14, 1149760. [Google Scholar] [CrossRef]
  29. Zhao, Y.; Wang, Y.; Li, R.; Qi, L.; Sun, H.; Zhang, P.; Li, Z. Water Consumption Turning Point for Robinia pseudoacacia Occurs at Its Middle Stand Age. Plant Soil 2025, 1–16. [Google Scholar] [CrossRef]
  30. Meerdink, S.K.; Roberts, D.A.; King, J.Y.; Roth, K.L.; Gader, P.D.; Caylor, K.K. Using Hyperspectral and Thermal Imagery to Monitor Stress of Southern California Plant Species during the 2013–2015 Drought. ISPRS J. Photogramm. Remote Sens. 2025, 220, 580–592. [Google Scholar] [CrossRef]
  31. Liu, X.; Jiao, L.; Bai, Y.; Li, Z.; Yuan, C.; Li, Z.; Gao, G. Rainfall Partitioning in the Robinia pseudodcacia Plantations with Different Thinning Intensities in the Semiarid Loess Plateau of China. Ecol. Front. 2025, 45, 257–267. [Google Scholar] [CrossRef]
  32. Yang, B.; Peng, C.; Harrison, S.P.; Wei, H.; Wang, H.; Zhu, Q.; Wang, M. Allocation Mechanisms of Non-Structural Carbohydrates of Robinia pseudoacacia L. Seedlings in Response to Drought and Waterlogging. Forests 2018, 9, 754. [Google Scholar] [CrossRef]
  33. Zhang, T.; Cao, Y.; Chen, Y.; Liu, G. Non-Structural Carbohydrate Dynamics in Robinia pseudoacacia Saplings under Three Levels of Continuous Drought Stress. Trees 2015, 29, 1837–1849. [Google Scholar] [CrossRef]
  34. Rosner, S.; Karlsson, B. Hydraulic Efficiency Compromises Compression Strength Perpendicular to the Grain in Norway Spruce Trunkwood. Trees 2011, 25, 289–299. [Google Scholar] [CrossRef] [PubMed]
  35. Rosner, S.; Klein, A.; Muller, U.; Karlsson, B. Hydraulic and Mechanical Properties of Young Norway Spruce Clones Related to Growth and Wood Structure. Tree Physiol. 2007, 27, 1165–1178. [Google Scholar] [CrossRef]
  36. Tiedge, K.; Li, X.; Merrill, A.T.; Davisson, D.; Chen, Y.; Yu, P.; Tantillo, D.J.; Last, R.L.; Zerbe, P. Comparative Transcriptomics and Metabolomics Reveal Specialized Metabolite Drought Stress Responses in Switchgrass (Panicum virgatum). New Phytol. 2022, 236, 1393–1408. [Google Scholar] [CrossRef]
  37. Wang, J.; Gao, X.; Wang, X.; Song, W.; Wang, Q.; Wang, X.; Li, S.; Fu, B. Exogenous Melatonin Ameliorates Drought Stress in Agropyron mongolicum by Regulating Flavonoid Biosynthesis and Carbohydrate Metabolism. Front. Plant Sci. 2022, 13, 1051165. [Google Scholar] [CrossRef]
  38. Xie, W.; Hao, Z.; Zhou, J.; Fu, W.; Guo, L.; Zhang, X.; Chen, B. Integrated Transcriptomics and Metabolomics Reveal Specific Phenolic and Flavonoid Accumulation in Licorice (Glycyrrhiza uralensis Fisch.) Induced by Arbuscular Mycorrhiza Symbiosis under Drought Stress. Plant Physiol. Biochem. 2023, 205, 108173. [Google Scholar] [CrossRef]
  39. Feng, X.; Bai, S.; Zhou, L.; Song, Y.; Jia, S.; Guo, Q.; Zhang, C. Integrated Analysis of Transcriptome and Metabolome Provides Insights into Flavonoid Biosynthesis of Blueberry Leaves in Response to Drought Stress. IJMS 2024, 25, 11135. [Google Scholar] [CrossRef]
  40. Chen, G.; Li, D.; Yao, P.; Chen, F.; Yuan, J.; Ma, B.; Yang, Z.; Ding, B.; He, N. Metabolic and Transcriptional Analysis Reveals Flavonoid Involvement in the Drought Stress Response of Mulberry Leaves. IJMS 2024, 25, 7417. [Google Scholar] [CrossRef] [PubMed]
  41. Li, Q.; Gichuki, D.K.; Zhou, H.; Hou, Y.; Gituru, R.W.; Wang, Q.; Xin, H. Transcriptional Modification and the Accumulation of Flavonoid in the Leaves of Cissus rotundifolia Lam. in Respond to Drought Stress. Stress Biol. 2025, 5, 19. [Google Scholar] [CrossRef]
  42. He, C.; Du, W.; Ma, Z.; Jiang, W.; Pang, Y. Identification and Analysis of Flavonoid Pathway Genes in Responsive to Drought and Salinity Stress in Medicago truncatula. J. Plant Physiol. 2024, 302, 154320. [Google Scholar] [CrossRef] [PubMed]
  43. Huang, X.; Chu, G.; Wang, J.; Luo, H.; Yang, Z.; Sun, L.; Rong, W.; Wang, M. Integrated Metabolomic and Transcriptomic Analysis of Specialized Metabolites and Isoflavonoid Biosynthesis in Sophora alopecuroides L. under Different Degrees of Drought Stress. Ind. Crops Prod. 2023, 197, 116595. [Google Scholar] [CrossRef]
  44. Liu, B.; Tang, X.; Wang, L.; Zhang, P.; He, J.; Yue, C. Physiological responses of a black locust plantation to drought stress based on a throughfall exclusion experiment in semi-arid northwestern China. For. Int. J. For. Res. 2025, 98, 220–232. [Google Scholar] [CrossRef]
  45. Pathan, A.K.; Bond, J.; Gaskin, R.E. Sample Preparation for Scanning Electron Microscopy of Plant Surfaces—Horses for Courses. Micron 2008, 39, 1049–1061. [Google Scholar] [CrossRef]
  46. Fang, Z.; Wang, X.; Zhang, X.; Zhao, D.; Tao, J. Effects of Fulvic Acid on the Photosynthetic and Physiological Characteristics of Paeonia ostii under Drought Stress. Plant Signal. Behav. 2020, 15, 1774714. [Google Scholar] [CrossRef]
  47. De Oliveira Maia Júnior, S.; De Andrade, J.R.; De Oliveira Sousa, V.F.; Silva, P.C.; Aguiar, D.L.; De Sousa Torres, A.M.; Diniz, D.C.; De Assis Figueiredo, F.A.M.M.; De Oliveira Reis, F.; Ferraz, T.M. Seed Priming with Brassinosteroids Mitigates Pre-Flowering Drought Stress in Soybean Varieties. J. Soil Sci. Plant Nutr. 2025, 1–6. [Google Scholar] [CrossRef]
  48. Wei, S.; Bian, Y.; Zhao, Q.; Chen, S.; Mao, J.; Song, C.; Cheng, K.; Xiao, Z.; Zhang, C.; Ma, W.; et al. Salinity-Induced Palmella Formation Mechanism in Halotolerant Algae Dunaliella salina Revealed by Quantitative Proteomics and Phosphoproteomics. Front. Plant Sci. 2017, 8, 810. [Google Scholar] [CrossRef]
  49. Ahsan, M.; Younis, A.; Jamal, A.; Alshaharni, M.O.; Algopishi, U.B.; Al-Andal, A.; Sajid, M.; Naeem, M.; Khan, J.A.; Radicetti, E.; et al. Melatonin Induces Drought Stress Tolerance by Regulating the Physiological Mechanisms, Antioxidant Enzymes, and Leaf Structural Modifications in Rosa centifolia L. Heliyon 2025, 11, e41236. [Google Scholar] [CrossRef]
  50. Bakhtiari, E.S.; Mousavi, A.; Yadegari, M.; Haghighati, B.; Martínez-García, P.J. Physiological and Biochemical Responses of Almond (Prunus dulcis) Cultivars to Drought Stress in Semi-Arid Conditions in Iran. Plants 2025, 14, 734. [Google Scholar] [CrossRef]
  51. Zhang, Z.; Tariq, A.; Zeng, F.; Chai, X.; Graciano, C. Involvement of Soluble Proteins in Growth and Metabolic Adjustments of Drought-stressed Calligonum mongolicum Seedlings under Nitrogen Addition. Plant Biol. J. 2021, 23, 32–43. [Google Scholar] [CrossRef] [PubMed]
  52. Zhou, Y.; Tang, N.; Huang, L.; Zhao, Y.; Tang, X.; Wang, K. Effects of Salt Stress on Plant Growth, Antioxidant Capacity, Glandular Trichome Density, and Volatile Exudates of Schizonepeta tenuifolia Briq. Int. J. Mol. Sci. 2018, 19, 252. [Google Scholar] [CrossRef] [PubMed]
  53. Rui, L.; Bing, Y.; Jing, G.; Yan, W.; Ben, H.; Liang, P. Effects of Drought Stress on Secondary Metabolite Contents and Antioxidant Enzyme Activities in Callus of Polygala tenuifolia Willd. North. Hortic. 2020, 3, 109–116. [Google Scholar]
  54. Zhi, X.; Bian, X.; Yu, J.; Xiao, X.; Duan, B.; Huang, F.; Jiang, Z.; Zhou, G.; Ma, N. Comparative Metabolomics Analysis of Tolerant and Sensitive Genotypes of Rapeseed (Brassica napus L.) Seedlings under Drought Stress. Agric. Water Manag. 2024, 296, 108797. [Google Scholar] [CrossRef]
  55. Franks, P.J.; Farquhar, G.D. The Mechanical Diversity of Stomata and Its Significance in Gas-Exchange Control. Plant Physiol. 2007, 143, 78–87. [Google Scholar] [CrossRef]
  56. Fang, J.; Zhan, Y.; Zhao, B.; Zhao, Y.; Chen, Y.; Zhou, Q.; Wang, H. Photosynthetic Performance and Carbon Metabolism in the Ear Organs of Oats under Drought Stress. Front. Plant Sci. 2025, 15, 1463284. [Google Scholar] [CrossRef]
  57. Licaj, I.; Fiorillo, A.; Di Meo, M.C.; Varricchio, E.; Rocco, M. Effect of Polyethylene Glycol-Simulated Drought Stress on Stomatal Opening in “Modern” and “Ancient” Wheat Varieties. Plants 2024, 13, 1575. [Google Scholar] [CrossRef]
  58. Tian, J.; Pang, Y.; Zhao, Z. Drought, Salinity, and Low Nitrogen Differentially Affect the Growth and Nitrogen Metabolism of Sophora japonica (L.) in a Semi-Hydroponic Phenotyping Platform. Front. Plant Sci. 2021, 12, 715456. [Google Scholar] [CrossRef]
  59. Hegebarth, D.; Buschhaus, C.; Wu, M.; Bird, D.; Jetter, R. The Composition of Surface Wax on Trichomes of Arabidopsis thaliana Differs from Wax on Other Epidermal Cells. Plant J. 2016, 88, 762–774. [Google Scholar] [CrossRef]
  60. Zekri, M.A.; Lang, I. Lack of Trichomes and Variation in Stomata Properties Influence the Quantum Efficiency of Photosynthesis in Arabidopsis. Environ. Exp. Bot. 2024, 227, 105948. [Google Scholar] [CrossRef]
  61. Kang, J.-H.; Liu, G.; Shi, F.; Jones, A.D.; Beaudry, R.M.; Howe, G.A. The Tomato odorless-2 Mutant Is Defective in Trichome-Based Production of Diverse Specialized Metabolites and Broad-Spectrum Resistance to Insect Herbivores. Plant Physiol. 2010, 154, 262–272. [Google Scholar] [CrossRef]
  62. Ning, P.; Wang, J.; Zhou, Y.; Gao, L.; Wang, J.; Gong, C. Adaptional Evolution of Trichome in Caragana korshinskii to Natural Drought Stress on the Loess Plateau, China. Ecol. Evol. 2016, 6, 3786–3795. [Google Scholar] [CrossRef] [PubMed]
  63. Niu, X.J.; Nie, J.; Yang, Z.Y.; Zhao, X.L. Leaf Morphological Responses of Indigofera bungeana to Drought Stress. Acta Bot. Boreali-Occident. Sin. 2020, 40, 613–623. [Google Scholar]
  64. Patanè, C.; Cosentino, S.L.; Romano, D.; Toscano, S. Relative Water Content, Proline, and Antioxidant Enzymes in Leaves of Long Shelf-Life Tomatoes under Drought Stress and Rewatering. Plants 2022, 11, 3045. [Google Scholar] [CrossRef]
  65. Jin, S.; Peng, Z.; Zhang, S. The Impact of Varying Degrees of Drought Stress and Rehydration Treatment on the Physiological Indicators of Robinia pseudoacacia Seedlings. J. Northeast. For. Univ. 2024, 52, 27–39. [Google Scholar]
  66. Siyu, J.; Zuodeng, P. Changes in response of carbon and water physiological parameters of Robinia pseudoacacia seedlings to long-term drought and rehydration. J. Beijing For. Univ. 2023, 45, 43–56. [Google Scholar]
  67. Trifilò, P.; Kiorapostolou, N.; Petruzzellis, F.; Vitti, S.; Petit, G.; Lo Gullo, M.A.; Nardini, A.; Casolo, V. Hydraulic Recovery from Xylem Embolism in Excised Branches of Twelve Woody Species: Relationships with Parenchyma Cells and Non-Structural Carbohydrates. Plant Physiol. Biochem. 2019, 139, 513–520. [Google Scholar] [CrossRef]
  68. Song, S.; Qu, Z.; Zhou, X.; Wang, X.; Dong, S. Effects of Weak and Strong Drought Conditions on Physiological Stability of Flowering Soybean. Plants 2022, 11, 2708. [Google Scholar] [CrossRef]
  69. Shokat, S.; Liu, F.; Großkinsky, D.K. Drought Stress, Elevated CO2 and Their Combination Differentially Affect Carbon and Nitrogen in Different Organs of Six Spring Wheat Genotypes. Plants 2024, 13, 2942. [Google Scholar] [CrossRef]
  70. Aranjuelo, I.; Molero, G.; Erice, G.; Avice, J.C.; Nogués, S. Plant Physiology and Proteomics Reveals the Leaf Response to Drought in Alfalfa (Medicago sativa L.). J. Exp. Bot. 2011, 62, 111–123. [Google Scholar] [CrossRef]
  71. Landi, M. Commentary to: “Improving the Thiobarbituric Acid-Reactive-Substances Assay for Estimating Lipid Peroxidation in Plant Tissues Containing Anthocyanin and Other Interfering Compounds” by Hodges et al., Planta (1999) 207:604–611. Planta 2017, 245, 1067. [Google Scholar] [CrossRef] [PubMed]
  72. Ahmad, M.A.; Saleem, A.; Tahir, M.; Khilji, S.A.; Sajid, Z.A.; Landry, K.B.; El-Sheikh, M.A.; Ahmad, P. Modulation of the Polyamines, Osmolytes and Antioxidant Defense System to Ameliorate Drought Stress Tolerance in Hordeum vulgare L. Using Ascorbic Acid. S. Afr. J. Bot. 2024, 171, 726–736. [Google Scholar] [CrossRef]
  73. Zhang, W.; Shi, H.; Cai, S.; Guo, Q.; Dai, Y.; Wang, H.; Wan, S.; Yuan, Y. Rice Growth and Leaf Physiology in Response to Four Levels of Continuous Drought Stress in Southern China. Agronomy 2024, 14, 1579. [Google Scholar] [CrossRef]
  74. Sattar, A.; El-Yazied, A.A.; Alharbi, B.M.; El-Gawad, H.G.A.; Abbas, Z.K.; El-Absy, K.M.; Mahmoud, S.F.; Althaqafi, M.M.; Darwish, D.B.E.; Al-Harbi, N.A.; et al. Application of Biostimulants Alleviated Drought Stress in Sugar Beet (Beta vulgaris L.) by Improving Oxidative Defense System, Osmolytes Accumulation and Root Yield. J. Soil Sci. Plant Nutr. 2024, 24, 7167–7183. [Google Scholar] [CrossRef]
  75. Mustafavi, S.H.; Shekari, F.; Maleki, H.H. Influence of Exogenous Polyamines on Antioxidant Defence and Essential Oil Production in Valerian (Valeriana officinalis L.) Plants under Drought Stress. Acta Agric. Slov. 2016, 107, 81–91. [Google Scholar] [CrossRef]
  76. Mbinda, W.; Ombori, O.; Dixelius, C.; Oduor, R. Xerophyta viscosa Aldose Reductase, XvAld1, Enhances Drought Tolerance in Transgenic Sweetpotato. Mol. Biotechnol. 2018, 60, 203–214. [Google Scholar] [CrossRef]
  77. Akram, N.A.; Waseem, M.; Ameen, R.; Ashraf, M. Trehalose Pretreatment Induces Drought Tolerance in Radish (Raphanus sativus L.) Plants: Some Key Physio-Biochemical Traits. Acta Physiol. Plant 2016, 38, 3. [Google Scholar] [CrossRef]
  78. Ozturk, M.; Turkyilmaz Unal, B.; García-Caparrós, P.; Khursheed, A.; Gul, A.; Hasanuzzaman, M. Osmoregulation and Its Actions during the Drought Stress in Plants. Physiol. Plant. 2021, 172, 1321–1335. [Google Scholar] [CrossRef]
  79. Yang, X.; Liu, R.; Jing, M.; Zhang, N.; Liu, C.; Yan, J. Variation of Root Soluble Sugar and Starch Response to Drought Stress in Foxtail Millet. Agronomy 2023, 13, 359. [Google Scholar] [CrossRef]
  80. Jimenez, S.; Dridi, J.; Gutierrez, D.; Moret, D.; Irigoyen, J.J.; Moreno, M.A.; Gogorcena, Y. Physiological, Biochemical and Molecular Responses in Four Prunus Rootstocks Submitted to Drought Stress. Tree Physiol. 2013, 33, 1061–1075. [Google Scholar] [CrossRef]
  81. Nahar, S.; Vemireddy, L.R.; Sahoo, L.; Tanti, B. Antioxidant Protection Mechanisms Reveal Significant Response in Drought-Induced Oxidative Stress in Some Traditional Rice of Assam, India. Rice Sci. 2018, 25, 185–196. [Google Scholar] [CrossRef]
  82. Zhang, R.; Zhang, Z.; Yan, C.; Chen, Z.; Li, X.; Zeng, B.; Hu, B. Comparative Physiological, Biochemical, Metabolomic, and Transcriptomic Analyses Reveal the Formation Mechanism of Heartwood for Acacia Melanoxylon. BMC Plant Biol. 2024, 24, 308. [Google Scholar] [CrossRef]
  83. Fang, Y. Study on The Category and Content of Gibberellin in Different Parts During Dormancy Release in Peach. Master’s Thesis, Shandong Agricultural University, Tai’an, China, 2022. [Google Scholar]
  84. Hamed, H.A.; Mahmoud, G.A.-E.; Abeed, A.H.A. Unraveling Growth and Metabolic Dynamics in Drought-Stressed Spinach Plants: Exploring the Contribution of Biological Gibberellin. Sci. Hortic. 2025, 340, 113924. [Google Scholar] [CrossRef]
  85. Altaf, M.A.; Shahid, R.; Kumar, R.; Altaf, M.M.; Kumar, A.; Khan, L.U.; Saqib, M.; Nawaz, M.A.; Saddiq, B.; Bahadur, S.; et al. Phytohormones Mediated Modulation of Abiotic Stress Tolerance and Potential Crosstalk in Horticultural Crops. J. Plant Growth Regul. 2023, 42, 4724–4750. [Google Scholar] [CrossRef]
  86. Long, J.; Liu, D.; Qiao, W.; Wang, Y.; Miao, Y.; Baosai, H. Response of Elymus nutans Griseb. Seedling Physiology and Endogenous Hormones to Drought and Salt Stress. Sci. Rep. 2024, 14, 17810. [Google Scholar] [CrossRef] [PubMed]
  87. Raghavendra, A.S.; Gonugunta, V.K.; Christmann, A.; Grill, E. ABA Perception and Signalling. Trends Plant Sci. 2010, 15, 395–401. [Google Scholar] [CrossRef]
  88. Qing, Y.; Yan, Q. Response of endogenous hormones in Camellia reticulata to drought stress and rehydration based on transcriptome analysis. Southwest China J. Agric. Sci. 2024, 37, 913–924. [Google Scholar] [CrossRef]
  89. Zhao, M.; Ren, Y.; Wei, W.; Yang, J.; Zhong, Q.; Li, Z. Metabolite Analysis of Jerusalem Artichoke (Helianthus tuberosus L.) Seedlings in Response to Polyethylene Glycol-Simulated Drought Stress. Int. J. Mol. Sci. 2021, 22, 3294. [Google Scholar] [CrossRef]
  90. Sima, N.A.K.; Jabbari, H.; Ebadi, A.; Ghaffari, M.R.; Koobaz, P. Comparative Analysis of Exogenous Hormone Application on Contrasting Canola (Brassica napus L.) Genotypes Under Drought Stress Conditions. J. Soil Sci. Plant Nutr. 2024, 24, 308–317. [Google Scholar] [CrossRef]
Figure 1. Morphological structure of stomata under different drought treatments. (AC) represent the control group, with images at 10,000× magnification of the stoma (st) structure on the leaf abaxial side; (DF) depict the moderate drought (MD) treatment, with images at 10,000× magnification of the stoma structure on the leaf abaxial side; (GI) show the extreme drought (ED) treatment, with images at 10,000× magnification of the stoma structure on the leaf abaxial side.
Forests 16 00695 g001
Figure 2. Morphological structure of fur under different drought treatments. (AD) represent the control group, with images at 2000× magnification of the backside structure and 2000× magnification of ventral structure; (EH) depict the moderate drought (MD) treatment, with images at 2000× magnification of the backside structure and 2000× magnification of ventral structure; (IL) show the extreme drought (ED) treatment, with images at, 2000× magnification of the backside structure and 2000× magnification of ventral structure. Note: Arrows (→) indicate trichome structures, all microstructures are shown at 2000× magnification.
Forests 16 00695 g002
Figure 3. Physiological indexes of black locust under different drought treatments. (AI) Comparison of physiological indicators in black locust under control and drought stress conditions. The parameters measured include: (A) relative water content of leaves (RWC); (B) SPAD value; (C) chlorophyll a; chlorophyll b; total chlorophyll (a + b); (D) malondialdehyde (MDA); (E) proline; (F) total sugar; reducing sugar; (G) soluble protein; (H) total phenolics; (I) total flavonoids. Different letters represent significant differences between treatments according to the least significant difference (LSD) test at p < 0.05.
Forests 16 00695 g003
Figure 4. Content of endogenous hormones in plants under different drought treatments. (AD) Comparison of hormone contents in black locust under control and drought stress conditions. The measured parameters include: (A) abscisic acid (ABA); (B) indole-3-acetic acid (IAA); (C) jasmonic acid (JA); (D) salicylic acid (SA). Different letters indicate significant differences among treatments in black locust leaves at p < 0.05, as assessed by the least significant difference (LSD) test.
Forests 16 00695 g004
Figure 5. Content of endogenous hormones in plants under different drought treatments. Gibberellin-1 (GA-1); gibberellin-3 (GA-3); gibberellin-4 (GA-4); gibberellin-7 (GA-7). Results are mean values; different letters indicate significant differences among treatments in black locust leaves at p < 0.05, as assessed by the least significant difference (LSD) test.
Forests 16 00695 g005
Figure 6. The principal component analysis (PCA) and orthogonal partial least squares discriminant analysis (OPLS-DA) of the metabolic profiles of black locust leaves under control and moderate drought (MD) conditions, as well as under control and extreme drought (ED) conditions. (A) OPLS-DA score plot (CK vs. MD) for black locust leaf samples, (B) OPLS-DA score plot (CK vs. ED) for black locust leaf samples, (C) PCA score plot (CK vs. MD) for black locust leaf samples, (D) PCA score plot (CK vs. ED) for black locust leaf samples.
Forests 16 00695 g006
Figure 7. DEM heat maps of leaf metabolic profiles of black locust under control vs. MD conditions and control vs. ED conditions. (A) Heatmap of differentially expressed metabolites (DEMs) in black locust leaves between those under control and MD conditions (CK–MD); (B) heatmap of DEMs in black locust leaves between those under control and ED conditions (CK–ED).
Forests 16 00695 g007
Figure 8. Heatmaps of differentially expressed metabolites (DEMs) for the comparisons between control, MD, and ED groups.
Forests 16 00695 g008
Figure 9. The differences among the 15 kinds of DEMs are significantly decreased. (AN) Fourteen DEMs were significantly upregulated across the three comparative groups. (O) One DEM was significantly downregulated across the three comparative groups. Black, red and blue represent the amount of the substance in CK, MD and ED, respectively.
Forests 16 00695 g009
Disclaimer/Publisher’s Note: The statements, opinions and data contained in all publications are solely those of the individual author(s) and contributor(s) and not of MDPI and/or the editor(s). MDPI and/or the editor(s) disclaim responsibility for any injury to people or property resulting from any ideas, methods, instructions or products referred to in the content.

