Abstract
Accurate fire risk assessment in forested terrain is crucial for effective disaster management and ecological conservation. This study innovatively proposes a novel framework that integrates Digital Elevation Models (DEMs) with deep learning techniques to enhance fire risk assessment in Chongli District. Our framework innovatively combines DEM data with Faster Regions with Convolutional Neural Networks (Faster R-CNN) and CNN-based methods, breaking through the limitations of traditional approaches that rely on manual feature extraction. It is capable of automatically identifying critical terrain features, such as mountain peaks and water systems, with higher accuracy and efficiency. DEMs provide high-resolution topographical information, which deep learning models leverage to accurately identify and delineate key geographical features. Our results show that the integration of DEMs and deep learning significantly improves the accuracy of fire risk assessment by offering detailed and precise terrain analysis, thereby providing more reliable inputs for fire behavior prediction. The extracted mountain peaks and water systems, as fundamental inputs for fire behavior prediction, enable more accurate predictions of fire spread and potential impact areas. This study not only highlights the great potential of combining geospatial data with advanced machine learning techniques but also offers a scalable and efficient solution for forest fire risk management in mountainous regions. Future work will focus on expanding the dataset to include more environmental variables and validating the model in different geographical areas to further enhance its robustness and applicability.
1. Introduction
Forests play a crucial role in maintaining ecological balance, providing habitats for diverse species, and contributing to the global carbon cycle [1,2]. However, forest fires pose a significant threat to these valuable ecosystems, causing extensive damage to wildlife, vegetation, and human infrastructure [3,4]. Therefore, accurate and timely fire risk assessment is essential for effective forest management and disaster prevention [5,6]. Traditional fire risk assessment methods often rely on historical data, meteorological conditions, and field surveys, which may be insufficient to capture the complex spatial and temporal dynamics of fire-prone areas [7,8]. In recent years, advances in DEM and deep learning have opened up new possibilities to enhance fire risk assessment through detailed terrain analysis [9,10]. Ruiz-Lendínez et al. highlighted that operations such as void filling, super-resolution, landform classification, and hydrography extraction in DEMs have shown great potential, with deep learning methods effectively filling data voids and restoring key topographic features in complex terrain areas, thereby providing new opportunities for the development of geospatial information science [11].
The Chongli District, located in the northern part of Hebei Province, China, is characterized by its mountainous terrain and dense forests [12]. The topography of the district, with its numerous mountain peaks and intricate water systems [13,14,15], creates a unique environment that influences the behavior and spread patterns of fires [16]. Understanding the spatial distribution of these characteristics is critical for identifying high-risk areas and developing targeted fire management strategies. DEMs provide high-resolution topographical data that can be used to extract detailed information about the terrain, such as elevation, slope, and aspect [17,18,19]. However, the complexity of forested terrain, especially in mountainous regions, requires advanced analytical techniques to fully utilize DEM data for fire risk assessment [20,21].
Deep learning, a subset of artificial intelligence, shows remarkable potential in various fields, including remote sensing and Geographic Information Systems (GIS) [22,23,24,25,26]. CNNs and other deep learning models have been successfully applied to image classification, object detection, and segmentation tasks, demonstrating their ability to automatically learn and extract meaningful features from large datasets [27,28,29,30]. By integrating DEM data with deep learning models, it is possible to develop more accurate and efficient methods for extracting key features of the terrain, such as mountain peaks and water systems [31,32], which are critical for assessing fire risk.
In recent years, the field of forest fire risk assessment has seen significant progress with the emergence and validation of many innovative methods. Varotsos et al. [33] proposed a multi-source data fusion method that combines numerical model simulations with microwave remote sensing images to significantly improve the accuracy of identifying flammable areas. At the same time, remote sensing technology has been widely used in DEMs. Han [34] evaluated the vertical accuracy of DEMs under different quality grades and land cover types, highlighting the importance of remote sensing in enhancing DEM accuracy. Kim et al. [35] further demonstrated the potential of multi-source data in fire monitoring by successfully detecting forest fires in South Korea using multiple satellite remote sensing datasets. In the realm of machine learning, Fu [36] developed a method for forest fire risk assessment using an optimized backpropagation neural network (BPNN) based on the stochastic average gradient descent (SAGD) algorithm, achieving a prediction accuracy of 94.38%. These studies have provided valuable insights and references for our work, driving the continuous development of research in this field.
Our study introduces a novel approach that integrates DEM data with deep learning techniques to enhance fire risk assessment in the Chongli District. Specifically, our innovation lies in the first-time application of Faster R-CNN and ResNet-101 to DEM data, focusing on the extraction of mountain peaks and water systems, which are key factors influencing fire behavior in forested terrain [37,38,39]. By combining DEMs with deep learning, we can achieve automatic identification of these features, thereby providing a more comprehensive and detailed analysis of the terrain [40]. Furthermore, we have developed an innovative adaptive anchor box generation algorithm based on mean-shift clustering, which significantly improves the accuracy of feature extraction compared to traditional manual methods. In addition, we have considered dynamic fire risk modeling based on elevation-driven fire spread and hydrological firebreaks [41,42]. These innovations not only enhance the accuracy of fire risk assessment but also provide more scientific decision-making support for forest fire management.
The main objectives of this study are to: (1) develop a deep learning-based method to extract mountain peaks and water systems from DEM data; (2) evaluate the precision and efficiency of the proposed method compared to traditional approaches; and (3) demonstrate the application of the features of the extracted terrain in improving the assessment of fire risk in the Chongli district. The results of this study are expected to contribute to the field of forest fire management by providing a new and effective tool for terrain analysis and fire risk assessment in complex forested environments.
2. Study Area and Data Preparation
2.1. Overview of the Study Area
Considering the diverse array of landform types and the abundance of experimental data available, the main research area was chosen to be Chongli District, Hebei Province. Chongli District is an administrative district under the jurisdiction of Zhangjiakou City, Hebei Province. Its geographical coordinates (as depicted in Figure 1, collected on 25 August 2020) are 40°47′–41°17′ N latitude and 114°17′–115°34′ E longitude. The district covers an area of 2334 km2, with altitudes ranging from 813 m to 2174 m above sea level, resulting in a maximum elevation difference of 1361 m. On-site observational data indicate that the average daily maximum temperature in this region is 12 °C, while the average daily minimum temperature is −2 °C. Furthermore, the annual water runoff of the area under study is million m3.
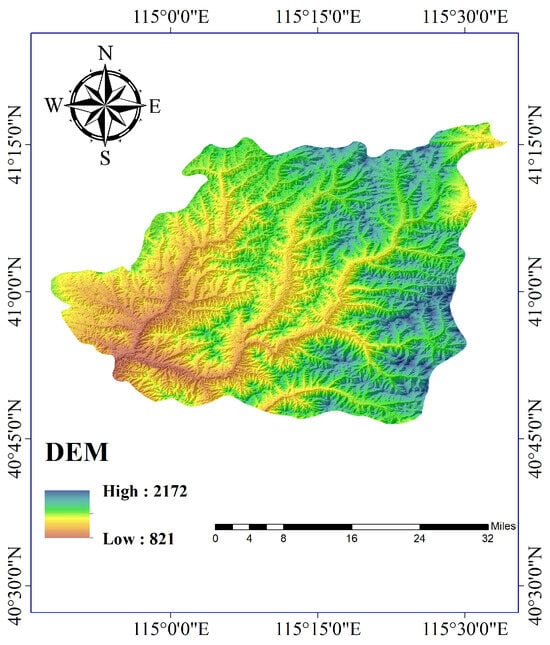
Figure 1.
Geographical location of Chongli District, Hebei Province (collected on 25 August 2020).
From the perspective of topography, of the territory is mountainous and the forest coverage rate reaches . The area has layers of rock from very old geological periods, some more recent layers showing in certain spots and valleys. It is a mountainous region in the northwest of Hebei province, where different mountain ranges meet. The mountains are quite steep, with most peaks between 1500 and 2000 m high, which is considered a mountainous area of medium altitude. The elevation in Chongli District ranges from 813 to 2174 m, with the highest and lowest points differing by 1361 m. From the perspective of water, the surface water in Chongli District comes primarily from rain, with an average yearly rainfall of 488 mm, totaling billion m3 of water. The water that flows off the land throughout the whole area averages mm per year, which amounts to a total annual runoff of million m3.
2.2. Data Source
DEM data is crucial for accurately capturing fine-scale elevation variations in this study. In Chongli’s complex mountainous terrain, conventional remote sensing data such as optical imagery from Landsat or Sentinel satellites face limitations in micro-topographic characterization due to their inability to directly measure elevation [43]. DEM data, with its explicit elevation values at each grid point, enables precise terrain modeling and directly supports derivation of key parameters such as slope gradients and drainage networks [44]. This study utilizes the Advanced Spaceborne Thermal Emission and Reflection Radiometer Global Digital Elevation Model (ASTER GDEM) as the primary dataset, with the Shuttle Radar Topography Mission (SRTM) data serving as supplementary data. SRTM is a project jointly completed by the National Aeronautics and Space Administration (NASA), the United States Geological Survey (USGS), and space agencies from Germany and Italy, with the primary goal of generating global DEM data [45]. Its data cover various types of terrain globally, including mountains, plains, and forests [46]. ASTER GDEM is a high-resolution global topographic dataset jointly released by NASA and Japan’s Ministry of Economy, Trade, and Industry. It offers extensive coverage and high precision, widely used in research and analysis across fields such as geography, environmental science, and geology [47].
We employ ASTER GDEM as the core dataset for mountain peak identification, water system extraction, and deep learning modeling due to its superior spectral resolution that enhances feature discrimination, multispectral capabilities for optimized grayscale rendering, and ideal balance between 30 m spatial resolution and regional coverage—making it perfect for precision fire risk assessment [48]. Complementing this, SRTM serves as supplementary data because its proven 16-30m vertical accuracy reliably supports topographic framework construction. Together, they form a robust validation system where ASTER enables detailed micro-analysis and SRTM provides essential macro-scale consistency checks for comprehensive fire behavior predicting across this complex mountainous terrain [46].
While preparing our data, we went through several key processes. Before we began our research, we validated the data using ground truth points to confirm its reliability and accuracy for our use. We corrected any errors referring to inaccuracies or inconsistencies in the DEM data, such as elevation anomalies, missing data, or artifacts caused by sensor limitations or processing issues and ensured that all elevation values could be compared using a common reference point. Then, by stitching the data blocks together, we ensure continuity and eliminate edge artifacts that may occur at the boundaries of individual tiles, thereby enhancing the clarity of details and enabling the observation of smaller land features more clearly.
2.3. DEM Data Acquisition
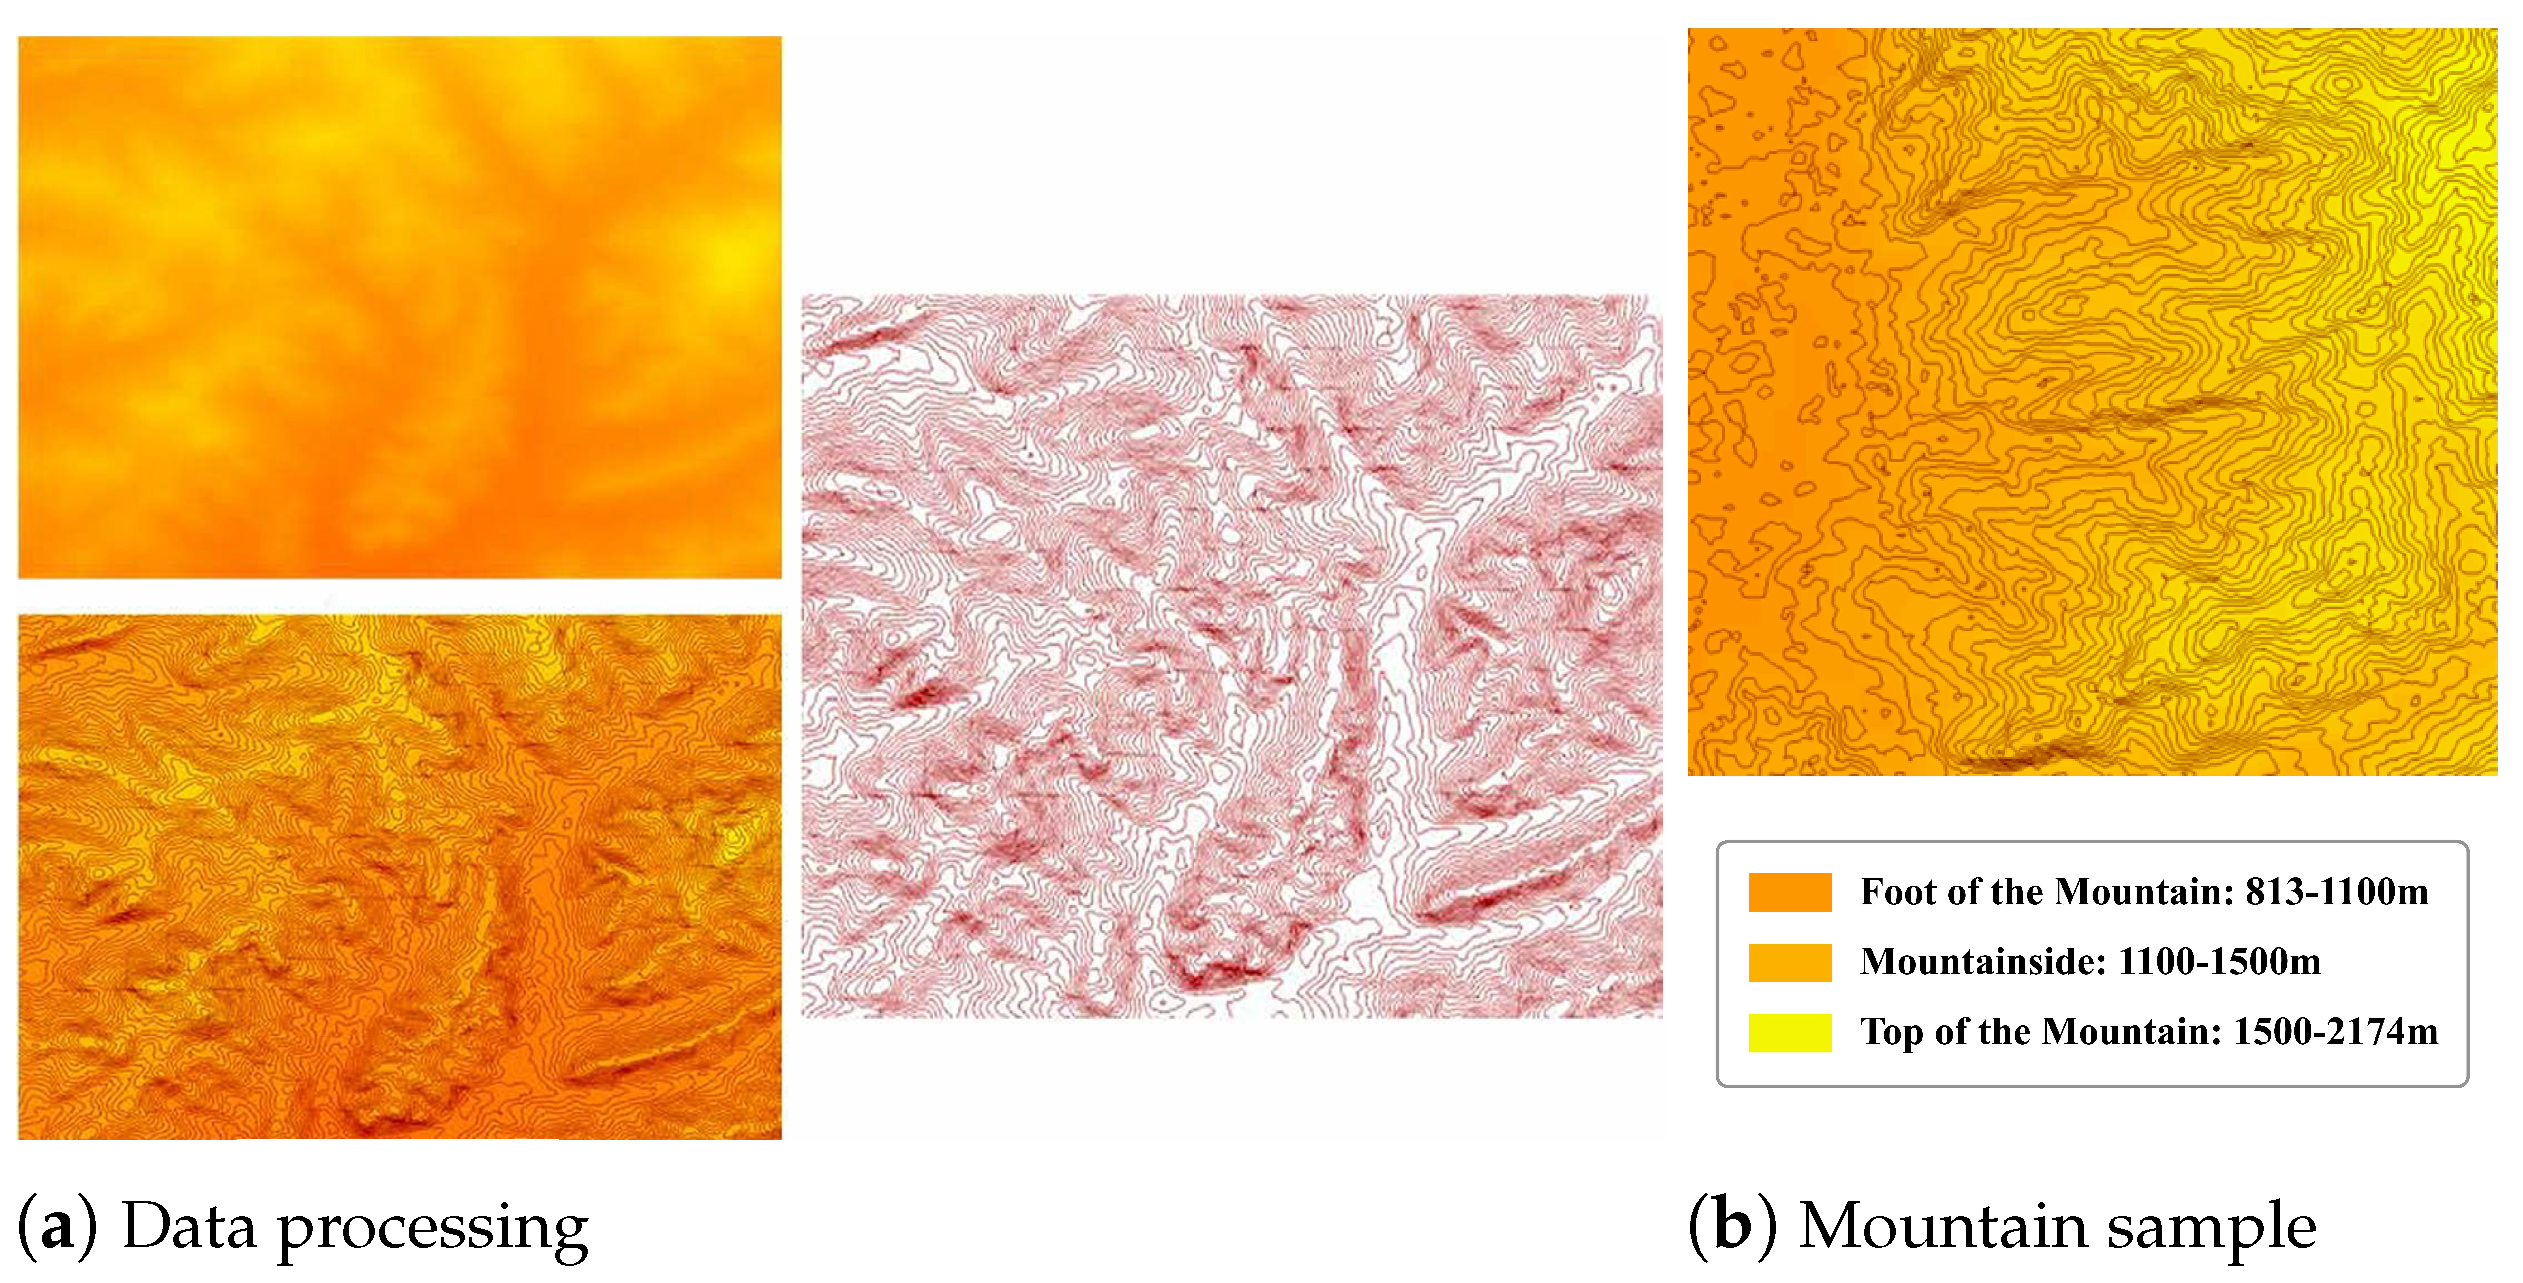
In the field of geographic information, contour topographic maps mainly reflect the geomorphology of mountain elements, and it is difficult to accurately describe the spatial elevation changes of topographic elements in the form of images. The digital image reflects the elevation change of the mountain with multi-level grayscale differences through grayscale rendering of DEM data. Therefore, in order to effectively use the deep network for terrain feature extraction in DEM data, the contour image is used to reflect the topography of the mountain data, and the grayscale rendering image is used to represent the elevation change trend in the mountain data. The generation and grayscale rendering processing, as shown in Figure 2, combines the features of the mountaintops in the two modes in the form of image synthesis, and then forms the learning sample data that the deep network can receive.

Figure 2.
Generation and grayscale rendering processing of mountain data.
To extract mountain tops, our study uses DEM data provided by ASTER GDEM as the basic data. First, extract mountainous regions by applying elevation criteria consistent with the definition of landforms, and cut out 1000 pieces with a size of mountain data blocks, which are discrete pixel-based DEM segments used for localized analysis, ensuring that there are at least one or more mountain tops in each data block, and pre-process the DEM data according to the method in Figure 2a. At the same time, the minimum circumscribed rectangle method is used to mark the mountain top area in the superimposed image to ensure that there is only one mountaintop in each marked rectangle, and contains as little background information as possible, forming the mountaintop sample data as shown in Figure 2b. Among them, Figure 2b is the superimposed mountain contour rendering.The peak sample data are shown in Table 1.

Table 1.
Peak sample data.
To extract the water system, including rivers, streams, and drainage networks, our study utilizes elevation data from ASTER GDEM. The downloaded data are pre-processed through mosaic creation, coordinate conversion, and clipping to generate a DEM image that matches the size of the study area. ASTER GDEM is one of the most commonly used surface digital elevations, and it is widely used in water system information extraction research.
3. Materials and Methods
3.1. Definition of Mountain Top Point
A mountain is a piece of high land with a steep sides, usually higher than 500 m above sea level and with a height difference of more than 200 m compared to its surroundings. The top of the mountain is the highest point, and it is also the spot where the ground rises most in the area, which is a key point on the landscape. In simpler terms, the highest point on a mountain is not always the same as the highest point in the surrounding area. Mountain tops often form a group of points that are connected and organized in a certain order.
Topographical features, such as mountain tops and valleys, significantly influence fire behavior. For instance, the elevation and slope of a terrain can affect the speed and direction of fire spread. Based on the contour model and the analytical expression of the terrain, let the terrain surface be T, a and b be any two points on T, and their elevations are and , respectively. For any point i on T, if the following conditions are met:
where is the plane passing through point i, is the contour line passing through i, and T is the hillside surface with b as the top. is the contour line at the foot of the mountain, and the points satisfying the point set constitute the hillside . If , T is the sharp point. If , T is the dome. If the terrain surface T is expressed as:
when any point satisfies the following conditions, then it is judged that P is the top of the mountain. If ; maximum curvature ; and minimum curvature . The coefficients in the polynomial satisfy:
To model fire behavior, we use the following equations. The rate of the spread of a fire is given by:
where is the base rate of the spread, S is the slope steepness factor, is the slope angle, and W is the wind speed factor. The flame length is calculated as:
where H is the fuel height. The fireline intensity is given by:
where is the fuel particle count.
3.2. Definition of Mountain Vertex in Grid DEM
The grid DEM employs a discretized regular grid to depict the surface relief, and each grid cell records the elevation attribute of the ground surface. Given the regularity of the square grid, the planar position of a grid point is implicitly defined by the row and column numbers i and j. Thus, the DEM can be regarded as an elevation matrix with m rows and n columns, which can be expressed as:
The summit is geometrically the highest point of the mountain. In the DEM, the mountain peak can be considered the highest point within a specific area S, as follows:
Traditional methods for extracting mountain tops often suffer from low accuracy. To address this, our study proposes a geomorphological classification method to determine the minimum elevation threshold for mountain tops in Chongli District. This method considers factors including altitude and topographic variability. Table 2 summarizes the principles used for classifying landform types in China and its adjacent areas. These principles were jointly developed by the Nanjing Institute of Geography and Limnology, Chinese Academy of Sciences, and nine other institutions, including the State Oceanic Administration and the Chinese Academy of Sciences.
Table 2.
Classification standard of basic geomorphic forms.
3.3. Peak Point Extraction Algorithm
In order to obtain more mountain top features that include morphological characteristics such as the shape, elevation, and relief of the peak in mountain samples and extract the coordinate position of the mountain top with greater precision, this article designs a mountain top recognition framework implemented by the ResNet-101 residual network under Keras. First, use the feature extraction module to deeply mine the morphological features of the mountain top area in the mountain sample, and then, combine the core Regional Proposal Network (RPN) module of Faster R-CNN to automatically generate a high-quality mountain top target area, and finally map the mountain top target area in the sample image back to the original. In the DEM data, the position of the maximum elevation value in the target area is calculated as the final coordinates of the mountain top.
The extraction of mountain top features plays an important role in the identification of mountain tops. According to our initial thinking, the deeper the network layer, the better the learning capacity of the network. As the number of network layers increases, the performance of the network improves with increasing depth until it reaches a plateau, beyond which additional layers no longer provide significant improvements then immediately decreases. The unknown function that needs to be learned to approximate identity mapping becomes a function that approximates , and the residual module has two convolution layers representing two in the second convolution operation, x is the input value of the residual block, is the input value of the convolution block, and is the output of the residual block. First, consider the limited sample data of mountain tops in the self-built Chongli District, and the performance of the convolutional neural network is affected by the number of samples that can be learned through the ImageNet dataset. The ResNet-101 network model performs pretraining, freezes the extracted bottom-level convolutional blocks about the general features of the thousand layers, and then fine-tunes the internal parameters of the top-level convolutional blocks by using the self-built mountain peak samples, and performs current training through transfer learning. Feature extraction for mountain vertices.
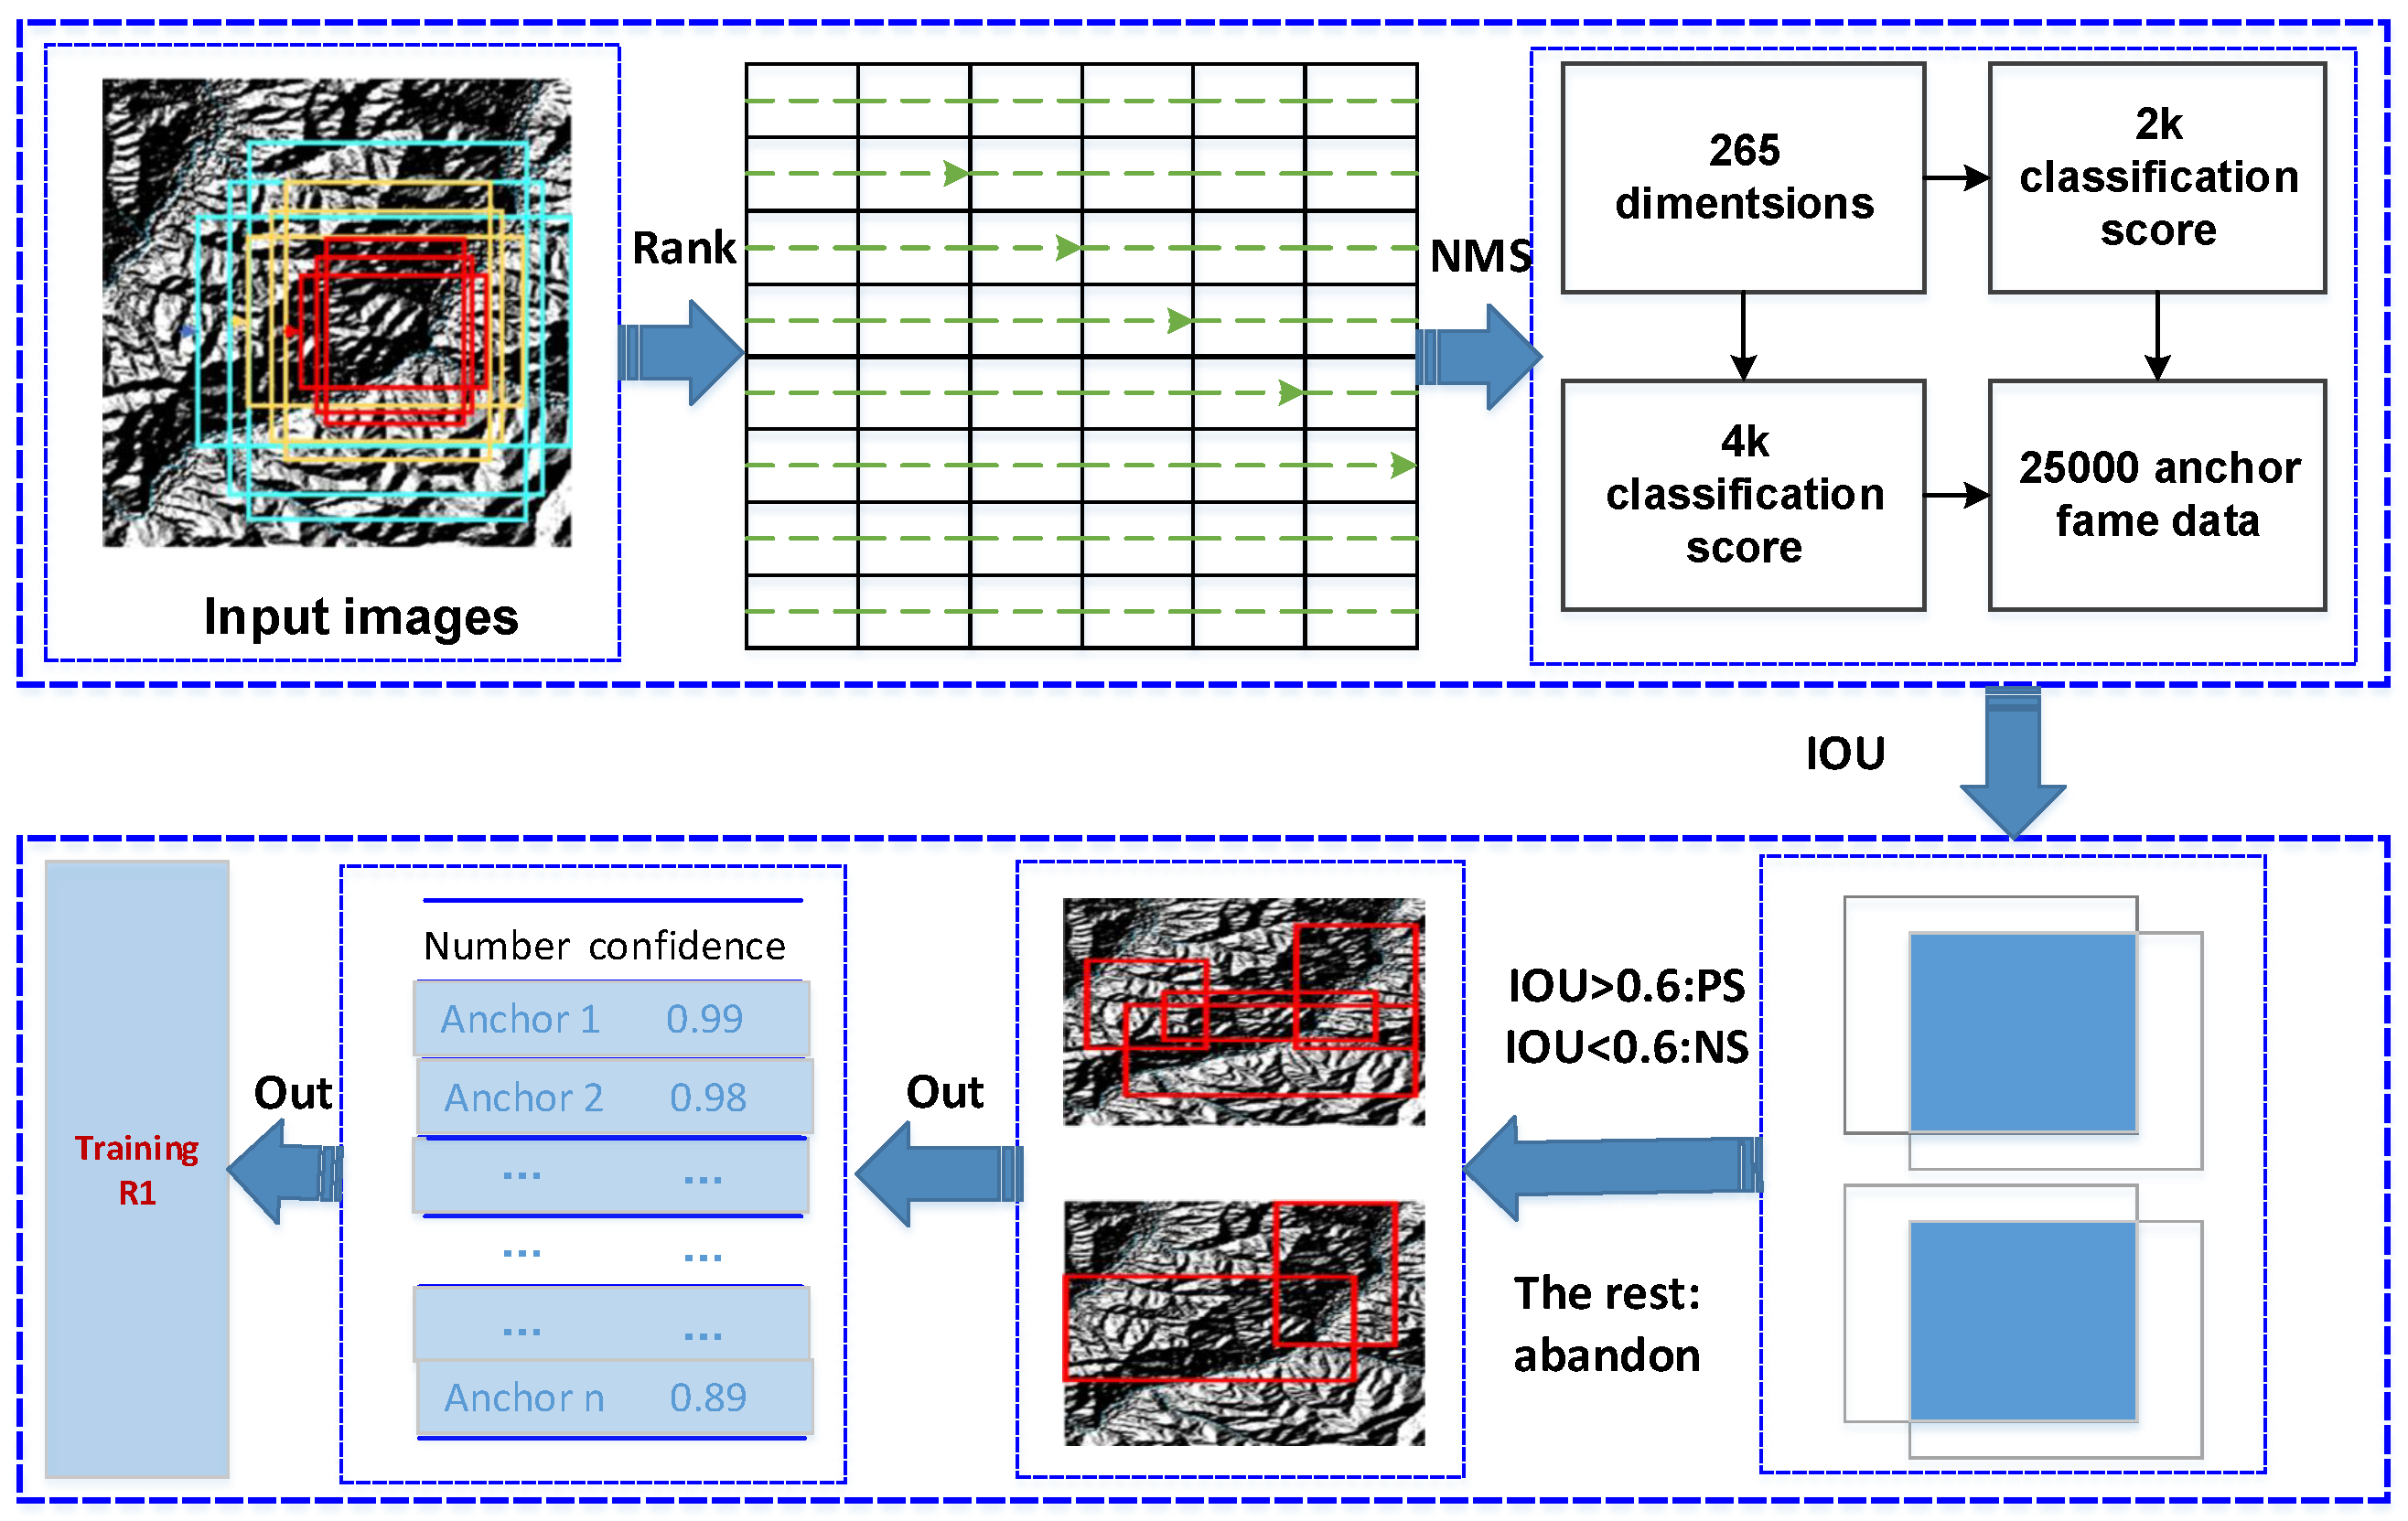
Then, use the RPN module to search for potential candidate regions in mountain samples. RPN performs spatial convolution on the feature map in the form of sliders, selects deeper features in the mountaintop area, and maps each pixel on the obtained spatial convolution map. Return to the position of the original mountain sample and generate anchor boxes with different sizes and ratios. The original method uses the default anchor frame parameters to achieve accurate identification and positioning of the mountain top area. However, in order to improve the recognition accuracy of the mountaintop pixels, the mean shift clustering algorithm is firstly used to set the anchor frame parameters suitable for the mountaintop target area according to the mountaintop labeling samples, where the main idea of the mean shift clustering algorithm is based on the sliding window algorithm to find the dense area of data points, and then based on the centroid, update the candidate point of the center point to the mean value of the points in the sliding window to complete the positioning of each group or class center point, and then remove the similar windows of these candidate windows, and finally form the center point set and the corresponding grouping. Here, the size of the label box in the self-built hilltop training set is used as the input of the clustering algorithm, and the sample set is collected. Cluster analysis is performed on the labeled boxes to determine the anchor boxes that are finally used for mountain apex recognition.
In order to filter the generated anchor boxes, the intersection ratio between the anchor box and the marked box in the hilltop area can be calculated, set >0.6 as foreground threshold, set <0.4 as background threshold, In this way, the acquired anchor frames can be divided into foreground thresholds that contain mountain vertices and background thresholds that do not contain mountain vertices, discard anchor frames that are in the middle threshold and use the Non-maximum Suppression (NMS) method. The NMS method screens the candidate frames, sorts the remaining anchor frames according to their reliability, and retains the candidate frames with a higher probability of containing mountain vertices, in order to achieve a rough estimation and positioning of the mountain vertices in Chongli District.
3.4. Water System Information Extraction in Chongli District Based on Faster R-CNN
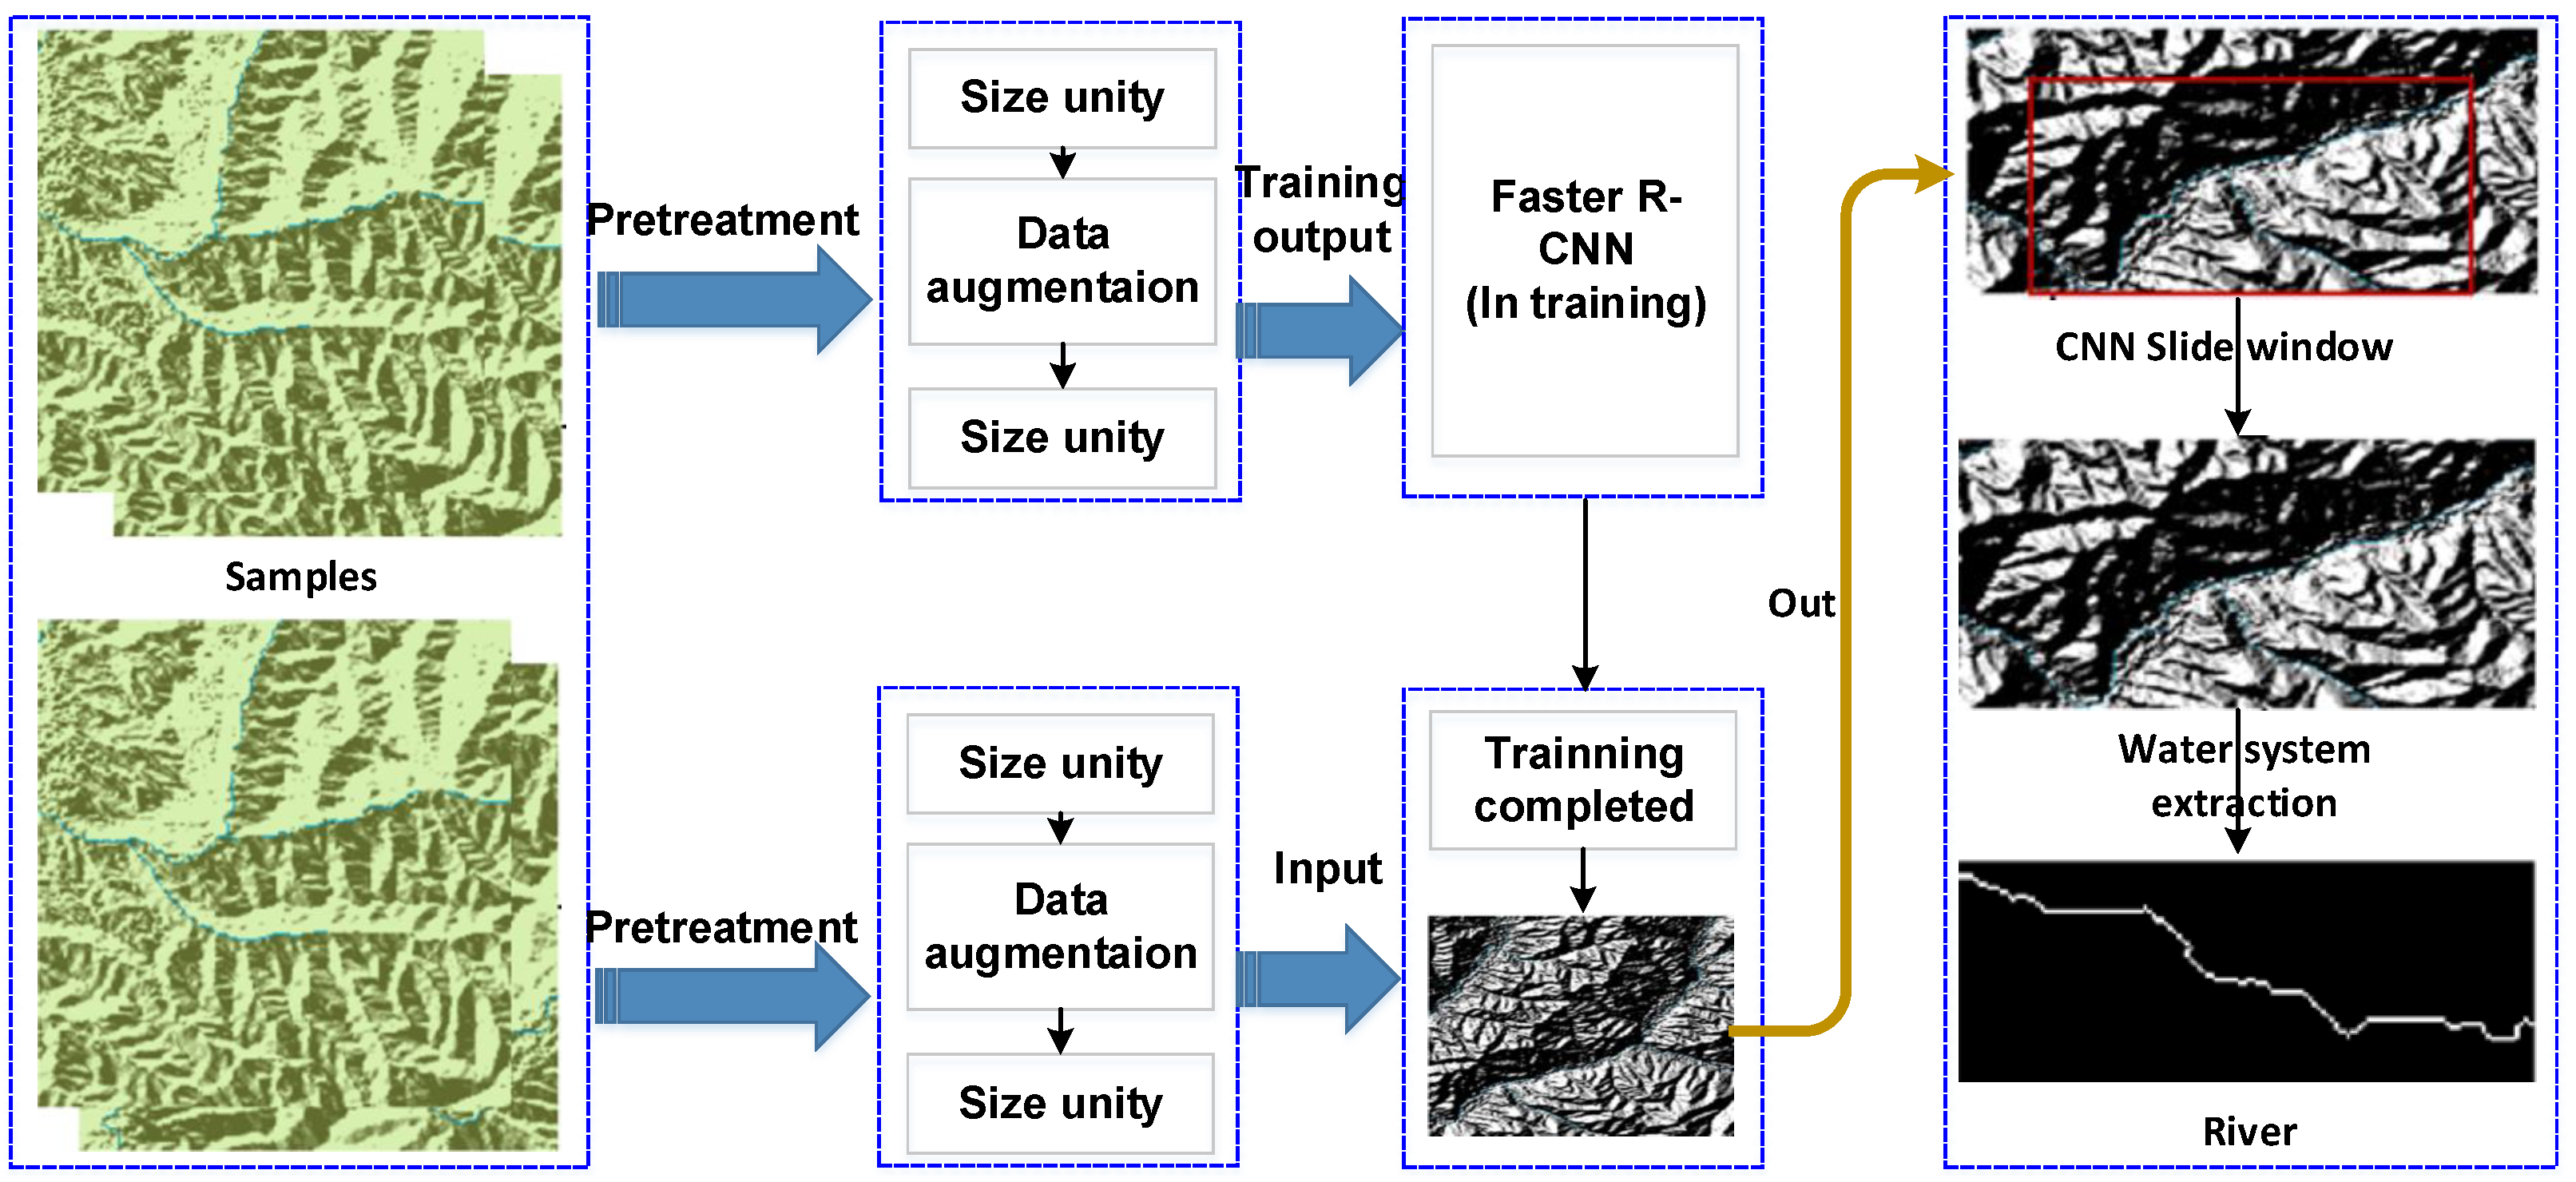
The water system identification process, illustrated in Figure 3, plays a critical role in enhancing fire risk assessment, particularly in regions where water resources are crucial to fire management. The process consists of several stages, from data collection to deep learning-based analysis, culminating in accurate water system mapping.
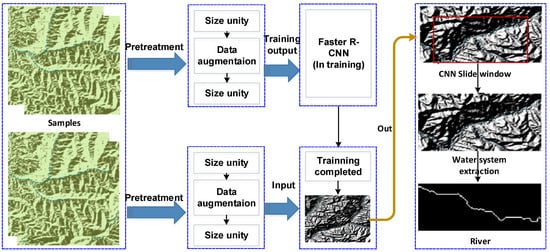
Figure 3.
Flow chart of water system identification in Chongli District.
We utilize UAVs equipped with high-resolution cameras, professional-grade sensors, and remote sensing technology to rapidly, using no contact, acquire high-precision images and high-quality data from water systems. The first step in processing the collected data is image pre-processing, which includes cropping, segmenting, and resizing the images to ensure uniformity. The images are also enhanced to improve the clarity of the water systems. Specifically, the pre-processing steps can be described as follows: Let represent the original image, and define the cropped image by selecting the region of interest (ROI) containing the water system:
where are the pixel coordinates and ROI denotes the region containing the water system. After cropping and segmentation, the image is resized to a uniform scale to ensure consistency across the dataset. The resized image, , can be expressed as:
where is the resizing function. Once the images are preprocessed, they are classified based on the type of water system (e.g., river, reservoir, pond). Specialized software tools are used to annotate the images and generate a training sample database. Let denote the training dataset, where are the annotated images and are the corresponding class labels. To identify the water system in each image, a Faster R-CNN network is employed, which is a deep learning-based method for object detection.
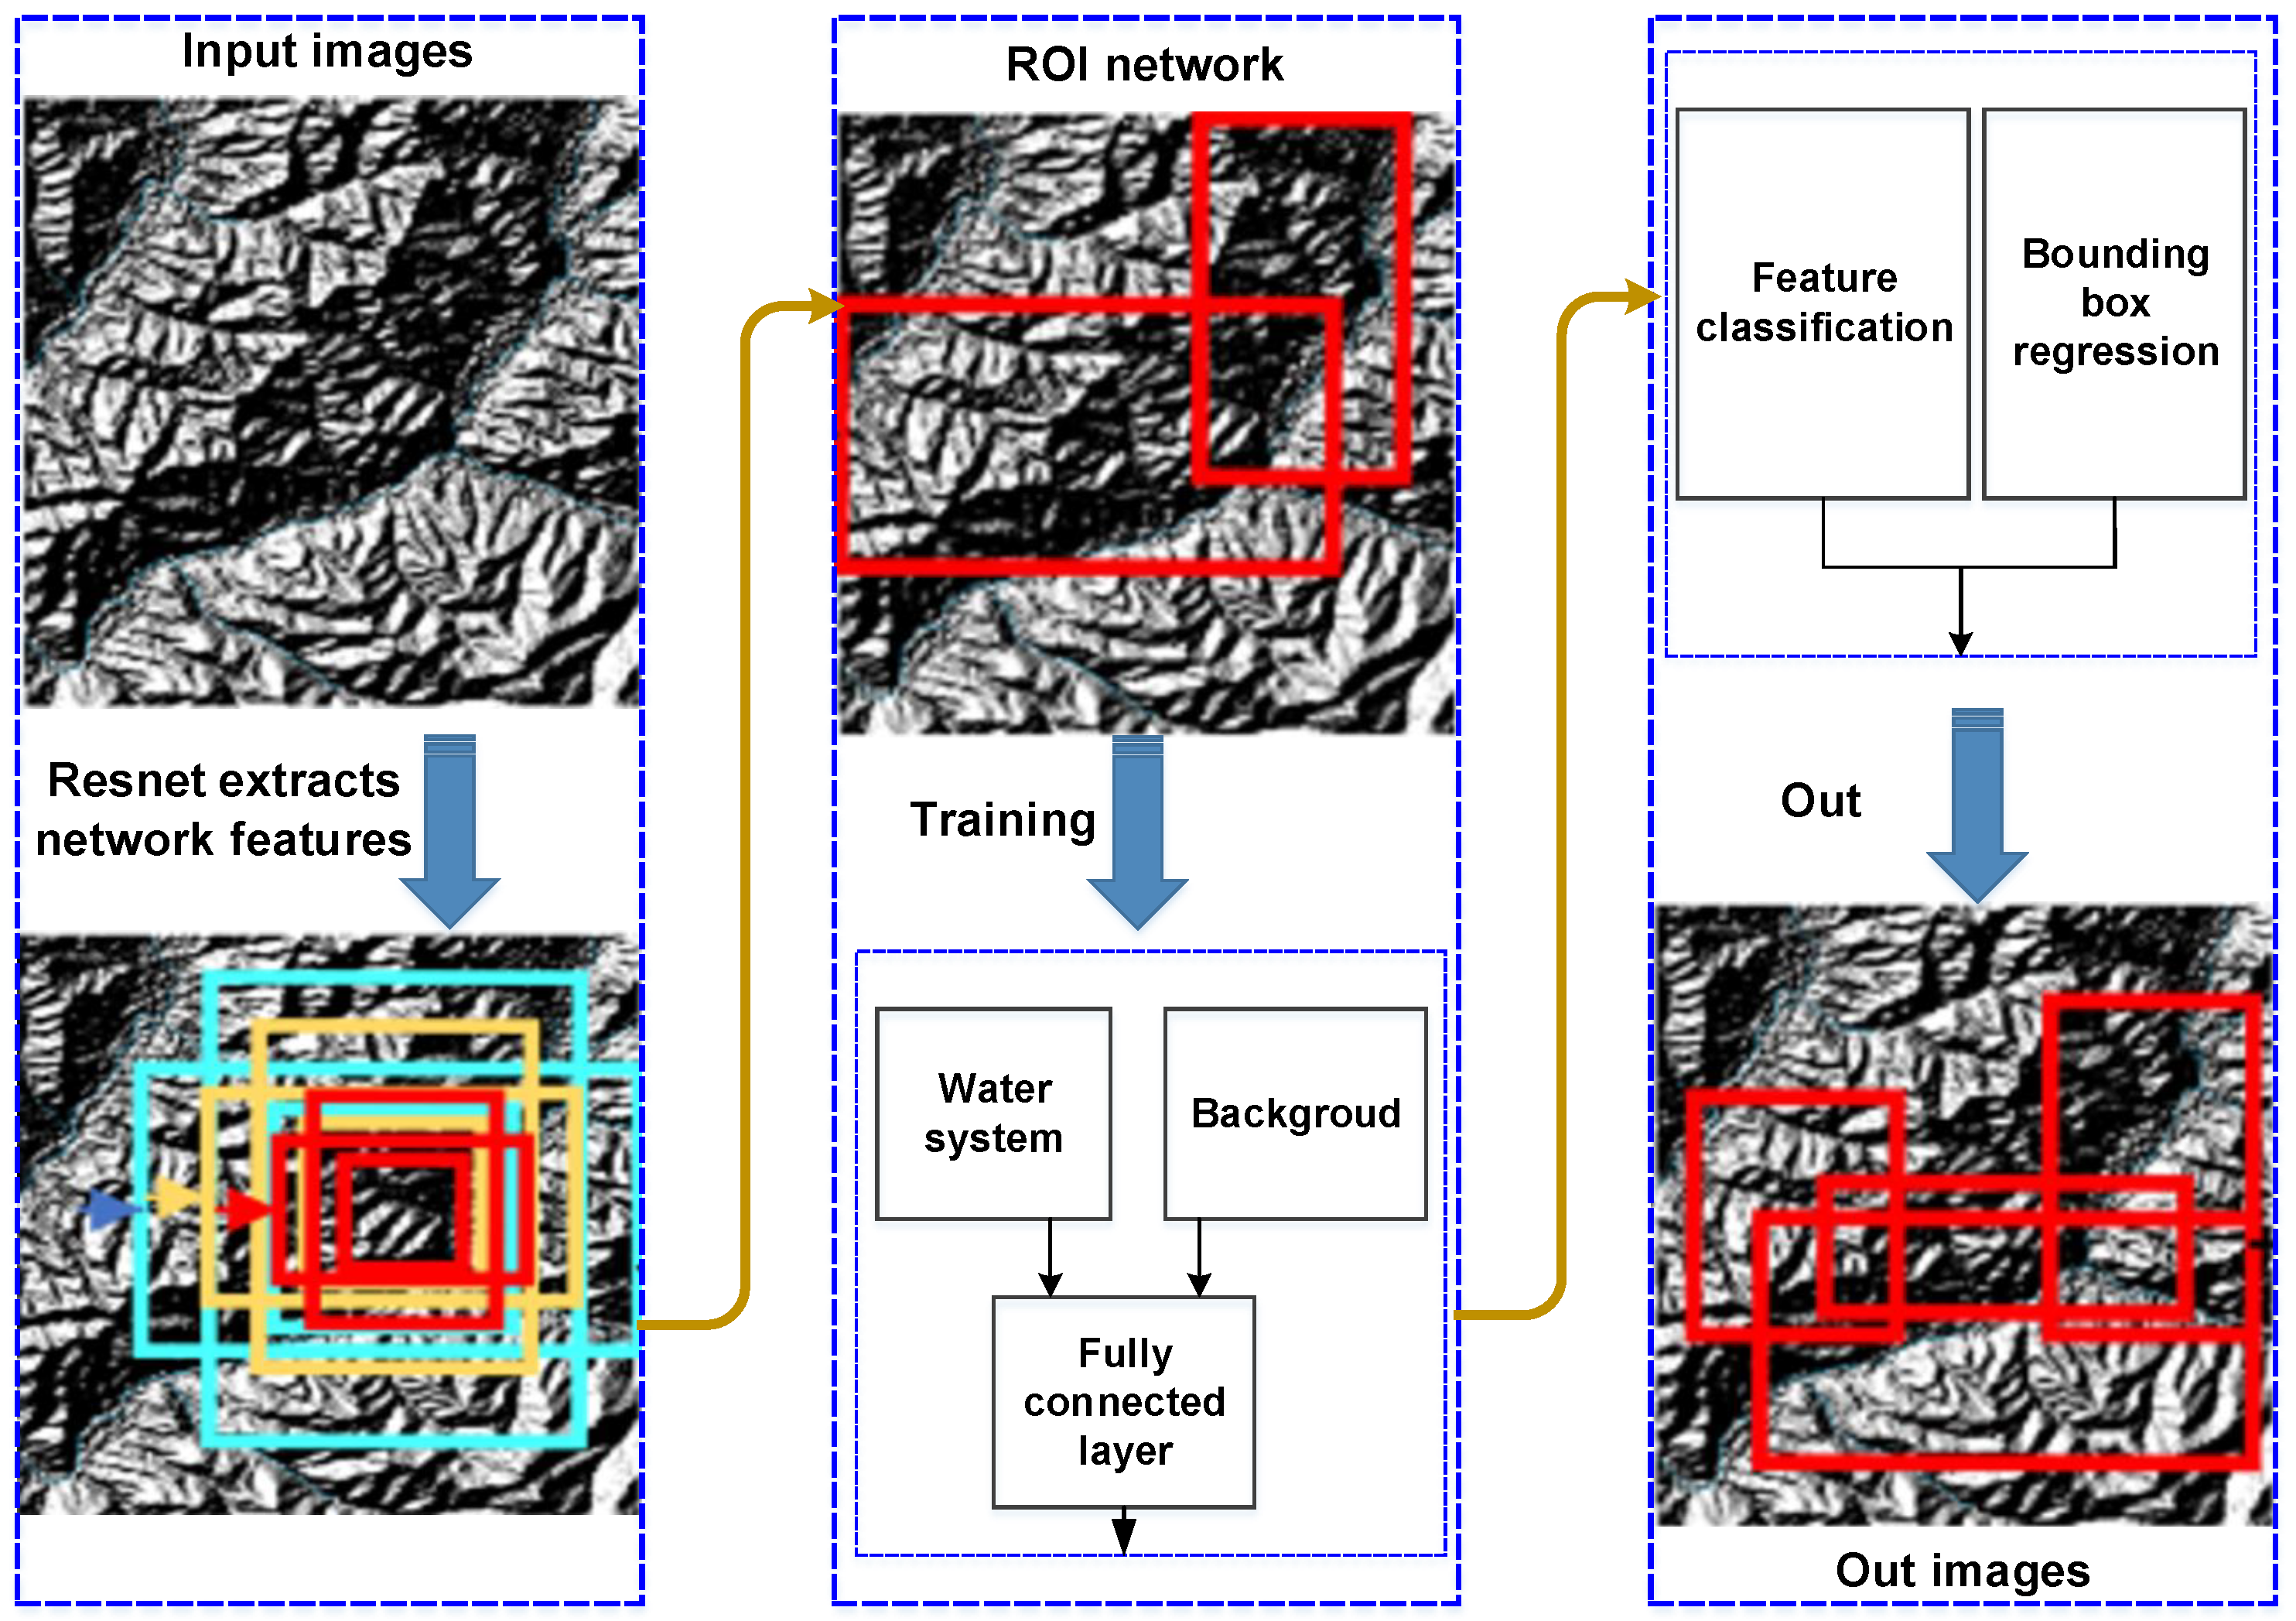
The Faster R-CNN algorithm is derived from CNN and is an advanced version of the target detection algorithm R-CNN and Fast R-CNN, which has a significant improvement in speed and demonstrates a superior ability in locally discriminating features. When modeling global spatiotemporal information from video data, CNN models often rely on local spatiotemporal convolutions between frames, with an emphasis on capturing local spatial features. The architecture is shown in Figure 4. First, the image is input, and the image features are extracted through VGG16 or ResNet. The advantage of ResNet is that the use of residual network can improve the recognition accuracy by increasing the depth, and the more layers of the network, the more abundant the features extracted at different levels. Then, on the generated convolutional feature map, the candidate window is generated through the RPN and judged whether it is a foreground (target water system). If the relevant area is classified as foreground, the water system will be classified through the fully connected layer, and the window coordinates will be fine-tuned through border regression. Finally, a rectangular frame will be used to mark the specific water system category on the output image, and its classification confidence will be given.
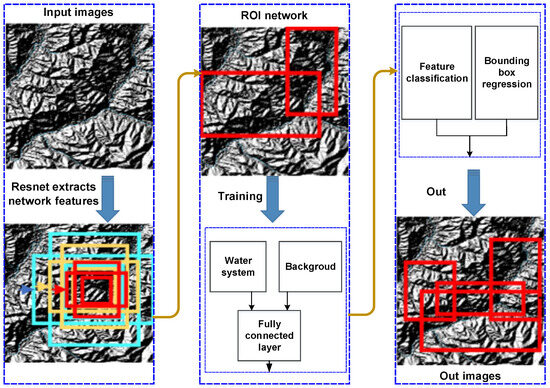
Figure 4.
Faster R-CNN algorithm flow chart: blue boxes (feature extraction and input layers); yellow boxes (classification and regression processes); red boxes (output and decision-making stages).
The Faster R-CNN network first generates a set of region proposals from the input image. For each region proposal, classification and bounding box regression are performed. The network output is a set of bounding boxes that define the locations of the identified water systems. The objective of Faster R-CNN is to minimize the following loss function:
where: is the classification loss, typically computed using softmax cross-entropy:
where is the true class label and is the predicted probability for class i. is the bounding box regression loss, which measures the difference between the predicted and ground-truth bounding box coordinates:
where are the offsets between the predicted and ground-truth bounding boxes. Once the Faster R-CNN network has identified the bounding box, a morphological algorithm is applied to refine the shape of the water system. Additionally, the AlexNet transfer learning technique is utilized to improve feature extraction. The shape of the water system is extracted, and the length and width of the system are calculated from the bounding box dimensions as follows:
As shown in Figure 5, first, continue to apply convolution on the feature map (generally pixels in size and 256 dimensions in depth) output by the feature extraction network (ResNet, VGG, etc.), with the same size and depth, which is used to combine surrounding information to obtain a convolutional feature map. Then, map each pixel on the feature map to the original image to generate nine types of anchor boxes.
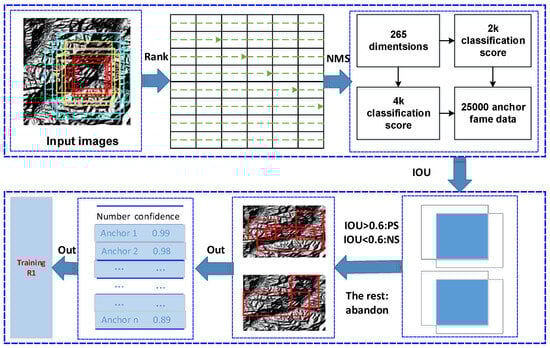
Figure 5.
RPN network.
3.5. Model Validation
Upon completion of the training phase, our study conducted a comprehensive comparative evaluation of mountain peak and water system identification performance. For mountain peak detection, we performed quantitative comparisons between the model’s output and traditional manual identification results by statistically analyzing the number of identified peaks. In assessing water system recognition, the evaluation utilized 500 positive samples containing water systems to measure missed detection rates and 1500 negative samples without water systems to determine false detection rates. To provide a rigorous quantitative assessment of the algorithm’s performance, we employed three key evaluation metrics: precision, recall, and F1-score, enabling a comprehensive and objective analysis of the model’s detection capabilities. The accuracy of the model is computed as:
where True Positive (TP) refers to pixels correctly classified as water bodies; True Negative (TN) represents pixels correctly classified as non-water; False Positive (FP) occurs when non-water pixels are wrongly classified as water; False Negative (FN) indicates water pixels that are missed. Precision and recall quantify the model’s performance in detecting positive instances, with precision minimizing false positives and recall minimizing false negatives. The F1-score harmonizes these metrics through their harmonic mean:
4. Results
4.1. Experiment Setup
Before conducting the water system extraction experiment, the samples must undergo pre-processing. The original images often suffer from issues such as insufficient lighting and low grayscale contrast. To address this, the brightness and contrast of the images are adjusted to make the water system more distinguishable from the background. In this study, an automatic color balance method is employed to adjust the contrast. This method primarily calculates the relationship between the light and dark regions of the target point and its surrounding pixels through difference analysis, followed by automatic pixel correction, as shown in Figure 6.
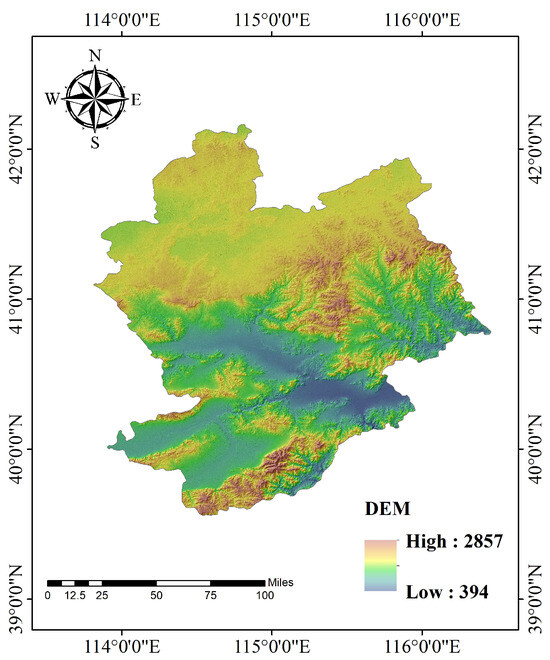
Figure 6.
The image after contrast adjustment.
4.2. Experiment Processing
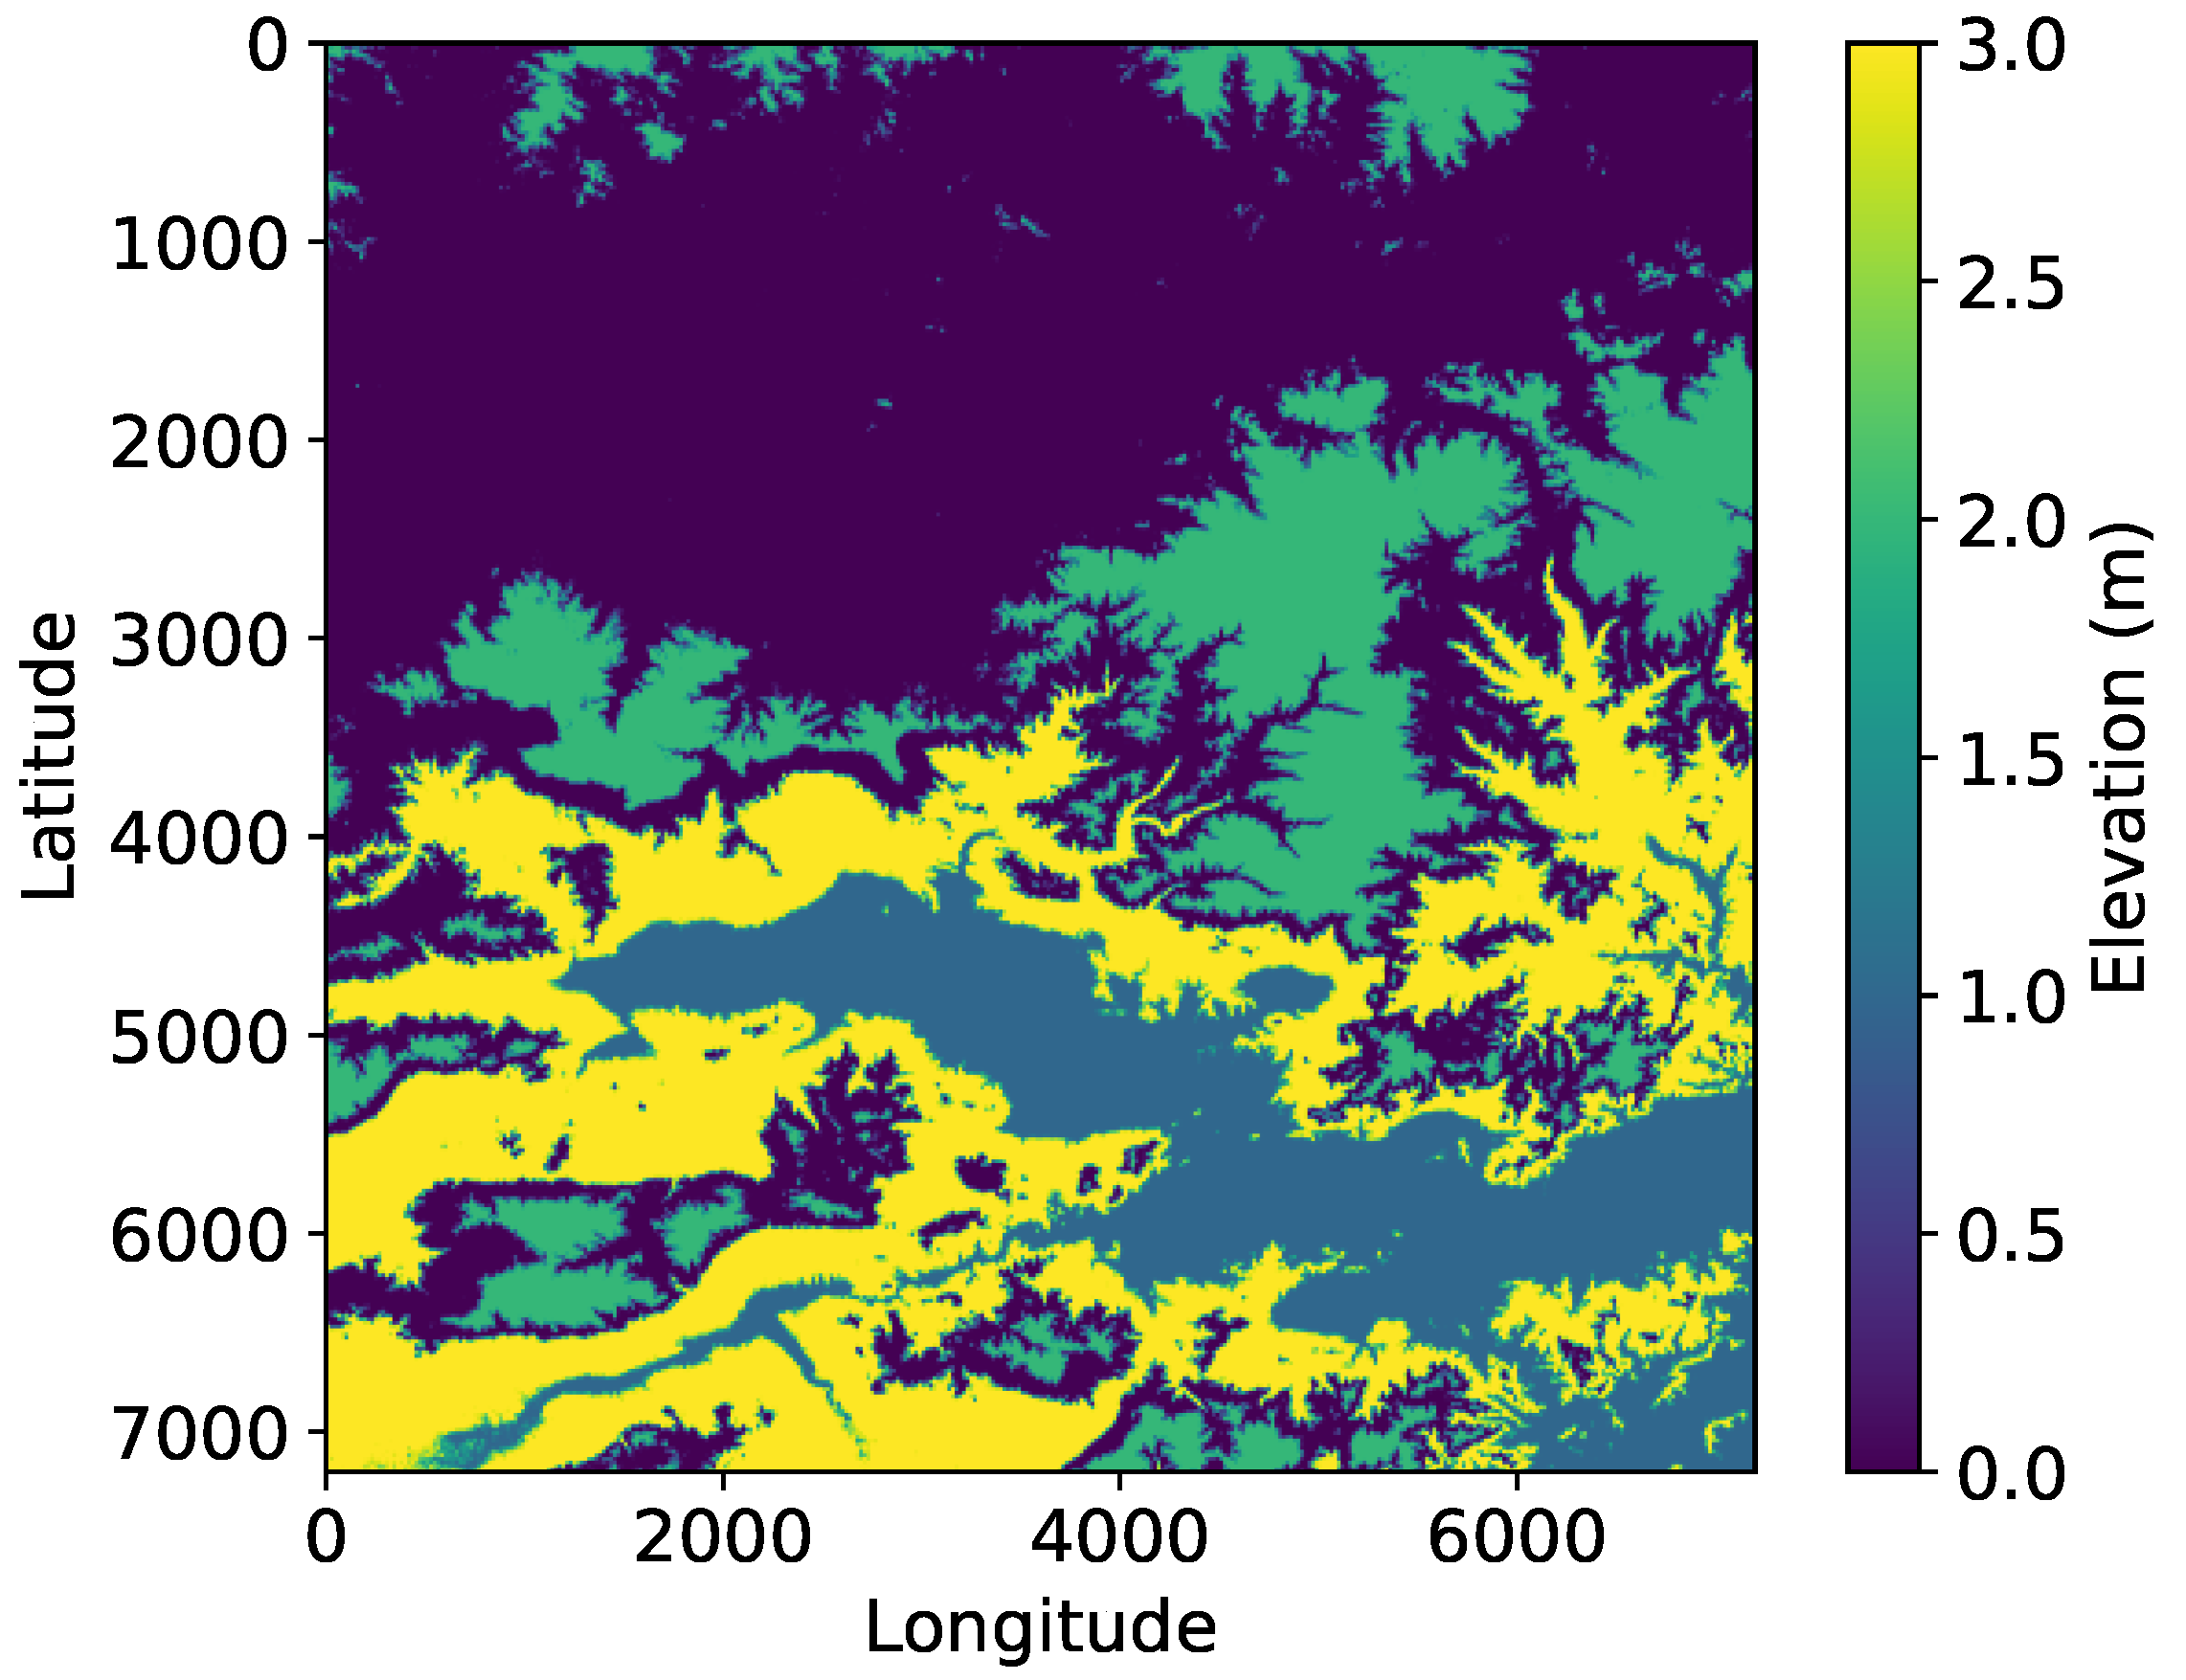
In this experiment, deep learning is applied to the DEM data to segment the terrain into distinct clusters, each potentially representing a mountain peak or high-elevation region, as is shown in Figure 7. The DEM data is first flattened and then clustered into four regions, based on similar elevation values. The resulting clusters are reshaped back into the original 2D DEM shape, allowing for visual representation as a color-coded map, where each cluster is highlighted in a unique color. The colorbar provides a reference for the cluster labels, indicating different regions of interest. This segmentation helps identify areas with similar elevation characteristics, which could correspond to mountain peaks or elevated regions in the terrain. The approach offers an unsupervised method for detecting peaks or high-elevation features in DEM data, though the number of clusters may need to be adjusted depending on the specific terrain.
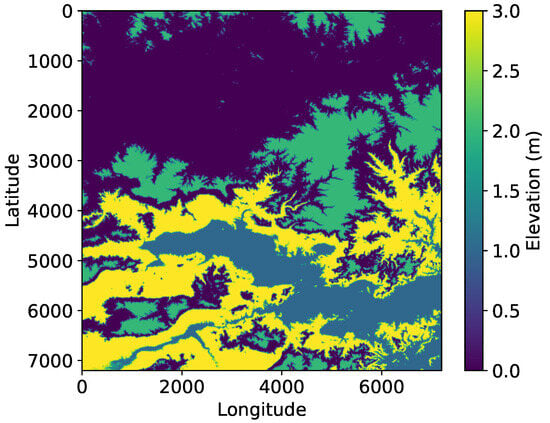
Figure 7.
Mountain peaks clustering.
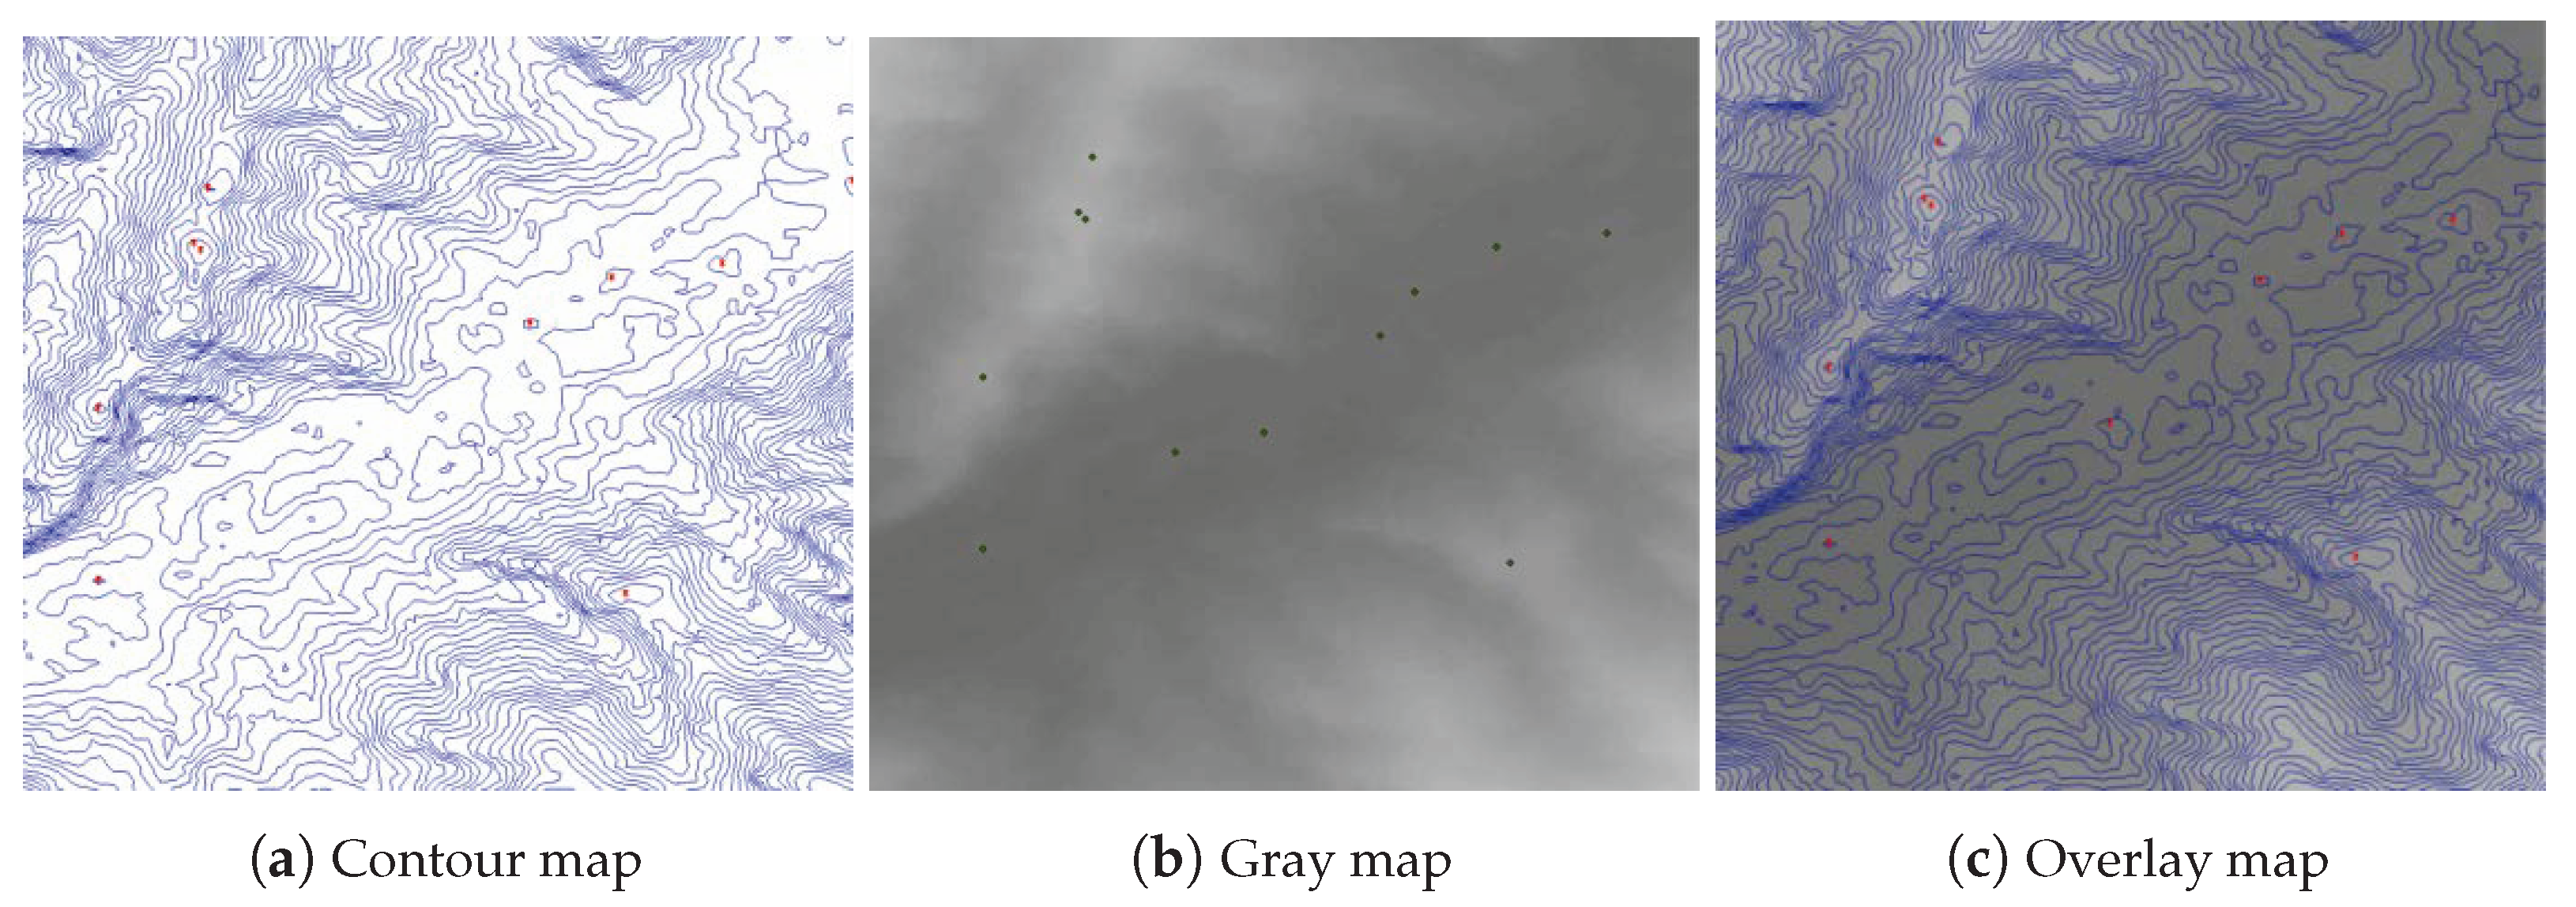
In the preliminary data processing stage, the DEM mountain peak data used in this study are derived by combining the contour lines of Chongli District with the grayscale image. To validate the effectiveness and rationality of this approach, the recognition results for mountain peaks under different conditions were compared. Figure 8a presents the mountain peak recognition results using the contour map, while Figure 8b shows the peak recognition results from the grayscale map. Figure 8c depicts the recognition results after superimposing the contour and grayscale maps. In these figures, the black boxes represent areas of omission, and the red boxes indicate areas of misrepresentation.
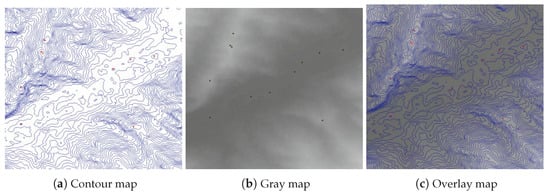
Figure 8.
Recognition results of mountain vertices under different conditions.
The grayscale map displays the topographic elevation extracted from the DEM data. The inset grayscale legend in the figure indicates the elevation ranges for different shades of gray, with darker shades representing lower elevations and lighter shades indicating higher elevations. In Figure 8a, there is noticeable omission of peak information when comparing the contour map results with the results after fusion. In Figure 8b, the peak information obtained from the grayscale map also shows a misrepresentation compared to the fused results.
The contour topographic map mainly reflects the shape of the terrain, while the grayscale map conveys the trend of elevation change. Relying solely on either the grayscale map or the contour map complicates the extraction of mountain peak shapes, making it difficult to accurately define the target area for the anchor frame. This results in both omissions and misidentifications. However, by combining the grayscale map of Chongli District with contour line data, the efficiency of mountain peak extraction can be significantly improved.
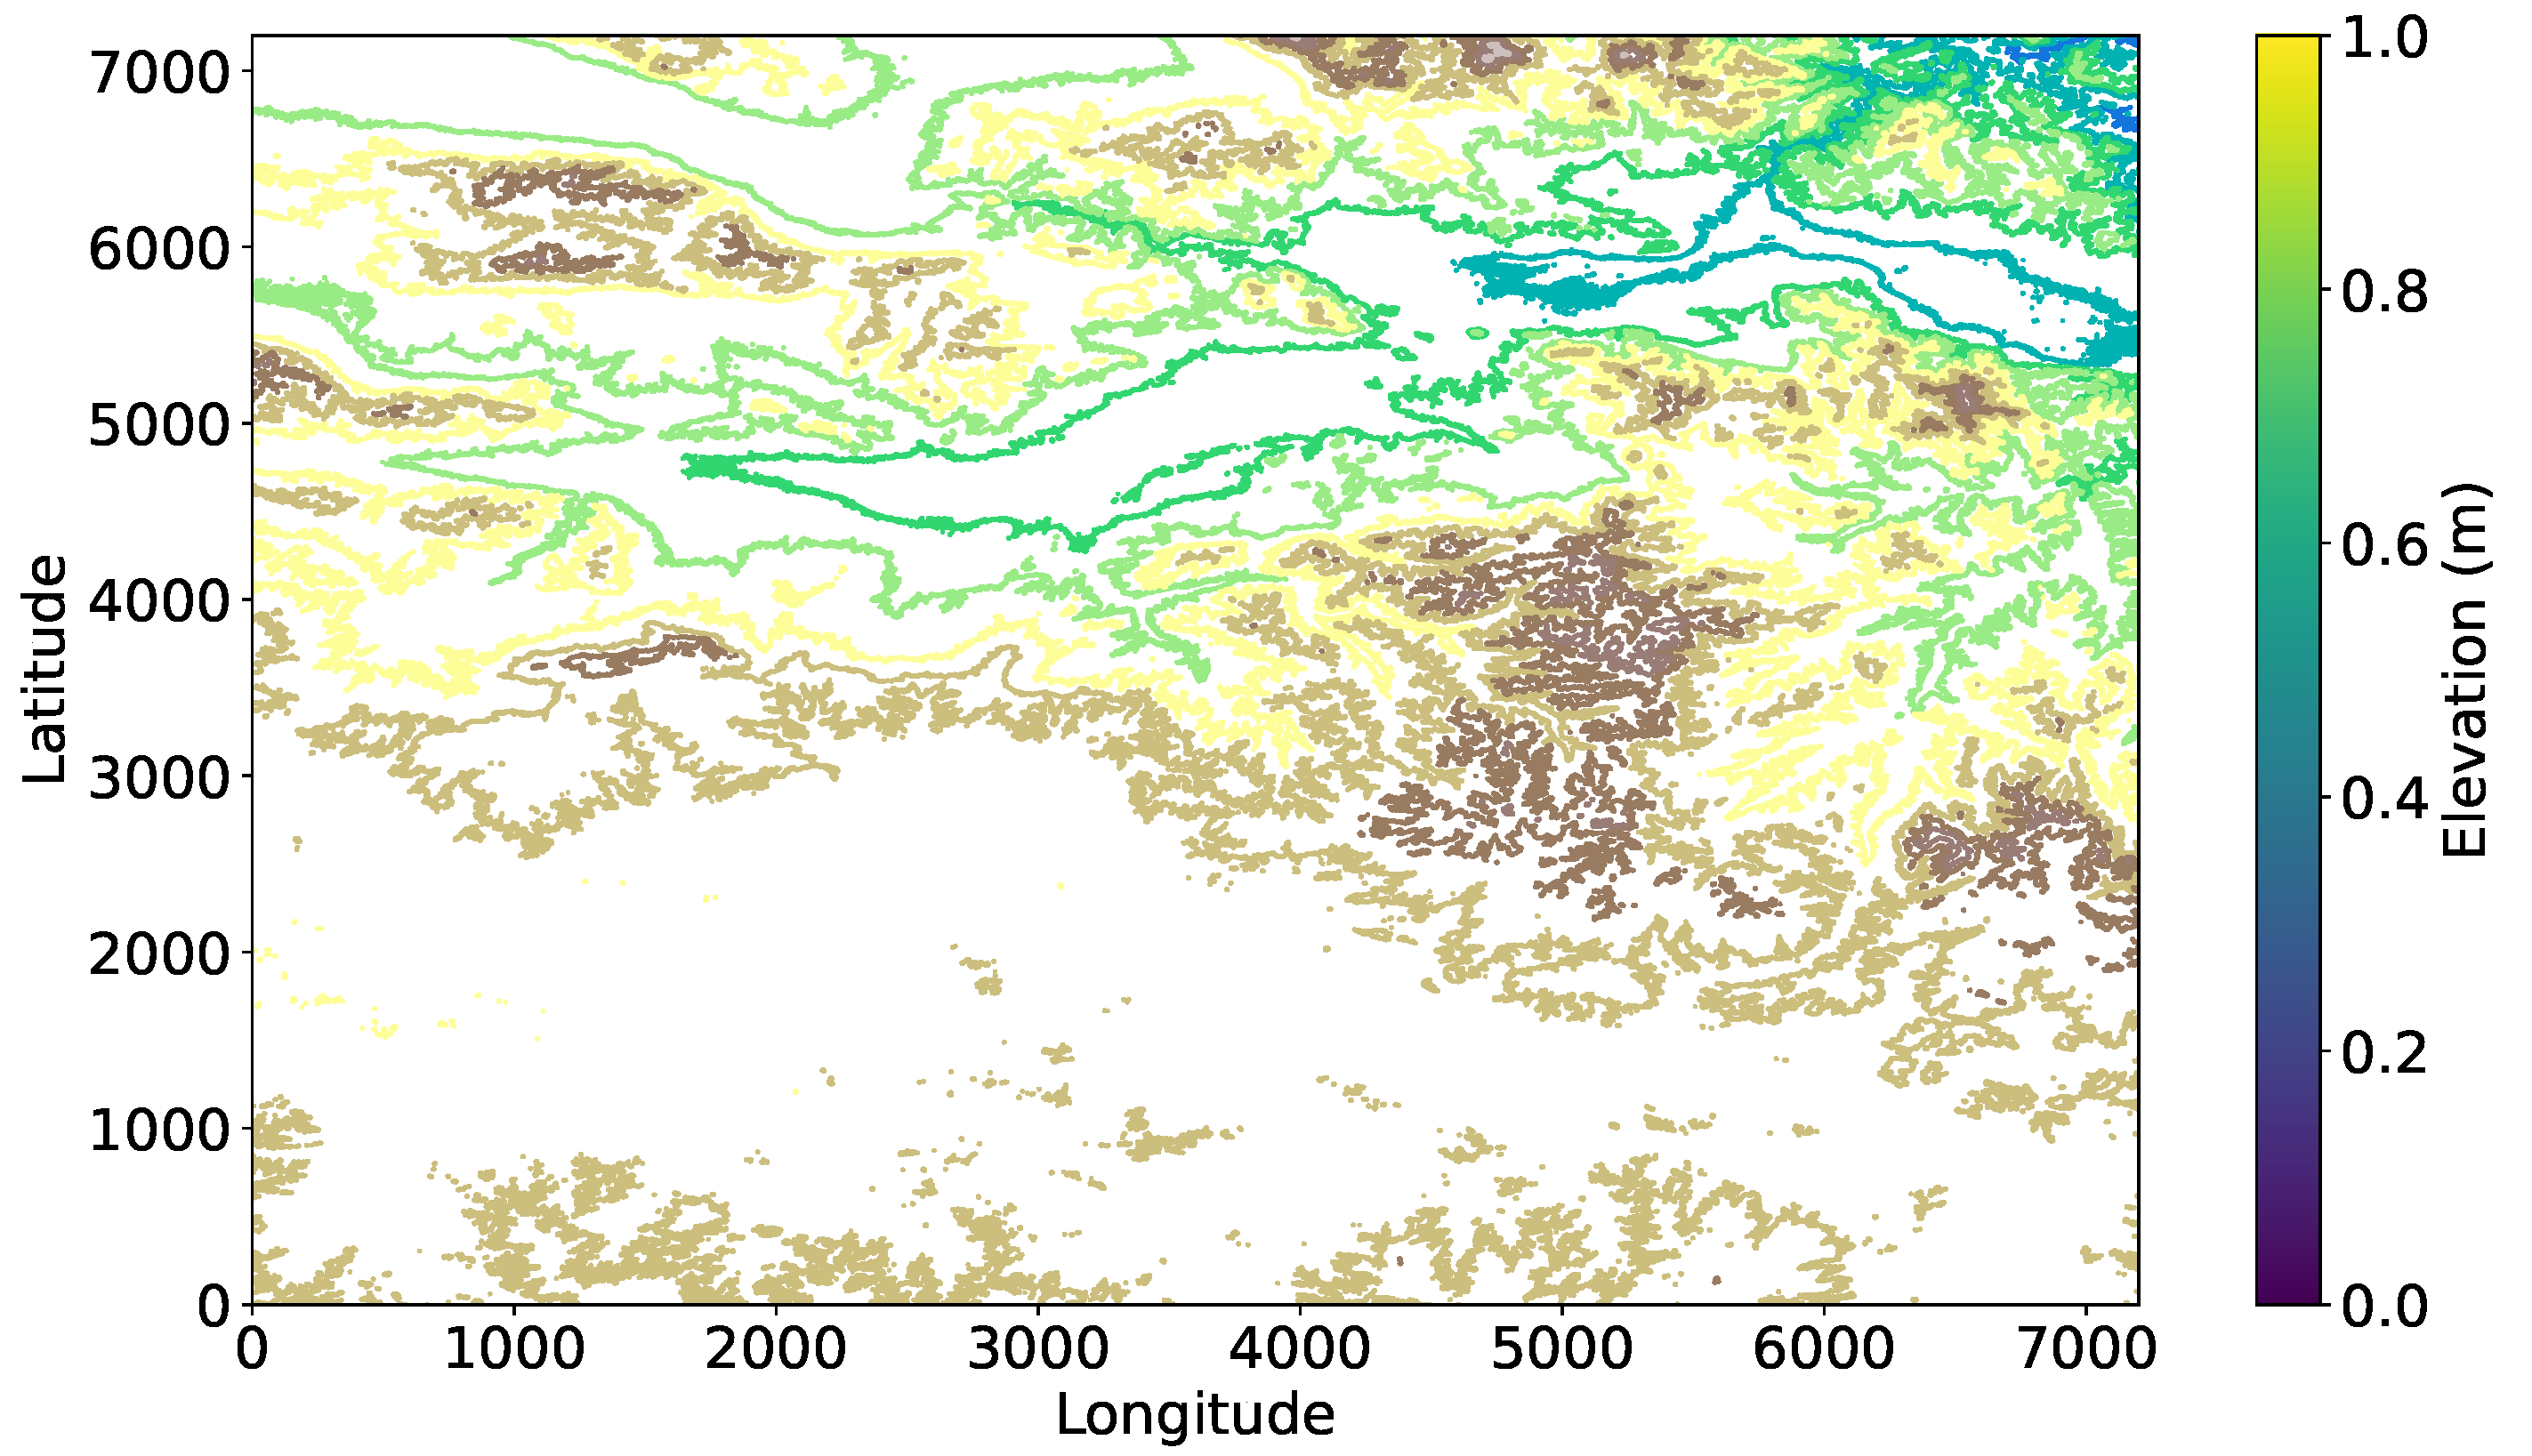
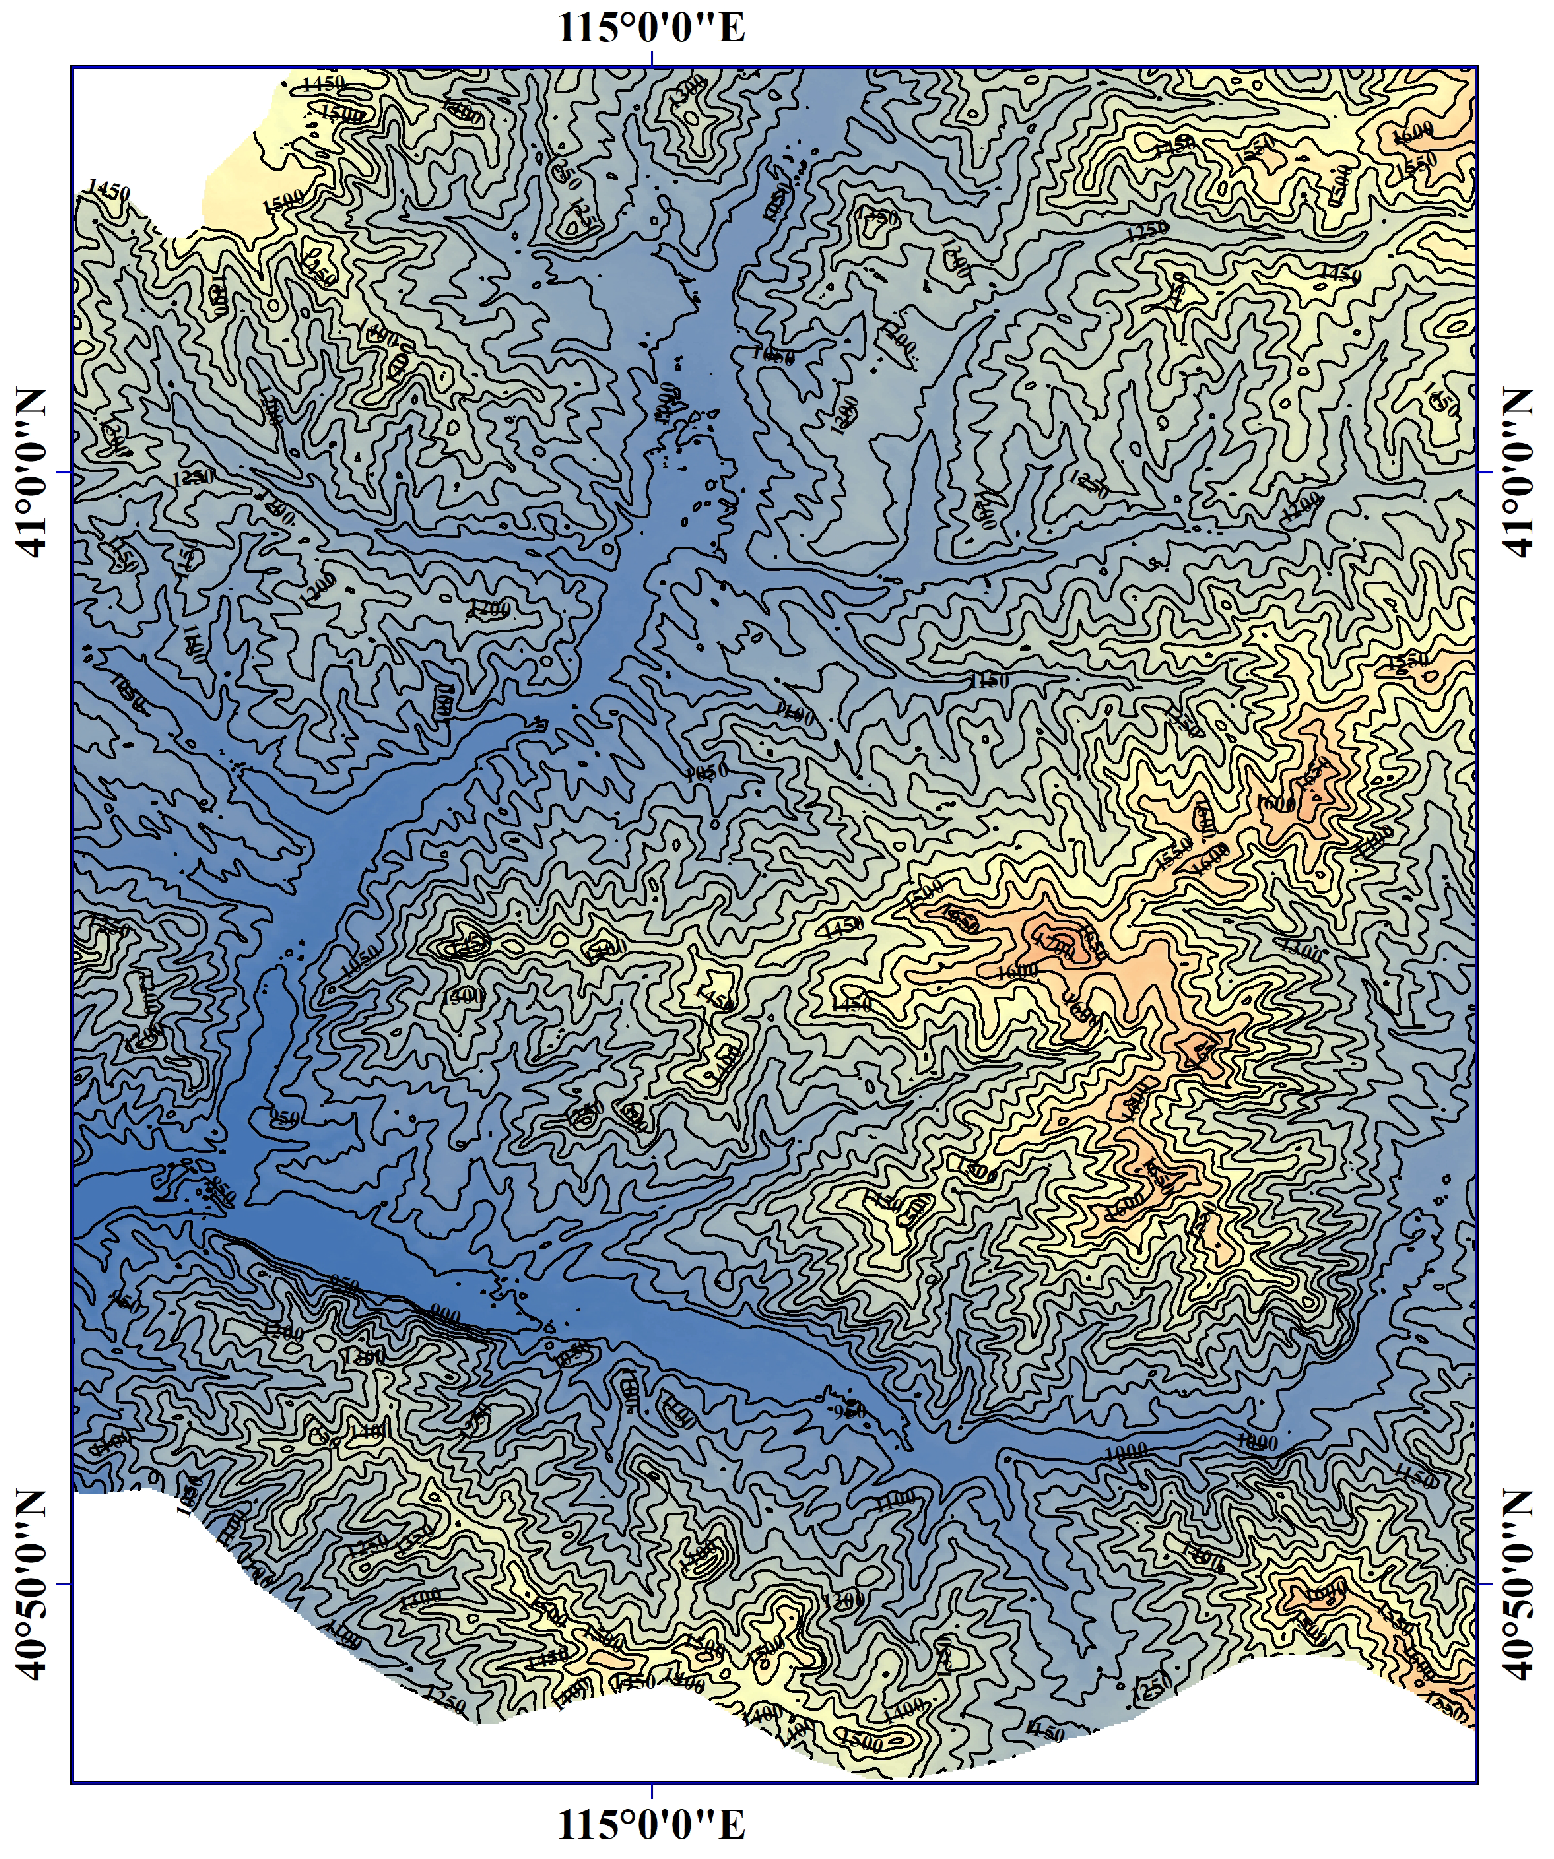
Figure 9 plot visualizes DEM data, where contours represent different elevation levels across the terrain. The plot uses a color map with the ’terrain’ theme, and labels are added to the contours with a black font for clarity. The font size and position of the labels are adjusted for better readability. The plot also features a colorbar that indicates elevation in meters, with custom font sizes for the colorbar label and tick marks. In addition, the plot includes the labeled x and y axes for longitude and latitude, respectively, with adjusted font sizes for better legibility. The axis tick sizes are also customized, and the layout is fine-tuned to ensure adequate spacing around the plot. The overall figure is presented in a clear and visually appealing manner with improved readability of the labels and tick marks.
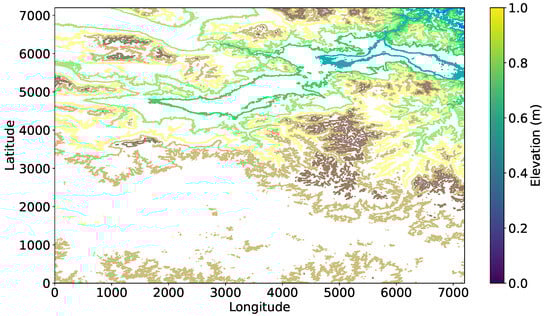
Figure 9.
Contour map of DEM.
Before the water system extraction experiment, the sample needs to be preprocessed. Due to the challenges associated with sample labeling in supervised learning, the images in this study are labeled using the LabelImg tool. The labeling results are shown in Figure 10. Based on the characteristics of the water systems, we categorize them into curved rivers and straight rivers. Additionally, rivers are classified by their width. For wide channels, the labeled samples include 1320 instances of curved rivers (CC), 1520 instances of straight rivers (SC), 645 instances of narrow channels (FC), and 525 instances of wide channels (WC).
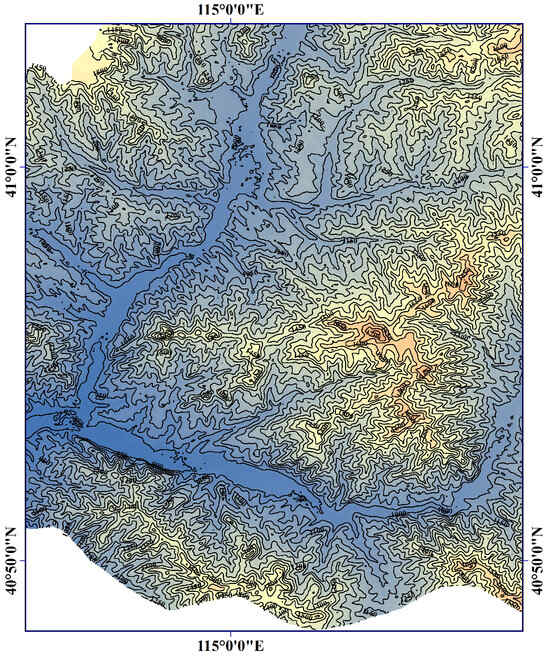
Figure 10.
River identification: blue (wide channels); green (narrow channels); red (straight rivers); yellow (curved rivers).
4.3. Experiment Result
This study was conducted in the Keras deep learning development environment, using the self-constructed PEAK-100 dataset for network training. The model’s initial learning rate was set to 0.002, the momentum to 0.8, and the number of iterations to 10,000. The initial anchor frame size parameters were determined using the K-means clustering algorithm, which was applied to the labeled frames in the training samples that correspond to mountain peaks. The width and height of the anchor frames were calculated based on the coordinates of the top left and bottom right corners of the labeled frames within the mountain peak regions, which serve as clustering data samples. Based on the results of the clustering analysis, the coordinates corresponding to the cluster centers were used to define the initial sizes of the Faster R-CNN network’s anchor frames.
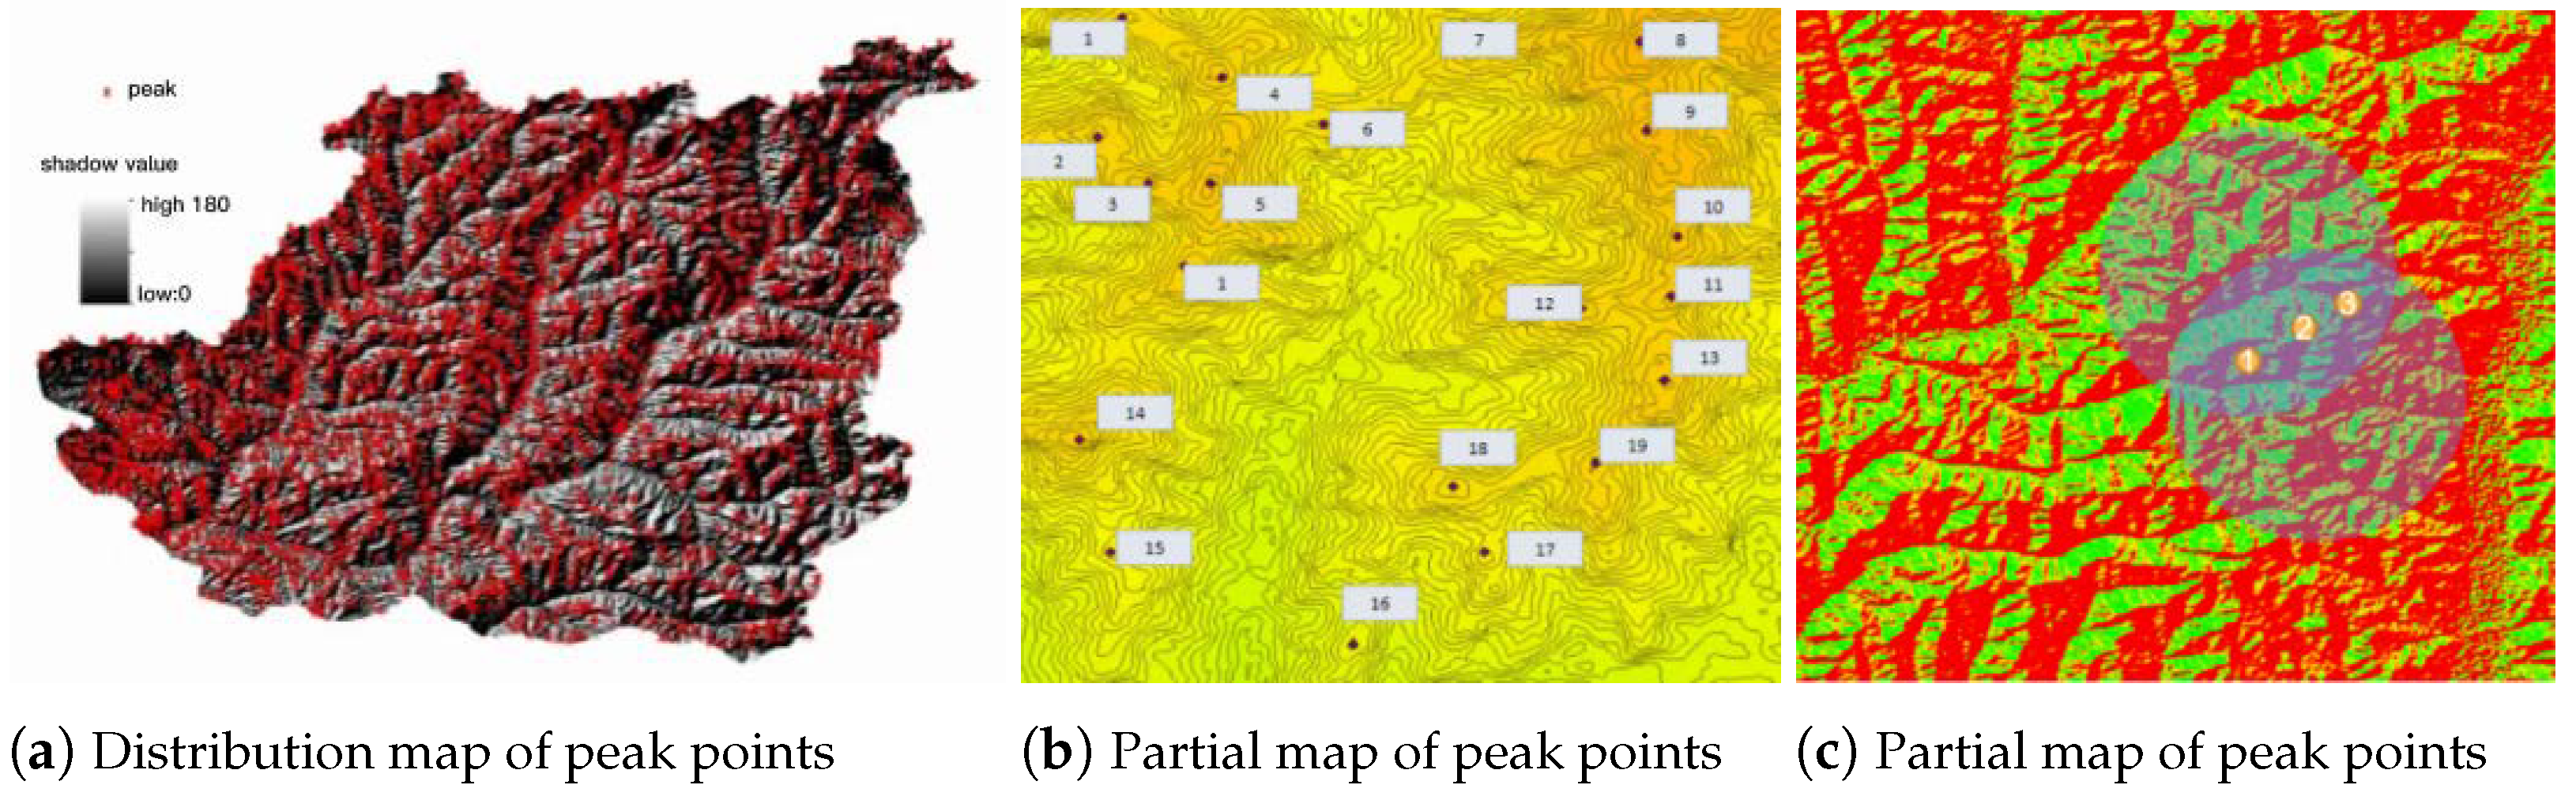
The calculated aspect ratios of the anchor boxes were: (42.85,70.65), (65.45,83.67), (92.54,123.52), (132.45,194.85), (42.85,70.65), (65.45,83.67), (92.54,123.52), (132.45,194.85), (42.85,70.65), (65.45,83.67), (92.54,123.52), (132.45,194.85), which replaced the original anchor box parameters for each The experiment yielded 2792 mountain peaks, as shown in Figure 11a. From the enlarged sections in Figure 11b,c, it is evident that the identified mountain peaks align well with the terrain of Chongli District, providing valuable data for further geomorphological research in the area. The peaks in Chongli District were classified and counted according to their geomorphic types and peak classifications.
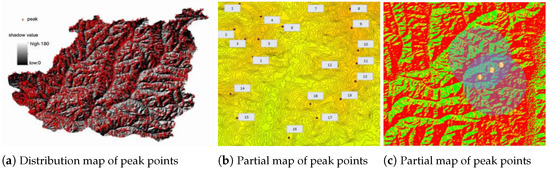
Figure 11.
Recognition results of mountain vertices under different conditions.
Figure 12 presents a bar chart that illustrates the distribution of peak points across three different geomorphic mountain types: Hill, Low, and High. The x-axis categorizes the geomorphic types, while the y-axis represents the number of peak points corresponding to each type. The chart highlights that the “Low” mountain type has the highest count of peak points, with 1659, followed by the “Hill” type with 1047, and the “High” type, which has the fewest at 86. This visual representation facilitates an easy comparison of the peak point distribution in the defined mountain categories. The axis labels and the overall figure have been set with larger font sizes for better readability.
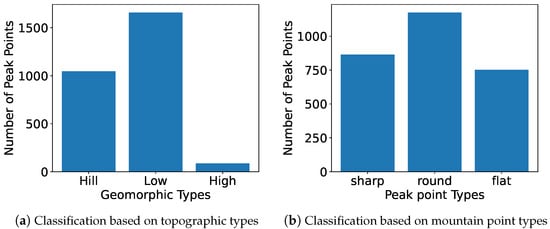
Figure 12.
The peaks in Chongli District are classified and counted according to the geomorphic types and peak types in Chongli District.
4.4. Fire Risk Assessment Through Mountain Peak and Water System
Our study is based on DEM data, combined with the ResNet-101 and Faster R-CNN deep learning algorithms, to assess the forest fire risk in the Chongli District. As shown in Figure 13, by normalizing the DEM data and converting the elevation values to a range of 0–1, we have achieved a five-level classification of fire risk in the study area. According to the mathematical model analysis proposed in Section 3.1, there is a positive correlation between terrain elevation and fire risk, with higher altitude areas generally exhibiting higher fire risk levels.
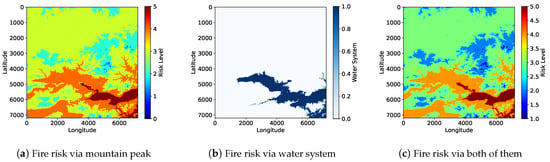
Figure 13.
Fire risk assessment through mountain peak and water system.
In terms of visualization, the risk map is rendered using a heatmap spectrum: high-risk areas are presented in shades of red, medium-risk areas transition to yellow, and low-risk areas are marked with blue-green hues. Our study employs a deep learning framework combining ResNet-101 and Faster R-CNN to achieve intelligent recognition of terrain features. The precise extraction of peak features is of particular significance, as higher altitude areas usually have steeper slopes and drier environments, which can accelerate the spread of fire. By accurately identifying these peak locations, we can pinpoint the areas where fire spreads rapidly, providing a precise target for the allocation of fire prevention resources.
Regarding hydrological feature analysis, the vector boundaries generated by Faster R-CNN have enabled dynamic coupling between hydrological elements and fire prediction. Rivers and other water bodies can form effective natural firebreaks and provide water support for firefighting efforts. In the code, hydrological areas correspond to lower-risk zones, which are at lower altitudes and are, therefore, less likely to experience fire spread. The bounding boxes generated by Faster R-CNN accurately delineate the spatial locations of rivers and other hydrological features, and this data is integrated into the heatmap spectrum to predict potential barriers to fire spread.
In the field of fire risk assessment, our model demonstrates exceptional performance in extracting terrain features. Compared to traditional methods that rely on manual feature extraction, it can provide detailed and accurate terrain analysis, offering more reliable input data for fire behavior prediction. Additionally, our model is capable of dynamically integrating terrain features into fire behavior prediction, enhancing the overall dynamism of the model and significantly improving the accuracy of fire spread direction and risk level prediction. The relationship between peaks (high-risk areas) and hydrological features (low-risk areas) is crucial for the management of forest fire risks. Mountainous regions, characterized by rugged terrain and low accessibility, often face higher fire risks. In contrast, water bodies provide natural protection that can slow down the spread of fire. Understanding this relationship helps prioritize fire prevention efforts and ensure the strategic allocation of firefighting resources. By focusing on high-risk mountainous areas and effectively utilizing nearby water bodies for control, our model provides more reliable data input for fire risk assessment.
4.5. Model Evaluation
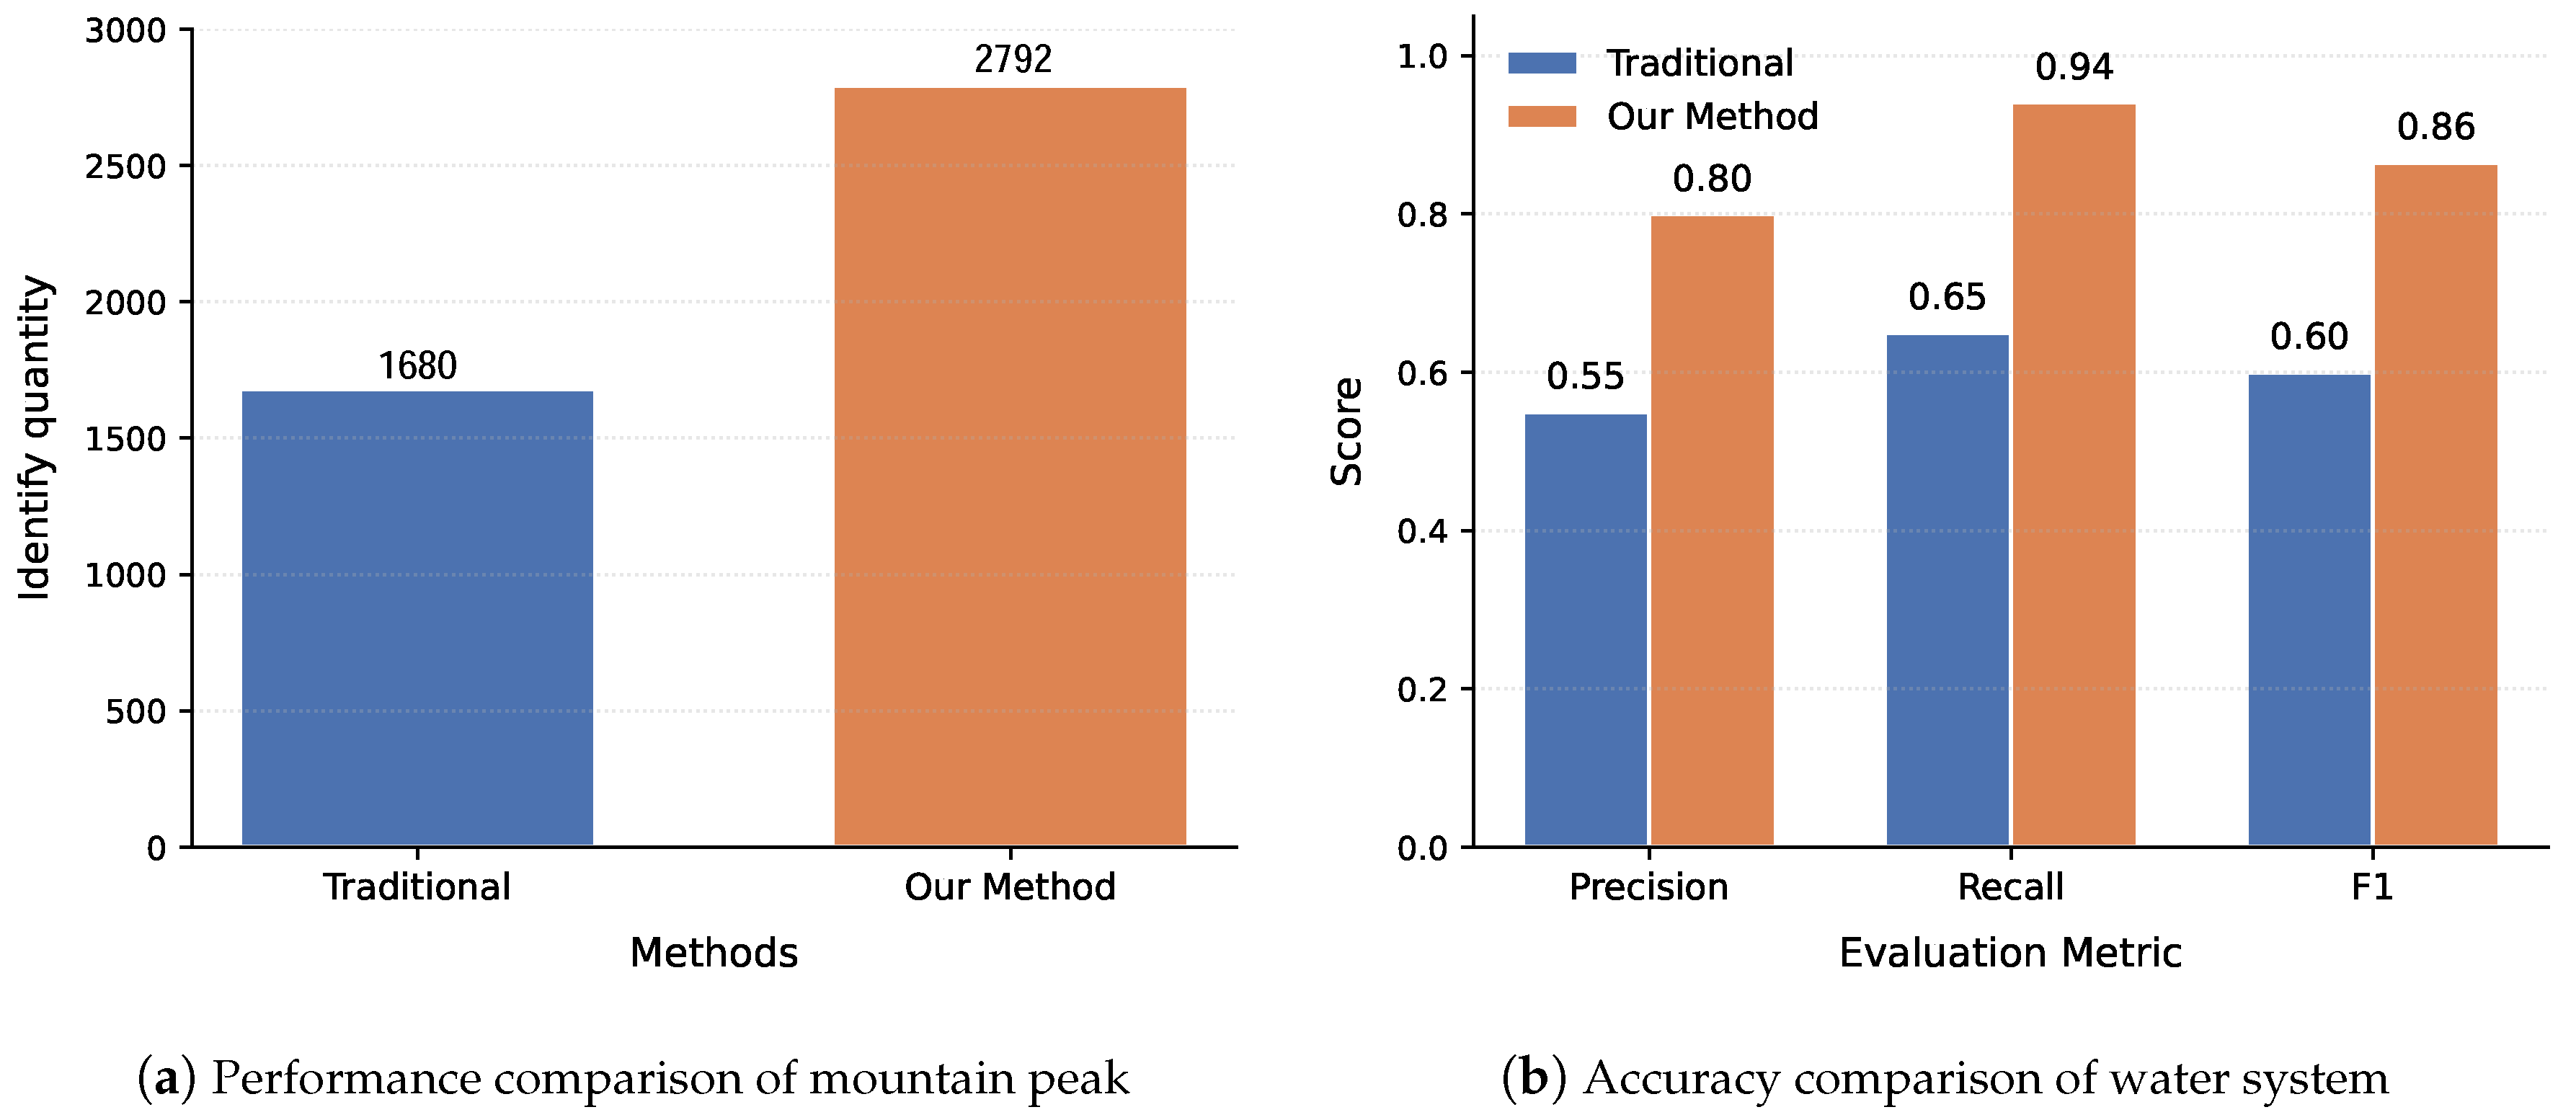
In terms of terrain recognition, as shown in Figure 14a, we compared the number of peaks identified using the traditional manual feature extraction method with those identified by the proposed approach integrating DEM and deep learning techniques. Experimental data show that the traditional method detected a total of 1680 peaks, while the improved new method identified 2792 peaks, achieving a 66% increase in recognition rate. The accuracy of terrain recognition significantly enhances the model’s subsequent fire prediction, with improvements evident in three key aspects: first, in terms of recognition quantity, our method demonstrates a more comprehensive ability to capture topographic features, thereby refining the input parameters for wildfire spread models. Second, in complex mountainous terrains, our approach exhibits stronger adaptability, ensuring the reliability of predictive models across diverse landform conditions. Lastly, the method substantially improves the efficiency of topographic feature extraction, making large-scale regional fire risk assessments feasible. These advancements provide critical support for establishing high-precision forest fire early warning systems, particularly in key fire-prone areas with complex terrain. Our method enables more accurate identification of potential fire hazards and fire spread pathways, significantly enhancing the timeliness and precision of preventive firefighting measures.

Figure 14.
Evaluation metrics for mountain points and water systems.
Figure 14b compares the accuracy of traditional manual feature extraction methods with our proposed deep learning-based approach in water system extraction. Experimental results demonstrate that our method significantly outperforms traditional approaches across three key metrics: precision increased from 0.55 to 0.8, recall improved from 0.65 to 0.94, and the comprehensive F1 Score jumped from 0.6 to 0.86. This enhanced water system extraction capability directly translates to more precise fire risk assessment—complete drainage network data supports more scientific firebreak planning, accurate water body locations optimize firefighting water resource allocation, while comprehensive hydrological feature identification helps predict fire spread patterns under different humidity conditions. These advancements provide crucial technical support for subsequent forest fire prevention decision-making.
Table 3 presents a comparative analysis of recent studies related to fire risk assessment and terrain feature extraction. The table highlights the methods employed, study areas, targeted features, key advantages, and innovative aspects of each approach. Compared to traditional methods such as numerical modeling or basic neural networks, our proposed framework demonstrates a significant improvement in peak detection accuracy and extraction efficiency. By integrating deep learning techniques (Faster R-CNN and ResNet-101) with high-resolution DEM data and introducing an adaptive anchor box optimization strategy, our method achieves superior performance in complex mountainous environments like Chongli District. This innovation offers a scalable and more precise solution for fire risk modeling in forested regions.
Table 3.
Comparison of related works.
5. Discussion
This study explores the integration of DEMs and deep learning techniques to enhance fire risk assessment in the Chongli District, focusing on the extraction of mountain peaks and water systems. Our results demonstrate the potential of this hybrid approach in accurately identifying critical terrain features that influence fire behavior and risk mitigation strategies. The integration of DEM data with deep learning algorithms significantly improved the accuracy of both mountain peak and water system extraction [49,50]. The high-resolution DEMs provided detailed topographical information, allowing the model to distinguish subtle variations in the landscape [51,52]. The deep learning model, trained with large datasets of both topographical and remotely sensed features, was able to autonomously classify terrain features with high precision, offering a more efficient alternative to traditional manual feature extraction extraction [53].
The mountain peaks, as critical topographical features, were essential for understanding the flow of air and the potential spread of wildfires in the mountainous regions of Chongli [54,55]. By accurately mapping these peaks, we could assess the accessibility of certain regions for fire response teams and evaluate potential wildfire pathways influenced by elevation and slope. Furthermore, the extraction of water systems was pivotal in identifying natural barriers, such as rivers and lakes, which could act as firebreaks or sources of water for firefighting operations [56,57,58].
Our study adopts a scheme that combines DEM with deep learning technology, mainly based on a comprehensive consideration of data availability and algorithm performance. In terms of data, although other methods such as LiDAR have higher measurement accuracy, their limited spatiotemporal coverage and high costs make it difficult to meet the research needs of large-scale areas. In contrast, ASTER GDEM and SRTM data achieve the best balance between spatial resolution (30 m), global coverage, and cost-effectiveness. On the algorithm side, traditional methods such as field surveys and manual data interpretation [59,60,61] have inherent drawbacks, including strong subjectivity and difficulty with adapting to complex terrain variations. To address these issues, we innovatively developed a deep learning framework that combines a summit feature extraction module based on ResNet-101 (implemented in Keras) with a Faster R-CNN hydrological network recognition module. The evaluation results show that this framework has increased the detection accuracy of summit points by 66%, and the F1 score for hydrological network detection has significantly improved from the baseline method’s 0.6 to 0.86, fully demonstrating the technical advantages of deep learning in regional-scale terrain analysis [62,63,64]. Moreover, our approach integrates topography and hydrology, providing a more comprehensive understanding of the environmental factors that influence fire risk. The combination of DEM data and deep learning models represents a paradigm shift in fire risk analysis, allowing for faster, more scalable, and more accurate ground analysis [65,66]. This study establishes a scalable intelligent analysis framework, providing a new technological paradigm for global geographical feature recognition research.
The enhanced ability to extract mountain peaks and water systems from DEMs has significant implications for fire risk assessment in forested regions. Our model offers a tool for predicting wildfire behavior and guiding resource allocation for fire management. By identifying areas with steep slopes or limited water access, authorities can prioritize fire prevention measures or deploy firefighting resources more effectively. Furthermore, the use of deep learning facilitates the real-time processing of new DEM data, enabling dynamic risk assessments that account for changes in the terrain, such as those caused by seasonal shifts or extreme weather events [67,68]. From a macro perspective, our method proposed in this study performs well in supporting the Sustainable Development Goals (SDGs), especially in high-precision monitoring and integrated assessment. Lee et al. [69] discussed how to advance the 2030 Agenda through SDG indicators, highlighting the link between violence prevention and sustainable development. Varotsos and Cracknell [70] analyzed the contributions of remote sensing to the SDGs, particularly in environmental monitoring and climate change. These studies have laid a solid theoretical and practical foundation for our work. Our research builds on this by using remote sensing and Earth observation to provide valuable data for monitoring and mitigating climate change impacts, in line with SDG 13. This highlights the significant role of our methods in promoting sustainable development.
6. Conclusions
For mountain top extraction, this article aims to address the difficulties in manual selection and the limitations of software processing in traditional mountain top extraction and recognition methods. Taking the mountain top elements in DEM as the research object, combined with deep learning technology, a method based on volume is designed. A method for hilltop identification with a product neural network. By transforming the DEM data into a superimposed form of contour map and grayscale image, ResNet-101 is selected to automatically extract the depth features of the mountain top, to realize the automatic identification of the noisy area on the top of the mountain in Chongli District. The experimental results show that this method effectively avoids the influence of manual selection and processing software on the peak element extraction area, improves the recognition accuracy of the peak, and provides a new technical approach for the extraction of the peak. Due to the limited amount of data in the sample set at the top of the mountain, there will still be errors and omissions in the extraction results. In order to improve the data support of the deep learning model, the DEM terrain sample size can be expanded by increasing data amplification and other methods.
For the extraction of water systems, the integrated method based on Faster R-CNN, CNN and morphology proposed in our study can effectively search and locate water systems for data collected through digital elevation and can accurately determine the type of rivers based on their shape and calculate their width. The test results show that the work efficiency of this method is much higher than that of the traditional morphological method. Although the missed detection rate of this method is relatively low, the false detection rate is high. To solve this problem, our study introduces a method through The F1 score index is introduced, and the corresponding water system pixel area and confidence threshold are determined according to the maximum value of the F1 score to reduce the false detection rate, to adapt to the diverse application scenarios of the water system. Various target monitoring methods emerge. Due to the diversity of water system identification requirements, it is difficult to use a single algorithm to solve the problem. Some advanced algorithms of Faster R-CNN, such as Mask R-CNN, have remarkable effects in accurate identification of water systems and display effects. In the future, they can be combined with algorithms such as CNN to improve the effect of water system identification.
In conclusion, our study successfully integrates DEM with deep learning techniques to extract terrain features of mountain peaks and water systems, demonstrating significant potential for fire risk assessment in forested regions. The accurate extraction of these features from DEMs is crucial for the assessment of fire risk and the prediction of fire behavior. Mountain peaks, as key topographical features, influence air flow and potential wildfire spread paths, while water systems act as natural barriers or sources of water for firefighting. Our study significantly advances fire risk assessment by introducing a hybrid framework that combines DEMs with deep learning, automating terrain analysis and overcoming the limitations of traditional manual feature extraction methods. Our key innovations include the automated extraction of mountain peaks and water systems, terrain-adaptive anchor box clustering, and the seamless integration with fire behavior equations. These advancements not only enhance the accuracy and efficiency of fire risk assessment but also offer a scalable template that can be applied to other mountainous forest regions.
Our study made great strides in using deep learning to extract terrain features, but there are some limits we need to discuss. First, the DEM data we used had a certain level of detail, and higher resolution data could show even more complex terrain features, especially in areas with lots of undulation. Second, our study used specific datasets for training and checking, which might not show all the different terrain features found in different places. This could affect how well our model works in other regions. Also, how well our deep learning models work might change when used with other datasets or in different conditions. More testing and adjusting might be needed to make sure the models can accurately extract terrain features in many different environments. Even with these limits, our research lays a strong foundation for future studies. Using higher-resolution data, more diverse datasets, and keeping our models improving will be key to making deep learning better at extracting terrain features.
Author Contributions
Writing-original draft preparation, Y.W.; writing-review and editing, Y.W.; conceptualization, X.S.; investigation, L.Q.; validation, J.X.; methodology D.G.; resources, Z.Z. All authors have read and agreed to the published version of the manuscript.
Funding
This research was funded by the Frontier Technologies R&D Program of Jiangsu grant number BF2024060.
Data Availability Statement
The data underlying the results presented in this paper is not publicly available at this time but may be obtained from the authors upon reasonable request.
Conflicts of Interest
The authors declare no conflict of interest.
References
- Mori, A.S.; Lertzman, K.P.; Gustafsson, L. Biodiversity and ecosystem services in forest ecosystems: A research agenda for applied forest ecology. J. Appl. Ecol. 2017, 54, 12–27. [Google Scholar] [CrossRef]
- Savita, S. The Impact of Deforestation on Global Climate Change Patterns. Shodh Prakashan J. Environ. Sci. Stud. 2025, 1, 12–31. [Google Scholar]
- Boubekraoui, H.; Maouni, Y.; Ghallab, A.; Draoui, M.; Maouni, A. Wildfires risk assessment using hotspot analysis and results application to wildfires strategic response in the region of Tangier-Tetouan-Al Hoceima, Morocco. Fire 2023, 6, 314. [Google Scholar] [CrossRef]
- Zou, Y.; Sadeghi, M.; Liu, Y.; Puchko, A.; Le, S.; Chen, Y.; Andela, N.; Gentine, P. Attention-based wildland fire spread modeling using fire-tracking satellite observations. Fire 2023, 6, 289. [Google Scholar] [CrossRef]
- Naseer, R.; Chaudhary, M.N. Assessing forest fire likelihood and identification of fire risk zones using maximum entropy-based model in Khyber Pakhtunkhwa, Pakistan. Environ. Monit. Assess. 2025, 197, 281. [Google Scholar] [CrossRef]
- Sakellariou, S.; Sfougaris, A.; Christopoulou, O. Review of geoinformatics-based forest fire management tools for integrated fire analysis. Pol. J. Environ. Stud 2021, 30, 5423–5434. [Google Scholar] [CrossRef]
- Wooster, M.J.; Roberts, G.J.; Giglio, L.; Roy, D.P.; Freeborn, P.H.; Boschetti, L.; Justice, C.; Ichoku, C.; Schroeder, W.; Davies, D.; et al. Satellite remote sensing of active fires: History and current status, applications and future requirements. Remote Sens. Environ. 2021, 267, 112694. [Google Scholar] [CrossRef]
- Miliaresis, G.C.; Paraschou, C.V. Vertical accuracy of the SRTM DTED level 1 of Crete. Int. J. Appl. Earth Obs. Geoinf. 2005, 7, 49–59. [Google Scholar] [CrossRef]
- Kalantar, B.; Ueda, N.; Idrees, M.O.; Janizadeh, S.; Ahmadi, K.; Shabani, F. Forest fire susceptibility prediction based on machine learning models with resampling algorithms on remote sensing data. Remote Sens. 2020, 12, 3682. [Google Scholar] [CrossRef]
- Chen, R.; He, B.; Li, Y.; Fan, C.; Yin, J.; Zhang, H.; Zhang, Y. Estimation of potential wildfire behavior characteristics to assess wildfire danger in southwest China using deep learning schemes. J. Environ. Manag. 2024, 351, 120005. [Google Scholar] [CrossRef]
- Ruiz-Lendínez, J.J.; Ariza-López, F.J.; Reinoso-Gordo, J.F.; Ureña-Cámara, M.A.; Quesada-Real, F.J. Deep learning methods applied to digital elevation models: State of the art. Geocarto Int. 2023, 38, 2252389. [Google Scholar] [CrossRef]
- Li, B.; Pan, B.; Han, J. Basic terrestrial geomorphological types in China and their circumscriptions. Quat. Sci. 2008, 28, 535–543. [Google Scholar]
- Tribe, A. Automated recognition of valley heads from digital elevation models. Earth Surf. Process. Landforms 1991, 16, 33–49. [Google Scholar] [CrossRef]
- Garbrecht, J.; Martz, L.W. Digital elevation model issues in water resources modeling. In Hydrologic and Hydraulic Modeling Support with Geographic Information Systems; ESRI Press: Redlands, CA, USA, 2000; Volume 1–28. [Google Scholar]
- Starks, P.J.; Garbreach, J.D.; Schiebe, F.R.; Salisbury, J.M.; Waits, D.A. Selection, development, and use of GIS coverages for the Little Washita River research watershed. In GIS for Water Resources and Watershed Management; Taylor & Francis: Abingdon, UK, 2003; pp. 69–75. [Google Scholar]
- Miao, X.; Li, J.; Mu, Y.; He, C.; Ma, Y.; Chen, J.; Wei, W.; Gao, D. Time Series Forest Fire Prediction Based on Improved Transformer. Forests 2023, 14, 1596. [Google Scholar] [CrossRef]
- Luo, W.; Gan, S.; Yuan, X.; Gao, S. Extraction and analysis of microgeomorphic features in the southern margin of Dinosaur Valley. Surv. Mapp. Bull. 2021, 8, 48–54. [Google Scholar]
- Chowdhury, M.S. Modelling hydrological factors from DEM using GIS. MethodsX 2023, 10, 102062. [Google Scholar] [CrossRef]
- Sofia, G. Combining geomorphometry, feature extraction techniques and Earth-surface processes research: The way forward. Geomorphology 2020, 355, 107055. [Google Scholar] [CrossRef]
- James, L.A.; Hodgson, M.E.; Ghoshal, S.; Latiolais, M.M. Geomorphic change detection using historic maps and DEM differencing: The temporal dimension of geospatial analysis. Geomorphology 2012, 137, 181–198. [Google Scholar] [CrossRef]
- Gite, K.R.; Gupta, P. Taylor Shepherd Golden Optimization-Enabled ResUNet for Forest Change Detection Using Satellite Images. Int. J. Image Graph. 2024, 24, 2550068. [Google Scholar] [CrossRef]
- Caffaratti, G.D.; Marchetta, M.G.; Euillades, L.D.; Euillades, P.A.; Forradellas, R.Q. Improving forest detection with machine learning in remote sensing data. Remote Sens. Appl. Soc. Environ. 2021, 24, 100654. [Google Scholar] [CrossRef]
- Han, W.; Zhang, X.; Wang, Y.; Wang, L.; Huang, X.; Li, J.; Wang, S.; Chen, W.; Li, X.; Feng, R.; et al. A survey of machine learning and deep learning in remote sensing of geological environment: Challenges, advances, and opportunities. ISPRS J. Photogramm. Remote Sens. 2023, 202, 87–113. [Google Scholar] [CrossRef]
- Yun, T.; Li, J.; Ma, L.; Zhou, J.; Wang, R.; Eichhorn, M.P.; Zhang, H. Status, advancements and prospects of deep learning methods applied in forest studies. Int. J. Appl. Earth Obs. Geoinf. 2024, 131, 103938. [Google Scholar] [CrossRef]
- Hamdi, Z.M.; Brandmeier, M.; Straub, C. Forest damage assessment using deep learning on high resolution remote sensing data. Remote Sens. 2019, 11, 1976. [Google Scholar] [CrossRef]
- Hamedianfar, A.; Mohamedou, C.; Kangas, A.; Vauhkonen, J. Deep learning for forest inventory and planning: A critical review on the remote sensing approaches so far and prospects for further applications. Forestry 2022, 95, 451–465. [Google Scholar] [CrossRef]
- Liao, J.; Guo, L.; Jiang, L.; Yu, C.; Liang, W.; Li, K.; Pop, F. A Machine Learning-based Feature Extraction Method for Image Classification using ResNet Architecture. Digit. Signal Process. 2025, 160, 105036. [Google Scholar] [CrossRef]
- Jiao, W.; Tang, R.; Zhou, W. Delay-sensitive energy-efficient routing scheme for the Wireless Sensor Network with path-constrained mobile sink. Ad. Hoc. Netw. 2024, 158, 103479. [Google Scholar] [CrossRef]
- Li, Q.; Xue, Y. Total leaf area estimation based on the total grid area measured using mobile laser scanning. Comput. Electron. Agric. 2023, 204, 107503. [Google Scholar] [CrossRef]
- Li, Q.; Zhu, H. Performance evaluation of 2D LiDAR SLAM algorithms in simulated orchard environments. Comput. Electron. Agric. 2024, 221, 108994. [Google Scholar] [CrossRef]
- Chen, P.; Lu, P.; Liu, W.; Song, L. Automatic extraction of mountaintop points based on independent self-enclosed contour surfaces. Geospat. Inf. 2020, 18, 48–56. [Google Scholar]
- Li, J.; Wong, D.W. Effects of DEM sources on hydrologic applications. Comput. Environ. Urban Syst. 2010, 34, 251–261. [Google Scholar] [CrossRef]
- Varotsos, C.A.; Krapivin, V.F.; Mkrtchyan, F.A. A new passive microwave tool for operational forest fires detection: A case study of siberia in 2019. Remote Sens. 2020, 12, 835. [Google Scholar] [CrossRef]
- Han, M.; Enwright, N.M.; Gesch, D.B.; Stoker, J.M.; Danielson, J.J.; Amante, C.J. Assessing the vertical accuracy of digital elevation models by quality level and land cover. Remote Sens. Lett. 2024, 15, 667–677. [Google Scholar] [CrossRef]
- Kim, Y.; Kim, B.R.; Park, S. Synergistic use of multi-satellite remote sensing to detect forest fires: A case study in South Korea. Remote Sens. Lett. 2023, 14, 491–502. [Google Scholar] [CrossRef]
- Fu, Z.; Gong, A.; Wan, J.; Ba, W.; Wang, H.; Zhang, J. Forest fire risk assessment model optimized by stochastic average gradient descent. Ecol. Indic. 2025, 170, 113006. [Google Scholar] [CrossRef]
- Latocha, A. The geomorphological map as a tool for assessing human impact on landforms. J. Maps 2009, 5, 103–107. [Google Scholar] [CrossRef]
- Lee, J.; Shuai, Y.; Zhu, Q. Using images combined with DEM in classifying forest vegetations. In Proceedings of the 2004 IEEE International Geoscience and Remote Sensing Symposium, Anchorage, AK, USA, 20–24 September 2004; Volume 4, pp. 2362–2364. [Google Scholar]
- Shi, X.; Mao, D.; Song, K.; Xiang, H.; Li, S.; Wang, Z. Effects of landscape changes on water quality: A global meta-analysis. Water Research 2024, 260, 121946. [Google Scholar] [CrossRef]
- Kidner, D.B.; Rallings, P.J.; Ware, J.A. Parallel processing for terrain analysis in GIS: Visibility as a case study. GeoInformatica 1997, 1, 183–207. [Google Scholar] [CrossRef]
- Valarmathi, V.; Ramkumar, J. Modernizing Wildfire Management Through Deep Learning and IoT in Fire Ecology. In Machine Learning and Internet of Things in Fire Ecology; IGI Global Scientific Publishing: Hershey, PA, USA, 2025; pp. 203–230. [Google Scholar]
- Hu, J.; Luo, M.; Bai, L.; Duan, J.; Yu, B. An integrated algorithm for extracting terrain feature-point clusters based on DEM data. Remote Sens. 2022, 14, 2776. [Google Scholar] [CrossRef]
- Zheng, X.; Zhou, B.; Lei, H.; Jin, Y.; Su, Q. Mapping tidal flat topography using time-series Sentinel-2 images and ICESat-2 data: A case study in Cixi City. Ocean. Coast. Manag. 2024, 256, 107278. [Google Scholar] [CrossRef]
- Jia, G.; Wang, X.; Wei, H. An effective approach for selection of terrain modeling methods. IEEE Geosci. Remote Sens. Lett. 2013, 10, 875–879. [Google Scholar]
- Uuemaa, E.; Ahi, S.; Montibeller, B.; Muru, M.; Kmoch, A. Vertical accuracy of freely available global digital elevation models (ASTER, AW3D30, MERIT, TanDEM-X, SRTM, and NASADEM). Remote Sens. 2020, 1221, 3482. [Google Scholar] [CrossRef]
- Li, Y.; Fu, H.; Zhu, J.; Wu, K.; Yang, P.; Wang, L.; Gao, S. A method for SRTM DEM elevation error correction in forested areas using ICESat-2 data and vegetation classification data. Remote Sens. 2022, 14, 3380. [Google Scholar] [CrossRef]
- Abrams, M.; Crippen, R.; Fujisada, H. ASTER global digital elevation model (GDEM) and ASTER global water body dataset (ASTWBD). Remote Sens. 2020, 12, 1156. [Google Scholar] [CrossRef]
- Pham, H.T.; Marshall, L.; Johnson, F.; Sharma, A. A method for combining SRTM DEM and ASTER GDEM2 to improve topography estimation in regions without reference data. Remote Sens. Environ. 2018, 210, 229–241. [Google Scholar] [CrossRef]
- Vaze, J.; Teng, J.; Spencer, G. Impact of DEM accuracy and resolution on topographic indices. Environ. Model. Softw. 2010, 25, 1086–1098. [Google Scholar] [CrossRef]
- Callow, J.N.; Van Niel, K.P.; Boggs, G.S. How does modifying a DEM to reflect known hydrology affect subsequent terrain analysis? J. Hydrol. 2007, 332, 30–39. [Google Scholar] [CrossRef]
- Murphy, P.N.; Ogilvie, J.; Meng, F.R.; White, B.; Bhatti, J.S.; Arp, P.A. Modelling and mapping topographic variations in forest soils at high resolution: A case study. Ecol. Model. 2011, 222, 2314–2332. [Google Scholar] [CrossRef]
- Li, A.B.; Chen, Y.; Lu, G.N.; Zhu, A.X. Automatic detection of geological folds using attributed relational graphs and formal grammar. Comput. Geosci. 2019, 127, 75–84. [Google Scholar] [CrossRef]
- Ren, G.; Zhu, A.X.; Wang, W.; Xiao, W.; Huang, Y.; Li, G.; Li, D.; Zhu, J. A hierarchical approach coupled with coarse DEM information for improving the efficiency and accuracy of forest mapping over very rugged terrains. For. Ecol. Manag. 2009, 258, 26–34. [Google Scholar] [CrossRef]
- Povak, N.A.; Hessburg, P.F.; Salter, R.B. Evidence for scale-dependent topographic controls on wildfire spread. Ecosphere 2018, 9, e02443. [Google Scholar] [CrossRef]
- Purificação, C.; Santos, F.L.; Henkes, A.; Kartsios, S.; Couto, F.T. Fire-weather conditions during two fires in Southern Portugal: Meteorology, Orography, and Fuel Characteristics. Model. Earth Syst. Environ. 2025, 11, 1–17. [Google Scholar] [CrossRef]
- Thomas, G.; Rosalie, V.; Olivier, C.; Antonio, L.P. Modelling forest fire and firebreak scenarios in a mediterranean mountainous catchment: Impacts on sediment loads. J. Environ. Manag. 2021, 289, 112497. [Google Scholar] [CrossRef] [PubMed]
- Ortega, M.; Silva, F.R.Y.; Molina, J.R. Modeling fuel break effectiveness in southern Spain wildfires. Fire Ecol. 2024, 20, 40. [Google Scholar] [CrossRef]
- Naser, M.Z.; Kodur, V. Vulnerability of structures and infrastructure to wildfires: A perspective into assessment and mitigation strategies. Nat. Hazards 2025, 106, 1–21. [Google Scholar] [CrossRef]
- Finney, M.A. The challenge of quantitative risk analysis for wildland fire. For. Ecol. Manag. 2005, 211, 97–108. [Google Scholar] [CrossRef]
- Chuvieco, E.; Aguado, I.; Jurdao, S.; Pettinari, M.L.; Yebra, M.; Salas, J.; Hantson, S.; de la Riva, J.; Ibarra, P.; Rodrigues, M.; et al. Integrating geospatial information into fire risk assessment. Int. J. Wildland Fire 2012, 23, 606–619. [Google Scholar] [CrossRef]
- Miller, C.; Ager, A.A. A review of recent advances in risk analysis for wildfire management. Int. J. Wildland Fire 2012, 22, 1–14. [Google Scholar] [CrossRef]
- Lattimer, B.Y.; Hodges, J.L.; Lattimer, A.M. Using machine learning in physics-based simulation of fire. Fire Saf. J. 2020, 114, 102991. [Google Scholar] [CrossRef]
- Surya, L. Risk analysis model that uses machine learning to predict the likelihood of a fire occurring at a given property. Int. J. Creat. Res. Thoughts (IJCRT) 2017, 5, 2320–2882. [Google Scholar]
- Choi, M.Y.; Jun, S. Fire risk assessment models using statistical machine learning and optimized risk indexing. Appl. Sci. 2020, 10, 4199. [Google Scholar] [CrossRef]
- Brys, C.; La Red Martínez, D.L.; Marinelli, M. Machine learning methods for wildfire risk assessment. Earth Sci. Inform. 2025, 18, 1–24. [Google Scholar] [CrossRef]
- Jiang, W.; Qiao, Y.; Zheng, X.; Zhou, J.; Jiang, J.; Meng, Q.; Su, G.; Zhong, S.; Wang, F. Wildfire risk assessment using deep learning in Guangdong Province, China. Int. J. Appl. Earth Obs. Geoinf. 2024, 128, 103750. [Google Scholar] [CrossRef]
- Zandsalimi, Z.; Barbosa, S.A.; Alemazkoor, N.; Goodall, J.L.; Shafiee-Jood, M. Deep learning-based downscaling of global digital elevation models for enhanced urban flood modeling. J. Hydrol. 2025, 653, 132687. [Google Scholar] [CrossRef]
- Kladny, K.R.; Milanta, M.; Mraz, O.; Hufkens, K.; Stocker, B.D. Enhanced prediction of vegetation responses to extreme drought using deep learning and Earth observation data. Ecol. Inform. 2024, 80, 102474. [Google Scholar] [CrossRef]
- Lee, B.X.; Kjaerulf, F.; Turner, S.; Cohen, L.; Donnelly, P.D.; Muggah, R.; Davis, R.; Realini, A.; Kieselbach, B.; MacGregor, L.S.; et al. Transforming our world: Implementing the 2030 agenda through sustainable development goal indicators. J. Public Health Policy 2016, 37, 13–31. [Google Scholar] [CrossRef]
- Varotsos, C.A.; Cracknell, A.P. Remote Sensing Letters contribution to the success of the Sustainable Development Goals-UN 2030 agenda. Remote Sens. Lett. 2020, 11, 715–719. [Google Scholar] [CrossRef]


Disclaimer/Publisher’s Note: The statements, opinions and data contained in all publications are solely those of the individual author(s) and contributor(s) and not of MDPI and/or the editor(s). MDPI and/or the editor(s) disclaim responsibility for any injury to people or property resulting from any ideas, methods, instructions or products referred to in the content. |
© 2025 by the authors. Licensee MDPI, Basel, Switzerland. This article is an open access article distributed under the terms and conditions of the Creative Commons Attribution (CC BY) license (https://creativecommons.org/licenses/by/4.0/).