Abstract
Green spaces in waterfront residential blocks, where the water landscape and green space intersect, have a special carbon sequestration effect due to the distinct ecological interaction between water bodies and green spaces. Studying the carbon sequestration efficiency of green space patterns is crucial for enhancing urban ecological quality. Herein, 100 residential blocks adjacent to water bodies in Shanghai were selected as case areas, and green space pattern classification, random forest algorithm and spatial configuration quantitative analysis were used to analyse the impact of spatial morphology factors, surrounding building environment and water–green coupling environment on the CS efficiency of the green space in residential blocks. The results showed that the importance of the green space morphology index influencing CS is significantly greater than that of the building environment index. Among the indices, the fraction vegetation coverage, coverage ratio of evergreen broadleaved trees and canopy coverage of the green space have a more significant effect. Moreover, the different types and compositions of tree species in residential green spaces have different impacts on CS. Residential blocks with higher levels of water surface ratio (Wr) have a slightly higher CS of the internal green space. In residential blocks 500 m from water bodies, Wr has a significant impact on the CS capacity of the green space. The blocks with an external greenway pattern and external greenway–green grid pattern provide an advantageous environment for CS. This study provides a reasonable basis for the development of riverfront green spaces to increase carbon sequestrations.
1. Introduction
In recent decades, greenhouse gas emissions, mainly carbon dioxide, have led to climate change and are considered to be the most threatening global environmental problem [1,2]. International consensus is that reducing urban carbon emissions and enhancing their ecological carbon sequestration capacity are important ways to effectively mitigate global warming [3]. The ecological carbon sink value of green spaces in urban built environments has received more attention. Vegetation inside urban building blocks absorbs carbon dioxide from the atmosphere through photosynthesis and stores it in plants and soil, thereby becoming an integral part of the city’s direct carbon sink [4,5]. Studying the carbon sequestration (CS) effect of green spaces in urban building blocks can contribute to achieving urban carbon neutrality [6,7].
The spatial structures and morphological factors of urban green spaces have an important influence on the carbon sink efficiency of urban blocks. The vegetation composition, vegetation community structure and morphological characteristics of green spaces are important factors that affect ecological CS capacity [8,9]. Green space area and vegetation coverage are both negatively correlated with the carbon concentration of green spaces [10]. Maintaining high interior-to-edge ratios of forests is also conducive to carbon storage [11], and the improvement of green space connectivity can enhance the urban CS effect [12,13]. Increased aggregation patterns and compact shape of tree canopy cover are associated with higher CS [14,15]. The patch area percentage of main forest types (i.e., deciduous trees, evergreen tree cover types) within the city community affects the CS [15]. The leaf area index is a key parameter of ecosystem structure and is closely related to the CS process [16]. Different types of tree species have different CS capacities due to their different leaf area indices and different canopy coverages [17]. In urban built environments, the average carbon sequestration efficiency of evergreen trees is higher than that of deciduous trees [18], and the CS performance of conifers is better than that of broadleaved trees [15]. In addition, the canopy density of urban tree species is positively correlated with carbon storage capacity [19,20].
The CS capacities of green spaces in an urban area are also affected by the surrounding building environment, as they are located in the geometric structure of the community [21]. Among all types of urban land use, developed residential area and open land use types have relatively high carbon storage [22]. The increase in impervious surfaces greatly reduces the CS of urbanised areas [14,16]. Forest CS decreases with the increase in carbon variance in neighbourhoods where the intensity of development is higher. Residential neighbourhoods with a higher built-up density are more likely to be affected by a larger number of landscape metrics. Therefore, the CS of urban forest in these communities may exhibit higher changes [14,15,16]. In the study of urban block scale, built-related factors such as plot ratio, building density and average building height are related to urban microclimate effects; buildings, vegetation and surface ground in different morphologies, quantities and configurations form the local climate of an urban heterogeneous subregion [23]. The built environment also changes the CS process of its internal green space due to its zonal microclimate change [24]. There is a complex relationship between residential age and CS, on the one hand, because neighbourhood buildings with different construction ages have different surface albedos [25] and, on the other hand, because of the influence of different neighbourhood ages on the change in tree abundance [26,27]. By improving the underlying surface of community public spaces, the temperature difference of microclimate can be reduced, and the carbon reduction efficiency of the community can be improved [28].
Water bodies and green spaces affect CS efficiency by causing changes in microclimate and ecological processes [19]. The dynamic exchange of heat and energy between blue and green spaces constitutes the complexity of the carbon cycle process in an urban waterfront area. The change in the natural surface such as water body and green space has a significant impact on the carbon cycle of the ecosystem and has a synergistic effect of important ecological service functions [29]. There are some differences in the carbon concentrations of the zones with different distances from the water bodies. The adjacent water bodies enhance the photosynthetic efficiency of the vegetation in the waterfront area and reduce the atmospheric carbon concentration [20], and the spatial distribution and ecological service functions of the water body and green space are complementary [30]. The hydrological conditions of rivers and lakes affect the evapotranspiration and carbon cycles by changing soil water retention and air temperature and humidity [31]. Under the condition of limited urban land use, optimising the urban blue–green spatial landscape pattern is an important way to enhance the urban CS and mitigate the urban heat island effect [32,33,34]. There is a quantitative relationship between water body and carbon reduction. The optimal water surface ratio directly affects the determination of the optimal level of carbon reduction for urban development [35].
Because of its spatial location, the waterfront residential block has a unique blue–green coupling to increase the CS effect. The plant community space formed by vegetation configuration with different composition, spatial structure and surrounding environmental elements affects the physiological processes in the urban green space, leading to the spatial heterogeneity of urban ecosystem services (including CS services) [36], especially the spatial heterogeneity of the special CS generated by the synergistic benefits of the blue–green spatial coupling area [19]. Previous studies on the impact of blue–green coupling ecological space on the urban CS have mainly focused on the interaction between different morphology indices and ecological CS efficiency in a single green-covered zone [10,20]. However, from the perspective of land use and its green space pattern type in the residential function zone, the interaction between the spatial environment index and the spatial morphology index of the green space on the CS effect of the inner built-up located in the waterfront space is not discussed. Urban waterfront residential blocks provide residents with a high-quality living environment. Studying the influencing factors of the CS efficiency of urban waterfront residential blocks can enhance the overall urban ecological CS function.
Herein, 100 residential blocks in a riverfront area were selected as the study object to explore the heterogeneity of the CS distribution of the green space in riverfront residential blocks, and the importance of the green space description indices and the block spatial environment indices that affect the CS efficiency of urban riverfront residential blocks was studied by using random forest (RF) algorithm. Further, the marginal effect characteristics of each index on the CS of blocks were analysed. Combined with the partition of green space pattern types of riverfront residential blocks, the differences of the CS pattern of green space pattern types in different blocks and the effects of their specific influencing factors on the CS of green space blocks were discussed. This study provides a quantitative index control basis and method guidance for the optimisation of the CS pattern of green spaces in riverfront residential blocks.
2. Data and Methods
2.1. Study Area
Located between a longitude of 120°51′ and 122°21′ East and a latitude of 30°40′ and 31°53′ North, Shanghai has a subtropical humid monsoon climate with abundant rainfall and dense water system distribution. Numerous river network water systems provide a large number of diverse green spaces for blocks. Herein, the closed zone of the Huangpu River and the Yangtze River in Shanghai with high-density continuous construction areas is selected as the study scope (Figure 1). It is an area with a high urban heat island effect and carbon emission level. The selection of different spatial pattern types and the quantitative analysis of the CS function of the green space pattern in the residential blocks along the river are more typical for promoting the study on carbon reduction and sink increase in multi-dimensional factors in the built environment.
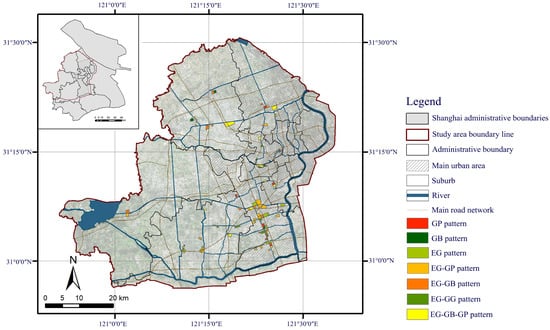
Figure 1.
Distribution of green space types in typical riverfront residential blocks.
The range of riverfront residential blocks in this study is mainly selected from the main river system and its corresponding buffer zone identified in the Shanghai River (Lake) Report 2019. The rich and diverse riverfront green space in this area provides a good support for studying the spatial heterogeneity of CS in urban riverfront residential blocks. A total of 100 typical riverfront residential blocks were selected as the study objects. The range of each block is delimited by the surrounding urban river and road network. The selected blocks are mostly residential blocks in the main urban area, including 37 residential blocks located in the suburbs and 63 residential blocks located in the main urban area. To avoid the influence of large water bodies on the CS efficiency of the green space of the block, the distances of all selected blocks from the Huangpu River should be greater than 1 km and the green space ratio within the blocks should not be less than 20%.
To explore the differences of the influence of the green space patterns of different blocks on the CS capacity, the green space pattern types of riverfront blocks were identified in the study area. The criterion for this pattern type partition is as follows: Initially, different green space form elements are distinguished, including the green corridor elements of the riverfront and adjacent road around the block and the green patch and green belt elements of the internal green space pattern. Then, the distribution of green corridors (namely greenway) outside the block and the public green space distribution inside the block were identified to determine the green space pattern types. Among them, the peripheral space of different blocks includes two states, namely greenway along the riverside and no greenway. The internal block includes the green network, green belt, green patch types and combination of the above types. Finally, the combination of external green space structure and internal green space pattern of the block forms seven typical green space pattern types of riverfront residential blocks in the case area, namely green patch (GP) pattern, green belt (GB) pattern, external greenway (EG) pattern, external greenway–green patch (EG–GP) pattern, external greenway–green belt (EG–GB) pattern, external greenway–green grid (EG–GG) pattern and external greenway–green belt–green patch (EG–GB–GP) pattern. Illustrate of the study areas of seven different green space pattern types are shown in Figure 1, and detailed morphological examples are provided in Section 3.1.2.
2.2. Data Acquisition
2.2.1. Basic Data of Land Use
The blue–green spatial basic data of the study area were obtained by using the 0.5 m resolution image of 2017 Google Earth and the combination of manual visual interpretation and field supplementary investigation. According to Classification of Land Use Status (GB/T 21010-2017) [37], Classification Standard of Urban Green Space (CJJ/T 85-2017) [38] and Atlas of Shanghai City General Planning (2017–2035), the classification of land use in the riverside buffer area was determined, and the scope of research blocks in the riverfront area was demarcated.
2.2.2. Remote Sensing Data
The remote sensing data used in this study were obtained from the Geospatial Data Cloud Platform (https://www.gscloud.cn/ (accessed on 23 February 2024)), with Landsat 8 OLI imagery selected as the data source. The dataset has a spatial resolution of 30 m and a temporal resolution of 16 days. Images with less than 10% cloud coverage during May 2017 were selected for analysis. During the data processing phase, pre-processing steps including radiometric calibration, atmospheric correction, coordinate projection transformation, image stitching, and regional cropping were sequentially performed using the ENVI 5.3 software platform.
2.2.3. Meteorological Data
This study integrated multi-source meteorological observation data, where temperature and precipitation data were obtained from the National Earth System Science Data Center (http://www.geodata.cn (accessed on 2 April 2024)), specifically including the China 1 km resolution monthly mean air temperature dataset and the China 1 km resolution monthly precipitation dataset, with units of 0.1 °C and 0.1 mm, respectively. Solar radiation data were derived from the China Regional Surface Meteorological Factor Driven Dataset published by the National Data Center for the Tibetan Plateau (http://data.tpdc.ac.cn (accessed on 6 April 2024)), which has a spatial resolution of 0.1° and a temporal resolution of 3 h. To maintain spatial consistency, all meteorological data were resampled to a 30 m resolution in ArcMap 10.8, and standardized processes such as spatial alignment and coordinate transformation were applied.
2.2.4. Vegetation Type Data
Multi-temporal Sentinel-2 remote sensing imagery was utilized to extract multi-dimensional information, including spectral features, vegetation indices, texture features, and temporal variation characteristics. Based on ground-truth sample data, a Random Forest algorithm was employed to build a tree canopy vegetation classification model, enabling the fine mapping of forest stand types within the urban area of Shanghai. Four major forest stand types were identified: evergreen coniferous forest, evergreen broadleaf forest, deciduous coniferous forest, and deciduous broadleaf forest. Building upon this, forest stand type information at the block scale within the study area was obtained through spatial extraction, ultimately producing spatial distribution data for three tree species types—evergreen broadleaf forest, deciduous broadleaf forest, and deciduous coniferous forest—within the block study objects.
2.3. Estimation of the CS Capacity of the Residential Block
Net Primary Productivity (NPP) was used as an indicator to assess the CS capacity at the block scale. To improve estimation accuracy, MODIS and Landsat imagery fusion techniques were employed to obtain high temporal and spatial resolution data. Based on the fused NDVI dataset, the CASA model was applied to simulate NPP. The CASA model characterizes NPP through two key factors: absorbed photosynthetically active radiation (APAR) and light-use efficiency (ε), with the following calculation formula:
where SOL(x,t) represents the total solar radiation at pixel x during month t (MJ·m−2·month−1); FPAR(x,t) is the fraction of photosynthetically active radiation absorbed by the vegetation; the constant 0.5 represents the proportion of solar radiation available for vegetation (wavelength range of 0.4–0.7 μm). APAR(x,t) and ε(x,t) represent the photosynthetically active radiation and light use efficiency at pixel in month. εmax denotes the maximum light-use efficiency under ideal conditions (g·MJ−1). T(x,t) and W(x,t) represent the temperature and water stress factors at pixel x during month t, respectively.
2.4. Index System Affecting CS Capacity in Residential Blocks
The CS capacity of the green space inside residential blocks is influenced by many factors. The spatial morphology factors of residential blocks are selected, among which the key factors include not only the description indices of the green space inside the blocks but also the spatial environment indices of the blocks. The description indices of the block green space are classified according to the internal green space conditions of the block, including spatial pattern indices and tree species composition indices. By constructing these indices, the characteristics of the riverfront residential block green space can be quantitatively analysed.
2.4.1. Selection of the Spatial Pattern Indices of the Green Space
The specific factors of green space pattern indices include vegetation coverage, green space patch shape index, green space surface albedo, canopy density, and patch cohesion index. Details of each index calculation are shown in Table 1.

Table 1.
Construction of the indices system for green space pattern.
2.4.2. Tree Species Composition Indices of the Green Space
The composition index of tree species in the green space is used to calculate the evergreen broadleaved ratio (EBR), deciduous broadleaved ratio (DBR) and deciduous conifer species ratio (DCR), which occupy a relatively large proportion in the selected blocks, to describe the differential characteristics of green space vegetation distribution in riverfront residential blocks. In the studied cases, the proportion of the evergreen coniferous forest is very small, and it is not included in the vegetation classification data. The Identity Tool of GIS was used to obtain the area of the spatial component of each grid. Finally, the ratio of the marked land use area to the total grid area is calculated.
2.4.3. Selection of Block Spatial Environment Indices
The CS capacity of the green space in residential blocks is not only affected by the composition of the green space but also affected by the surrounding water bodies and buildings. This study selected the green space ratio (GR), vacant land ratio (VR), albedo of the block surface (Alb_block) and building density (BD) to explore the influence of each component of the block on the CS capacity. The distance from the water body (D_Wb) and waterbody area ratio (Wr) were selected to represent the influence of the water body on the CS capacity of the green space in the residential block. Building height (BH), plot ratio (PR) and architectural otherness (AO) were selected as indices of three-dimensional form of the residential built-up environment to reflect the impact of built environment on the CS of the green space, as shown in Table 2.
Table 2.
Construction of the index system for the spatial environment of urban blocks.
2.5. Effects of the Influencing Factors on the CS of the Green Space in Riverfront Residential Blocks
2.5.1. Multiple Spatial Factors on the NPP Pattern by the RF Algorithm
The RF model and SHAP algorithm were used to analyse the impact of spatial environmental indicators and green space descriptive indicators on the pattern of Net Primary Productivity (NPP) in riverfront residential neighbourhoods. Random Forest (RF) is an ensemble learning algorithm based on decision trees [39]. It employs bootstrapping to sample the data with replacement, creating multiple training subsets. Decision trees are built based on these subsets, and by combining several decision trees into a forest, the final prediction result is obtained by averaging the predictions from all trees, which enhances the accuracy of the model [40]. Therefore, the RF model is typically robust, with strong noise resistance and other advantages. Additionally, it can assess the importance of different variables within the model, providing a basis for feature analysis in practical applications. In this study, spatial environmental indicators and green space descriptive indicators of riverfront residential neighbourhoods were treated as independent variables, while NPP was the dependent variable, and an RF regression model was constructed. Based on this, the SHAP interpretation model [41] was utilized to further understand and deeply analyse the influence of each feature on the model’s prediction results.
2.5.2. Morphological Combination Characteristics and CS Capacity Analysis of Green Patches
According to the change of the index interval, the factors were graded and the classification factors were combined to describe the internal spatial characteristics of the green space in each riverfront block. The green space with the same level coding combination has similar internal spatial characteristics. By analysing the difference of the CS capacity in the spatial combination classification of GPs, we can find the impact difference of each spatial feature grade combination types on the CS efficiency of GPs and can explore the interaction of the internal spatial factors of green space morphology with different spatial characteristics in the CS process.
The selection and rank interval of the green space grouping description index in riverfront residential blocks were determined according to the importance degree of factors affecting their CS ability, change characteristics of marginal effects and correlation threshold data of previous studies. Select letters to represent different spatial factors and numbers to represent the level of the factor are shown in Table 3. The combination of Fv, Cd and Co describes the pattern combination characteristics of the green space. The combination of EBR, DBR and DCR describes the vegetation types of the green space. BD, PR and AO are combined to describe the architectural form of the block. The combination of Wr, D-Wb and Cd reflects the combination characteristics of blue and green spaces in the block.
Table 3.
Spatial factor classification of the riverfront green space.
3. Results
3.1. NPP Distribution Characteristics of Different Green Space Layout Patterns in Residential Blocks
3.1.1. NPP Variations of Different Green Space Pattern Types
According to the seven types of green space patterns divided into selected riverfront residential blocks, the NPP index of the green space inside each type of block, the mean Fv value of the green space and mean GR of the corresponding block were calculated (Figure 2). The average NPP per unit area of the green space in different residential blocks was analysed. The NPP distribution results of each pattern type of green space were as follows: EG pattern > EG–GG pattern > EG–GP pattern > GP pattern > EG–GB–GP pattern > EG–GB pattern > GB pattern. Obviously, the GP pattern as with a large area scale is slightly better than the GB pattern. The EG pattern has the best CS ability.
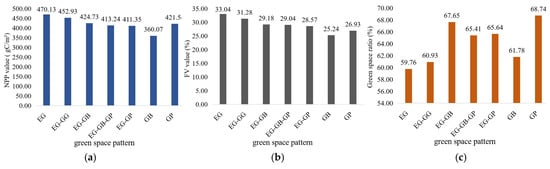
Figure 2.
(a) NPP values of different green space patterns, (b) Fv values of different green space patterns and (c) GR of different green space patterns of different green space types.
Results show that the change of green space NPP is closely related to the Fv, but not significantly correlated with the GR. In all the green space pattern types within riverfront residential areas, the green space, characterized by continuous riverfront green corridors, generally corresponds to a higher Fv value and exhibits the highest NPP. In contrast, the Fv values of the GP and GB patterns are relatively low. Among them, the green belt width of the GB pattern inside the residential block is limited, and the Fv is low, both of which influence the NPP of the green space in this type of blocks. However, the blocks with the GP pattern have a high GR, and this value distribution reflects that the block with this green space pattern has larger scale of green space patches, and the scale factor produces a relatively more favourable NPP in the green space.
3.1.2. NPP Heterogeneity Distribution in Different Green Space Patterns
To investigate the CS differences among seven green space patterns types of the study, seven representative residential blocks were selected to analyse the spatial differentiation characteristics based on the visualization results of NPP distribution (Figure 3). It shows that the spatial pattern of different green space form elements affects the NPP distribution of the blocks to varying degrees. The green corridors along rivers bordering the blocks enhance the overall CS with high-value NPP distribution, and the width of rivers and green corridors have a positive influence on CS. Larger green patches within the blocks correspond to very high NPP values. In the EG–GB–GP pattern, the green patches are relatively small, resulting in a distribution area with relatively lower NPP values. The green belts within the blocks have CS efficiency, but their narrow widths reduce a lower NPP value in the corresponding spatial distribution area compared to that of patchy green space.
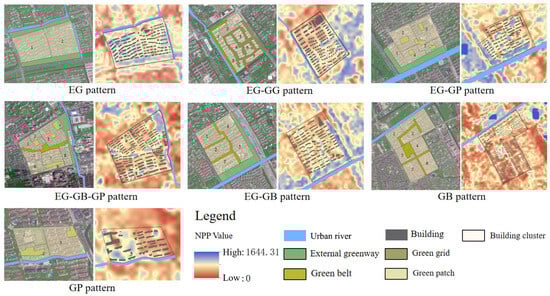
Figure 3.
Seven types of green space patterns in riverfront residential districts (selected study examples of typical blocks) and the visualization results of their NPP distribution.
Further analysis involved selecting blocks with different building environment, comparing the NPP distribution of blocks with high-carbon characteristics using EG and EG–GG green space patterns, to examine the impact of built environments on NPP differences. Figure 4 presents three types of building forms, namely, high-rise, multi-storey, and low-rise, and their NPP distribution. In the left two columns of Figure 4, even with the same EG pattern, low-rise residential blocks show the highest CS ability, followed by high-rise blocks, while multi-storey or mid-rise blocks have the lowest. In the right two columns of Figure 4, for the EG–GG green space pattern in the three types of building form blocks, it generally follows this environmental influence regularity. However, the high-rise block chosen has a higher NPP than the low-rise block due to its two riverfront green corridors and wider internal green belts. From these observations, the better living environments in low-rise residential areas and high-rise concentrated patterns are viable development models for riverfront blocks to improve CS.
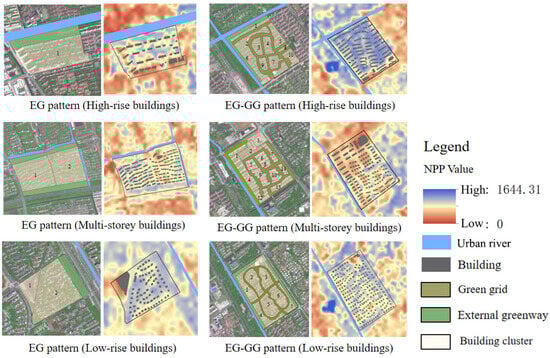
Figure 4.
The NPP distribution characteristics of EG and EG–GG green. space pattern in three different types of building form blocks.
3.2. The Significance of the Contribution of Block Space Form Factors to NPP
Through the RF model calculation and SHAP visualisation of the spatial morphology of residential blocks, their green space component factor indices and the block NPP distribution data, the contribution ratios of the main spatial factors affecting the CS efficiency of the green space in riverfront residential blocks can be obtained (Figure 3). Results show that the contribution ratios of green space description indices are significantly greater than those of block space environment indices, except the LSI index. Among the description indices of the green space of the green space, Fv has the largest impact (20.99%), and EBR has the highest contribution rate (13.88%), followed by Cd (5.7%), DBR (4.8%) and DCR (4.38%). The contribution ratio is evergreen broadleaved tree species > deciduous broadleaved tree species > deciduous conifer species, and the contribution ratios are EBR (13.88%), DBR (4.8%) and DCR (4.38%). The contribution ratios of VR and GR are 17.07% and 16.93%, respectively. The contribution ratio Wr to the CS capacity of residential blocks is lower than that of green vegetation, and the impact of the area ratio of adjacent water surface on the NPP of residential blocks is greater than that of water distance (Figure 5).
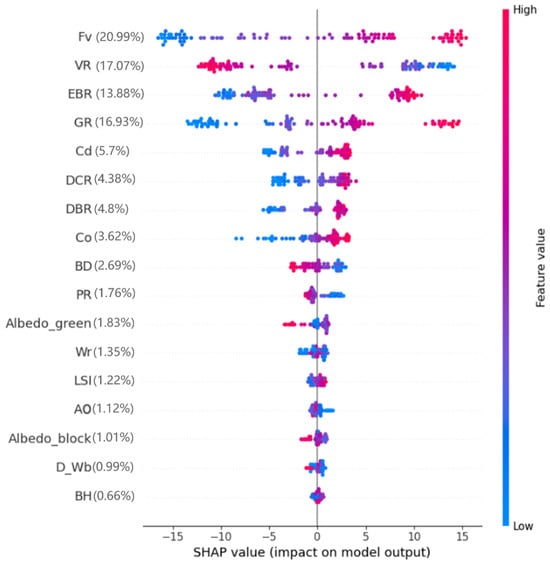
Figure 5.
Analysis of the contribution rates of residential block spatial morphology factors to NPP.
3.3. Effects of the Single Influencing Factor on the CS in Riverfront Residential Blocks
3.3.1. CS Influence from Spatial Pattern Factors of Green Space
The RF model can be used to further analyse the marginal effect of the green space composition index on the NPP of riverfront residential blocks (Figure 6a–c). The marginal utility curves of Fv, Cd, Co and NPP all show an upwards trend, indicating that the effects of Fv, Cd and Co on NPP are significantly positively correlated. From the slope of the marginal effect curve, When Fv is in the range of 0.25–0.35, the CS benefit of the green space increases significantly with the increase in Fv (Figure 6a); while the Cd value from 0.35 to 0.40 has a significant positive impact on the increase in NPP to a greater extent. (Figure 6b). And when the Co value is less than 78, its influence on NPP changes significantly (Figure 6c).
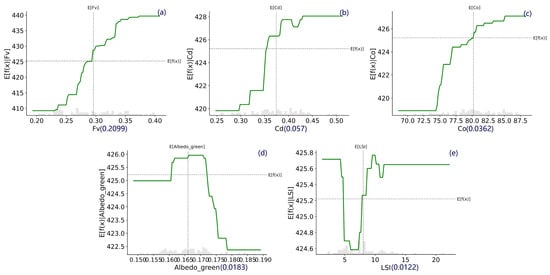
Figure 6.
Marginal effect curve of the spatial pattern indices on the NPP of the green space in riverfront blocks. (a) Fv; (b) Cd; (c) Co; (d) Albedo_green; (e) LSI.
The marginal effect curves of albedo_green and LSI with respect to NPP are generally positively and negatively correlated. The albedo_green of the green space is to some extent affected by the distribution of vegetation. When the albedo_green range is 0.16–0.17, the marginal effect curve rises, and there is a significant positive correlation between them, and the green space NPP value shows an upward trend, reaching the NPP value threshold at 0.17; when the albedo_green range is 0.17–0.183, as the albedo_green increases, the NPP value of green space sharply decreases (Figure 6d). When LSI is less than 7.5, the larger the LSI, the smaller the green space NPP value; when LSI is greater than 7, the marginal effect curve shows a rapid upward trend, demonstrating a significant positive correlation feature (Figure 6e).
3.3.2. CS Influence from Tree Species Composition of the Green Space
The proportion of EBR, DCR and DBR is positively correlated with the marginal effect curve of NPP distribution. The slope of the marginal effect curve of EBR and NPP is large, and the increase is relatively stable. When EBR is in the range of 0.11–0.12, the positive correlation between NPP and EBR is particularly significant. When its value is 0.12, the marginal effect of CS of the block green space reaches the maximum and then becomes stable (Figure 7a). Evergreen trees can photosynthesise year-round because their leaves do not fall year-round. This year-round CS characteristic makes evergreen trees have unique advantages for CS, so evergreen trees usually have higher CS capacity. When DBR is less than 0.25, the slope of the marginal effect curve between DBR and NPP is very large. When DBR is in the range of 0.25–0.30, the CS amount of DBR remains unchanged; when DBR is in the range of 0.30–0.31, the NPP value increases significantly and then maintains a small fluctuation and the threshold value of DBR is 0.35 (Figure 7b). The distribution proportion of deciduous conifers in residential blocks is small. The slope of the marginal effect curve of DCR and CS is large. The NPP interval is relatively higher than the DBR value range, indicating that although the number of deciduous conifer species is small, it makes an important contribution to the annual NPP of the block, and to a certain extent, the diverse tree species configuration can further increase the CS capacity of the green space (Figure 7c).
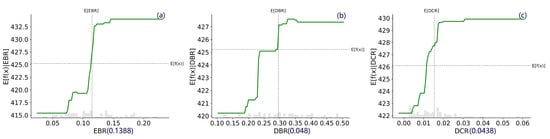
Figure 7.
Marginal effect curve of tree species composition indices on the NPP of the green space in riverfront blocks: (a) EBR; (b) DBR; (c) DCR.
3.3.3. CS Influence from Spatial Environmental Factors of the Green Space
The main interval data of BH, VR, PR and BD indices for describing the residential building form show a negative correlation with the marginal effect curve of NPP. while GR is positively correlated (Figure 8a–e). In the study area, the block BH principal value interval mainly ranges from 15 to 25 m. When BH is less than 15 m, the NPP values increase with the increase in BH. This is the multi-storey and low-rise housing covered area; its increase in BH can provide more green spaces to increase the block NPP. When BH is 11–18 m, NPP does not change significantly with building height. When BH is 18–23 m, NPP fluctuates and declines with the increase in BH (Figure 8a). For VR, NPP decreases from 0.25 to 0.4, and notably from 0.4 to 0.45 (Figure 8b). When PR ranges between 0.5 and 1.0, NPP declines steeply due to reduced green coverage in low-rise residential blocks as PR increases. When PR is 1.0–1.5, the CS capacity decreases more gradually, reflecting complex interactions in blocks mixing multi-story and small high-rise buildings (Figure 8c). BD exhibits strongly negatively correlate with NPP when its value is in the range of 0.20–0.25 (Figure 8d). For the GR range of 0.2–0.35, the NPP value of the green space increases significantly. When GR is greater than 0.35, the curve flattens due to external factors (Figure 8e).
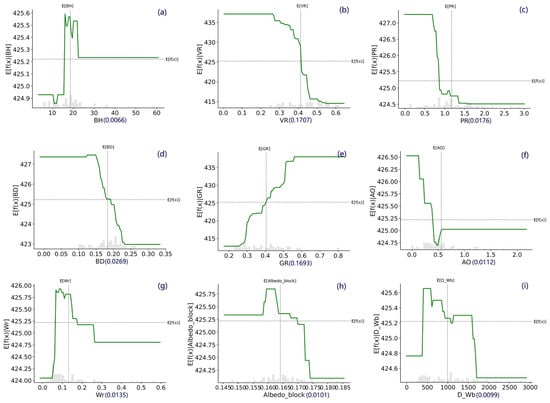
Figure 8.
Marginal effect curve of spatial environment indices on the NPP of the green space in riverfront blocks: (a) BH; (b) VR; (c) PR; (d) BD; (e) GR; (f) AO; (g) Wr; (h) Albedo_block; (i) D_Wb.
Among the spatial environmental factors of the block, Alb_block, AO, Wr, and D_Wb show positive and negative correlation trends. Alb_block shows a positive correlation with NPP below 0.16 but turns negative above this threshold (Figure 8), indicating higher hardening proportions reduce CS efficiency; the AO factors of the block displays a significant decrease in NPP as the interlaced degree increases in the range of 0.25–0.5, but shifts to an upward trend above 0.5, with a marginal effect threshold at 0.5 (Figure 8f). The value of Wr reaches its maximum marginal effect at a threshold of 0.1. Beyond this value, its marginal-effect curve on NPP is negative. That is, in the riverfront block with a wide river area, the reduction in green space leads to a decrease in NPP (Figure 8g). For D_Wb values less than 500 m from the water, the corresponding value of NPP in the block increases significantly with increasing D_Wb, beyond which NPP declines with distance attenuation, establishing 500 m as the critical threshold (Figure 8i).
3.4. Effects of the Morphological Combination Characteristics Factors on the CS in Riverfront Residential Blocks
3.4.1. The Influence from the Spatial Pattern Combination Factors of Green Space
To further analyse the influence of the green space morphology description index on green space NPP, the combination indices with different factor grades for group types were associated with NPP data of GPs, and the scatter plot of the two was drawn to compare and analyse the influence of different combination types on the CS capacity of the green space in the riverside blocks. Under the combination modes of Fv, Cd and Co, it can be found that when the three factors of green space Fv, Cd and Co are at high levels, the NPP of the green space in this block is relatively high (Figure 9a); when the interval of the green space patch aggregation degree remains unchanged, the larger the numerical interval of Fv and Cd, the larger the NPP value of the green space in the corresponding block (Figure 9b,c); when the green space Cd level remains unchanged, the larger the numerical interval of Fv and Co, the larger the NPP value of the green space in the corresponding block; and the NPP is relatively high (Figure 9d,e); when the interval of the block vegetation coverage degree remains unchanged, the larger the green space Cd and Co levels, the larger the NPP value of the green space in the corresponding block (Figure 9f).
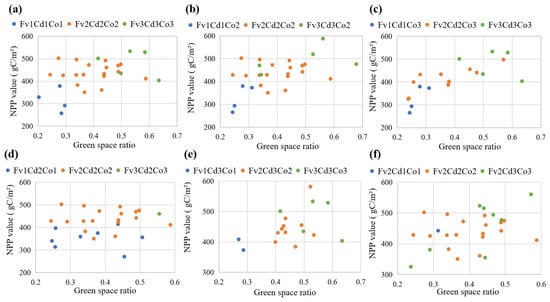
Figure 9.
NPP scatter distribution maps of the green space with specific spatial pattern characteristics in riverside blocks: Comparisons of different grades of the green space morphology description index combinations. (a) Fv1Cd1Co1, Fv2Cd2Co2, and Fv3Cd3Co3 patterns; (b) Fv1Cd1Co2, Fv2Cd2Co2, and Fv3Cd3Co3 patterns (Co factor at grade 2); (c) Fv1Cd1Co3, Fv2Cd2Co3, and Fv3Cd3Co3 patterns (Co factor at grade 3); (d) Fv1Cd2Co1, Fv2Cd2Co2, and Fv3Cd2Co3 patterns (Cd factor at grade 2); (e) Fv1Cd3Co1, Fv2Cd3Co2, and Fv3Cd3Co3 patterns (Cd factor at grade 3); (f) Fv2Cd1Co1, Fv2Cd2Co2, and Fv2Cd3Co3 patterns (Same Fv factor grade).
3.4.2. The Influence from the Greenery Tree Species Types Combination Factors
Similarly, by drawing a scatter plot showing the correlation between the index-level combinations of tree species composition in the block green spaces and the NPP data of the block patches, a comparative analysis was conducted to explore the influence of different greenery tree species types of the riverfront block green spaces. Under the combined group types of EBR, DBR and DCR, the increase in the diversity of various plant types in the green space resulted in an increase in the NPP value (Figure 10a). When the proportion of deciduous broadleaved forest and coniferous forest remained constant, that of the evergreen broadleaved forest increased and the NPP increased (Figure 10b). When the proportion interval of evergreen and deciduous broadleaved forests remained unchanged, the larger the proportion of the coniferous forest, the green space NPP of the corresponding block increased significantly (Figure 10c). When the proportion of the coniferous forest remained constant, NPP increased with the increase in the proportion of broadleaved forest in the block (Figure 10d). When the proportion of evergreen broadleaved forest remained unchanged, NPP increased significantly with the increase in the deciduous forest proportion (Figure 8e). When the proportion of evergreen broadleaved forest and coniferous forest remained constant, the proportion of deciduous broadleaved forest was moderate. When the proportion of deciduous broadleaved forest increased, the NPP value increased significantly. If the proportion of deciduous broadleaved forest was larger, its data would increase, but NPP would increase less (Figure 10f); Therefore, the human disturbance of the deciduous broadleaved forest in the urban built residential environment is an important factor affecting the CS efficiency.
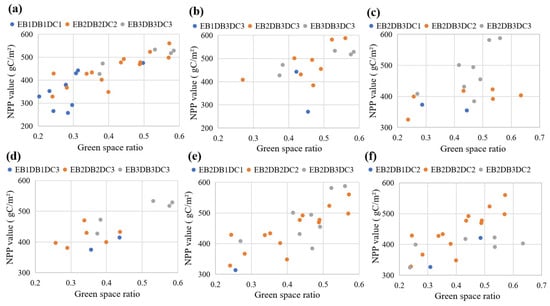
Figure 10.
NPP scatter distribution maps of the green space with specific species characteristics in riverfront blocks: Comparisons of different grades of the tree species composition index. (a) EB1DB1DC1, EB2DB2DC2, and EB3DB3DC3 patterns; (b) EB1DB1DC1, EB2DB2DC2, and EB3DB3DC3 patterns (Same DB and DC ratio factor grade); (c) EB2DB3DC1, EB2DB3DC2, and EB2DB3DC3 patterns (Same EB and DB ratio factor grade); (d) EB1DB1DC3, EB2DB2DC3, and EB3DB3DC3 patterns (Same DC ratio factor grade); (e) EB2DB1DC1, EB2DB2DC2, and EB2DB3DC3 patterns (Same EB ratio factor grade); (f) EB2DB1DC2, EB2DB2DC2, and EB2DB3DC2 patterns (Same EB and DC ratio factor grade).
3.4.3. The Influence from the Spatial Environmental Combination Factors
By plotting the combination indices of the residential blocks’ environment associated with the NPP data of the green space, the influence of different combination types on the CS capacity of the green space in the riverfront block was compared and analysed. In the combination types of BD, PR and AO, when the AO interval is set the same, the combination of BD and PR reflects the development intensity of the buildings. When the development intensity increased, the corresponding NPP generally decreased (Figure 11a,b). Meanwhile, comparing the change of the NPP value of the longitudinal coordinate for residential blocks in Figure 11a,b, the change intensity of NPP values in riverfront blocks was enhanced due to the increase in the AO level. In Figure 11c, BD1PR2AO3 describes the development of small high-rise floors. Although the vegetation environment is better, VR is relatively large, which is not conducive to increasing the CS and the NPP value is the smallest. BD2PR3AO2 describes the residential area with moderate vegetation coverage; the green space NPP in the riverfront block is in the middle state. BD3PR1AO1 describes the residential area with low-rise and multi-storey floors and better vegetation environment, with the best NPP (Figure 11c). When PR and AO remain unchanged, the larger the BD of the block, the smaller the NPP value of the green space (Figure 11d). In low-BD and medium-PR areas, NPP increased significantly with the increase in AO (Figure 11e). However, in Figure 9f, there is an opposite trend between AO and NPP, that is, in residential blocks with high BD and high PR, the larger the AO, the lower the corresponding NPP.
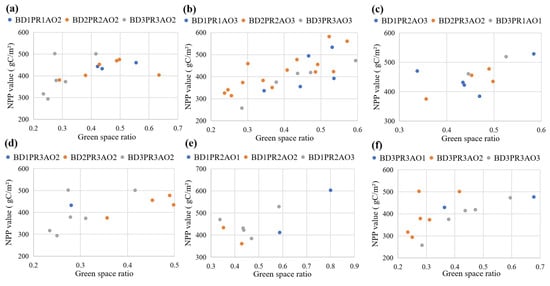
Figure 11.
NPP scatter distribution maps of the green space with specific built environment characteristics in riverfront blocks: Comparisons of different grades of the building morphological index. (a) BD1PR1AO2, BD2PR2AO2, and BD3PR3AO2 patterns (Same AO factor at grade 2); (b) BD1PR1AO3, BD2PR2AO3, and BD3PR3AO3 patterns (Same AO factor at grade 3); (c) BD1PR2AO3, BD2PR3AO2, and BD3PR1AO1 patterns; (d) BD1PR3AO2, BD2PR3AO2, and BD3PR3AO2 patterns (Same PR and AO factor grade); (e) BD1PR2AO1, BD1PR2AO2, and BD1PR2AO3 patterns (Same BD at grade 1 and PR at grade 2); (f) BD3PR3AO1, BD3PR3AO2, and BD3PR3AO3 patterns (Same BD and PR factors at grade 3).
In the combination types of Wr, D-Wb and Cd, the space range 500 m away from the river is selected, and it can be observed that NPP increased significantly with the increase in the green space Cd level (Figure 12a). On the basis of the above analysis, Wr was set in the same interval, which further proves that the NPP value of the block with greater Cd of the riverfront green space is larger (Figure 12b). In the blocks with the same grade of Wr and green space Cd distribution, the influence of the river on the green space NPP presented a distance attenuation rule after the 500 m distance (Figure 12c). Residential blocks with higher Wr levels had a relatively high NPP of internal green space (Figure 12d); When the D-Wb and the Cd of the green space in riverfront blocks remained unchanged, the Wr level was high, showing that the adjacent river width was large, and the corresponding NPP value was relatively high (Figure 12e). For the same Gr, blocks with small D-Wb, large Wr and better Cd of the green space embodied high NPP (Figure 12f). Due to the limitation of the selection block data, GR and Cd were relatively small in the adjacent selection case blocks with large Wr, which affects the CS characteristic regularity to some extent. The Wr with the second level showed high NPP values when it had high GR and Cd.
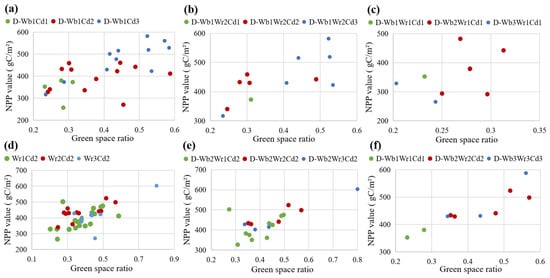
Figure 12.
NPP scatter distribution maps of the green space with specific blue space characteristics in riverfront blocks: Comparisons of different grades of the water body morphological influence index. (a) D-Wb1Cd1, D-Wb1Cd2, and D-Wb1Cd3 patterns (Same D-Wb factor grade); (b) D-Wb1Wr2Cd1, D-Wb1Wr2Cd2, and D-Wb1Wr2Cd3 patterns (Same D-Wb and Wr factor grade); (c) D-Wb1Wr1Cd1, D-Wb2Wr1Cd1, and D-Wb3Wr1Cd1 patterns (Same Wr and Cd factor grade); (d) Wr1Cd2, Wr2Cd2, and Wr3Cd2 patterns (Same Cd factor grade); (e) D-Wb2Wr1Cd2, D-Wb2Wr2Cd2, and D-Wb2Wr3Cd2 patterns (Same D-Wb and Cd factor at grade 2); (f) D-Wb1Wr1Cd1, D-Wb2Wr2Cd2, and D-Wb3Wr3Cd3 patterns.
4. Discussion
4.1. Green Space Pattern and CS Potential of Riverfront Residential Blocks
The nine types of green space patterns of residential blocks selected in this study show significant differences in their CS efficiency. Generally speaking, the primary feature is the external greenway pattern or combinations the green space pattern of the internal block, namely, which is with a green corridor along the riverbank, that have a high potential of CS. These riverfront blocks with EG pattern are characterized by water–green coupling. The greenways along the water body significantly increase the total CS. According to the different combination types of blue–green factors and their corresponding CS characteristics (Figure 10), it has been found that when Wr factor and Gr and Cd factors adjacent to water body are at high values, NPP also reaches high values. On the other hand, the contribution ratio of water bodies themselves to the CS capacity of residential blocks is significantly lower than that of green vegetation. Areas with large water body proportions can affect the area proportion of green spaces in the blocks, thus water bodies alone have both positive and negative correlations with the CS capacity of blocks, with a threshold point identified in this study at a water surface ratio of 10%. However, arranging green corridors along rivers shows a very significant CS efficiency, indicating that the layout of blue–green coupled spaces plays a synergistic role in enhancing CS. It can be seen that the layout pattern of the blue–green coupling space has a synergistic effect on CS enhancement.
Previous studies on the CS efficiency of water bodies have shown that the CS paths of green and blue spaces are different. Urban green spaces mainly sequester carbon and release oxygen through vegetation photosynthesis [42,43]. In contrast, urban blue spaces achieve CS mainly through soil CS, aquatic plant photosynthesis, and carbon dissolution in water bodies [44,45,46,47]. This explains why relying solely on water bodies cannot produce a high CS capacity, which aligns with our research conclusion. The blue—green coupling synergistic effect proposed in this study supports the finding that the typical external corridor layout pattern of riverfront residential blocks has the best CS capacity due to the coupling of blue and green spaces. Li et al. [43] studied Beijing’s large—scale blue—green spaces and found that increased CS is closely related to improved carbon—water coupling efficiency. The urban forest within 1000 m of the water body is an area where CS efficiency significantly increases. Jiang et al. [20] clearly identified the enhancement in the CS process in the Shanghai riverfront park green space affected by water bodies in their dynamic simulation study. These research findings confirm that the typical riverfront block corridor pattern in our study achieves the best CS effect due to the coupling of blue and green spaces.
Regarding the combination of external corridor and internal green space patterns in residential blocks, both the internal green grid pattern (EG–GG pattern) and the large green patch pattern (EG–GP pattern) are markedly superior to other layout patterns. This indicates a strong link between residential block carbon sequestration and vegetation coverage area as well as green corridor connectivity. Many studies, such as Chen et al.’s [44] have confirmed the positive correlation between Fv and green space carbon sequestration. Higher vegetation coverage generally leads to better carbon sequestration performance. Additionally, this study shows that compared to the CS efficiency of the EG–GP pattern limited by green space coverage scale, the EG–GG pattern has a relatively higher CS efficiency because of its better ecological connectivity. It’s widely recognized that appropriate green space connections near residences benefit CS [45], and Dong et al. [46] research also supports that a denser and more scattered green network in residential green spaces can enhance CS performance.
4.2. Vegetation Structure and CS Potential of Riverfront Residential Blocks
This study found that the composition of tree species, especially that of EBR, showed a very significant improvement in the CS capacity of the internal green space as the green space ratio (GR) of the block increased. From the NPP influence analysis of different tree species combinations in the block (Figure 10), it is clear that the composition of tree species in the internal green space of the block has a major impact on the green space’s CS capacity. EBR can provide better CS capacity. It can be considered that the photosynthetic area of their vegetation leaves is large, and they can store more carbon through photosynthesis. In terms of the diversity of plant species composition, this study also discovered that although the proportion of coniferous forests in residential blocks is often not large, in the combination patterns of EBR, DBR, and DCR, the increase in the diversity of plant types in the green space can lead to an increase in NPP values (Figure 10a). This result reflects that the diversity of vegetation has an important positive impact on the CS capacity of the green space. Chen et al. [47] also found in their study on the CS efficiency of green space in the central urban area of Shanghai that species diversity has an important impact on CS. There are also studies that further prove that multi-layer planting in the vertical structure is conducive to carbon storage [47,48].
However, deciduous broad-leaved forests are greatly affected by artificial interference. When their proportion is moderate, they have a significant improvement effect on the CS (Figure 8f); if the proportion of deciduous broad-leaved forests is large, the CS capacity of the green space actually decreases less. Therefore, for this kind of residential block with an artificial-natural spatial configuration, although deciduous broad-leaved forests have the advantages of large leaf area and high above-ground CS, this study found that their overall CS capacity is still interfered by the built environment from the perspective of CS. Based on the perspective of CS, it is not suitable to exceed the threshold of 35%. Gratani et al. [49] confirmed that broad-leaved tree species can effectively absorb CO2 due to their high leaf area index. Liu et al. [50] measured the CS amount of different plant species in residential areas of Nanjing, which is also located in the subtropical monsoon climate zone with Shanghai, and confirmed that the CS and overall carbon storage per unit canopy area of evergreen vegetation in urban residential areas were higher than that of deciduous vegetation. This is also consistent with our research conclusion.
4.3. Insights from CS Improvement of Green Spaces in Different Residential Blocks
In terms of the influence of green space layout, green spaces with high vegetation coverage and density, along with good connectivity between patches, exhibit high CS efficiency. Additionally, in the condition of water–green coupling, green spaces around water bodies with high density and green space ratio can provide excellent CS efficiency. Green spaces in urban blocks that are close to riverfronts can produce significant CS effects. The conclusions from these single-factor analyses, when applied to green space planning in residential districts, clearly outline an optimized spatial path for enhancing CS capacity through the development of riverfront blocks with peripheral green corridors. Therefore, green space planning in riverfront residential blocks should focus on increasing the planting density and diversity of vegetation, and expanding the total plant area and leaf density, and maintaining green space connectivity during planning by setting up green belts and ecological corridors. Also, it should be given priority to layout the green spaces in areas close to water bodies, especially in the areas near the water or along the shore for greening. The ecological synergy effect between water bodies and green spaces should be fully considered to enhance the service functions of the entire ecosystem.
Regarding vegetation composition, diverse green spaces have higher CS efficiency. Evergreen broad—leaved and coniferous forests offer stable CS capabilities. Although deciduous broad—leaved forests show better CS efficiency growth than evergreen ones at an appropriate planting ratio, due to heavy human interference, their ratio should be controlled. Therefore, residential areas should prioritize evergreen broadleaf tree species with high carbon sink capacity, combined with deciduous broadleaf and coniferous tree species. For example, in waterfront external greenway, mix plantations of evergreen broadleaf trees and wetland plants such as Liquidambar formosana, Metasequoia glyptostroboides, Magnolia denudata and Salix babylonica. For internal green belts, choose tree species like Cinnamomum camphora, Osmanthus fragrans, and Zelkova serrata. For green patches, use multi-layer configurations of mixed evergreen and deciduous broadleaf forests and high-carbon sink shrubs, such as Ginkgo biloba, Prunus cerasifera, and Sapindus mukorossi.
Regarding the impact on the built environment, the CS distribution pattern in various blocks is as follows: low-rise and multi-story blocks with better greening > high-rise and high-intensity development blocks > small high-rise blocks with staggered development. In low-rise and multi-story residential areas, with mixed construction of high and low-rise buildings, the increase in staggered degree is conducive to the increase in NPP; in mid-rise residential areas, the staggered degree of buildings should not be too large, and the concentrated high-rise construction is conducive to the improvement of green space and NPP. Therefore, the green space planning of residential blocks should focus on creating staggered building layouts in low-rise and multi-story residential areas to ensure the maximization of green space area utilization, increase the greening coverage ratio, and promote the increase in NPP; high-rise and high-intensity development blocks should adopt concentrated high-rise construction to effectively enhance the vertical utilization space of green space, thereby optimizing the CS efficiency; in high-rise areas, facilities such as rooftop gardens and vertical greening should be designed to maximize the use of limited space for greening, and improve the green coverage rate and carbon absorption capacity of the block.
4.4. Limitation
This study mainly explores the interaction relationship between the internal spatial environmental indicators and the green space form indicators of the riverfront residential blocks and the CS efficiency within the blocks from the perspective of land use. However, there are still certain limitations. The selected case area in this study is relatively limited. The differentiation of the internal green space form patterns of the blocks can further increase the number of cases and highlight the regularity of the influence of each pattern on the CS efficiency.
In addition, this study mainly discusses the mechanism of the influence of the factors affecting the CS capacity of the green space in the residential blocks from the perspective of the landscape structure that influences the green space CS capacity. However, in the real environment, the influencing factors of the green space CS capacity are relatively complex, such as vegetation age, soil moisture, soil texture, temperature and microclimate, etc., and need to be further comprehensively considered. Other factors of the block environment and human activities, such as traffic pollution within the residential area and human activities, etc., may also cause a series of changes on the CS capacity. In future research, the CS process of the green space in the residential blocks in the riverfront area can be described and explained more comprehensively and from more dimensions. Optimization strategies for the adaptive construction of the CS of the riverfront green space can be proposed based on the optimization of the composition types of the riverfront green space.
5. Conclusions
In cities with dense water networks and rapid development, land resources are scarce; where land resources are scarce, enhancing the CS capacity of green spaces in riverfront blocks is crucial for promoting nature-based carbon-neutrality strategies. This study systematically investigated nine types of green space layout patterns in riverfront blocks, using an improved light energy utilization simulation method and combining field measurement data to obtain NPP distribution data within different block ranges. Through random forest and statistical analysis methods, the study analysed the influence of the composition of green space within the riverfront residential blocks on environmental indicators and the description characteristics factors of specific combinations on CS. The results show that spatial pattern and tree species composition indices of green space are more important than block spatial environmental ones, especially for block green space tree species composition on CS. Evergreen broad-leaved trees have the most stable CS capacity. Deciduous broad-leaved trees, affected by built-environment interference, have a block threshold ratio ≤ 35%. Diverse plant composition in vegetation areas is key for enhancing CS. In the riverfront environment, the water body’s CS contribution is less than that of green space. Wr contributes more to green space CS than D_Wb. The EG pattern with the combination distribution of water body and riverfront greenways can generate a synergistic CS efficiency, and the EG–GG pattern also embodies high CS efficiency due to the coupling effect of water and greenery and ecological connectivity. Regarding the built environment, CS efficiency in blocks are as follows: low-rise and multi-story blocks with better greening > high-rise and high-intensity development blocks > small multi-story staggered development blocks.
This study clarifies the influence of vegetation composition and green space patterns on CS capacity in urban riverfront residential areas and the influence factors of block spatial environment composition, providing a reasonable configuration basis for enhancing the CS capacity of green spaces in urban riverfront blocks. However, this study also explores and explains the impact of factors such as limited case area, lack of microclimate and human activities on CS of green space. In future studies, more comprehensive and in-depth studies can be conducted by increasing the number of study case blocks and exploring the impact of more dimensional factors, so as to provide constructive basis for the optimization of the CS adaptability of riverside green space for the composition type of riverside green space.
Author Contributions
Y.J.: Conceptualization, Methodology, Supervision, Writing—Original draft preparation, Writing—Review and editing. D.X.: Writing—Original draft, Methodology, Software, Visualization, Investigation, Formal analysis. L.P.: Data curation, Software, Writing—Review and editing, Investigation. X.L.: Validation, Methodology, Investigation, Writing—Review and editing. T.S.: Visualization, Validation, Resource. F.Z.: Visualization, Investigation, Data Curation. All authors have read and agreed to the published version of the manuscript.
Funding
This research study was funded by the National Natural Science Foundation of China project (grant numbers 51878279). The authors would like to thank the editor and the anonymous reviewers for their helpful comments.
Data Availability Statement
No data were used for the research described in the article.
Conflicts of Interest
The authors declare no conflicts of interest.
References
- Hobbie, S.E.; Grimm, N.B. Nature-based approaches to managing climate change impacts in cities. Philos. Trans. R. Soc. B Biol. Sci. 2020, 375, 20190124. [Google Scholar] [CrossRef] [PubMed]
- Hoegh-Guldberg, O.; Jacob, D.; Taylor, M.; Guill’en Bolãnos, T.; Bindi, M.; Brown, S.; Camilloni, I.A.; Diedhiou, A.; Djalante, R.; Ebi, K.; et al. The human imperative of stabilizing global climate change at 1.5 °C. Science 2019, 365, eaaw6974. [Google Scholar] [CrossRef] [PubMed]
- Liu, Z.; Wang, L.; Wang, P. Analysis on influencing factors of farmers’ intention to manage forestry carbon sinks—An empirical study based on boosted regression tree. South China For. Sci. 2018, 46, 22–28. [Google Scholar] [CrossRef]
- Russo, A.; Escobedo, F.J.; Timilsina, N.; Schmitt, A.O.; Varela, S.; Zerbe, S. Assessing urban tree carbon storage and sequestration in Bolzano, Italy. Int. J. Biodivers. Sci. Ecosyst. Serv. Manag. 2014, 10, 54–70. [Google Scholar] [CrossRef]
- Singkran, N. Carbon sink capacity of public parks and carbon sequestration efficiency improvements in a dense urban landscape. Environ. Monit. Assess. 2022, 194, 750. [Google Scholar] [CrossRef]
- Nowak, D.J.; Greenfield, E.J.; Hoehn, R.E.; Lapoint, E. Carbon storage and sequestration by trees in urban and community areas of the United States. Environ. Pollut. 2013, 178, 229–236. [Google Scholar] [CrossRef]
- Qiu, Z.; Feng, Z.; Song, Y.; Li, M.; Zhang, P. Carbon sequestration potential of forest vegetation in china from 2003 to 2050: Predicting forest vegetation growth based on climate and the environment. J. Clean. Prod. 2022, 252, 119715. [Google Scholar] [CrossRef]
- Shi, T.; Li, P.; Tang, Y. Urban carbon sink function and promotion strategy under the background of carbon neutrality—A case study of Shengyang core area. Chin. Landsc. Archit. 2022, 38, 78–83. [Google Scholar] [CrossRef]
- Zhu, N.; Li, M.; Chai, Y. Ecological functions of green land system in Harbin. Chin. J. Appl. Ecol. 2002, 13, 1117–1120. [Google Scholar] [CrossRef]
- Li, X.; Jiang, Y.; Liu, Y.; Sun, Y.; Li, C. The impact of landscape spatial morphology on green carbon sink in the urban riverfront area. Cities 2024, 148, 104919. [Google Scholar] [CrossRef]
- Brinck, K.; Fischer, R.; Groeneveld, J.; Lehmann, S.; Mateus, D.D.P.; Pütz, S.; Sexton, J.O.; Song, D.; Huth, A. High resolution analysis of tropical forest fragmentation and its impact on the global carbon cycle. Nat. Commun. 2017, 8, 14855. [Google Scholar] [CrossRef] [PubMed]
- Guo, H.; Yu, Q.; Pei, Y.; Wang, G.; Yue, D. Optimization of landscape spatial structure aiming at achieving carbon neutrality in desert and mining areas. J. Clean. Prod. 2021, 322, 129156. [Google Scholar] [CrossRef]
- Wang, Z.; Zhu, D.; Wang, X.; Zhang, Y.; Peng, S. Regressions underestimate the direct effect of soil moisture on land carbon sink variability. Group Not. 2022, 28, 7161–7163. [Google Scholar] [CrossRef] [PubMed]
- Godwin, C.; Chen, G.; Singh, K.K. The impact of urban residential development patterns on forest carbon density: An integration of lidar, aerial photography and field mensuration. Landsc. Urban Plan. 2015, 136, 97–109. [Google Scholar] [CrossRef]
- Lin, J.; Ma, Q.; Ju, Y.; Zhang, H.; Wang, Q.; Huang, B. Relationships between urbanization, tree morphology, and carbon density: An integration of remote sensing, allometric models, and field survey. Urban. For. Urban. Green. 2022, 76, 127725. [Google Scholar] [CrossRef]
- Sun, Y.; Xie, S.; Zhao, S. Valuing urban green spaces in mitigating climate change: A city-wide estimate of aboveground carbon stored in urban green spaces of china’s capital. Glob. Change Biol. 2019, 25, 1717–1732. [Google Scholar] [CrossRef]
- Li, C.; Sun, G.; Cohen, E.; Zhang, Y.; Xiao, J.; McNulty Steven, G.; Meentemeyer, R.K. Modeling the impacts of urbanization on watershed-scale gross primary productivity and tradeoffs with water yield across the conterminous United States. J. Hydrol. 2020, 583, 124581. [Google Scholar] [CrossRef]
- Wang, Y.; Chang, Q.; Li, X. Promoting sustainable carbon sequestration of plants in urban greenspace by planting design: A case study in parks of beijing. Urban For. Urban Green. 2021, 64, 127291. [Google Scholar] [CrossRef]
- Jiang, Y.; Liu, Y.; Sun, Y.; Li, X. Distribution of CO2 concentration and its spatial influencing indices in Urban Park green space. Forests 2023, 14, 1396. [Google Scholar] [CrossRef]
- Jiang, Y.; Sun, Y.; Liu, Y.; Li, X. Exploring the correlation between waterbodies, green space morphology, and carbon dioxide concentration distributions in an urban riverfront green space: A simulation study based on the carbon cycle. Sustain. Cities Soc. 2023, 98, 104831. [Google Scholar] [CrossRef]
- Tran, T.J.; Helmus, M.R.; Behm, J.E. Green infrastructure space and traits (gist) model: Integrating green infrastructure spatial placement and plant traits to maximize multifunctionality. Urban. For. Urban. Green. 2020, 49, 126635. [Google Scholar] [CrossRef]
- Raciti, S.M.; Hutyra, L.R.; Newell, J.D. Mapping carbon storage in urban trees with multi-source remote sensing data: Relationships between biomass, land use, and demographics in Boston neighborhoods. Sci. Total Environ. 2015, 538, 1039–1041. [Google Scholar] [CrossRef]
- Stewart, I.D.; Oke, T.R. Local climate zones for urban temperature studies. Bull. Am. Meteorol. Soc. 2012, 93, 1879–1900. [Google Scholar] [CrossRef]
- Hou, H.; Zhang, S.; Ding, Z.; Wang, Y.; Yang, Y.; Guo, S. Temporal variation of near-surface co2 concentrations over different land uses in suzhou city. Environ. Earth Sci. 2016, 75, 1197. [Google Scholar] [CrossRef]
- Feng, Y.; Feng, H. TM data retrieval and analysis of Beijing area surface albedo. Sci. Surv. Map. 2012, 37, 164–167. [Google Scholar] [CrossRef]
- McPherson, E.G.; Xiao, Q.; Aguaron, E. A new approach to quantify and map carbon stored, sequestered and emissions avoided by urban forests. Landsc. Urban Plan. 2013, 120, 70–84. [Google Scholar] [CrossRef]
- Pham, T.-T.-H.; Apparicio, P.; Landry, S.; Lewnard, J. Disentangling the effects of urban form and socio-demographic context on street tree cover: A multi-level analysis from Montreal. Landsc. Urban Plan. 2017, 157, 422–433. [Google Scholar] [CrossRef]
- Wang, Z.C. Thinking on low-carbon community planning from the perspective of carbon emission quantification. Anhui Arch. 2018, 24, 43–46+78. [Google Scholar] [CrossRef]
- Van Vliet, J. Direct and indirect loss of natural area from urban expansion. Nat. Sustain. 2019, 2, 755–763. [Google Scholar] [CrossRef]
- Chen, H.; Yan, W.; Li, Z.; Wende, W.; Xiao, S.; Wan, S.; Li, S. Spatial patterns of associations among ecosystem services across different spatial scales in metropolitan areas: A case study of Shanghai, China. Ecol. Indic. 2022, 136, 108682. [Google Scholar] [CrossRef]
- Proietti, C.; Anav, A.; Vitale, M.; Fares, S.; Marco, A.D. A new wetness index to evaluate the soil water availability influence on gross primary production of European forests. Climate 2019, 7, 42. [Google Scholar] [CrossRef]
- Li, J.; Wang, Z.; Lai, C.; Wu, X.; Zeng, Z.; Chen, X.; Lian, Y. Response of net primary production to land use and land cover change in mainland china since the late 1980s. Sci. Total Environ. 2018, 639, 237–247. [Google Scholar] [CrossRef] [PubMed]
- Lin, J.; Qiu, S.; Tan, X.; Zhuang, Y. Measuring the relationship between morphological spatial pattern of green space and urban heat island using machine learning methods. Build. Environ. 2023, 228, 109910. [Google Scholar] [CrossRef]
- Liu, J.; Wang, Z.; Duan, Y.; Li, X.; Zhang, M.; Liu, H.; Xue, P.; Gong, H.; Wang, X.; Chen, Y.; et al. Effects of land use patterns on the interannual variations of carbon sinks of terrestrial ecosystems in China. Ecol. Indic. 2023, 146, 109914. [Google Scholar] [CrossRef]
- Wu, X.C. Study on Optimal Water Surface Rate of Cities and Towns in Lixiahe Depression Based on Carbon Emission Reduction Requirements. Master’s Thesis, Yangzhou University, Yangzhou, China, 2023. [Google Scholar]
- Haines-Young, R.; Potschin-Young, M.; Czúcz, B. Report on the Use of CICES to Identify and Characterise the Biophysical, Social and Monetary Dimensions of ES Assessments; ESMERALDA: Brussels, Belgium, 2018. [Google Scholar] [CrossRef]
- The Ministry of Natural Resources. GB/T 21010-2017; Classification of Current Land Use. China Standards Press: Beijing, China, 2017; pp. 2–6. Available online: https://m.mnr.gov.cn/dt/ywbb/201810/t20181030_2241239.html (accessed on 4 March 2025).
- Ministry of Housing and Urban-Rural Development of the People’s Republic of China. CJJ/T 85-2017; Classification Standard of Urban Green Space. China Architecture & Building Press: Beijing, China, 2017; pp. 2–8ISBN 1511231380. Available online: https://www.mohurd.gov.cn/gongkai/zc/wjk/art/2018/art_17339_236545.html (accessed on 4 March 2025).
- Breiman, L. Bagging predictors. Mach. Learn. 1996, 24, 123–140. [Google Scholar] [CrossRef]
- Breiman, L. Random forests. Mach. Learn. 2001, 45, 5–32. [Google Scholar] [CrossRef]
- Lundberg, S.M.; Nair, B.; Vavilala, M.S.; Horibe, M.; Eisses, M.J.; Adams, T.; Liston, D.E.; King-Wai Low, D.; Newman, S.; Kim, J.; et al. Explainable machine-learning predictions for the prevention of hypoxaemia during surgery. Nat. Biomed. Eng. 2018, 2, 749–760. [Google Scholar] [CrossRef]
- Fan, Y.; Wei, F. Contributions of natural carbon sink capacity and carbon neutrality in the context of net-zero carbon cities: A case study of hangzhou. Sustainability 2022, 14, 2680. [Google Scholar] [CrossRef]
- Li, X.; Jia, B.; Li, F.; Ma, J.; Liu, X.; Feng, F.; Liu, H. Effects of multi-scale structure of blue–green space on urban forest carbon density: Beijing, China case study. Sci. Total Environ. 2023, 883, 163682. [Google Scholar] [CrossRef]
- Chen, Y.Z.; Feng, X.M.; Tian, H.Q.; Wu, X.T.; Gao, Z.; Feng, Y.; Piao, S.L.; Lv, N.; Pan, N.Q.; Fu, B.J. Accelerated increase in vegetation carbon sequestration in China after 2010: A turning point resulting from climate and human interaction. Glob. Change Biol. 2021, 27, 5848–5864. [Google Scholar] [CrossRef]
- Gou, W.Y.; Zhao, J.Y.; Ma, X. Research on the Optimization Design of Residential Green Spaces in Xi’an Based on the Synergistic Impact of Carbon and Pollution. J. Xi’an Univ. Arch. Technol. 2022, 54, 450–458. [Google Scholar] [CrossRef]
- Dong, H.; Chen, Y.; Huang, X.; Cheng, S. Multi-scenario simulation of spatial structure and carbon sequestration evaluation in residential green space. Ecol. Indic. 2023, 154, 110902. [Google Scholar] [CrossRef]
- Chen, L.; Wang, Y.; Zhu, E.; Wu, H.; Feng, D. Carbon storage estimation and strategy optimization under low carbon objectives for urban attached green spaces. Sci. Total Environ. 2024, 923, 171507. [Google Scholar] [CrossRef]
- Jo, H.-K.; Kim, J.-Y.; Park, H.-M. Carbon reduction and planning strategies for urban parks in Seoul. Urban. For. Urban. Green. 2019, 41, 48–54. [Google Scholar] [CrossRef]
- Gratani, L.; Varone, L.; Bonito, A. Carbon sequestration of four urban parks in Rome. Urban. For. Urban. Green. 2016, 19, 184–193. [Google Scholar] [CrossRef]
- Liu, H.; Zhang, J.; Wang, Z. Assessing and optimizing the potential for climate change mitigation and carbon sequestration in urban residential green spaces: Energizing sustainable cities. Front. Environ. Sci. 2025, 13, 1519297. [Google Scholar] [CrossRef]
Disclaimer/Publisher’s Note: The statements, opinions and data contained in all publications are solely those of the individual author(s) and contributor(s) and not of MDPI and/or the editor(s). MDPI and/or the editor(s) disclaim responsibility for any injury to people or property resulting from any ideas, methods, instructions or products referred to in the content. |
© 2025 by the authors. Licensee MDPI, Basel, Switzerland. This article is an open access article distributed under the terms and conditions of the Creative Commons Attribution (CC BY) license (https://creativecommons.org/licenses/by/4.0/).