Article

Soil Moisture Loss in Planted Forests and Its Driving Factors: A Case Study of the Nanpan River Basin

1
School of Geography and Environmental Science, Guizhou Normal University, Guiyang 550001, China
2
National Engineering Technology Institute for Karst, School of Geography and Environmental Science, Guizhou Normal University, Guiyang 550001, China
*
Author to whom correspondence should be addressed.
Forests 2025, 16(4), 665; https://doi.org/10.3390/f16040665
Submission received: 24 February 2025 / Revised: 1 April 2025 / Accepted: 9 April 2025 / Published: 10 April 2025
(This article belongs to the Special Issue Forest Growth, Soil Properties and Climate)

Abstract

:
Soil moisture is a critical factor influencing the growth and development of terrestrial ecosystems and vegetation. In this study, we utilized data on meteorology, soil moisture, soil texture, and the spatial distribution of planted and natural forests to examine the spatial distribution characteristics of soil moisture across soils with varying textures and depths. Geodetector models were constructed to analyze the driving mechanisms behind soil moisture dynamics. The key findings are as follows: (1) Soil moisture consumption in planted forests was significantly higher than in natural forests, with the magnitude of the difference taking the following order: coarse-textured soils > medium-textured soils > fine-textured soils. (2) The spatial differentiation of moisture content across soil layers was primarily determined by the 10–40 cm layer, while soil moisture in the 0–10 cm layer was more strongly influenced by wind speed. (3) The dominant plantation species in the watershed, Eucalyptus and Cunninghamia, have main roots extending to depths of 100–200 cm. The presence of these species in this soil layer contributes significantly to the spatial differentiation of soil moisture. This study reveals that planted forests planting consumes huge amount of soil moisture and affects the spatial differentiation of soil moisture, which provides theoretical guidance for the management of ecological restoration projects in this area.

1. Introduction

Soil moisture plays a critical role in the soil–plant–atmosphere hydrological cycle and is a key factor influencing the growth and development of terrestrial ecosystems and organisms. It is primarily regulated by various factors, including climate, vegetation, topography, hydrological conditions, and soil physical properties [1]. Soil moisture provides the essential environment for vegetation, which absorbs water from different soil depths through its root systems to sustain growth and development. At the watershed scale, forest coverage is directly linked to the capacity of soil moisture retention and release, thereby influencing water storage and hydrological cycling within the watershed [2,3]. High forest coverage effectively regulates the distribution and cycling of soil moisture through multiple mechanisms, such as canopy interception, litter layer retention, root water uptake, and soil infiltration, enhancing the water storage and regulation capacity of the watershed [4,5]. These processes collectively facilitate the deep infiltration and storage of soil moisture, providing a stable water source for aquatic systems within the watershed.
However, the capacity of different forest types to utilize soil moisture exhibits significant variability [6,7,8,9,10]. Natural forests, characterized by their rich biodiversity, complex community structures, and robust soil conservation capabilities, demonstrate highly efficient strategies for soil moisture management and utilization [11,12]. In contrast, planted forests, which often consist of single-species stands with simplified structural configurations, exhibit distinct patterns of soil moisture absorption, evaporation, and utilization compared to natural forests [13]. These differences not only affect the dynamic balance of soil moisture, but also have profound implications for the allocation and utilization efficiency of water resources within watersheds. Numerous studies have confirmed that planted forests often exhibit a higher water uptake capacity than natural forests during their initial growth stages [14,15], primarily due to their elevated transpiration rates and rapid soil moisture depletion [16]. For instance, Liu et al., using long-term field observations, found that natural secondary forests enhanced the water retention capacity of deeper soil layers compared to coniferous plantations, with significant changes in the vertical distribution patterns of soil moisture [13]. This suggests that planted forests may exert a potential influence on the dynamic equilibrium of soil moisture. Qiu et al. further highlighted that planted forests rely heavily on external water inputs to sustain normal growth, as their high water consumption rates and soil evaporation losses can exacerbate water resource pressures within watersheds, thereby impacting their ecological service functions [17]. Therefore, investigating the response mechanisms of soil moisture to forest types and environmental factors is of critical importance for maintaining ecosystem balance.
Existing studies have integrated vegetation and environmental factors to analyze variations in soil moisture content. One approach treats the soil layer as a whole, investigating the spatial distribution patterns of soil moisture under different vegetation cover types and their underlying mechanisms [18,19]. Another approach involves stratifying the soil and analyzing the response of soil moisture at different layers to vegetation restoration [8,20,21]. However, the rooting depths of planted forests and natural forests differ, leading to inconsistent responses to soil moisture across various soil layers. Consequently, the vertical profiles of soil moisture exhibit distinct patterns between planted and natural forests.
Existing studies have not adequately considered the variations in soil moisture along vertical profiles or their distinct driving factors, which limits the ability to fully capture the response mechanisms of soil moisture across different soil layers. Therefore, an in-depth investigation into the responses of soil moisture to forest attributes at both horizontal and vertical levels, as well as their driving factors, is essential. Such research not only helps reveal the dynamics of water in plantation ecosystems under the dual pressures of climate change and human activities, but also provides a scientific basis for formulating rational forest management policies, optimizing the structural layout of plantations, and improving soil moisture utilization efficiency. This is of significant importance for safeguarding regional water resource security, promoting the sustainable development of plantations, and achieving harmonious coexistence between humans and nature.
The Nanpan River Basin, as a typical ecologically fragile region, has been significantly impacted by human activities. Since 1990, the area of planted forests in this region has expanded considerably, particularly with the widespread cultivation of fast-growing tree species such as Eucalyptus and Fir, which has profoundly influenced regional hydrological processes. Concurrently, the Nanpan River Basin has experienced a notable decline in rainfall since 1990, along with an increased frequency of drought events, exerting dual pressures on soil moisture dynamics and river hydrological processes. Moreover, the Nanpan River Basin is located in a karst landform, where ecosystem vulnerability is pronounced. The issue of soil moisture loss poses a serious challenge to regional ecological security and sustainable development [22]. Therefore, selecting the Nanpan River Basin as the study area is not only representative and exemplary, but also provides crucial scientific references for forest ecosystem management and ecological restoration practices in similar ecologically fragile regions.
Soil moisture in the Nanpan River Basin exhibits significant spatial heterogeneity, and the geographical detector method can effectively reveal its spatial distribution characteristics and driving factors. This approach quantifies the influence of driving factors such as rainfall and vegetation type, identifying key determinants. Additionally, the geographical detector can uncover interaction effects between factors, shedding light on the mechanisms of soil moisture loss under complex environmental conditions.
The purpose of this paper is to investigate the soil moisture depletion induced by planted forests and its underlying driving mechanisms. By comparing soil moisture content at different depths between planted and natural forests, the responses of soil moisture to different forest types were quantified. Additionally, geodetector analysis was employed to explore the driving factors behind the spatial heterogeneity of soil moisture at various depths and to elucidate the intrinsic causes of these variations. This study aims to address the following three key questions: (1) What are the spatiotemporal variation characteristics of soil moisture content in planted forests versus natural forests in the Nanpan River Basin? (2) How does soil moisture content differ between planted and natural forests across different soil layers? (3) What are the primary driving factors behind soil moisture loss in the Nanpan River Basin?

2. Materials and Methods

2.1. Study Area

The Nanpan River Basin is located in southwestern China, spanning longitude 102°10′–106°10′ E and latitude 23°04′–26°00′ N (Figure 1). Situated on the southeastern edge of the Yunnan-Guizhou Plateau, it features complex terrain with higher elevations in the northwest and lower in the southeast. The basin has a subtropical monsoon climate, with an average annual temperature of 14–20 °C and annual rainfall of 1000–1400 mm. Precipitation is unevenly distributed, with over 70% occurring in the rainy season (May–October), while the dry season (November–April) sees minimal rainfall. Since 1990, the area of commercial plantations (e.g., Eucalyptus, Fir) has expanded significantly, accounting for over 30% of the basin’s total forest area by 2020. Large-scale plantations have led to 15% decline in natural vegetation cover and 20% increase in soil erosion. Additionally, land-use changes have intensified water resource stress and significantly degraded ecosystem services.

2.2. Research Data and Methodology

2.2.1. Soil Texture Data

The soil texture data in this study were obtained from the Harmonized World Soil Database (HWSD) developed by the Food and Agriculture Organization (FAO) of the United Nations (http://www.fao.org/soils-portal/soil-survey/soil-maps-and-databases, accessed on 5 October 2024). This database provides global soil texture data and has been widely used due to its high precision and accuracy [23], categorizing soil textures into three simplified classes: coarse-textured (sands, loamy sands, and sandy loams with <18% clay and >65% sand), medium-textured (sandy loams, loams, sandy clay loams, silt loams, silt, silty clay loams, and clay loams with <35% clay and <65% sand (sand content may reach up to 82% if clay content is ≥18%)), and fine-textured (clays, silty clays, sandy clays, clay loams, and silty clay loams with >35% clay). Using ArcGIS 10.8, the data were processed through conversion, extraction, and clipping to generate a 1 km spatial resolution dataset.

2.2.2. Soil Moisture and Meteorological Data

The soil moisture and meteorological data (precipitation, temperature, evapotranspiration, and wind speed) used in this study were obtained from the GLDAS_NOAH025_M dataset (https://search.earthdata.nasa.gov/search/, accessed on 11 October 2024). This dataset offers extensive temporal coverage and high spatial resolution, with its accuracy in simulating soil moisture dynamics widely validated [24]. Given that the Nanpan River Basin is located in a karst region with thin soil layers, this study focuses on the 0–200 cm soil depth for analysis. Given the karst geology and thin soil layers of the Nanpan River Basin, this analysis focuses on the 0–200 cm soil depth, vertically divided into four layers: 0–10 cm, 10–40 cm, 40–100 cm, and 100–200 cm. The original data (monthly temporal resolution, 0.25° × 0.25° spatial resolution) spanned 2000–2023 and were preprocessed in ArcGIS 10.8 through mosaicking, outlier removal, and pixel-wise bilinear interpolation, yielding a final spatial resolution of 1 km.

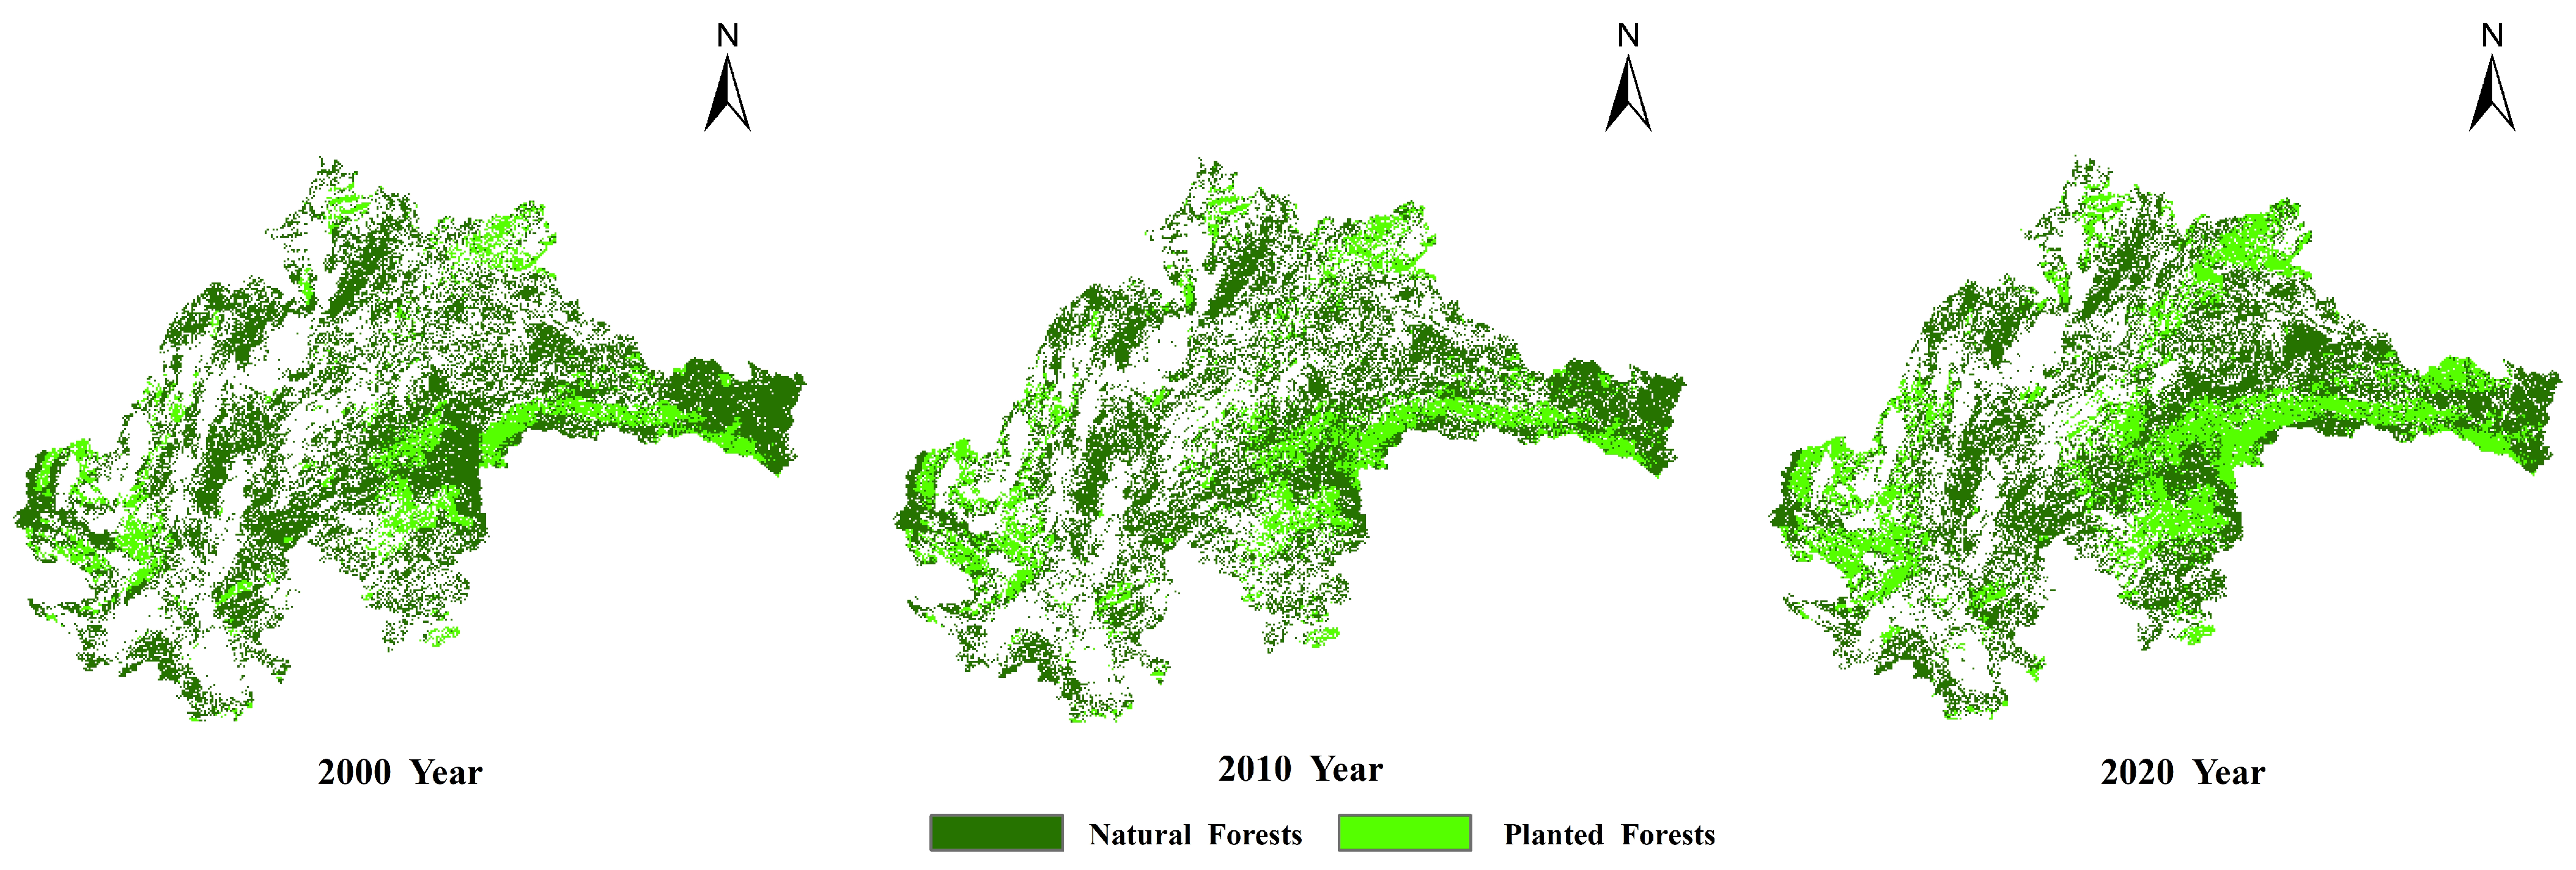
2.2.3. Data on Planted and Natural Forests

The data of planted forests and natural forests in this paper were obtained from the spatial distribution dataset of planted forests in Guo Qinghua’s group at Peking University (https://www.3decology.org/, accessed on 8 October 2024), with spatial coverage of the whole China, spanning the period 2000–2020, and with a spatial resolution of 1 km. Figure 2 shows the spatial distribution of planted and natural forests. The raster data of planted and natural forests were extracted to points, followed by the extraction of soil moisture values for each layer. The arithmetic mean was then calculated monthly to obtain the monthly soil moisture content for each layer in both planted and natural forest areas.

2.2.4. Linear Trend Analysis

A.
Calculation of Trend Slopes
Ordinary least squares (OLS) linear regression was applied to fit the time series for each pixel.
y i , j , t = β 0 , i , j + β 1 , i , j t + ε i , j , t
In the equation: β 0 , i , j represents the intercept, denotes the estimated soil moisture value for the baseline year; β 1 , i , j represents the trend slope, indicating the interannual variation rate of soil moisture; and ε i , j , t the error term, assumed to follow ε i , j , t ~ N ( 0 , σ 2 ) .
β = t = 2000 2023 ( t t ) ( y i , j , t y i , j ) t = 2000 2023 ( t t ) 2
In the equation: t is the time average and y i , j is the spatial mean per pixel.
B.
Trend Significance Testing
The t test was employed to assess the statistical significance of trends.
t i j = β 1 , i , j S E ( β 1 , i , j )
p i , j = 2 × P ( T n 2 > | t i , j | )
In the equation: S E represents the standard error, Tn − 2 denotes the degrees of freedom and n 2 = 22 follows the t distribution.
Significance determination: If p i , j < 0.05 , the trend is considered statistically significant; otherwise, it is non-significant.

2.2.5. Geodetectors

The geodetector is a statistical tool designed to identify spatial heterogeneity in geographical phenomena and reveal their underlying driving mechanisms [25]. Its fundamental principle is that when an independent variable significantly influences a dependent variable, their spatial distributions often exhibit a certain degree of similarity [26]. The geodetector comprises four core functions: the differentiation and factor detector, interaction detector, risk detector, and ecological detector. In this study, the factor detector and interaction detector modules were employed to assess the influence of meteorological and forest attribute factors on the spatial heterogeneity of soil moisture. The calculation formula for the factor detector is as follows:
Q = 1 ( h = 1 n N h σ h 2 N σ 2 )
In the formula, Q represents the influence of a factor on the spatial heterogeneity of soil moisture, with values ranging between [0, 1]. A higher Q value indicates a greater influence of the factor on the spatial heterogeneity of soil moisture. h (1, 2, …, n) is the number of subregions of the detection factor X, n is the stratification of the variable and N and N h are the total number of samples and the number of samples in region h , respectively, σ 2 and σ h 2 are the variance of the total region and the variance of the region, respectively. Interaction detection Q is computed in the same way as factor detection Q .

3. Results

3.1. Spatiotemporal Evolution Characteristics of Soil Moisture

The study area showed the highest soil moisture content in the central region and the lowest in the southwest, with moisture gradually decreasing from the center outward. Specifically, the 0–10 cm soil layer (Figure 3a) had maximum moisture (35.36 kg/m2) in the northeast and minimum (29.54 kg/m2) in the southwest; the 10–40 cm layer (Figure 3b) decreased radially from center, peaking in the north (109.36 kg/m2) and reaching its lowest in the south (91.59 kg/m2); the 40–100 cm layer (Figure 3c) ranged from 182.82 to 219.77 kg/m2, while the 100–200 cm layer (Figure 3d) varied between 309.22 and 372.48 kg/m2. From 2000 to 2023, annual soil moisture trends (Figure 3e–h) showed that 2023 had the lowest values, followed by 2011, with an overall decreasing trend (Figure 3i–l). Soil moisture content increases were mainly concentrated in eastern areas, while western regions predominantly showed decreases, with the most significant variations occurring in the 10–40 cm and 100–200 cm layers.

3.2. Soil Moisture Responses to Composite Factors by Forest Attributes

3.2.1. Soil Moisture Response in Horizontal Soil Layers by Forest Attributes

In coarse-textured soil types, the soil moisture content in natural forests is generally higher than that in planted forests (Figure 4a–d). The minimum moisture content in different soil layers occurs in different months, March for the 0–10 cm layer (Figure 4a), April for the 10–40 cm layer (Figure 4b), and May for both the 40–100 cm (Figure 4c) and 100–200 cm layers (Figure 4d), which shows that changes in soil moisture exhibit a lag effect as soil depth increases. In the 0–10 cm layer, planted forests show significantly lower moisture than natural forests from April to July, with the peak difference (1.60 kg/m2) occurring in June. The 10–40 cm layer maintains consistently higher moisture in natural forests year-round, with the growing season (March–July) showing the greatest differences, particularly in June (5.07 kg/m2). Similarly, the 40–100 cm layer exhibits higher moisture in natural forests throughout the year, with more pronounced differences than shallower layers, reaching 13.35 kg/m2 in June. In the 100–200 cm layer displays the most significant contrasts, with natural forests maintaining substantially higher moisture levels year-round, peaking in July (31.31 kg/m2 difference) markedly greater than variations in other layers.
In medium-textured soil types, the trends in soil moisture changes differ from those in coarse-textured (Figure 5a–d). In the 0–10 cm layer (Figure 5a), the soil moisture content in planted forests is higher than that in natural forests from November to June, while from July to October, the soil moisture content in natural forests exceeds that in planted forests. The trends in the 10–40 cm (Figure 5b) and 40–100 cm layers (Figure 5c) are consistent with those in the 0–10 cm layer. In the 100–200 cm layer (Figure 5d), the soil moisture content in natural forests is higher than that in planted forests throughout the year, with smaller differences observed between July and August and larger differences in the remaining months. The minimum moisture content in different soil layers occurs in different months: March for the 0–10 cm layer, March for the 10–40 cm layer, April for the 40–100 cm layer, and May for the 100–200 cm layer. This indicates that, in medium-textured soils, the water infiltration between soil layers occurs faster than in coarse-textured and fine-textured soils.
In fine-textured soil types, the soil moisture content in natural forests is generally higher than that in planted forests, and the difference becomes more pronounced with increasing soil depth (Figure 6a–d). For the 0–10 cm layer (Figure 6a), the difference in soil moisture between natural forests and planted forests is most significant during the rainy season from June to August. Compared to coarse-textured soils, the difference in soil moisture content between natural forests and planted forests is relatively smaller. The trends in the 10–40 cm (Figure 6b), 40–100 cm (Figure 6c), and 100–200 cm (Figure 6d) layers are consistent with those in the 0–10 cm layer, but the difference in soil moisture content between planted forests and natural forests becomes increasingly evident as the soil depth increases. Similarly to coarse-textured soil types, the minimum moisture content in different soil layers occurs in different months: March for the 0–10 cm layer, March for the 10–40 cm layer, and May for both the 40–100 cm and 100–200 cm layers. This suggests that soil moisture changes in fine-textured soils also exhibit a lag effect with increasing soil depth.

3.2.2. Soil Moisture Response in Vertical Soil Layers by Forest Attributes

The soil moisture content at different depths was statistically analyzed for coarse-textured, medium-textured, and fine-textured soil types (Figure 7, Figure 8 and Figure 9). In coarse-textured soils (Figure 7), the soil moisture content in natural forests is significantly higher than that in planted forests. As the vertical soil depth increases, the soil moisture content also increases, with the rate of increase being higher in natural forests compared to planted forests. This trend is most pronounced from June to August.
In medium-textured soil types (Figure 8), the trends in soil moisture content between planted forests and natural forests, as soil depth increases, differ from those observed in coarse-textured and fine-textured soils. Specifically, as the soil depth increases from 0 to 100 cm, the soil moisture content in planted forests is higher than that in natural forests from January to June, while from July to October, the soil moisture content in natural forests exceeds that in planted forests. From November to December, the soil moisture content in both forest types remains relatively balanced. However, when the soil depth increases from 100 cm to 200 cm, the soil moisture content in natural forests is higher than that in planted forests throughout the year, with a significant decline in soil moisture content observed in planted forests.
In fine-textured soil types (Figure 9), the soil moisture content in natural forests is slightly higher than that in planted forests across all soil layers. Compared to the vertical profile of soil moisture content in coarse-textured soils, the difference in the rate of soil moisture content increase between planted forests and natural forests in fine-textured soils is relatively small. The difference in the rate of increase is only more pronounced from June to August, during which the rate of increase in natural forests is higher than that in planted forests.

3.3. Driving Factors of Soil Moisture Changes

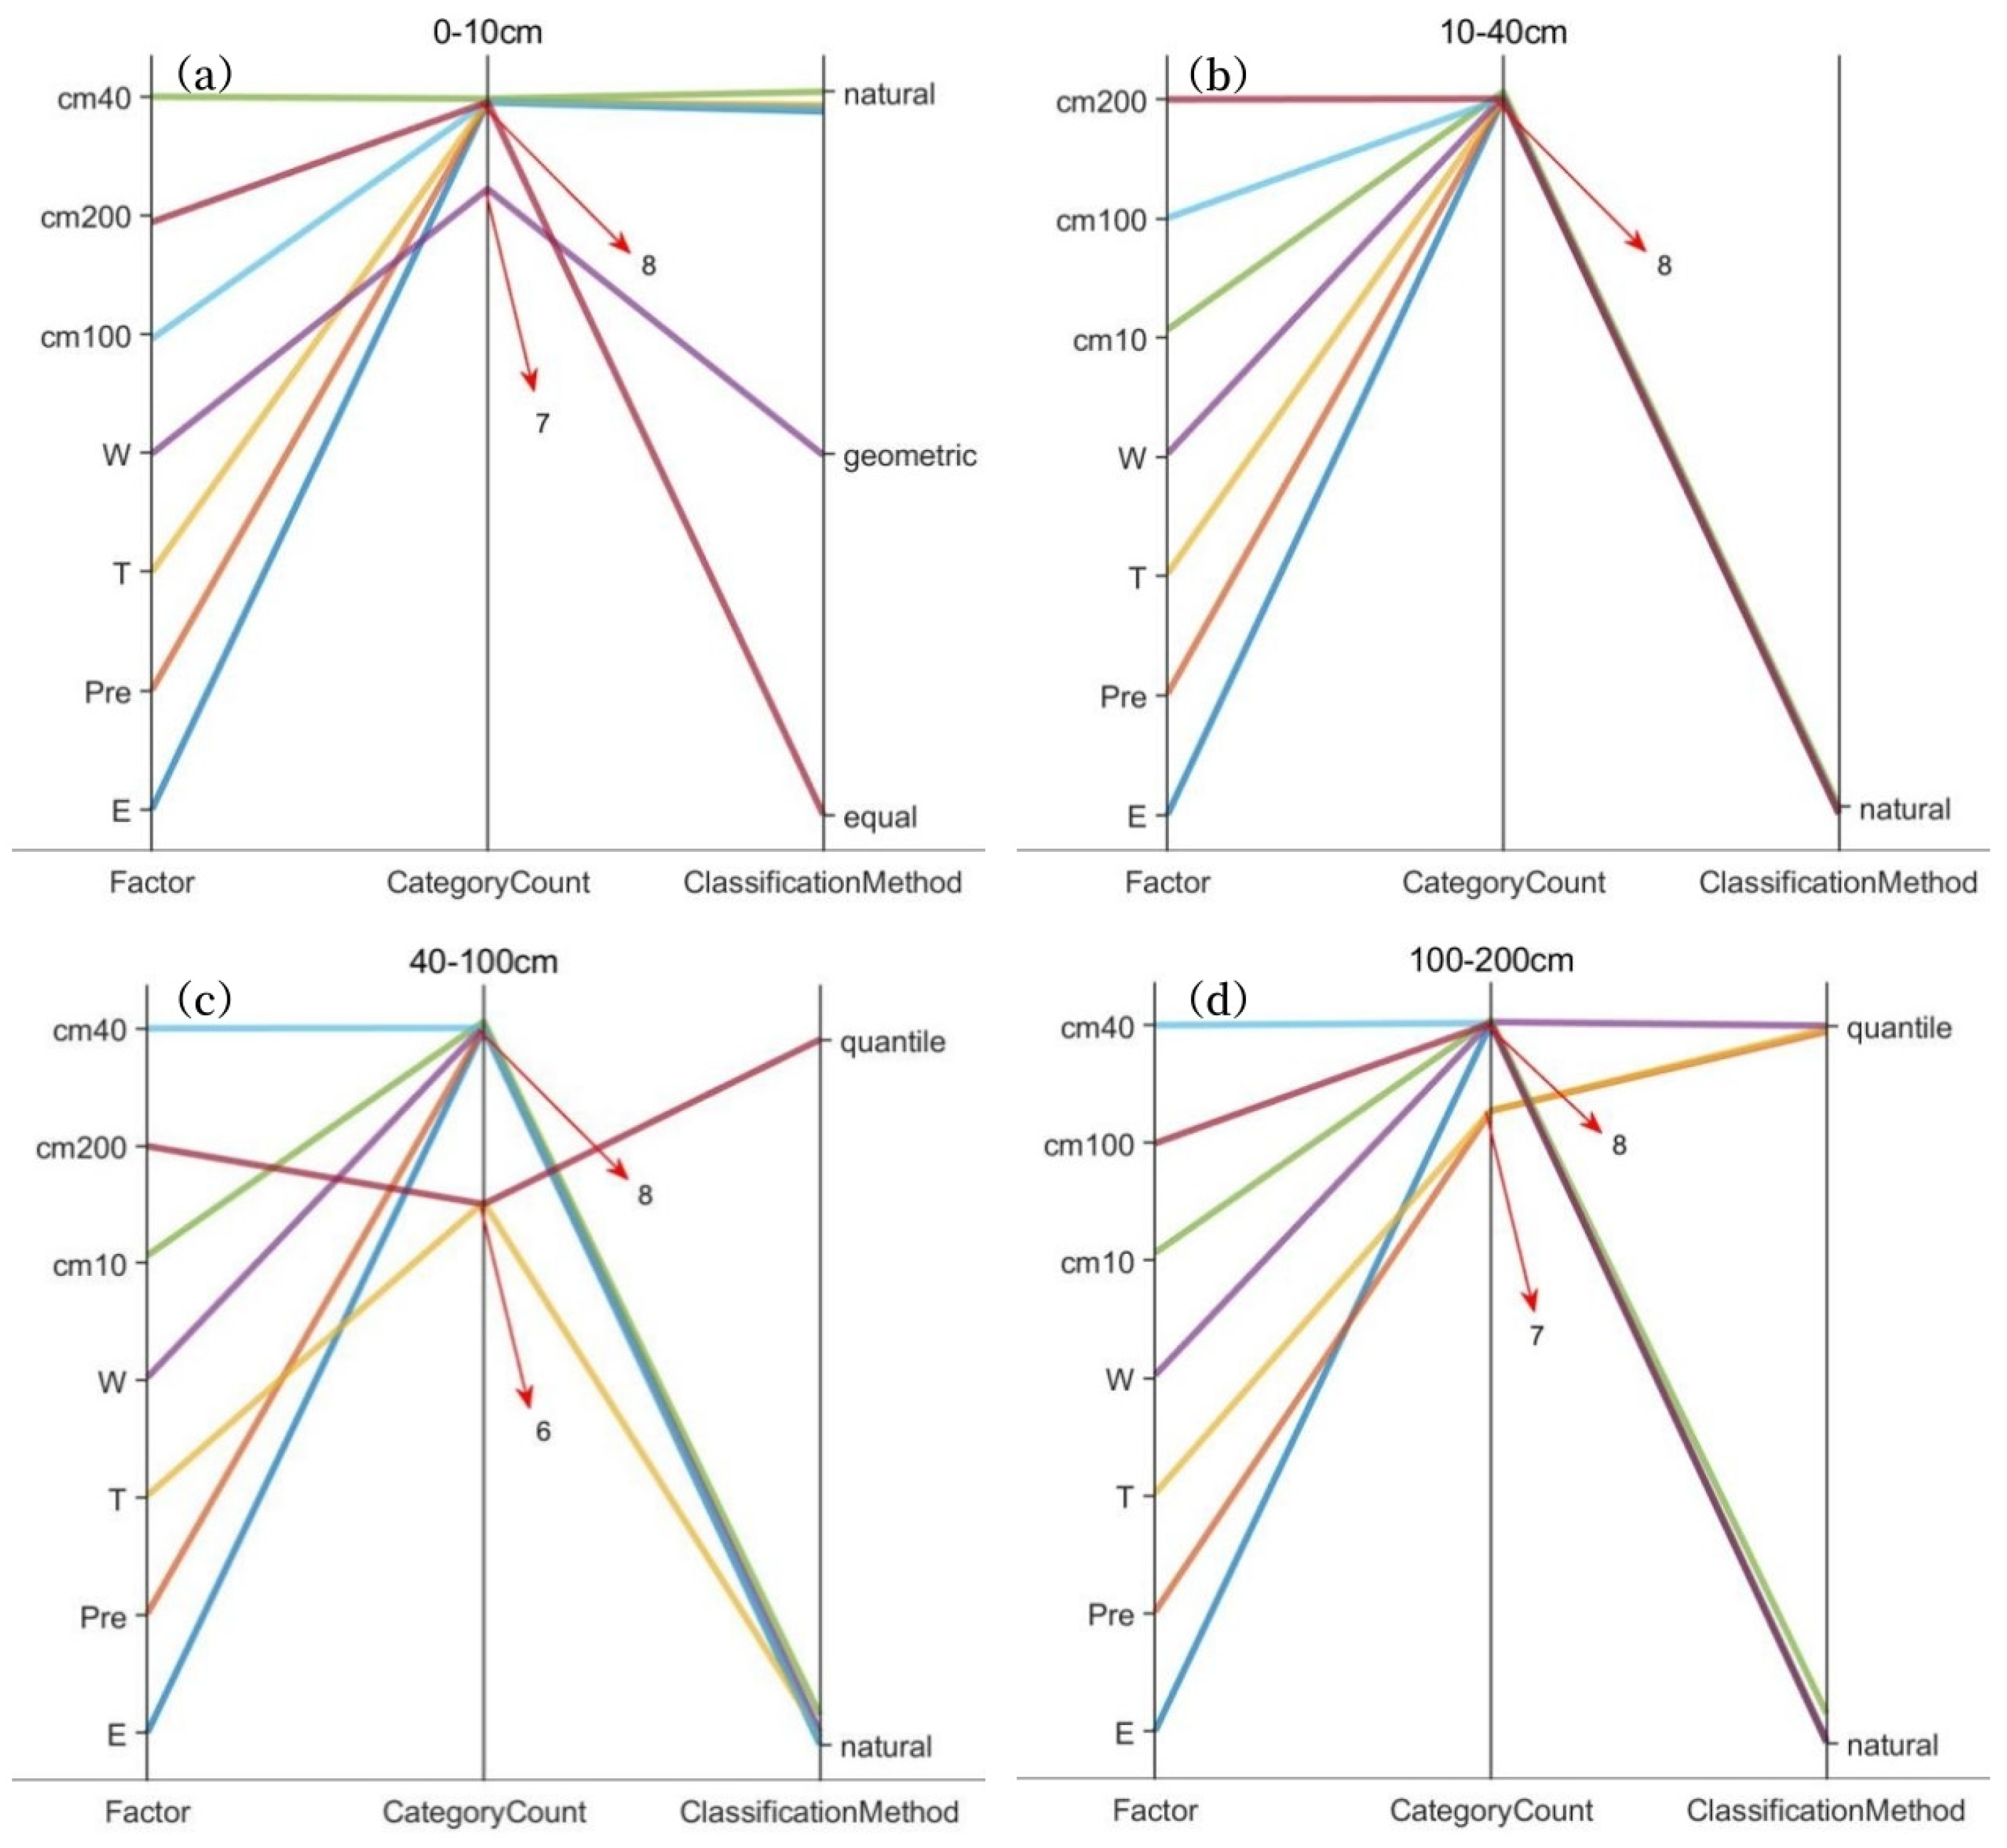
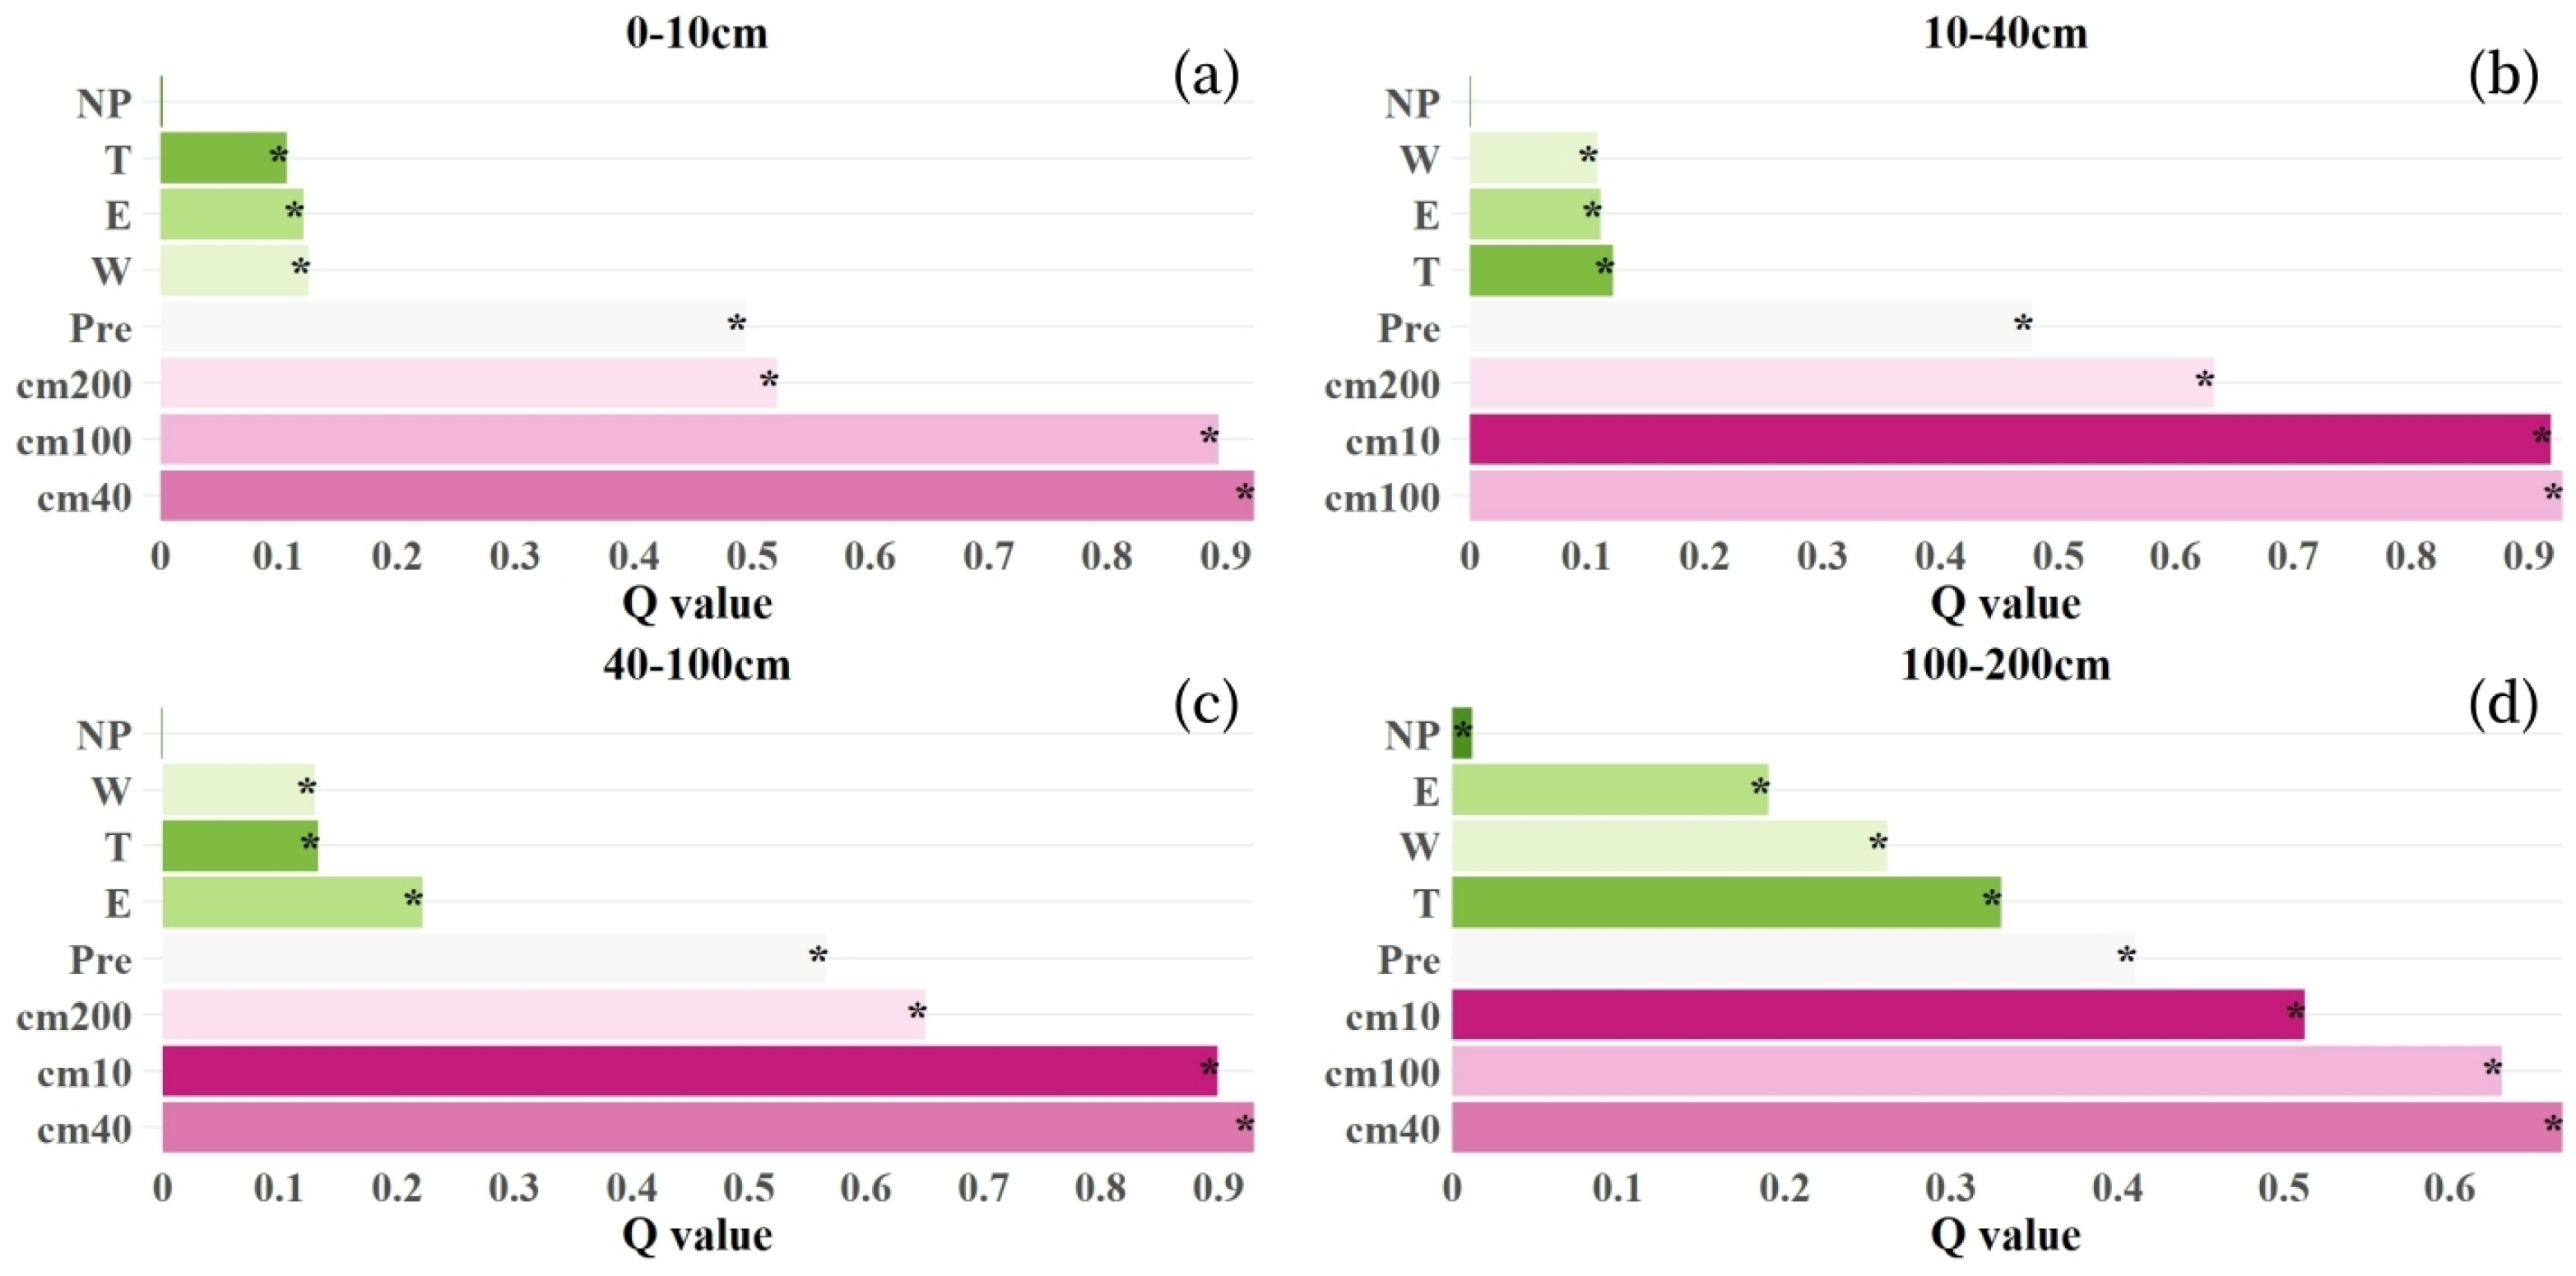
3.3.1. Spatial Pattern Differentiation and Factor Detection

In addition to the inter-layer water infiltration, human activities (forest attributes) and local meteorological factors (precipitation, temperature, evapotranspiration, and wind speed) also influence the spatiotemporal variation in soil moisture content. In the geographical detector, different discretization methods (equal interval, natural breaks, quantile breaks, and geometric breaks) have a significant impact on the detection results. Furthermore, determining the optimal parameter combination for the number of breaks to maximize the Q-value (with the parameter combination based on the maximum Q-value as the criterion) is a key challenge in geographical detector analysis. Given this, this study first optimizes the selection of discretization methods and the parameter combinations for the number of breaks. Subsequently, based on this optimization, this study investigates the effects of various influencing factors and their interactions on soil moisture at different depths from 2000 to 2023, revealing the dominant factors influencing the spatial differentiation of soil moisture content in the Nanpan River Basin at a local scale.
The optimal number of breaks for factors in each soil layer ranges from 6 to 8. The natural breaks method is the best discretization method for most factors. For the 0–10 cm soil layer, the best discretization methods for factors are the equal interval and geometric breaks methods for the 100–200 cm soil layer moisture content and W (wind speed). The quantile breaks method is optimal for the 100–200 cm soil layer moisture content factor in the 40–100 cm soil layer and for the W and T (temperature) factors in the 100–200 cm soil layer (Figure 10a–d).
Apart from inter-layer water infiltration, precipitation is the most influential factor on the spatial pattern of soil moisture variation. Forest attributes (natural forests and planted forests) only pass the significance test in the 100–200 cm soil layer. As soil depth increases, the influence of T (temperature) on the spatial differentiation of soil moisture variation gradually increases (Figure 11a–d). In the 0–10 cm layer (Figure 11a), the influence (Q-value) of each detection factor on soil moisture, from smallest to largest, is as follows: 40 cm (92.36%) > 100 cm (89.37%) > 200 cm (52.14%) > Pre (precipitation, 49.43%) > W (12.56%) > E (evapotranspiration, 12.06%) > T (10.73%) > NP (forest attributes, 0.24%), with forest attributes (NP) failing the significance test. In the 10–40 cm layer (Figure 11b), the Q-values of the detection factors are as follows: 100 cm (92.81%) > 10 cm (91.86%) > 200 cm (63.22%) > Pre (47.79%) > T (12.20%) > E (11.15%) > W (10.82%) > NP (0.16%). In the 40–100 cm soil layer (Figure 11c), the Q-values are as follows: 40 cm (93%) > 10 cm (89.95%) > 200 cm (65.05%) > Pre (56.60%) > E (22.19%) > T (13.30%) > W (13.05%) > NP (0.06%). In the 100–200 cm soil layer (Figure 11d), the Q-values are as follows: 40 cm (66.72%) > 100 cm (63.13%) > 10 cm (51.26%) > Pre (41.06%) > T (33%) > W (26.16%) > E (19.04%) > NP (1.17%).

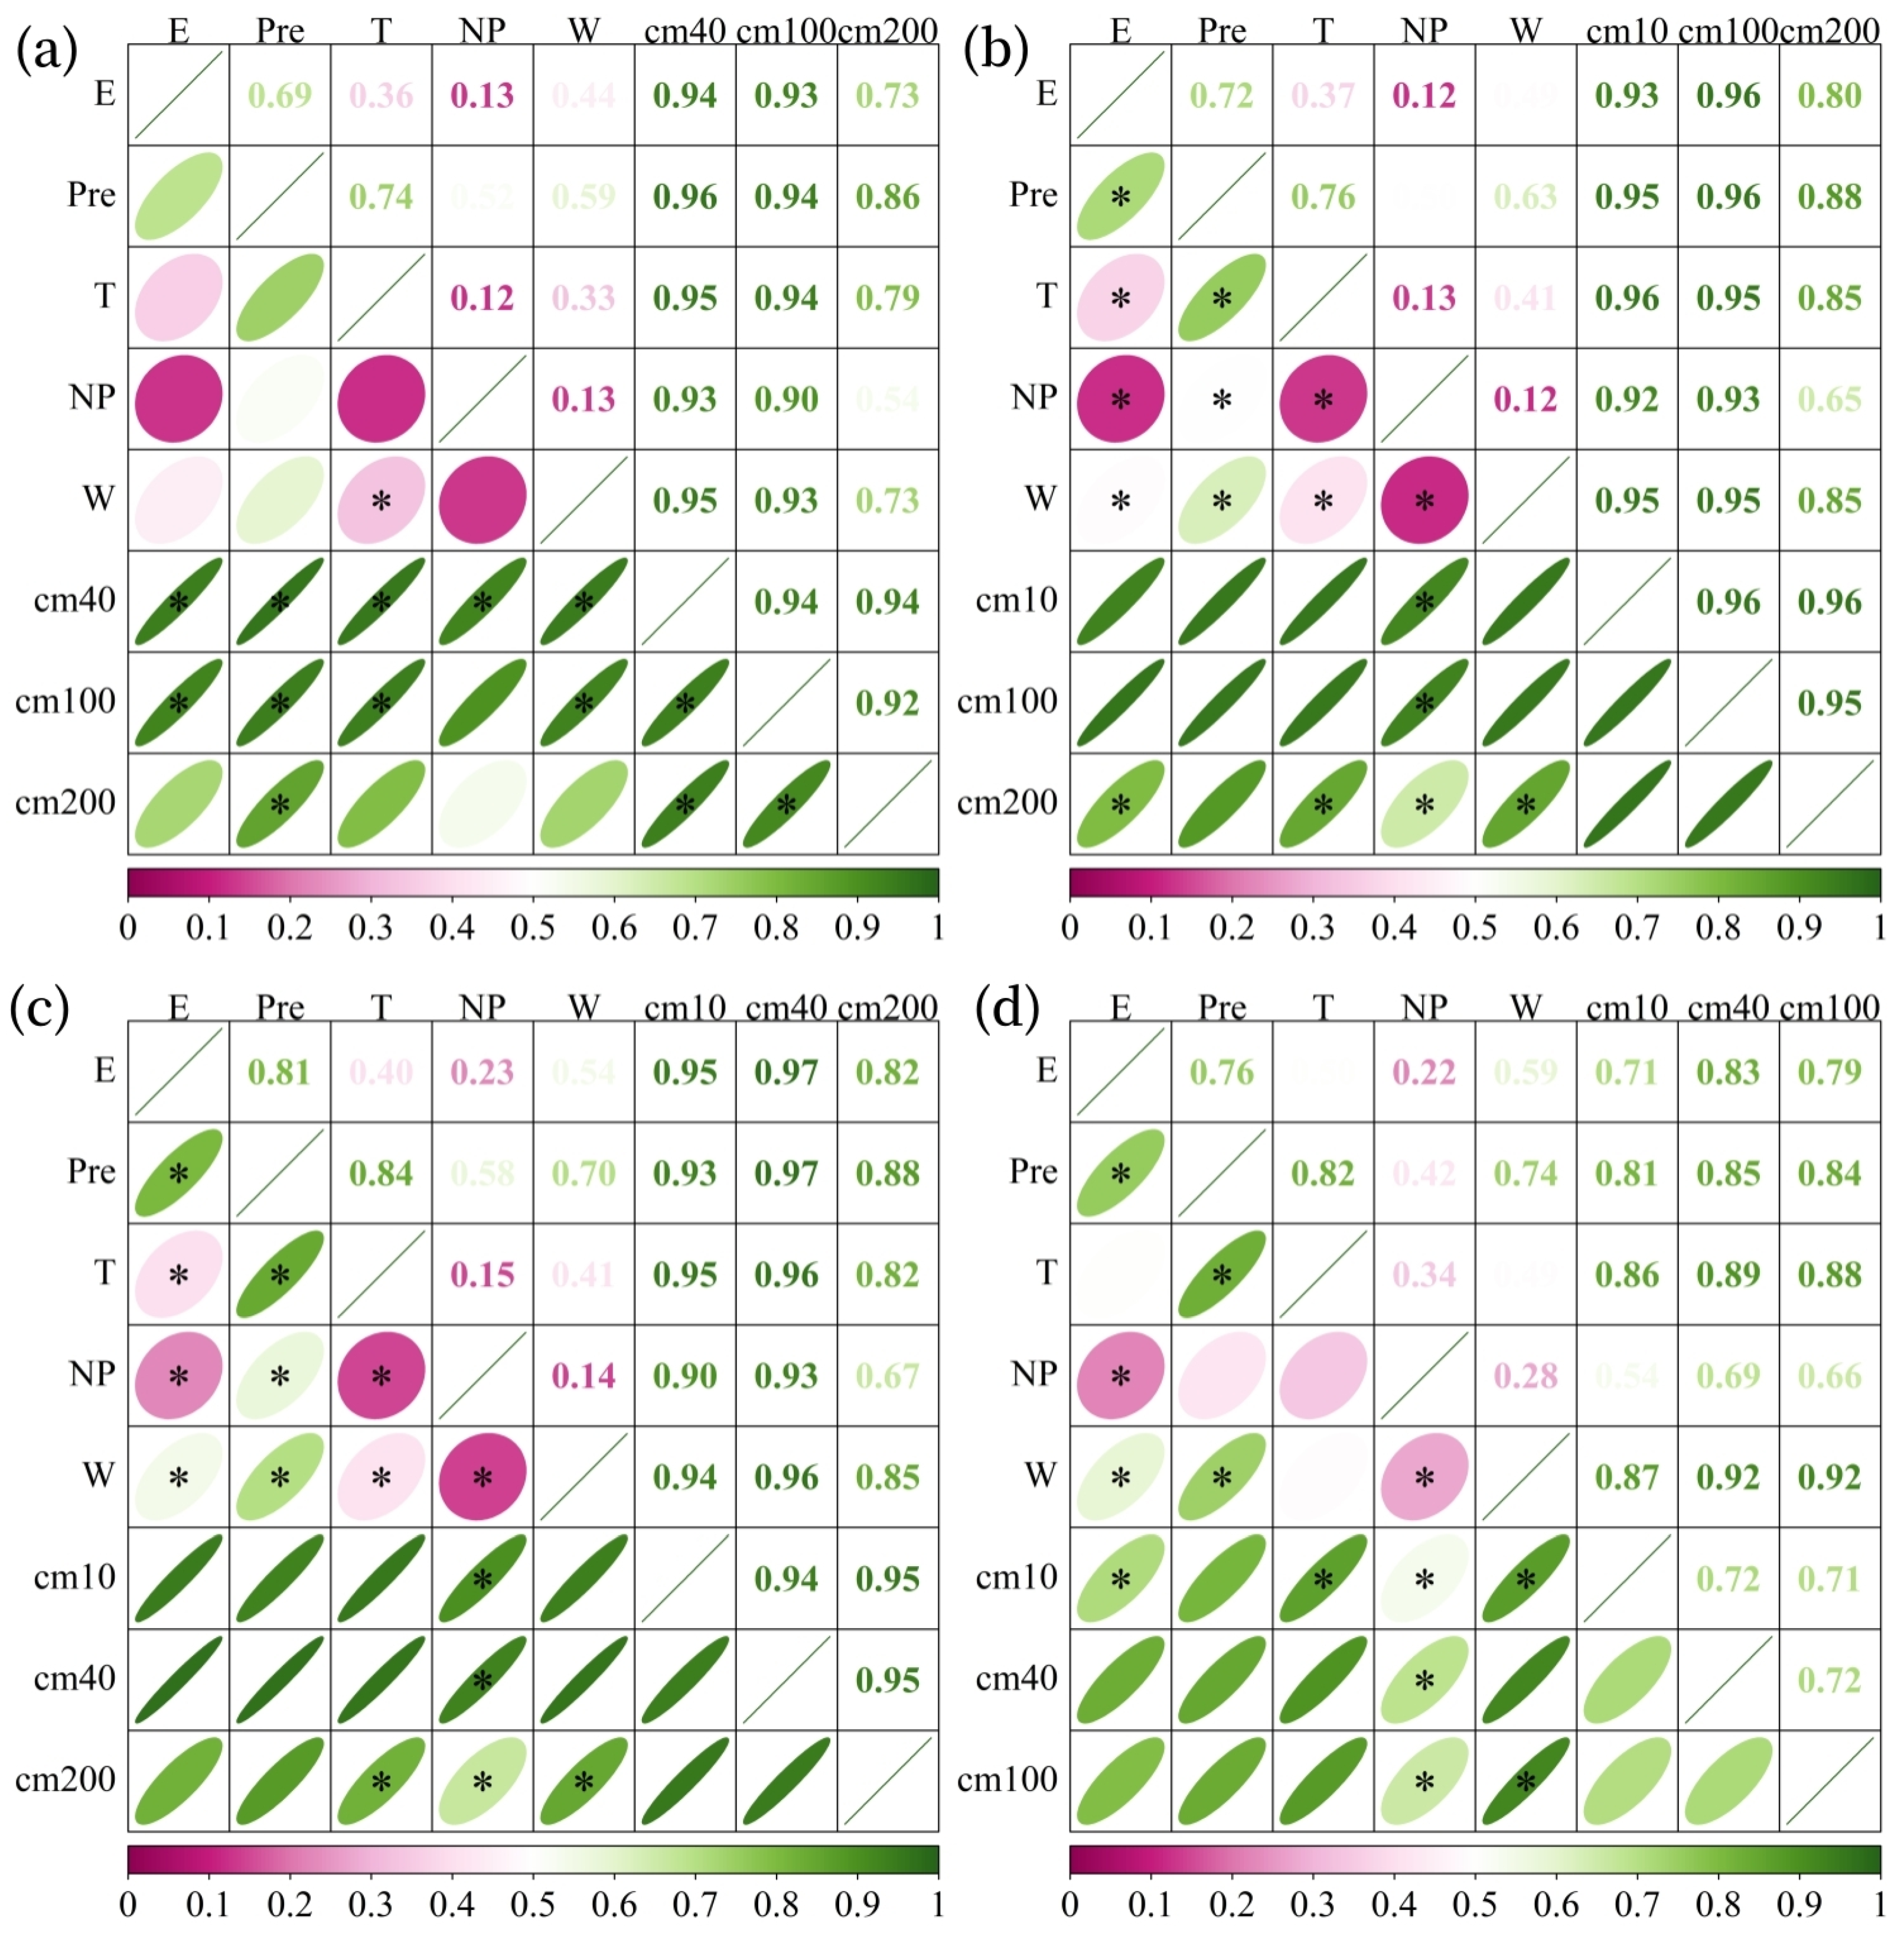
3.3.2. Interaction Effects on the Spatial Patterns

The interaction detection results reveal that all factor interactions exhibit an enhancement effect (Figure 12a–d), meaning that the Q-values of interactions between different factors are greater than those of individual factors. For the 0–10 cm soil layer (Figure 12a), the primary driving factors of soil moisture content are the interactions of 40 cm∩Pre (precipitation, 96.38%), 40 cm∩T (temperature, 95.28%), and 40 cm∩W (wind speed, 94.59%). The interactions between the 10–40 cm soil moisture content layer and other factors all exceed 90%, indicating that the moisture content of the lower soil layer significantly influences that of the upper soil layer. Additionally, the interactions between precipitation and other factors also exceed 50%, highlighting the strong influence of precipitation on soil moisture content. The interaction with the lowest influence is NP∩T (forest attributes∩temperature, 12%), which aligns with the results of single-factor detection.
In the 10–40 cm soil layer (Figure 12b), compared to other soil layers, the interactions between factors are primarily nonlinearly enhanced. The interactions between the upper 0–10 cm and lower 40–100 cm soil moisture content and other factors all exceed 90%, showing a linearly enhancing trend with all factors except NP (forest attributes). From 0 to 100 cm, as soil depth increases, the interactions between precipitation and other factors generally strengthen, while from 100 to 200 cm, these interactions gradually weaken. Across the entire soil profile, the interactions of NP∩E (forest attributes∩evapotranspiration), NP∩T, and NP∩W show an increasing trend, whereas NP∩Pre exhibits a decreasing trend.

4. Discussion

4.1. Analysis of Data and Model Applicability

The soil moisture data utilized in this study has been widely adopted in previous research, and the results obtained effectively reflect the actual variations in soil moisture conditions [27,28]. The data for planted forests and natural forests were sourced from the spatial distribution dataset of planted forests developed by Professor Qinghua Guo’s research group at Peking University. This dataset integrates over 600,000 field-measured samples and has been compared with the planted forest maps from the National Forest Inventory and the reported data in the *National Forestry Statistical Yearbook*. The comparisons reveal minimal discrepancies in area and a significant positive correlation (correlation coefficients ranging from 0.8 to 0.9, p < 0.01), indicating high data reliability and suitability for this study [29,30].

4.2. Response of Soil Moisture to Soil Texture

The coarser the soil texture, the larger the gaps between particles, resulting in a more porous structure that facilitates rapid water infiltration and drainage, but is less conducive to water retention [31].
On a horizontal level, the variation in soil moisture between the two forest types (planted and natural forests) at the same depth but with different soil textures is quite pronounced. Vegetation growth and development require the combined effects of soil, air, and moisture [32]. Medium-textured soils exhibit good water retention and aeration properties. Compared to planted forests, natural forests are characterized by a rich understory of shrubs and herbaceous plants, most of which root in the shallow soil layers [33]. Consequently, during the peak growing season from January to May, the soil moisture content in the 0–100 cm layer of medium-textured soils is higher in planted forests than in natural forests. From June to September, when rainfall is more abundant, the difference between the two forest types becomes less noticeable. Due to the poor water retention capacity of coarse-textured soils, the consumption of soil moisture by planted forests is more pronounced compared to medium- and fine-textured soils [34]. In the Nanpan River Basin, planted forests primarily consist of economic tree species such as Eucalyptus and Cunninghamia, with their main root systems concentrated at depths of 100–200 cm [35]. Their consumption of soil moisture is significantly higher than that of natural forests across all soil textures.
On a vertical level, the soil moisture content in both planted and natural forests increases with soil depth. However, the variation in soil moisture content between planted and natural forests across the 0–200 cm depth range differs depending on soil texture. As soil depth increases, the difference in soil moisture content between planted and natural forests becomes more pronounced in coarse-textured soils, followed by medium-textured soils, and is least noticeable in fine-textured soils. This is because coarse-textured soils have poor water retention, and the strong water uptake capacity of planted forests leads to a significant decline in soil moisture. In contrast, fine-textured soils have strong water retention and uniform moisture distribution, so noticeable differences are only observed in the 100–200 cm layer, where the root systems of planted forests are most concentrated. Medium-textured soils, with water retention and aeration properties intermediate between coarse- and fine-textured soils, exhibit changes in soil moisture content that also fall between the two extremes [36].

4.3. Driving Factors of Soil Moisture Content Variation

The single-factor detection results indicate that the subsoil layer (10–40 cm) is the dominant factor influencing soil moisture content across all layers. This is because the subsoil layer lies beneath the topsoil layer (0–10 cm) and is primarily formed by the leaching of materials from the topsoil. It contains a higher proportion of clay particles and minerals, making it the main storage layer for soil nutrients [37]. In contrast, the deeper soil layers (below 40 cm) are less influenced by surface climate conditions, and the transformation of materials occurs more slowly, resulting in fewer available nutrients. Additionally, as depth increases, soil compaction increases, and the permeability of water and air decreases [38]. Therefore, the moisture content in these deeper layers is mainly influenced by the subsoil layer and groundwater. The subsoil layer can supply water to the upper soil layers during dry periods and store excess water during rainy periods. Within the soil, water moves between soil particles through capillary action, and, as an intermediate layer, the moisture content and transmission capacity of the subsoil directly affect the moisture conditions of both the upper and lower soil layers.
The influence of meteorological factors on soil moisture content varies across different soil layers. For the subsoil layer, apart from precipitation, the dominant meteorological factors are wind speed and evapotranspiration. This is because the topsoil layer is in direct contact with the atmosphere, making it most significantly affected by wind speed. Evaporation from the topsoil is intense, especially under high wind speeds, where rapid air movement enhances atmospheric evaporation, leading to a quick reduction in topsoil moisture [39].
The impact of planted forests and natural forests on the spatial pattern of soil moisture is more pronounced in vertical stratification. Forest attributes (natural vs. planted forests) only pass the significance test in the 100–200 cm soil layer in the geographical detector, indicating that forest attributes influence the spatial differentiation of soil moisture in this layer. This is because the main root systems of the dominant economic tree species in the Nanpan River Basin, such as Eucalyptus and Cunninghamia, are concentrated at depths of 100–200 cm. These trees extensively absorb and deplete soil moisture in this layer to sustain their growth and development, thereby influencing the spatial distribution of soil moisture across the basin [26]. Furthermore, when forest attributes interact with meteorological factors, the interaction intensity strengthens progressively with increasing soil depth. Notably, the nature of these interactions shifts from nonlinear to linear enhancement as depth increases across different soil layers. Compared to single-factor effects, dual-factor interactions exert more substantial influence on the spatial distribution of soil moisture. This phenomenon reflects the significant impact of root system architecture in both plantations and natural forests on soil moisture regulation, likely attributable to higher soil compaction, reduced permeability, and lower vegetation diversity in managed forests. From an ecohydrological perspective, plantation management should prioritize optimizing vegetation structure and soil properties to enhance water use efficiency and ecosystem stability. These findings provide critical scientific support for developing sustainable plantation management strategies.

4.4. Limitations and Future Work

In this study, by fixing soil texture and forest attributes in the Nanpan River Basin and considering climatic factors and soil moisture conditions across different layers, we have determined the soil moisture consumption patterns of planted forests and natural forests, as well as the driving factors of soil moisture content in each layer. However, the types of planted forests and natural forests may vary across different basins. Therefore, the conclusion that forest attributes significantly influence the spatial differentiation of soil moisture content in the 100–200 cm layer is specific to the Nanpan River Basin, where the dominant planted species are Eucalyptus and Cunninghamia, whose main root systems are concentrated at depths of 100–200 cm. This result may not be applicable to all basins, as the influence of forest attributes on soil moisture depends on the specific tree species and their rooting depths, necessitating case-by-case analysis.
The Nanpan River Basin features complex topography with significant elevation variations, which create localized microclimates and contribute to strong spatial heterogeneity in soil moisture [40]. The spatial resolution of the data used in this study is 1 km × 1 km, which is relatively coarse and may not capture fine-scale variations in influencing factors within the basin. However, this resolution represents the finest soil moisture data available through remote sensing for soil layer analysis. From a macro-scale perspective, these data still effectively reflect the spatial heterogeneity of soil moisture across the basin. Therefore, as GLDAS data are model-assimilated products, their soil moisture estimates may be influenced by uncertainties in model parameterization schemes and input data (e.g., precipitation, evapotranspiration). Particularly in regions with complex vegetation cover or diverse soil types, the models may not fully capture the actual dynamics of soil moisture variations. Consequently, this study primarily provides reference value for macro-scale watershed analyses focusing on economically forested areas.
To address current research limitations and expand findings, future work will implement the following measures: First, integrating higher-resolution remote sensing or ground monitoring data will enhance the analysis of soil moisture spatial heterogeneity, particularly in areas with complex topography and pronounced microclimates, enabling more refined characterization of local soil moisture dynamics and driving mechanisms. Second, species-specific studies will be conducted on dominant plantation species (e.g., Eucalyptus, Fir) in the Nanpan River Basin, combining plot monitoring and root distribution surveys to quantify species-level variations in soil water consumption, thereby informing species selection. Additionally, microclimate monitoring stations will be established in key areas, coupled with terrain data to develop microclimate models that elucidate microclimate effects on soil moisture spatial variability. Finally, comparative studies on planted forest versus natural forest impacts on watershed hydrological cycles (e.g., runoff, evapotranspiration) will be conducted, employing ecohydrological models to support scientific water resource management and ecological conservation.

5. Conclusions

This study analyzes the spatial distribution of soil moisture in planted forests and natural forests across different soil textures and depths using data on soil moisture, meteorology, soil texture, and the spatial distribution of planted forests. A geographical detector model was constructed to investigate the driving mechanisms of soil moisture. The results indicate the following:
(1)
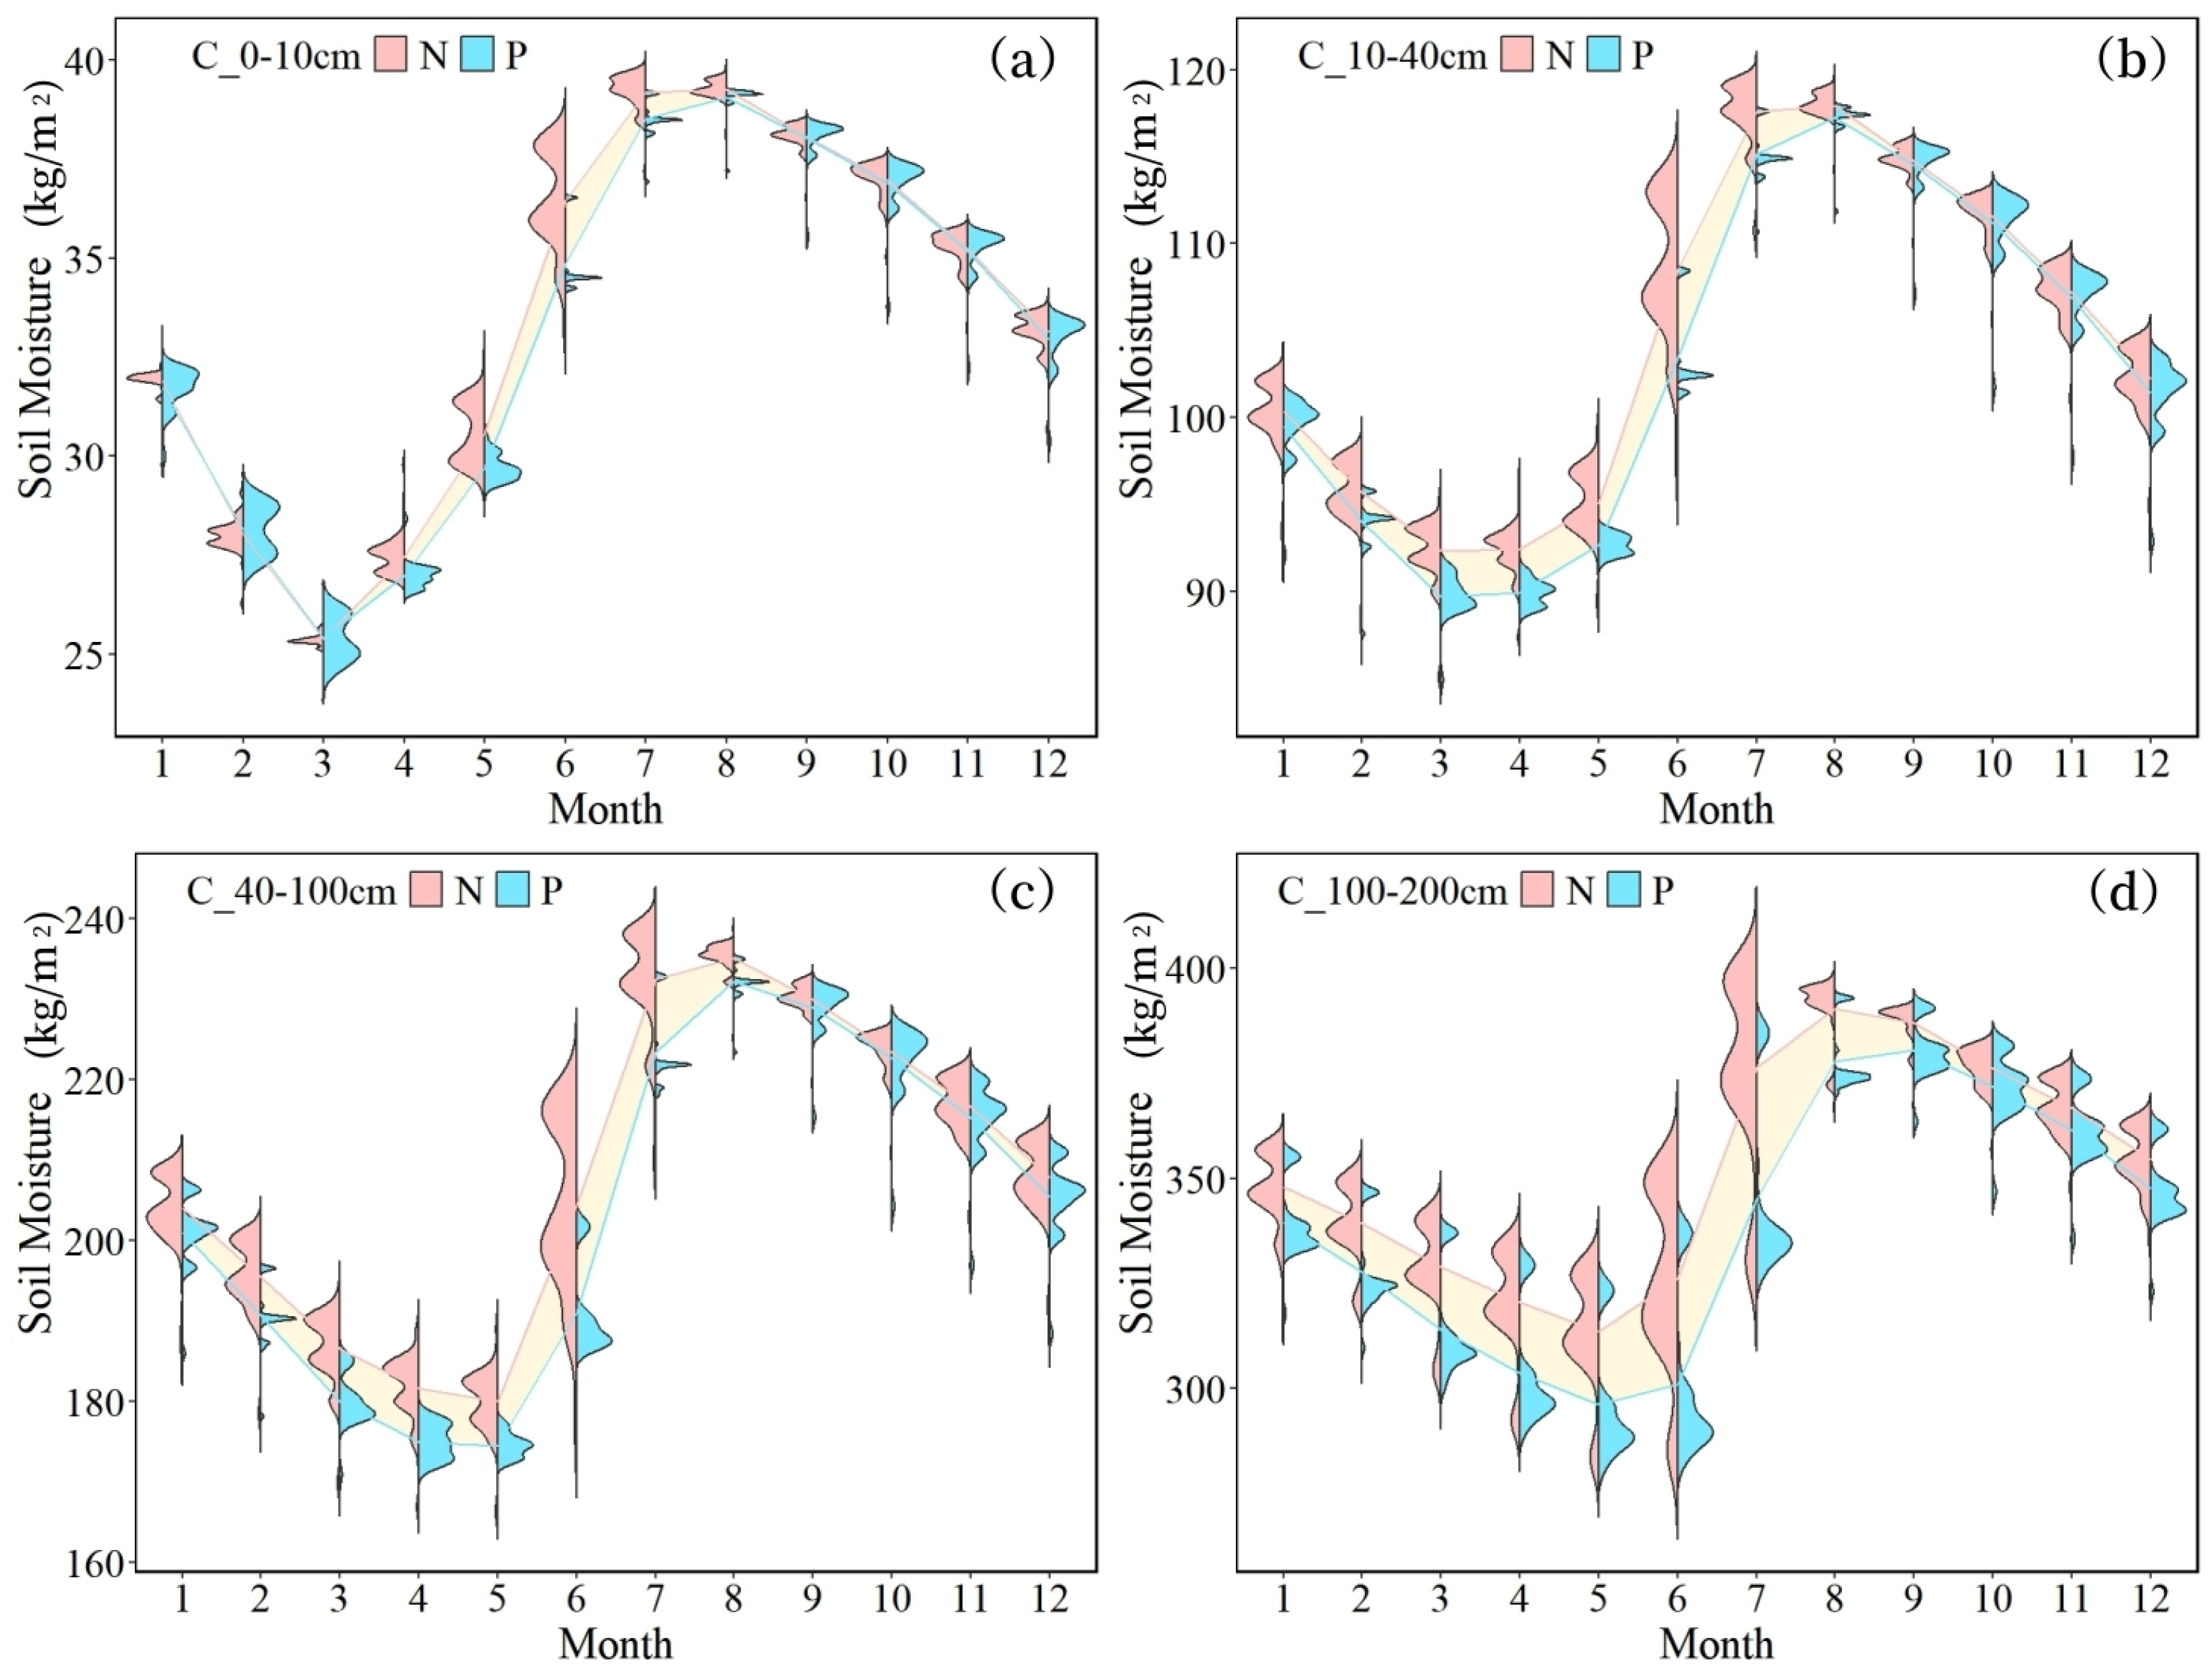
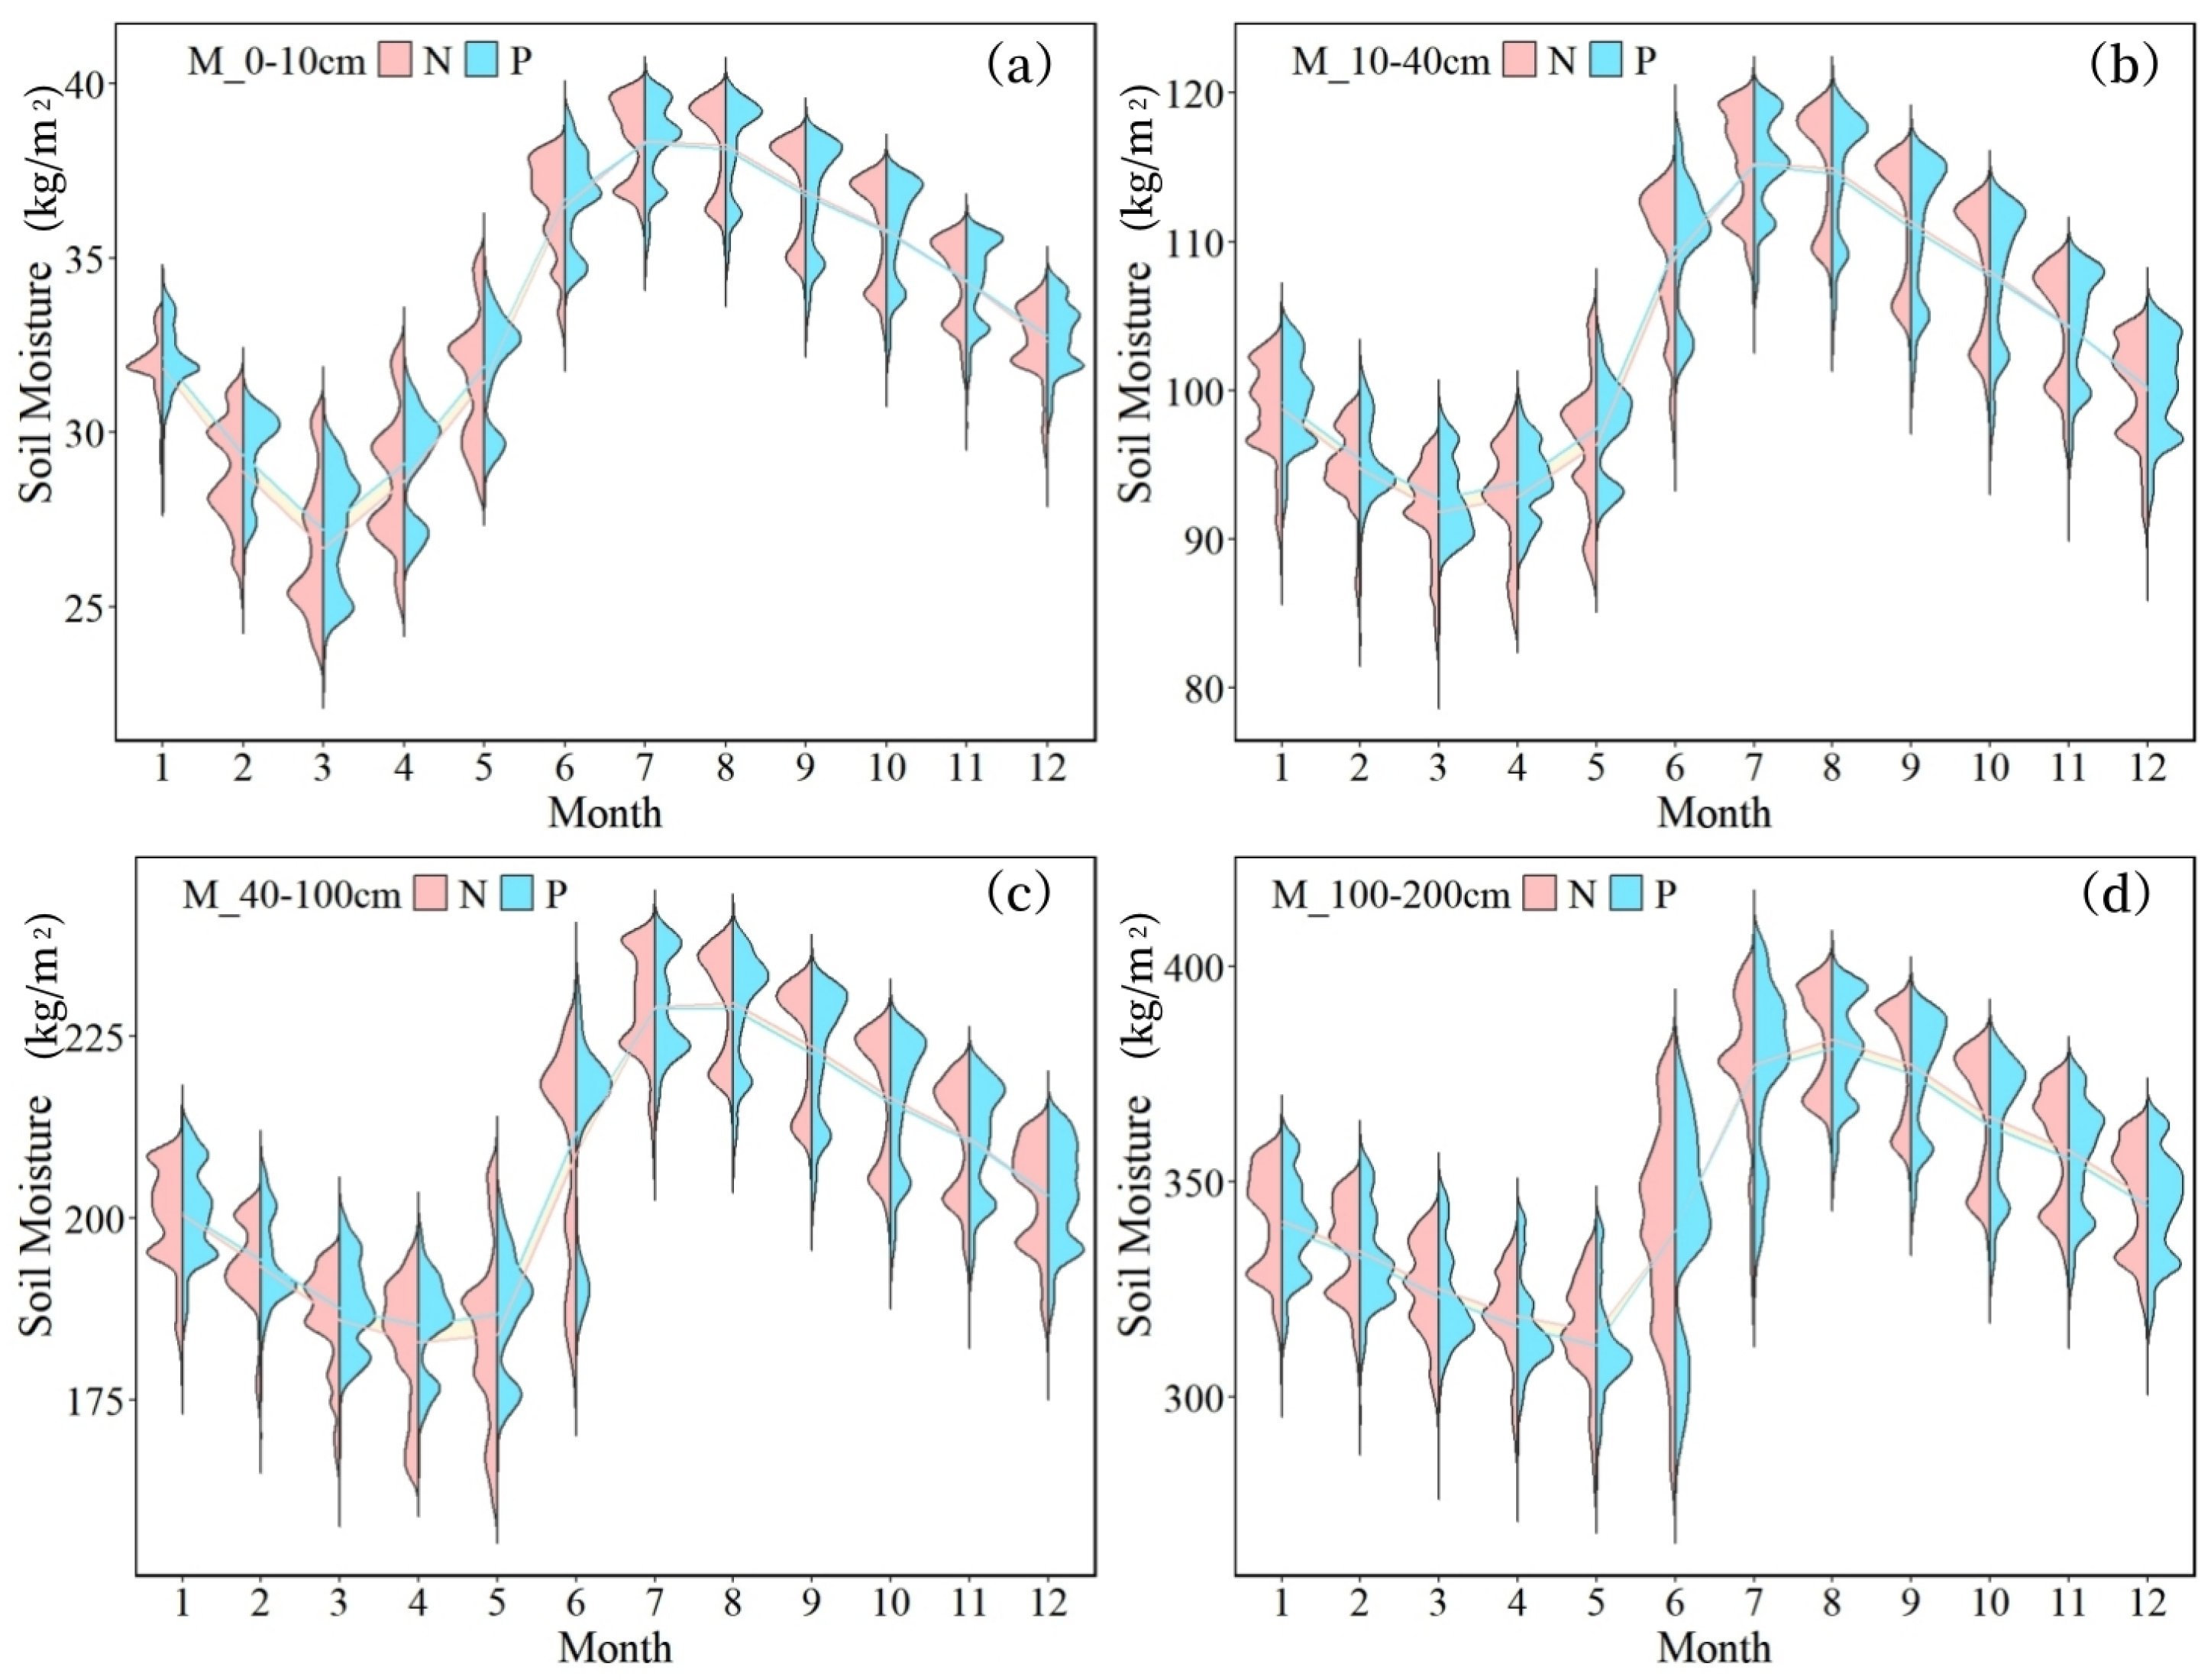
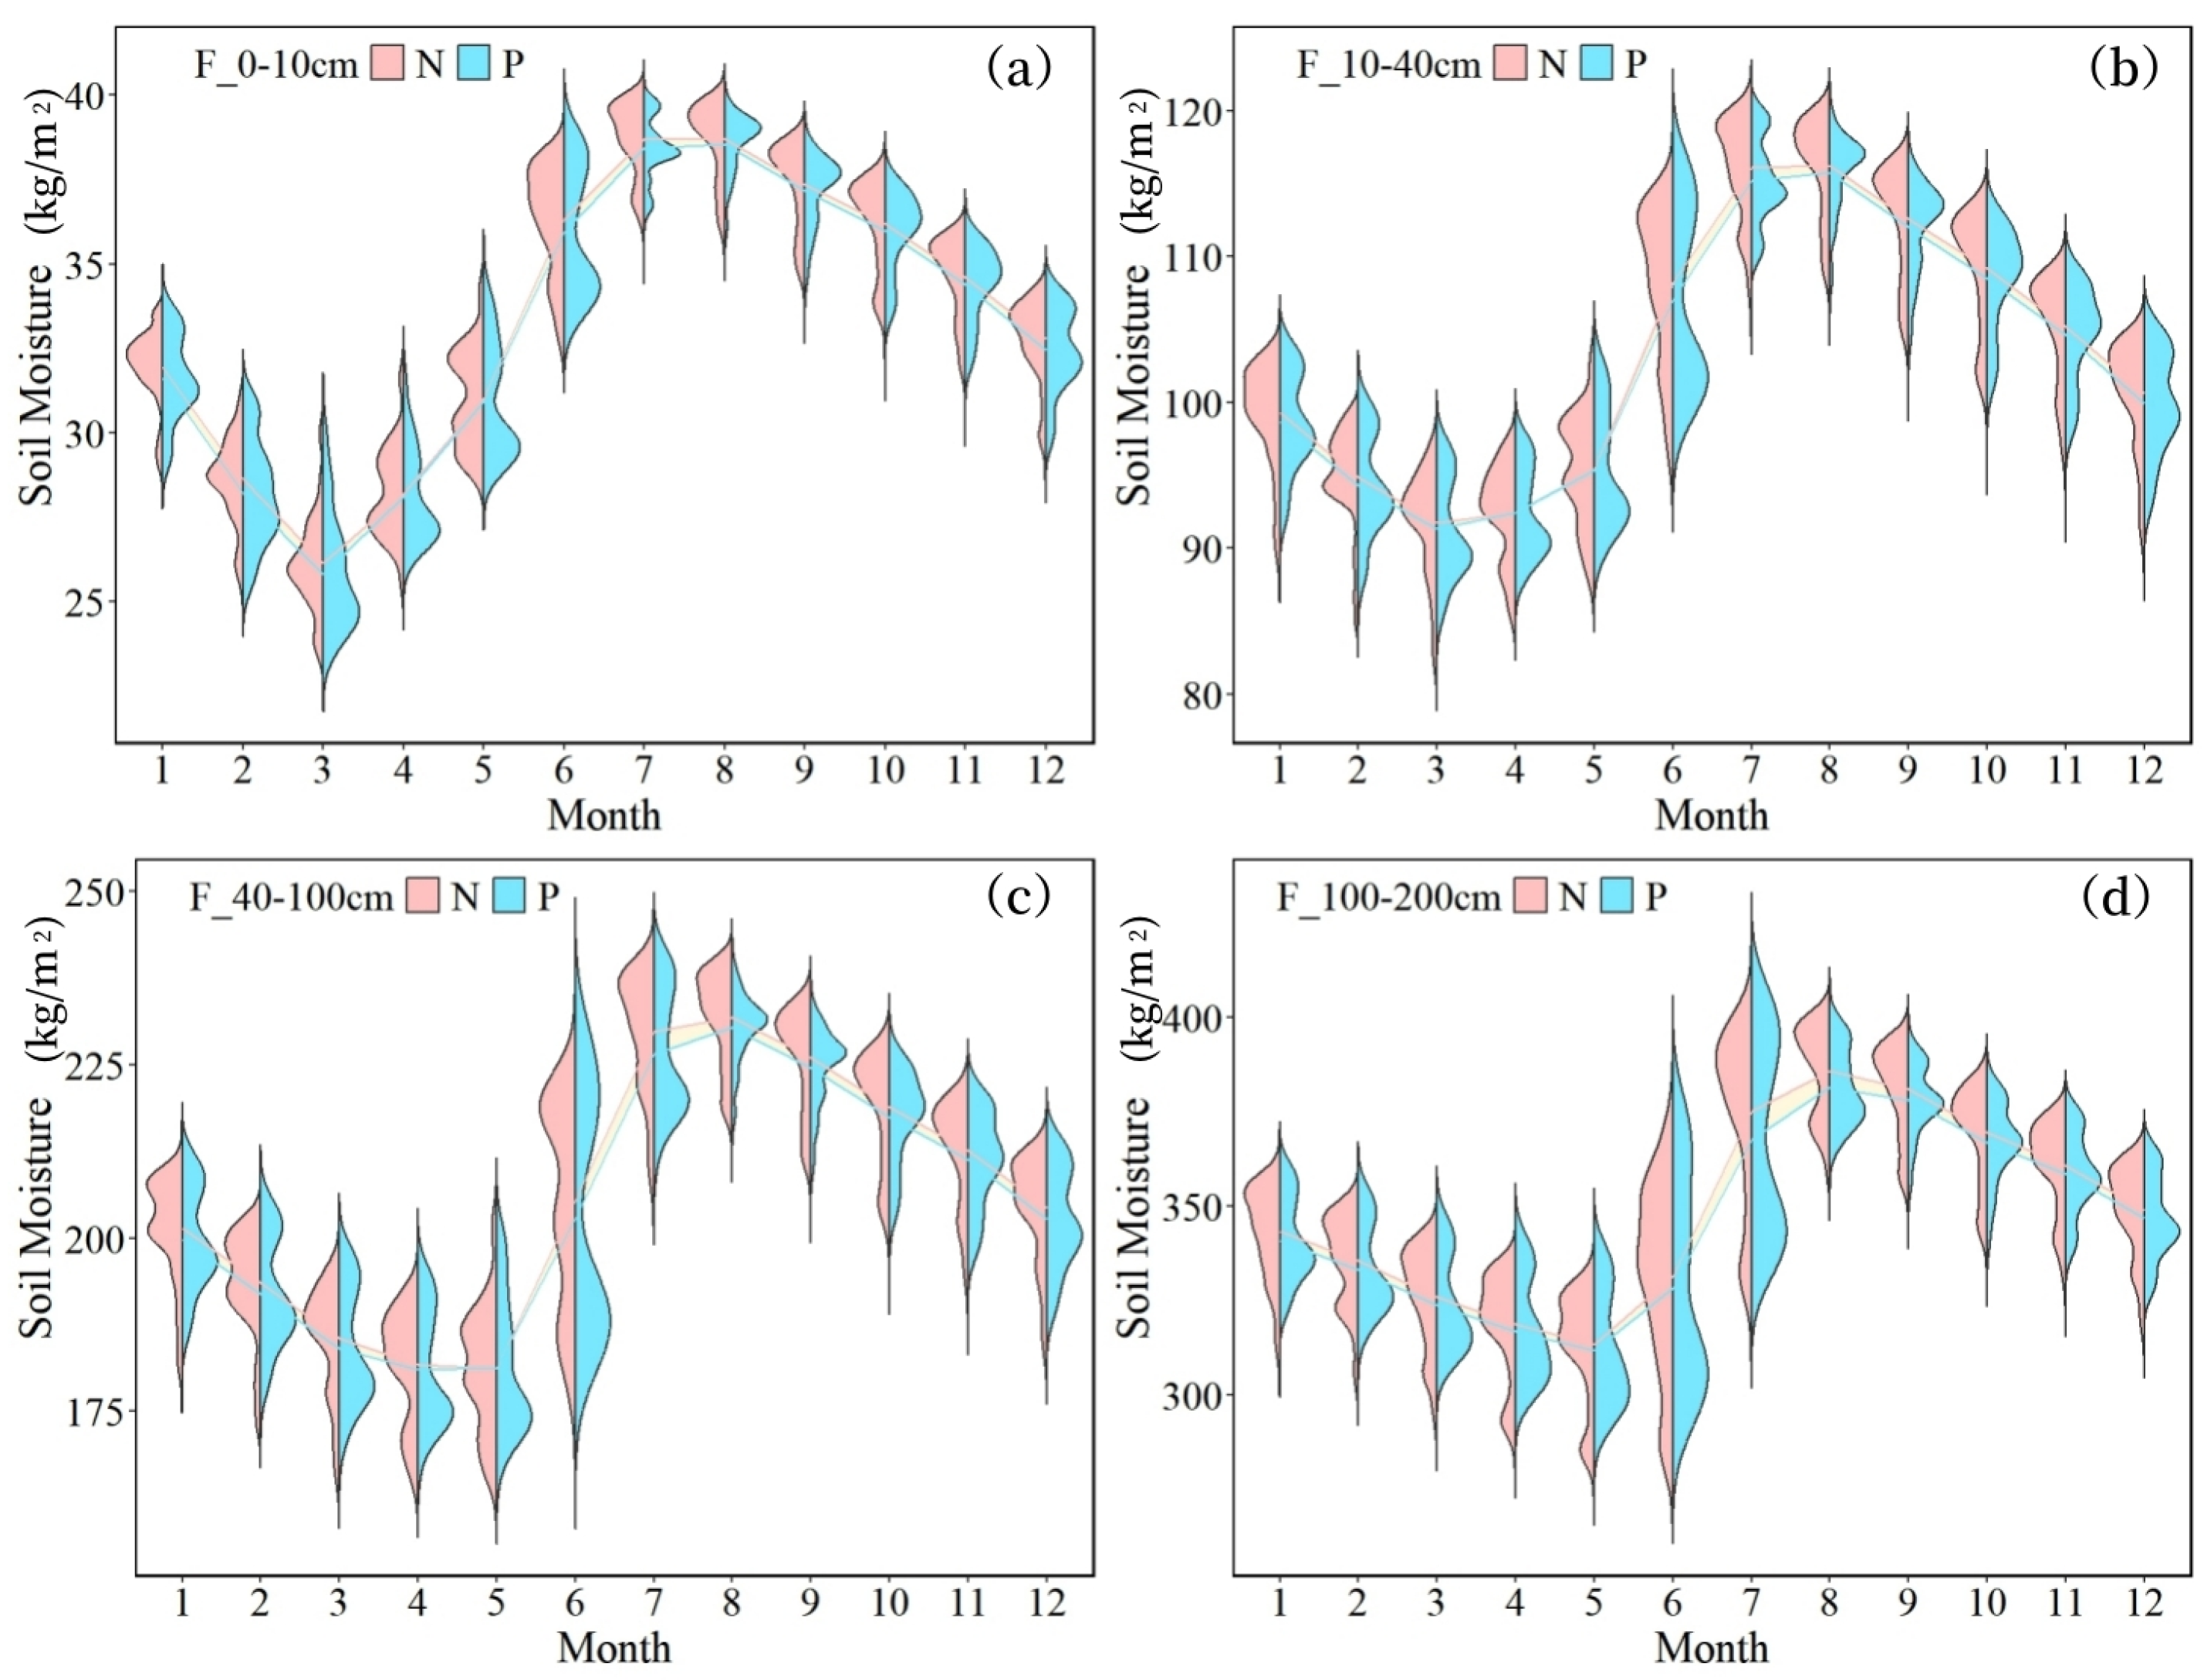
The overall soil moisture consumption in planted forests is greater than that in natural forests, with variations in moisture consumption differing across soil textures. The difference is most pronounced in coarse-textured soils. In June, the soil moisture content in plantations was consistently lower than in natural forests across all soil layers, with measured differences of 1.60 kg/m2 (0–10 cm), 5.07 kg/m2 (10–40 cm), 13.35 kg/m2 (40–100 cm), and 31.31 kg/m2 (100–200 cm).
(2)
The spatial differentiation of mean soil moisture content across soil layers is primarily determined by the moisture content in the subsoil layer (10–40 cm), which exhibits Q-values of 92.36% (0–10 cm), 93.00% (40–100 cm), and 66.72% (100–200 cm). Precipitation constitutes the secondary influencing factor, while the surface 0–10 cm soil layer shows greater susceptibility to wind speed effects.
(3)
Notably, only the soil moisture in the 100–200 cm layer is affected by forest attributes. This is because the dominant planted species in the basin, such as Eucalyptus and Cunninghamia, have main root systems concentrated at depths of 100–200 cm. In this layer, the substantial water consumption by planted forests leads to spatial differentiation in soil moisture.
The findings of this study provide a comprehensive understanding of soil moisture consumption in the Nanpan River Basin and reveal that the planting of economic forests significantly depletes soil moisture and influences its spatial distribution. These insights offer theoretical guidance for the management of ecological restoration projects in the region.

Author Contributions

H.Y., W.C. and Z.H. were mainly responsible for the problem analysis, methodology study and paper writing; M.Y. was mainly responsible for the validation results and Figure 1, Figure 2, Figure 3 and Figure 4; H.T. was responsible for Figure 5, Figure 6, Figure 7 and Figure 8; Q.Y. was responsible for the review and editing. All authors have read and agreed to the published version of the manuscript.

Funding

The authors are grateful to the editors and anonymous reviewers for their useful suggestions and comments. This study was supported by Natural Science Foundation of Guizhou Province, China (QKHJ-ZK [2023] Key028); Natural and scientific research fund of Guizhou Water Resources Department (KT202237); the Natural Science Foundation of China (u1612441; 41471032).

Data Availability Statement

Data will be made available on request.

Acknowledgments

We thank Guo Qinghua’s group at Peking University for providing data on the spatial distribution of planted and natural forests.

Conflicts of Interest

The authors declare no conflicts of interest.

Abbreviations

The following abbreviations are used in this manuscript:
Preprecipitation
Ttemperature
Wwind speed
NPforest attributes
Eevapotranspiration

References

  1. Xue, S.; Wu, G. Causal inference of root zone soil moisture performance in drought. Agric. Water Manag. 2024, 305, 109123. [Google Scholar] [CrossRef]
  2. Luo, M.; Meng, F.; Sa, C.; Duan, Y.; Bao, Y.; Liu, T.; De Maeyer, P. Response of vegetation phenology to soil moisture dynamics in the Mongolian Plateau. CATENA 2021, 206, 105505. [Google Scholar] [CrossRef]
  3. Zhang, D.-H.; Li, X.-R.; Zhang, F.; Zhang, Z.-S.; Chen, Y.-L. Effects of rainfall intensity and intermittency on woody vegetation cover and deep soil moisture in dryland ecosystems. J. Hydrol. 2016, 543, 270–282. [Google Scholar] [CrossRef]
  4. Demir, G.; Guswa, A.J.; Filipzik, J.; Metzger, J.C.; Römermann, C.; Hildebrandt, A. Root water uptake patterns are controlled by tree species interactions and soil water variability. Hydrol. Earth Syst. Sci. 2024, 28, 1441–1461. [Google Scholar] [CrossRef]
  5. Mi, J.; Xiao, X.; Guan, Q.; Wang, Q.; Zhang, J.; Zhang, Z.; Yang, E. Exploring the spatiotemporal distribution characteristics and driving factors of water erosion in mountain area based on RUSLE-SDR. J. Hydrol. 2025, 649, 132451. [Google Scholar] [CrossRef]
  6. Mei, X.-m.; Ma, L.; Zhu, Q.-k.; Wang, S.; Zhang, D.; Wang, Y. Responses of soil moisture to vegetation restoration type and slope length on the loess hillslope. J. Mt. Sci. 2018, 15, 548–562. [Google Scholar] [CrossRef]
  7. Meng, T.; Sun, P. Variations of deep soil moisture under different vegetation restoration types in a watershed of the Loess Plateau, China. Sci. Rep. 2023, 13, 4957. [Google Scholar] [CrossRef]
  8. Tian, R.; Li, J.; Zheng, J.; Liu, L.; Han, W.; Liu, Y. Changes in vegetation phenology and its response to different layers of soil moisture in the dry zone of Central Asia, 1982–2022. J. Hydrol. 2025, 646, 132314. [Google Scholar] [CrossRef]
  9. Molenaar, R.E.; Kleidorfer, M.; Kohl, B.; Teuling, A.J.; Achleitner, S. Does afforestation increase soil water buffering? A demonstrator study on soil moisture variability in the Alpine Geroldsbach catchment, Austria. J. Hydrol. 2024, 643, 131984. [Google Scholar] [CrossRef]
  10. Fang, X.; Zhao, W.; Wang, L.; Feng, Q.; Ding, J.; Liu, Y.; Zhang, X. Variations of deep soil moisture under different vegetation types and influencing factors in a watershed of the Loess Plateau, China. Hydrol. Earth Syst. Sci. 2016, 20, 3309–3323. [Google Scholar] [CrossRef]
  11. Geng, J.; Li, H.; Shi, Y.; Pang, J.; Shao, Y. Comparison and Optimization of Water Conservation Function in Natural Forests and Tea Plantations in a Headwater Catchment, Taihu Lake Basin. Forests 2024, 15, 189. [Google Scholar] [CrossRef]
  12. Hou, L.; Zhang, Y.; Li, Z.; Shao, G.; Song, L.; Sun, Q. Comparison of Soil Properties, Understory Vegetation Species Diversities and Soil Microbial Diversities Between Chinese Fir Plantation and Close-to-Natural Forest. Forests 2021, 12, 632. [Google Scholar] [CrossRef]
  13. Liu, X.; Feng, T.; Zhang, Y.; Liu, Y.; Wang, P. Vegetation restoration affects soil hydrological processes in typical natural and planted forests on the Loess Plateau. J. Hydrol. 2025, 650, 132465. [Google Scholar] [CrossRef]
  14. Oggioni, S.D.; Rossi, L.M.W.; Avanzi, C.; Marchetti, M.; Piotti, A.; Vacchiano, G. Drought responses of Italian silver fir provenances in a climate change perspective. Dendrochronologia 2024, 85, 126184. [Google Scholar] [CrossRef]
  15. Bonell, M.; Purandara, B.K.; Venkatesh, B.; Krishnaswamy, J.; Acharya, H.A.K.; Singh, U.V.; Jayakumar, R.; Chappell, N. The impact of forest use and reforestation on soil hydraulic conductivity in the Western Ghats of India: Implications for surface and sub-surface hydrology. J. Hydrol. 2010, 391, 47–62. [Google Scholar] [CrossRef]
  16. Jaroszewicz, B.; Cholewińska, O.; Chećko, E.; Wrzosek, M. Predictors of diversity of deadwood-dwelling macrofungi in a European natural forest. For. Ecol. Manag. 2021, 490, 119123. [Google Scholar] [CrossRef]
  17. Qiu, D.; Zhu, G.; Lin, X.; Jiao, Y.; Lu, S.; Liu, J.; Liu, J.; Zhang, W.; Ye, L.; Li, R.; et al. Dissipation and movement of soil water in artificial forest in arid oasis areas: Cognition based on stable isotopes. CATENA 2023, 228, 107178. [Google Scholar] [CrossRef]
  18. Zheng, J.; Jin, X.; Li, Q.; Lang, J.; Yin, X. Soil moisture variation and affecting factors analysis in the Zhangjiakou–Chengde district based on modified temperature vegetation dryness index. Ecol. Indic. 2024, 168, 112775. [Google Scholar] [CrossRef]
  19. Liang, X.; Yan, J.; Liang, W.; Li, B.; Liu, X.; Feng, F.; Wei, J. Ecosystem water limitation shifts driven by soil moisture in the Loess Plateau, China. Glob. Planet. Change 2024, 243, 104625. [Google Scholar] [CrossRef]
  20. Gu, X.; Jamshidi, S.; Sun, H.; Niyogi, D. Identifying multivariate controls of soil moisture variations using multiple wavelet coherence in the U.S. Midwest. J. Hydrol. 2021, 602, 126755. [Google Scholar] [CrossRef]
  21. Wen, Y.; Li, M.; Xu, R.; Qiu, D.; Gao, P.; Mu, X. Spatial distribution characteristics and influencing factors of shallow and deep soil moisture under ecological restoration in the loess plateau, China. Hydrol. Process. 2024, 38, e15109. [Google Scholar] [CrossRef]
  22. Wang, J.B.; Peng, J.; Zhang, R.X.; Xu, Z.H.; Liu, Y.X. Research progress and prospect of karst ecosystem services. J. Guizhou Norm. Univ. (Nat. Sci.) 2024, 42, 77–84. [Google Scholar] [CrossRef]
  23. De Lannoy, G.J.M.; Koster, R.D.; Reichle, R.H.; Mahanama, S.P.P.; Liu, Q. An updated treatment of soil texture and associated hydraulic properties in a global land modeling system. J. Adv. Model. Earth Syst. 2014, 6, 957–979. [Google Scholar] [CrossRef]
  24. Liu, Y.; Liu, Y.; Wang, W. Inter-comparison of satellite-retrieved and Global Land Data Assimilation System-simulated soil moisture datasets for global drought analysis. Remote Sens. Environ. 2019, 220, 1–18. [Google Scholar] [CrossRef]
  25. Zhang, Z.; Song, Y.; Wu, P. Robust geographical detector. Int. J. Appl. Earth Obs. Geoinf. 2022, 109, 102782. [Google Scholar] [CrossRef]
  26. Wang, J.-F.; Zhang, T.-L.; Fu, B.-J. A measure of spatial stratified heterogeneity. Ecol. Indic. 2016, 67, 250–256. [Google Scholar] [CrossRef]
  27. Sun, X.; Lai, P.; Wang, S.; Song, L.; Ma, M.; Han, X.J. Monitoring of Extreme Agricultural Drought of the Past 20 Years in Southwest China Using GLDAS Soil Moisture. Remote Sens. 2022, 14, 1323. [Google Scholar] [CrossRef]
  28. Guan, Y.; Gu, X.; Slater, L.J.; Li, J.; Kong, D.; Zhang, X. Spatio-temporal variations in global surface soil moisture based on multiple datasets: Intercomparison and climate drivers. J. Hydrol. 2023, 625, 130095. [Google Scholar] [CrossRef]
  29. Cheng, K.; Su, Y.; Guan, H.; Tao, S.; Ren, Y.; Hu, T.; Ma, K.; Tang, Y.; Guo, Q. Mapping China’s planted forests using high resolution imagery and massive amounts of crowdsourced samples. ISPRS J. Photogramm. Remote Sens. 2023, 196, 356–371. [Google Scholar] [CrossRef]
  30. Cheng, K.; Yang, H.; Tao, S.; Su, Y.; Guan, H.; Ren, Y.; Hu, T.; Li, W.; Xu, G.; Chen, M.; et al. Carbon storage through China’s planted forest expansion. Nat. Commun. 2024, 15, 4106. [Google Scholar] [CrossRef]
  31. Hillel, D. Fundamentals of Soil Physics; Academic Press: Cambridge, MA, USA, 1980. [Google Scholar] [CrossRef]
  32. Graetz, D.A. Biogeochemistry: An Analysis of Global Change. J. Environ. Qual. 1992, 21, 153–154. [Google Scholar] [CrossRef]
  33. Brockerhoff, E.G.; Jactel, H.; Parrotta, J.A.; Quine, C.P.; Sayer, J. Plantation forests and biodiversity: Oxymoron or opportunity? Biodivers. Conserv. 2008, 17, 925–951. [Google Scholar] [CrossRef]
  34. Farley, K.A.; Jobbágy, E.G.; Jackson, R.B. Effects of afforestation on water yield: A global synthesis with implications for policy. Glob. Change Biol. 2005, 11, 1565–1576. [Google Scholar] [CrossRef]
  35. Li, S.L.Y.; Zhou, M. Relationship between Vertical Root Distribution of Planted Eucalyptus and Soil Bulk Density and Moisture. Soil Water Conserv. China 2022, 10, 67–70. [Google Scholar] [CrossRef]
  36. Daniels, W.L. The Nature and Properties of Soils, 15th Edition Ray R. Weil and Nyle C. Brady. Pearson Press, Upper Saddle River NJ, 2017. 1086 p. $164.80. ISBN-10: 0-13-325448-8; ISBN-13: 978-0-13-325448-8. Also available as eText for $67.99. Soil Sci. Soc. Am. J. 2016, 80, 1428. [Google Scholar] [CrossRef]
  37. Brady, N.C.; Weil, R.R. The Nature and Properties of Soils. J. Range Manag. 2002, 5, 333. [Google Scholar] [CrossRef]
  38. Lin, H. Earth’s Critical Zone and hydropedology: Concepts, characteristics, and advances. Hydrol. Earth Syst. Sci. 2010, 6, 3417–3481. [Google Scholar] [CrossRef]
  39. Monteith, J.L. Principles of environmental physics. Phys. Today 1974, 27, 51. [Google Scholar] [CrossRef]
  40. Yeh, J.F.; Eltahir, E.A.B. Stochastic analysis of the relationship between topography and the spatial distribution of soil moisture. Water Resour. Res. 1998, 34, 2075. [Google Scholar] [CrossRef]
Figure 1. Overview of the study area.
Forests 16 00665 g001
Figure 2. The spatial distribution patterns of planted forests and natural forests in 2000, 2010, and 2020.
Forests 16 00665 g002
Figure 3. (ad) The annual mean soil moisture content across different soil layers; (eh) the interannual temporal trends of soil moisture content for each soil layer from 2000 to 2023; while (il) the spatial variation trends of annual-scale soil moisture content across different soil layers during 2000–2023.
Forests 16 00665 g003
Figure 4. N represents natural forests, P represents planted forests, and the yellow ribbon indicates the difference in mean soil moisture content between natural forests and planted forests in coarse-textured soils. (a) The monthly scale difference in soil moisture content between planted forests and natural forests for the 0–10 cm layer in coarse-textured soils, (b) for the 10–40 cm layer, (c) for the 40–100 cm layer, and (d) for the 100–200 cm layer.
Forests 16 00665 g004
Figure 5. N represents natural forests, P represents planted forests, and the yellow ribbon indicates the difference in mean soil moisture content between natural forests and planted forests in medium-textured soils. (a) The monthly scale difference in soil moisture content between planted forests and natural forests for the 0–10 cm layer in coarse-textured soils, (b) for the 10–40 cm layer, (c) for the 40–100 cm layer, and (d) for the 100–200 cm layer.
Forests 16 00665 g005
Figure 6. N represents natural forests, P represents planted forests, and the yellow ribbon indicates the difference in mean soil moisture content between natural forests and planted forests in fine-textured soils. (a) The monthly scale difference in soil moisture content between planted forests and natural forests for the 0–10 cm layer in coarse-textured soils, (b) for the 10–40 cm layer, (c) for the 40–100 cm layer, and (d) for the 100–200 cm layer.
Forests 16 00665 g006
Figure 7. The vertical distribution of soil moisture content in coarse-textured soils is shown, with pink representing natural forests and blue representing planted forests. The numbers indicate the following: 1 for the 0–10 cm soil layer, 2 for the 10–40 cm layer, 3 for the 40–100 cm layer, and 4 for the 100–200 cm layer.
Forests 16 00665 g007
Figure 8. The vertical distribution of soil moisture content in medium-textured soils is shown, with pink representing natural forests and blue representing planted forests. The numbers indicate the following: 1 for the 0–10 cm soil layer, 2 for the 10–40 cm layer, 3 for the 40–100 cm layer, and 4 for the 100–200 cm layer.
Forests 16 00665 g008
Figure 9. The vertical distribution of soil moisture content in fine-textured soils is shown, with pink representing natural forests and blue representing planted forests. The numbers indicate the following: 1 for the 0–10 cm soil layer, 2 for the 10–40 cm layer, 3 for the 40–100 cm layer, and 4 for the 100–200 cm layer.
Forests 16 00665 g009
Figure 10. The figure displays the optimal classification methods and break numbers of influencing factors for different soil layers: 0–10 cm (a), 10–40 cm (b), 40–100 cm (c), and 100–200 cm (d), where E represents evapotranspiration, Pre denotes precipitation, T stands for temperature, W indicates wind speed, while cm10, cm40, cm100 and cm200 correspond to soil moisture content in 0–10 cm, 10–40 cm, 40–100 cm, and 100–200 cm soil layers, respectively. The numbers in the figure represent the optimal number of breaks for factors.
Forests 16 00665 g010
Figure 11. The single factor detection results for different soil layers are presented as follows: 0–10 cm (a), 10–40 cm (b), 40–100 cm (c), and 100–200 cm (d), where NP represents forest attributes (including planted forests and natural forests), E denotes evapotranspiration, Pre indicates precipitation, T stands for temperature, W represents wind speed, while cm10, cm40, cm100 and cm200 correspond to soil moisture content in 0–10 cm, 10–40 cm, 40–100 cm, and 100–200 cm soil layers, respectively, with asterisks (*) marking results that passed the significance test at p < 0.05 level.
Forests 16 00665 g011
Figure 12. The interaction detection results of dual factors for different soil layers are presented as follows: 0–10 cm (a), 10–40 cm (b), 40–100 cm (c), and 100–200 cm (d), where NP represents forest attributes (including both planted forests and natural forests), E denotes evapotranspiration, Pre indicates precipitation, T stands for temperature, W represents wind speed, with cm10, cm40, cm100 and cm200 corresponding to soil moisture content in the 0–10 cm, 10–40 cm, 40–100 cm, and 100–200 cm soil layers, respectively. An asterisk (*) indicates linear enhancement, while results without asterisks represent nonlinear enhancement.
Forests 16 00665 g012
Disclaimer/Publisher’s Note: The statements, opinions and data contained in all publications are solely those of the individual author(s) and contributor(s) and not of MDPI and/or the editor(s). MDPI and/or the editor(s) disclaim responsibility for any injury to people or property resulting from any ideas, methods, instructions or products referred to in the content.

