

Host Use Does Not Drive Genetic Structure of the Mountain Pine Beetle, Dendroctonus ponderosae (Coleoptera: Curculionidae: Scolytinae), in Western North America

Abstract
1. Introduction
2. Materials and Methods
2.1. Site Selection and Beetle Collection
2.2. DNA Extraction and Microsatellite Amplification
2.3. Hardy–Weinberg Equilibrium and Linkage Disequilibrium
2.4. Genetic Variation
2.5. Population Structure
2.6. Genetic Differentiation
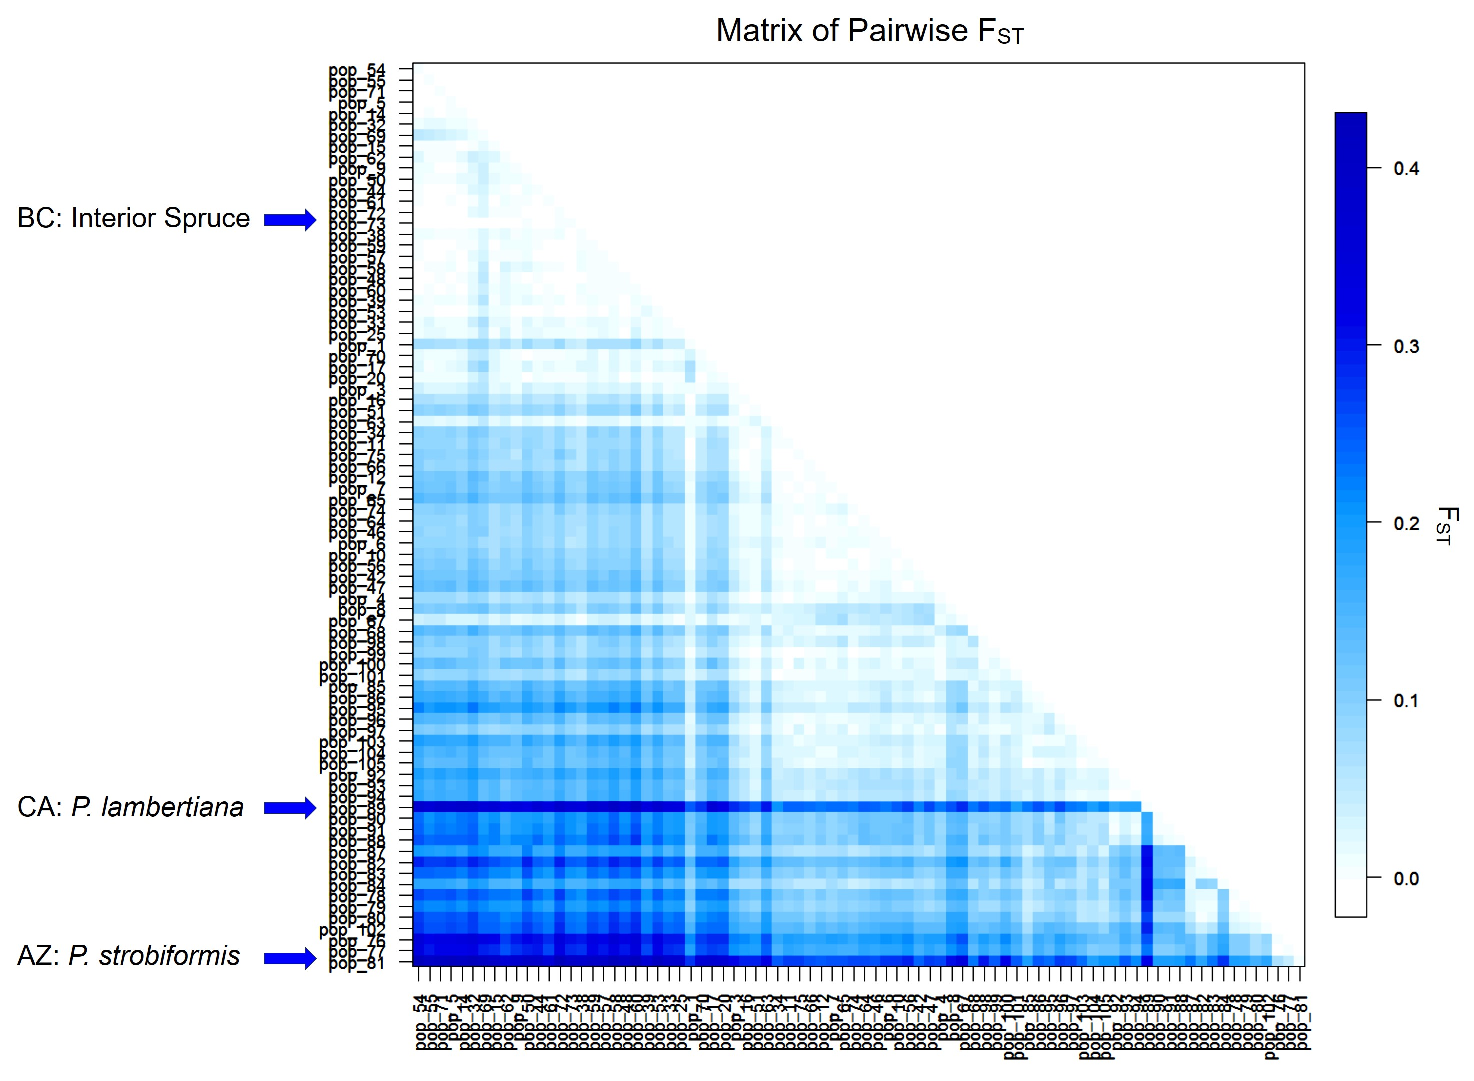
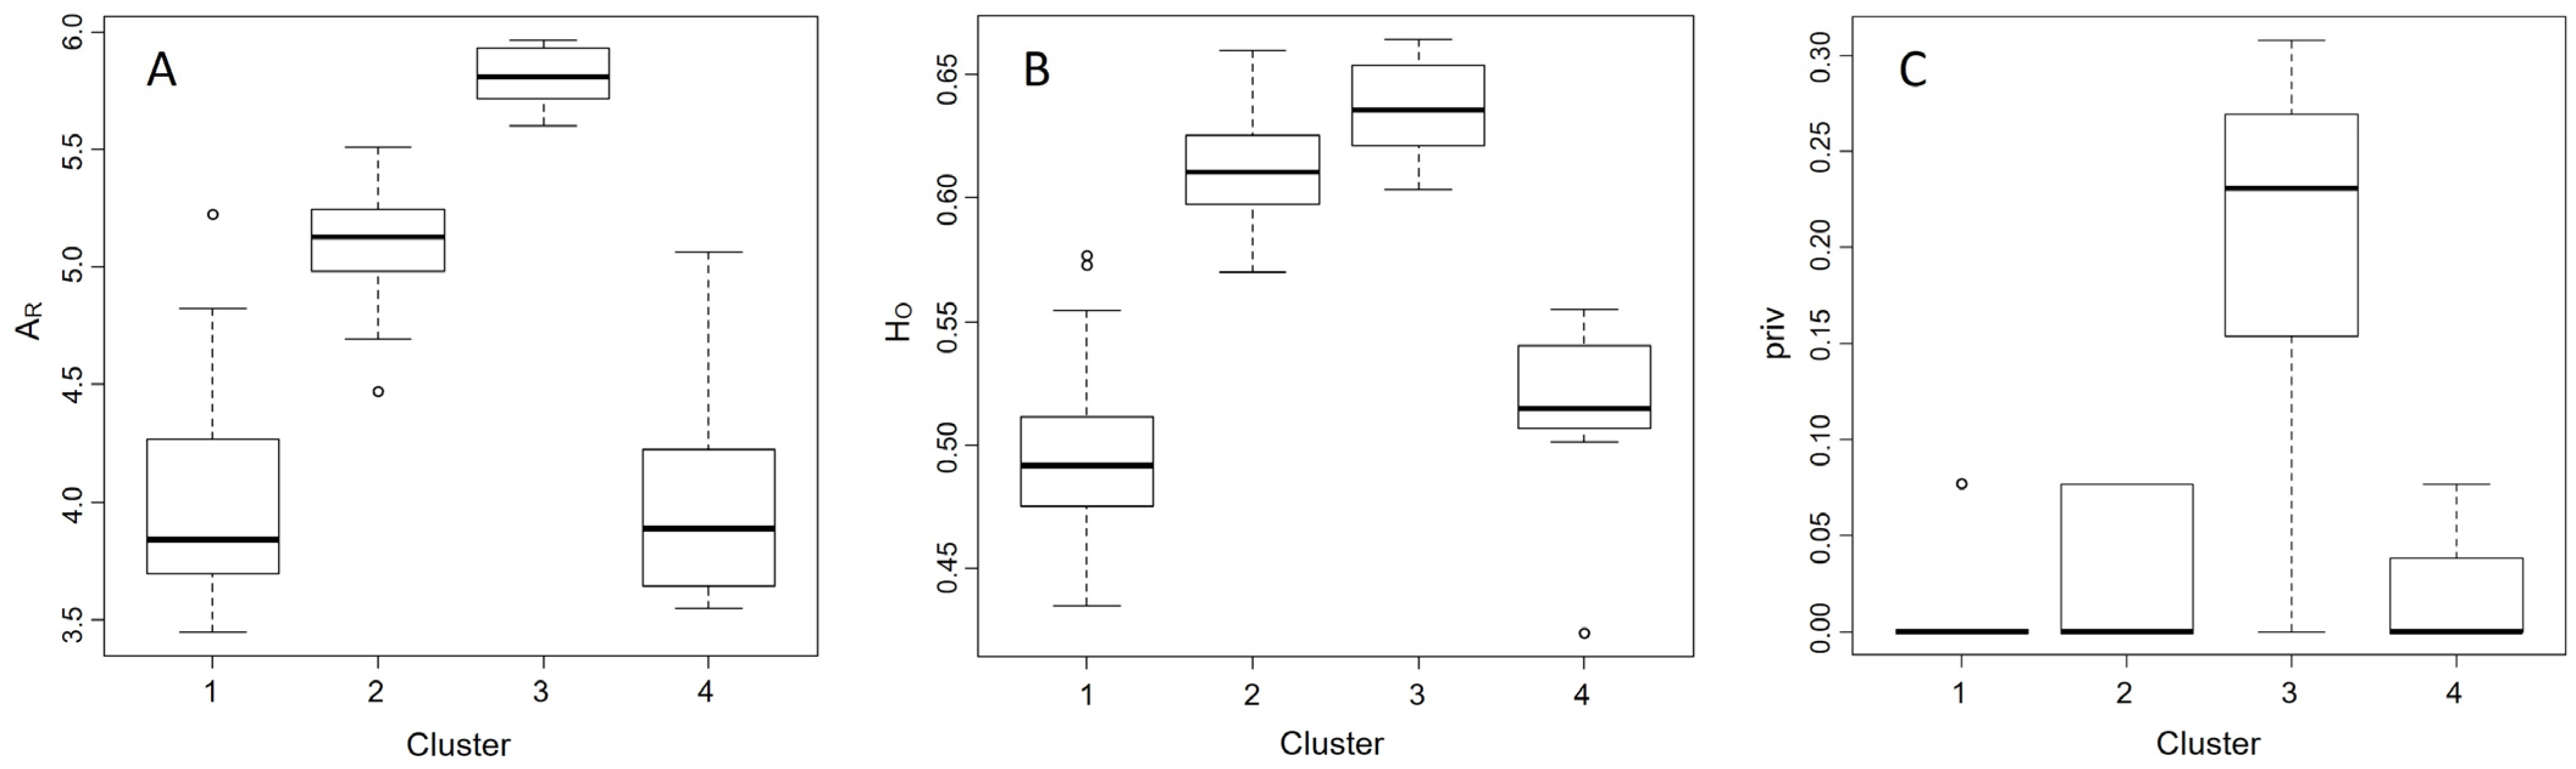
3. Results
4. Discussion
4.1. Host Use
4.2. Landscape-Level Genetic Structure
4.3. Indications of Glacial Refugia
4.4. Conclusions and Future Directions
Supplementary Materials
Author Contributions
Funding
Data Availability Statement
Acknowledgments
Conflicts of Interest
References
- Jones, L.C.; Rafter, M.A.; Walter, G.H. Host interaction mechanisms in herbivorous insects–life cycles, host specialization and speciation. Biol. J. Linn. Soc. 2022, 137, 1–14. [Google Scholar]
- Lindgren, B.S.; Raffa, K.F. Evolution of tree killing in bark beetles (Coleoptera: Curculionidae): Trade-offs between the maddening crowds and a sticky situation. Can. Entomol. 2013, 145, 471–495. [Google Scholar] [CrossRef]
- Morris, J.L.; Cottrell, S.; Fettig, C.J.; DeRose, R.J.; Mattor, K.M.; Carter, V.A.; Clear, J.; Clement, J.; Hansen, W.D.; Hicke, J.A.; et al. Bark beetles as agents of change in social–ecological systems. Front. Ecol. Environ. 2018, 16, S34–S43. [Google Scholar] [CrossRef]
- Thompson, J.N. The Coevolutionary Process; The University of Chicago Press: Chicago, IL, USA, 2021; 383p. [Google Scholar]
- Cognato, A.I.; Smith, S.M.; Jordal, B.H. Patterns of host tree use within a lineage of saproxlic snout-less weevils (Coleoptera: Curculionidae: Scolytinae: Scolytini). Mol. Phylogen. Evol. 2021, 159, 107107. [Google Scholar]
- Macías-Sámano, J.E.; Borden, J.H.; Gries, R.; Pierce, H.D., Jr.; Gries, G.; King, G.G.S. Lack of evidence for pheromone-mediated secondary attraction in the fir engraver, Scolytus ventralis, (Coleoptera: Scolytidae). J. Entomol. Soc. Br. Columbia 1998, 95, 117–125. [Google Scholar]
- Macías-Sámano, J.E.; Borden, J.H.; Gries, R.; Pierce, H.D., Jr.; Gries, G.; King, G.G.S. Primary attraction of fir engraver, Scolytus ventralis. J. Chem. Ecol. 1998, 24, 1049–1075. [Google Scholar] [CrossRef]
- Wood, C.S.L. The bark and ambrosia beetles of North and Central America (Coleoptera: Scolytidae), a taxonomic monograph. Great Basin Nat. Mem. 1982, 6, 1–1359. [Google Scholar]
- Ramírez-Reyes, T.; Armendáriz-Toledano, F.; Rodríguez, L.G.C. Rearranging and completing the puzzle: Phylogenomic analysis of bark beetles Dendroctonus reveals new hypotheses about genus diversification. Mol. Phylogen. Evol. 2023, 187, 107885. [Google Scholar]
- Six, D.; Bracewell, R. Dendroctonus. In Bark Beetles: Biology and Ecology of Native and Invasive Species; Vega, F.E., Hofstetter, R.W., Eds.; Academic Press: Cambridge, MA, USA, 2015; Chapter 8; pp. 305–350. [Google Scholar]
- Huber, D.P.; Aukema, B.H.; Hodgkinson, R.S.; Lindgren, B.S. Successful colonization, reproduction, and new generation emergence in live interior hybrid spruce, Picea engelmannii × glauca by mountain pine beetle, Dendroctonus ponderosae. Agric. For. Entomol. 2009, 11, 83–89. [Google Scholar] [CrossRef]
- Furniss, M.M.; Schenk, J.A. Sustained natural infestation by the mountain pine beetle in seven new Pinus and Picea hosts. J. Econ. Entomol. 1969, 62, 518–519. [Google Scholar]
- Wood, C.S.; Unger, L. Mountain Pine Beetle—A History of Outbreaks in Pine Forests in British Columbia 1910 to 1995; Government of British Columbia: Victoria, BC, Canada, 1996; 61p.
- Safranyik, L.; Carroll, A.L. The biology and epidemiology of the mountain pine beetle in lodgepole pine forests. In The Mountain Pine Beetle: A Synthesis of Biology, Management, and Impacts on Lodgepole Pine; Safranyik, L., Wilson, W.R., Eds.; Natural Resources Canada: Ottawa, ON, Canada, 2006; pp. 3–66. [Google Scholar]
- Hrinkevich, K.; Lewis, K.J. Northern range limit mountain pine beetle outbreak dynamics in mixed sub-boreal pine forests of British Columbia. Ecosphere 2011, 2, 1–16. [Google Scholar] [CrossRef]
- Axelson, J.; Alfaro, R.; Hawkes, B. Influence of fire and mountain pine beetle on the dynamics of lodgepole pine stands in British Columbia, Canada. For. Ecol. Manag. 2009, 257, 1874–1882. [Google Scholar] [CrossRef]
- Amoroso, M.M.; Coates, K.D.; Astrup, R. Stand recovery and self-organization following large-scale mountain pine beetle induced canopy mortality in northern forests. For. Ecol. Manag. 2013, 310, 300–311. [Google Scholar] [CrossRef]
- Alfaro, R.I.; van Akker, L.; Hawkes, B. Characteristics of forest legacies following two mountain pine beetle outbreaks in British Columbia, Canada. Can. J. For. Res. 2015, 45, 1387–1396. [Google Scholar] [CrossRef]
- Jarvis, D.S.; Kulakowski, D. Long-term history and synchrony of mountain pine beetle outbreaks in lodgepole pine forests. J. Biogeogr. 2015, 42, 1029–1039. [Google Scholar] [CrossRef]
- Axelson, J.N.; Hawkes, B.C.; van Akker, L.; Alfaro, R.I. Stand dynamics and the mountain pine beetle- 30 years of forest change in Waterton Lakes National Park, Alberta, Canada. Can. J. For. Res. 2018, 48, 1159–1170. [Google Scholar] [CrossRef]
- Mock, K.E.; Bentz, B.J.; O’Neill, E.M.; Chong, J.P.; Orwin, J.; Pfrender, M.E. Landscape-scale genetic variation in a forest outbreak species, the mountain pine beetle (Dendroctonus ponderosae). Mol. Ecol. 2007, 16, 553–568. [Google Scholar] [CrossRef]
- Cullingham, C.I.; Cooke, J.E.K.; Dang, S.; Davis, C.S.; Cooke, B.J.; Coltman, D.W. Mountain pine beetle host-range expansion threatens the boreal forest. Mol. Ecol. 2011, 20, 2157–2171. [Google Scholar] [CrossRef]
- Jackson, P.; Straussfogel, D.; Lindgren, B.; Mitchell, S.; Murphy, B. Radar observation and aerial capture of mountain pine beetle, Dendroctonus ponderosae Hopk. (Coleoptera: Scolytidae) in flight above the forest canopy. Can. J. For. Res. 2008, 38, 2313–2327. [Google Scholar] [CrossRef]
- de la Giroday, H.M.C.; Carroll, A.L.; Aukema, B.H. Breach of the northern Rocky Mountain geoclimatic barrier: Initiation of range expansion by the mountain pine beetle. J. Biogeogr. 2012, 39, 1112–1123. [Google Scholar] [CrossRef]
- Logan, J.A.; Powell, J.A. Ghost forests, global warming, and the mountain pine beetle (Coleoptera: Scolytidae). Am. Entomol. 2001, 47, 160–173. [Google Scholar] [CrossRef]
- Bentz, B.J.E.; Hansen, E.M.; Vandygriff, J.C.; Stephens, S.S.; Soderberg, D. Rocky Mountain Bristlecone Pine (Pinus aristata) is a confirmed host to mountain pine beetle (Dendroctonus ponderosae), West. N. Am. Nat. 2021, 81, 19–26. [Google Scholar]
- Costello, S.L.; Schaupp, W.C., Jr. First Nebraska state collection record of the mountain pine beetle, Dendroctonus ponderosae Hopkins (Coleoptera: Curculionidae: Scolytinae). Coleopts. Bull. 2011, 65, 21–23. [Google Scholar] [CrossRef]
- Armendáriz-Toledano, F.; Torres-Banda, V.; Zúñiga, G. The current status of Dendroctonus ponderosae Hopkins (Coleoptera: Curculionidae: Scolytinae) in Mexico. Coleopts. Bull. 2017, 3, 565–570. [Google Scholar] [CrossRef]
- Langor, D.; Spence, J. Host effects on allozyme and morphological variation of the mountain pine beetle, Dendroctonus ponderosae Hopkins (Coleoptera: Scolytidae). Can. Entomol. 1991, 123, 395–410. [Google Scholar] [CrossRef]
- Sturgeon, K.B.; Mitton, J.B. Allozyme and morphological-differentiation of mountain pine beetles Dendroctonus ponderosae Hopkins (Coleoptera: Scolytidae) associated with host tree. Evolution 1986, 40, 290–302. [Google Scholar] [CrossRef]
- Samarasekera, G.D.N.G.; Bartell, N.V.; Lindgren, B.S.; Cooke, J.E.K.; Davis, C.S.; James, P.M.A.; Coltman, D.W.; Mock, K.E.; Murray, B.W. Spatial genetic structure of the mountain pine beetle (Dendroctonus ponderosae) outbreak in western Canada: Historical patterns and contemporary dispersal. Mol. Ecol. 2012, 21, 2931–2948. [Google Scholar] [CrossRef]
- Janes, J.K.; Li, Y.; Keeling, C.I.; Yuen, M.M.S.; Boone, C.K.; Cooke, J.E.K.; Bohlmann, J.; Huber, D.P.W.; Murray, B.W.; Coltman, D.W.; et al. How the mountain pine beetle (Dendroctonus ponderosae) breached the Canadian Rocky Mountains. Mol. Biol. Evol. 2014, 31, 1803–1815. [Google Scholar] [CrossRef]
- Batista, P.; Janes, J.K.; Boone, C.K.; Murray, B.W.; Sperling, F.A.H. Adaptive and neutral markers both show continent-wide population structure of mountain pine beetle (Dedroctonus ponderosae). Ecol. Evol. 2016, 6, 6292–6300. [Google Scholar] [CrossRef]
- Sambrook, J.; Russell, D.W. Molecular Cloning: A Laboratory Manual, 3rd ed.; Cold Spring Harbour Laboratory Press: New York, NY, USA, 2001. [Google Scholar]
- Davis, C.S.; Mock, K.E.; Bentz, B.J.; Bromilow, S.M.; Bartell, N.V.; Murray, B.W.; Roe, A.D.; Cooke, J.E.K. Isolation and characterization of sixteen microsatellite loci in the mountain pine beetle, Dendroctonus ponderosae Hopkins (Coleoptera: Curculionidae: Scolytinae). Mol. Ecol. Res. 2009, 9, 1071–1073. [Google Scholar] [CrossRef]
- Slatkin, M.; Excoffier, L. Testing for linkage disequilibrium in genotypic data using the Expectation-Maximization algorithm. Heredity 1996, 76, 377–383. [Google Scholar] [CrossRef] [PubMed]
- Holm, S. A simple sequential rejective multiple test procedure. Scand. J. Stat. 1979, 6, 65–70. [Google Scholar]
- Rice, W.R. Analyzing tables of statistical tests. Evolution 1989, 43, 223–225. [Google Scholar] [PubMed]
- Excoffier, L.; Lischer, H.E. Arlequin suite version 3.5: A new series of programs to perform population genetics analyses under Linux and Windows. Mol. Ecol Resour. 2010, 10, 564–567. [Google Scholar]
- Paquette, S.R. Useful Functions for (Batch) File Conversion and Data Resampling in Microsatellite Datasets, R Package Version 1.0; R Core Team: Vienna, Austria, 2012.
- Petit, R.; Mousadik, A.; Pons, O. Identifying populations for conservation on the basis of genetic markers. Conserv. Biol. 1998, 12, 844–855. [Google Scholar]
- Goudet, J. FSTAT (Version 2.9.3.2): A Program to Estimate and Test Gene Diversities and Fixation Indices. 2002. Available online: https://www.scienceopen.com/document?vid=79097bb4-ec3c-47c3-94a1-47085d721e6b (accessed on 27 March 2025).
- Pritchard, J.K.; Stephens, M.; Donnelly, P. Inference of population structure using multilocus genotype data. Genetics 2000, 155, 945–959. [Google Scholar] [CrossRef]
- Jakobsson, M.; Rosenberg, N.A. CLUMPP: A cluster matching and permutation program for dealing with label switching and multimodality in analysis of population structure. Bioinformatics 2007, 23, 1801–1806. [Google Scholar]
- Earl, D.A.; VonHoldt, B.M. STRUCTURE HARVESTER: A website and program for visualizing STRUCTURE output and implementing the Evanno method. Conserv. Gen. Resour. 2012, 4, 359–361. [Google Scholar]
- Jombart, T. Adegenet: A R package for the multivariate analysis of genetic markers. Bioinformatics 2008, 24, 1403–1405. [Google Scholar]
- Weir, B.S.; Cockerham, C.C. Estimating F-statistics for the analysis of population structure. Evolution 1984, 1, 1358–1370. [Google Scholar]
- Raffa, K.F.; Andersson, M.N.; Schlyter, F. Host selection by bark beetles: Playing the odds in a high-stakes game. In Advances in Insect Physiology; Academic Press: Cambridge, MA, USA, 2016; Volume 50, pp. 1–74. [Google Scholar]
- Barron, A.B. The life and death of Hopkins’ host-selection principle. J. Insect Behav. 2001, 14, 725–737. [Google Scholar]
- McKee, F.R.; Huber, D.P.W.; Lindgren, B.S.; Hodgkinson, R.S.; Aukema, B.H. Effect of natal and colonised host species on female host acceptance and male joining behaviour of the mountain pine beetle (Coleoptera: Curculionidae) using pine and spruce. Can. Entomol. 2015, 147, 39–45. [Google Scholar] [CrossRef]
- Powers, J. Spatial and Temporal Dynamics of the Douglas-Fir Bark Beetle (Dendroctonus pseudotsugae, Hopk.) in the Detroit Ranger District, Oregon: A Landscape Ecology Perspective. Master’s Thesis, Forest Science, Oregon State University, Corvallis, OR, USA, 1995. [Google Scholar]
- Huber, D.P.W.; Ralph, S.; Bohlmann, J. Genomic hardwiring and phenotypic plasticity of terpenoid-based defenses in conifers. J. Chem. Ecol. 2004, 30, 2399–2418. [Google Scholar] [CrossRef] [PubMed]
- Burke, J.L.; Carroll, A.L. Breeding matters: Natal experience influences population state-dependent host acceptance by an eruptive insect herbivore. PLoS ONE 2017, 12, e0172448. [Google Scholar]
- Boone, C.K.; Aukema, B.H.; Bohlmann, J.; Carroll, A.L.; Raffa, K.F. Efficacy of tree defense physiology varies with bark beetle population density: A basis for positive feedback in eruptive species. Can. J. For. Res. 2011, 41, 1174–1188. [Google Scholar]
- Wallin, K.F.; Rutledge, J.; Raffa, K.F. Heritability of host acceptance and gallery construction behaviors of the bark beetle Ips pini (Coleoptera: Scolytidae). Environ. Entomol. 2002, 31, 1276–1281. [Google Scholar]
- Erbilgin, N.; Ma, C.; Whitehouse, C.; Shan, B.; Najar, A.; Evenden, M. Chemical similarity between historical and novel host plants promotes range and host expansion of the mountain pine beetle in a naïve host ecosystem. New Phytol. 2014, 201, 940–950. [Google Scholar]
- Rosenberger, D.W.; Venette, R.C.; Maddox, M.P.; Aukema, B.H. Colonization behaviors of mountain pine beetle on novel hosts: Implications for range expansion into northeastern North America. PLoS ONE 2017, 12, e0176269. [Google Scholar]
- Cognato, A.I.; Harlin, A.D.; Fisher, M.L. Genetic structure among pinyon pine beetle populations (Scolytinae: Ips confusus). Environ. Entomol. 2003, 32, 1262–1270. [Google Scholar]
- Manhas, J. (University of Northern British Columbia, Prince George, BC, Canada); Murray, B.W. (University of Northern British Columbia, Prince George, BC, Canada). Undergraduate Research Award Report: Genetic Analysis of Mitochondrial DNA of Mountain Pine Beetle in California Sugar Pine. 2019; Unpublished work. [Google Scholar]
- Kerdelhué, C.; Magnoux, E.; Lieutier, F.; Roques, A.; Rousselet, J. Comparative population genetic study of two oligophagous insects associated with the same hosts. Heredity 2006, 97, 38–45. [Google Scholar]
- Cullingham, C.I.; Roe, A.D.; Sperling, F.A.H.; Coltman, D.W. Phylogeographic insights into an irruptive pest outbreak. Ecol. Evol. 2012, 2, 908–919. [Google Scholar] [CrossRef] [PubMed]
- Allendorf, F.W.; Luikart, G.H.; Aitken, S.N. Conservation and the Genetics of Populations; Wiley-Blackwell: Hoboken, NJ, USA, 2012. [Google Scholar]
- Klopfstein, S. The fate of mutations surfing on the wave of a range expansion. Mol. Biol. Evol. 2005, 23, 482–490. [Google Scholar] [CrossRef] [PubMed]
- Dowle, E.J.; Bracewell, R.R.; Pfrender, M.E.; Mock, K.E.; Bentz, B.J.; Ragland, G.J. Reproductive isolation and environmental adaptation shape the phylogeography of mountain pine beetle (Dendroctonus ponderosae). Mol. Ecol. 2017, 26, 6071–6084. [Google Scholar] [CrossRef] [PubMed]
- Bracewell, R.R.; Pfrender, M.E.; Mock, K.E.; Bentz, B.J. Cryptic postzygotic isolation in an eruptive species of bark beetle (Dendroctonus ponderosae). Evolution 2011, 65, 961–975. [Google Scholar] [CrossRef]
- Bracewell, R.R.; Bentz, B.J.; Sullivan, B.T.; Good, J.M. Rapid neo-sex chromosome evolution and incipient speciation in a major forest pest. Nat. Comm. 2017, 8, 1593. [Google Scholar] [CrossRef]
- Slatkin, M. Gene flow and the geographic structure of natural populations. Science 1987, 236, 787–792. [Google Scholar] [CrossRef]
- Bromham, L. Reading the Story in DNA: A Beginner’s Guide to Molecular Evolution; Oxford University Press: Oxford, UK, 2008. [Google Scholar]
- Caballero, A.; García-Dorado, A. Allelic diversity and its implications for the rate of adaptation. Genetics 2013, 195, 1373–1384. [Google Scholar] [CrossRef]
- Greenbaum, G.; Templeton, A.R.; Zarmi, Y.; Bar-David, S. Allelic richness following population founding events—A stochastic modeling framework incorporating gene flow and genetic drift. PLoS ONE 2014, 9, e115203. [Google Scholar] [CrossRef]
- Konnert, M.; Bergmann, F. The geographical distribution of genetic variation of silver fir (Abies alba, Pinaceae) in relation to its migration history. Plant Syst. Evol. 1995, 196, 19–30. [Google Scholar] [CrossRef]
- Schaetzl, R.J.; Anderson, S. Soils: Genesis and Geomorphology; Cambridge University Press: Cambridge, UK, 2005. [Google Scholar]
- Burke, J.L.; Bohlmann, J.; Carroll, A.L. Consequences of distributional asymmetry in a warming environment: Invasion of novel forests by the mountain pine beetle. Ecosphere 2017, 8, e01778. [Google Scholar] [CrossRef]
- Lewis, M.A.; Kareiva, P. Allee dynamics and the spread of invading organisms. Theor. Popul. Biol. 1993, 43, 141–158. [Google Scholar] [CrossRef]
- Chase, K.D.; Kelly, D.; Liebhold, A.M.; Brockerhoff, E.G. The role of propagule pressure in experimental bark beetle invasions. J. Appl. Ecol. 2023, 60, 342–352. [Google Scholar] [CrossRef]
- Evenden, M.L.; Whitehouse, C.M.; Sykes, J. Factors influencing flight capacity of the mountain pine beetle (Coleoptera: Curculionidae: Scolytinae). Environ. Entomol. 2014, 43, 187–196. [Google Scholar] [CrossRef] [PubMed]
- Shafer, A.B.A.; Cullingham, C.I.; Côté, S.D.; Coltman, D.W. Of glaciers and refugia: A decade of study sheds new light on the phylogeography of northwestern North America. Mol. Ecol. 2010, 19, 4589–4621. [Google Scholar] [CrossRef]
- Vucetich, J.A.; Waite, T.A. Spatial patterns of demography and genetic processes across the species’ range: Null hypotheses for landscape conservation genetics. Conserv. Genet. 2003, 4, 639–645. [Google Scholar] [CrossRef]
- Raffa, K.F.; Aukema, B.H.; Bentz, B.J.; Carroll, A.L.; Hicke, J.A.; Turner, M.G.; Romme, W.H. Cross-scale drivers of natural disturbances prone to anthropogenic amplification: The dynamics of bark beetle eruptions. Bioscience 2008, 58, 501–517. [Google Scholar] [CrossRef]
- Cognato, A.I.; Grimaldi, D. 100 million years of morphological conservation in bark beetles (Coleoptera: Curculionidae: Scolytinae). Syst. Entomol. 2009, 34, 93–100. [Google Scholar] [CrossRef]
- Thompson, J.N. Specific hypotheses on the geographic mosaic of coevolution. Am. Nat. 1999, 153, S1–S14. [Google Scholar] [CrossRef]
- Farrell, B.D.; Sequeira, A.; O’Meara, B.; Normark, B.B.; Chung, J.; Jordal, B.H. The evolution of agriculture in beetles (Curculionidae: Scolytinae and Platypodinae). Evolution 2001, 55, 2011–2027. [Google Scholar]


| Location | Code | Latitude (N) | Longitude (W) | Elevation (m) | Host | Flight Year Sampled | N | HO | HE | NA | AR | Private Alleles | FIS |
|---|---|---|---|---|---|---|---|---|---|---|---|---|---|
| ~Canada~ | |||||||||||||
| British Columbia | |||||||||||||
| Fort St. John | FJo | 56.57329 | 121.40309 | 848 | Pinus contorta | 2011 | 33 | 0.478 | 0.476 | 4.46 | 3.77 | 0 | −0.016 |
| Tumbler Ridge 1 | TR 1 | 55.53868 | 121.98475 | 874 | Pinus contorta | 2008 | 69 | 0.483 | 0.478 | 5.46 | 3.87 | 0.077 | −0.002 |
| Tumbler Ridge 2 | TR 2 | 55.17899 | 121.11240 | 1047 | Pinus contorta | 2010 | 45 | 0.493 | 0.499 | 4.62 | 3.72 | 0 | 0.019 |
| Tumbler Ridge 3 | TR 3 | 55.18290 | 120.85255 | 1254 | Pinus contorta | 2011 | 37 | 0.492 | 0.484 | 4.77 | 3.84 | 0 | −0.015 |
| Mackenzie 1 | MA 1 | 54.69646 | 122.81945 | 737 | Pinus contorta | 2005 | 50 | 0.512 | 0.498 | 5.00 | 3.90 | 0 | −0.018 |
| Mackenzie 2 | MA 2 | 55.26532 | 124.20967 | 1006 | Pinus contorta | 2010 | 47 | 0.501 | 0.495 | 4.62 | 3.76 | 0 | 0.001 |
| Smithers 1 | SM 1 | 54.92788 | 127.34918 | 582 | Pinus contorta | 2010 | 41 | 0.435 | 0.456 | 4.69 | 3.63 | 0 | 0.059 |
| Smithers 2 | SM 2 | 54.70141 | 126.81831 | 986 | Pinus contorta | 2011 | 29 | 0.501 | 0.480 | 3.92 | 3.47 | 0 | −0.038 |
| Fort St. James 1 | FJa 1 | 54.64493 | 124.41967 | 860 | Pinus contorta | 2005 | 44 | 0.467 | 0.478 | 4.46 | 3.67 | 0.077 | 0.035 |
| Fort St. James 2: John Prince Research Forest | FJa 2 | 54.63600 | 124.41300 | 794 | Pinus contorta | 2003 | 29 | 0.501 | 0.473 | 3.92 | 3.52 | 0 | −0.043 |
| Terrace | TE | 54.45736 | 128.51430 | 124 | Pinus contorta | 2010 | 27 | 0.442 | 0.454 | 3.92 | 3.45 | 0 | 0.047 |
| Francois Lake | FL | 54.03160 | 124.93888 | 781 | Pinus contorta | 2006 | 53 | 0.463 | 0.456 | 4.46 | 3.47 | 0 | −0.005 |
| Houston | HO | 53.99381 | 126.65223 | 829 | Pinus contorta | 2006 | 50 | 0.486 | 0.476 | 5.00 | 3.68 | 0 | −0.012 |
| Prince George 1 | PG | 53.90695 | 122.80786 | 607 | Pinus contorta | 2005 | 48 | 0.492 | 0.511 | 5.92 | 4.33 | 0 | 0.048 * |
| Prince George 2 | PG-Sx | 53.89944 | 122.80250 | 607 | Picea glauca × engelmannii | 2007 | 26 | 0.461 | 0.502 | 4.46 | 3.89 | 0 | 0.100 * |
| Kakwa | KA | 53.71290 | 119.74320 | 1735 | Pinus contorta | 2007/08 | 59 | 0.542 | 0.530 | 6.15 | 4.44 | 0 | −0.014 |
| McBride | MB | 53.31225 | 120.12705 | 934 | Pinus contorta | 2005 | 50 | 0.523 | 0.535 | 6.15 | 4.55 | 0 | 0.033 |
| Quesnel | QU | 53.02741 | 122.28135 | 885 | Pinus contorta | 2006 | 55 | 0.511 | 0.527 | 6.08 | 4.30 | 0 | 0.040 |
| Mount Robson | MR | 52.89475 | 118.73481 | 1100 | Pinus contorta | 2005 | 45 | 0.583 | 0.602 | 6.69 | 5.11 | 0.077 | 0.043 * |
| Valemount | VM | 52.80384 | 119.26608 | 817 | Pinus contorta | 2010 | 133 (3) | 0.550 | 0.574 | 7.85 | 4.82 | 0 | 0.044 ** |
| Tweedsmuir | TW | 52.53722 | 125.82161 | 1570 | Pinus albicaulis | 2008 | 47 | 0.466 | 0.485 | 4.85 | 3.84 | 0 | 0.049 |
| Tatla Lake | TA | 51.97145 | 124.41316 | 949 | Pinus contorta | 2006 | 49 | 0.487 | 0.485 | 5.31 | 4.06 | 0 | 0.006 |
| Farwell Canyon | FC | 51.78696 | 122.64419 | 970 | Pinus contorta | 2006 | 56 | 0.501 | 0.526 | 5.77 | 4.27 | 0 | 0.056 * |
| Wells Gray | WG | 51.74090 | 120.01217 | 755 | Pinus contorta | 2006 | 50 | 0.623 | 0.613 | 7.08 | 5.13 | 0 | −0.006 |
| Lac La Hache | LH | 51.73423 | 121.60866 | 996 | Pinus contorta | 2006 | 48 | 0.554 | 0.561 | 6.31 | 4.68 | 0 | 0.022 |
| Chilcotin: Yohetta Valley | YV | 51.25289 | 123.73908 | 1417 | Pinus contorta | 2012 | 26 | 0.573 | 0.534 | 4.85 | 4.27 | 0 | −0.061 |
| Chasm | CM | 51.22198 | 121.48003 | 1081 | Pinus ponderosa | 2008 | 30 | 0.585 | 0.603 | 6.31 | 5.12 | 0 | 0.045 |
| Golden | GO | 51.07443 | 116.38160 | 1338 | Pinus contorta | 2008 | 107 (2) | 0.618 | 0.615 | 9.00 | 5.32 | 0 | 0.000 |
| Kootenay | KO | 50.64360 | 115.97833 | 1233 | Pinus contorta | 2006 | 44 | 0.643 | 0.636 | 6.54 | 5.17 | 0 | 0.000 |
| Falkland | FA | 50.51995 | 119.60180 | 1147 | Pinus contorta | 2006 | 52 | 0.623 | 0.613 | 7.31 | 5.19 | 0 | −0.006 |
| Kamloops | KA | 50.48598 | 120.53225 | 1326 | Pinus contorta | 2006 | 45 | 0.619 | 0.635 | 7.23 | 5.24 | 0 | 0.036 |
| Pemberton | PE | 50.43234 | 122.25256 | 1145 | Pinus contorta | 2010 | 39 | 0.577 | 0.600 | 6.92 | 5.22 | 0 | 0.038 |
| Whistler | WH | 50.16656 | 122.92309 | 699 | Pinus contorta | 2006 | 43 | 0.572 | 0.614 | 5.69 | 4.47 | 0 | 0.079 * |
| Purcell Wilderness: Argenta | AR | 50.16061 | 116.92038 | 547 | Pinus contorta | 2006 | 48 | 0.596 | 0.618 | 7.54 | 5.27 | 0.077 | 0.045 |
| Peachland | PL | 49.79806 | 120.05524 | 1280 | Pinus contorta | 2010 | 46 | 0.624 | 0.623 | 7.00 | 5.26 | 0 | 0.009 |
| Kimberley | KI | 49.69622 | 115.96006 | 1110 | Pinus contorta | 2010 | 96 | 0.604 | 0.624 | 8.38 | 5.16 | 0.077 | 0.038 * |
| Cranbrook 1 | CR 1 | 49.40863 | 115.64619 | 1379 | Pinus contorta | 2010 | 48 | 0.605 | 0.619 | 7.38 | 5.15 | 0 | 0.031 |
| Cranbrook 2 | CR 2 | 49.43686 | 115.56808 | 1299 | Pinus contorta | 2011 | 40 | 0.581 | 0.636 | 7.54 | 5.51 | 0 | 0.081 ** |
| Sparwood | SP | 49.67968 | 114.91050 | 1373 | Pinus contorta | 2008 | 65 | 0.600 | 0.614 | 7.92 | 5.14 | 0.077 | 0.031 |
| Merritt–Summerland | ME | 49.63365 | 120.12916 | 1830 | Pinus contorta | 2011 | 34 | 0.570 | 0.595 | 6.08 | 4.96 | 0 | 0.034 |
| Crowsnest Pass | CP | 49.62933 | 114.69560 | 1393 | Pinus contorta | 2007/08 | 50 | 0.643 | 0.635 | 6.46 | 4.84 | 0 | −0.003 |
| Gladstone Area: Nancy Green | NG | 49.25917 | 117.92777 | 1314 | Pinus contorta | 2006 | 47 | 0.660 | 0.635 | 7.15 | 5.21 | 0 | −0.029 |
| Manning Park | MP | 49.21708 | 121.06856 | 695 | Pinus contorta | 2006 | 46 | 0.604 | 0.631 | 7.15 | 5.14 | 0.077 | 0.056 * |
| Alberta | |||||||||||||
| Peace Area | PA | 56.70729 | 118.27617 | 877 | Pinus contorta | 2010 | 120 (3) | 0.477 | 0.477 | 5.54 | 3.70 | 0.077 | −0.001 |
| Fairview | FV | 56.12836 | 118.54752 | 633 | Pinus contorta | 2007/08 | 48 | 0.474 | 0.483 | 5.00 | 3.84 | 0 | 0.029 |
| Valleyview | VV | 54.81928 | 116.69167 | 762 | Pinus contorta | 2010 | 38 | 0.481 | 0.470 | 4.54 | 3.69 | 0 | −0.014 |
| Grande Prairie 1 | GP 1 | 54.79800 | 119.78500 | 919 | Pinus contorta | 2007/08 | 44 | 0.526 | 0.509 | 5.15 | 3.98 | 0 | −0.022 |
| Grande Prairie 2 | GP 2 | 54.69847 | 119.68411 | 1019 | Pinus contorta | 2010 | 136 (3) | 0.490 | 0.487 | 5.92 | 3.77 | 0 | −0.004 |
| Fox Creek | FO | 54.31057 | 116.63118 | 897 | Pinus contorta | 2010 | 67 | 0.472 | 0.479 | 5.15 | 3.70 | 0 | 0.017 |
| Lake Louise | LL | 51.41716 | 116.17934 | 1562 | Pinus contorta | 2006 | 42 | 0.610 | 0.621 | 6.46 | 5.07 | 0 | 0.031 |
| Canmore | CA | 51.00175 | 115.07043 | 1472 | Pinus contorta | 2010 | 54 | 0.604 | 0.611 | 6.92 | 4.89 | 0.077 | 0.011 |
| Saskatchewan | |||||||||||||
| Cypress Hills | CH | 49.58696 | 110.00257 | 1316 | Pinus contorta | 2011 | 64 | 0.632 | 0.631 | 6.54 | 4.98 | 0.077 | 0.006 |
| ~United States~ | |||||||||||||
| Washington | |||||||||||||
| Okanogan–Wenatchee NF: Bryan Butte | WA-Pa | 48.10614 | 120.29814 | 1971 | Pinus albicaulis | 2011 | 24 | 0.609 | 0.614 | 5.54 | 4.85 | 0 | 0.029 |
| Okanogan–Wenatchee NF: Cooper Mountain | WA-Pc | 48.00527 | 120.07728 | 1688 | Pinus contorta | 2011 | 46 | 0.580 | 0.607 | 7.08 | 5.09 | 0.077 | 0.054 * |
| Okanogan–Wenatchee NF: Gold Creek | WA-Pp | 48.11701 | 120.20174 | 1185 | Pinus ponderosa | 2011 | 14 | 0.615 | 0.589 | 4.69 | 4.69 | 0 | −0.008 |
| Okanogan–Wenatchee NF: Cottonwood Campground | WA-Pm | 48.01963 | 120.64279 | 968 | Pinus monticola | 2011 | 48 | 0.632 | 0.649 | 7.62 | 5.49 | 0.077 | 0.038 |
| Montana | |||||||||||||
| Beaverheaed NF: Pioneer Mountains | MT-Pc | 45.53437 | 113.08011 | 2104 | Pinus contorta | 2011 | 66 | 0.578 | 0.614 | 7.15 | 5.00 | 0.077 | 0.065 ** |
| Greenough: Lubrecht Experimental Forest | MT-Pp | 46.89571 | 113.45257 | 1279 | Pinus ponderosa | 2011 | 44 | 0.615 | 0.596 | 6.69 | 5.06 | 0 | −0.021 |
| Oregon | |||||||||||||
| Fremont–Winema NF: Yamsay Mountain | OR-Pc | 42.94653 | 121.40015 | 2003 | Pinus contorta | 2011 | 42 | 0.657 | 0.659 | 8.54 | 5.92 | 0.231 | 0.006 |
| Fremont–Winema NF: Yamsay Mountain | OR-Pm | 42.94646 | 121.39919 | 2042 | Pinus monticola | 2011 | 33 | 0.630 | 0.632 | 8.00 | 5.81 | 0.308 | 0.014 |
| Fremont–Winema NF: Yamsay Mountain | OR-Pa | 42.93809 | 121.38464 | 2192 | Pinus albicaulis | 2011 | 39 | 0.650 | 0.661 | 7.77 | 5.75 | 0.231 | 0.027 |
| Idaho | |||||||||||||
| Clearwater NF: Lolo Motorway | ID-Cl | 46.36302 | 115.60694 | 1593 | Pinus contorta | 2011 | 36 | 0.634 | 0.640 | 7.00 | 5.38 | 0.077 | −0.001 |
| Payette NF: Burgdorf Road | ID-Pa | 45.27414 | 115.90974 | 1890 | Pinus contorta | 2011 | 49 | 0.598 | 0.633 | 6.77 | 4.98 | 0.077 | 0.064 * |
| Boise NF: Bull Trout Lake | ID-Bo | 44.30280 | 115.25728 | 2135 | Pinus contorta | 2011 | 23 | 0.625 | 0.606 | 5.31 | 4.74 | 0.077 | 0.012 |
| Sawtooth NF: Railroad Ridge | ID-RR | 44.14782 | 114.55540 | 2862 | Pinus contorta | 2004 | 25 | 0.655 | 0.636 | 6.15 | 5.33 | 0 | −0.011 |
| Sawtooth NF: Pettit Lake | ID-PL | 43.97905 | 114.86303 | 2136 | Pinus contorta | 2003 | 25 | 0.637 | 0.639 | 5.69 | 5.01 | 0.077 | 0.024 |
| Sawtooth NF: South Cherry | ID-SC | 43.85253 | 114.63931 | 2229 | Pinus contorta | 2003 | 36 | 0.610 | 0.618 | 7.15 | 5.41 | 0 | 0.024 |
| Wyoming | |||||||||||||
| Bridger–Teton NF | WY-Pc | 43.13151 | 110.86586 | 1878 | Pinus contorta | 2011 | 48 | 0.508 | 0.510 | 4.46 | 3.63 | 0 | 0.013 |
| South Dakota | |||||||||||||
| Black Hills NF: Battle Axe Road | SD-BA | 43.95092 | 103.63156 | 1718 | Pinus ponderosa | 2011/12 | 34 | 0.515 | 0.513 | 6.69 | 4.89 | 0.077 | 0.010 |
| Black Hills NF: Flag Mountain Road | SD-FM | 44.08683 | 103.87753 | 2051 | Pinus ponderosa | 2012 | 24 | 0.512 | 0.551 | 6.08 | 5.06 | 0.077 | 0.090 * |
| California | |||||||||||||
| Lassen NF: FR 29N17 | CA-Pl | 40.27562 | 121.30864 | 1616 | Pinus lambertiana | 2011 | 22 | 0.603 | 0.618 | 6.85 | 5.94 | 0.308 | 0.037 |
| Modoc NF: Lily Lake | CA-Pc | 41.97622 | 120.21172 | 2056 | Pinus contorta | 2011 | 40 | 0.612 | 0.626 | 8.08 | 5.60 | 0 | 0.031 |
| Modoc NF | CA-Pa | 41.22671 | 120.14907 | 2362 | Pinus albicaulis | 2011 | 42 | 0.636 | 0.659 | 7.62 | 5.68 | 0.154 | 0.045 * |
| Nevada | |||||||||||||
| Tahoe NF: Mount Rose Ski Resort | NV-Pc | 39.32343 | 119.89266 | 2587 | Pinus contorta | 2011 | 30 | 0.664 | 0.674 | 7.69 | 5.97 | 0.154 | 0.032 |
| Utah | |||||||||||||
| Ashley NF: Uinta Mountains | UT-Pc | 40.87429 | 109.77935 | 2598 | Pinus contorta | 2011 | 41 | 0.533 | 0.515 | 4.54 | 3.66 | 0 | −0.028 |
| Ashley NF: Uinta Mountains | UT-Pp | 40.88047 | 109.75250 | 2535 | Pinus ponderosa | 2011 | 47 | 0.549 | 0.539 | 4.85 | 3.89 | 0 | −0.009 |
| Logan Canyon | UT-Pf | 41.96652 | 111.53381 | 2149 | Pinus flexilis | 2011 | 47 | 0.501 | 0.492 | 4.38 | 3.55 | 0 | −0.013 |
| Colorado | |||||||||||||
| Roosevelet NF: Red Feather Lakes | CO-Pf | 40.74709 | 105.60649 | 2725 | Pinus flexilis | 2011 | 45 | 0.546 | 0.518 | 5.46 | 4.19 | 0.077 | −0.047 |
| Roosevelet NF: Red Feather Lakes | CO-Pp | 40.74801 | 105.60812 | 2700 | Pinus ponderosa | 2011 | 45 | 0.505 | 0.530 | 5.23 | 4.10 | 0 | 0.056 * |
| Roosevelet NF: Red Feather Lakes | CO-Pc | 40.76196 | 105.61379 | 2657 | Pinus contorta | 2011 | 32 | 0.517 | 0.541 | 5.08 | 4.26 | 0 | 0.060 |
| Colorado: Fraser Experimental Forest | CO-FEF | 39.80280 | 105.95990 | 3312 | Pinus contorta | 2006 | 40 | 0.555 | 0.533 | 4.69 | 3.89 | 0 | −0.032 |
| Arizona | |||||||||||||
| Coronado NF: Pinaleno Mountains | M033-03 | 32.66342 | 109.87074 | 2751 | Pinus strobiformis | 2011 | 29 | 0.424 | 0.472 | 4.00 | 3.63 | 0 | 0.108 ** |
| Locus | NA | HE | HO | HWE | Fixation Indices | |||
|---|---|---|---|---|---|---|---|---|
| FIS | p | FST | p | |||||
| Dpo028 | 25 | 0.488 | 0.463 | 7 | 0.051 | ns | 0.067 | *** |
| Dpo103 | 25 | 0.806 | 0.809 | 5 | −0.004 | ns | 0.053 | *** |
| Dpo160 | 36 | 0.717 | 0.723 | 7 | −0.008 | ns | 0.077 | *** |
| Dpo453 | 26 | 0.659 | 0.624 | 7 | 0.053 | ns | 0.039 | *** |
| Dpo479 | 11 | 0.612 | 0.607 | 4 | 0.008 | ns | 0.110 | *** |
| Dpo530 | 10 | 0.643 | 0.638 | 4 | 0.008 | ns | 0.061 | *** |
| Dpo566 | 12 | 0.288 | 0.293 | 3 | −0.016 | ns | 0.040 | *** |
| Dpo760 | 22 | 0.591 | 0.591 | 1 | 0.000 | ns | 0.076 | *** |
| Dpo780 | 15 | 0.564 | 0.563 | 0 | 0.002 | ns | 0.064 | *** |
| Dpo793 | 12 | 0.567 | 0.570 | 2 | −0.006 | ns | 0.128 | *** |
| MPB011 | 15 | 0.545 | 0.525 | 1 | 0.037 | ns | 0.048 | *** |
| MPB017 | 23 | 0.443 | 0.439 | 3 | 0.009 | ns | 0.168 | *** |
| MPB038 | 18 | 0.400 | 0.403 | 9 | −0.008 | ns | 0.219 | *** |
| Test | Source of Variation | d.f. | SS | Variance Component | % Var | Fixation Index | p-Value |
|---|---|---|---|---|---|---|---|
| ALL | AG (FCT) | 1 | 28.368 | 0.0056 | −0.14 | −0.0014 | 0.440 |
| (25) | APwG (FSC) | 23 | 730.987 | 0.3411 | 8.36 | 0.0835 | <0.001 |
| WP (FST) | 2043 | 7648.623 | 3.7438 | 91.77 | 0.0823 | <0.001 | |
| Ponderosa | AG (FCT) | 1 | 7.876 | 0.0378 | −0.96 | −0.0096 | 0.737 |
| (10) | APwG (FSC) | 8 | 173.749 | 0.2205 | 5.62 | 0.0556 | <0.001 |
| WP (FSC) | 822 | 3078.354 | 3.7450 | 95.35 | 0.0465 | <0.001 | |
| Whitebark | AG (FCT) | 1 | 3.493 | 0.0970 | −2.34 | −0.0234 | 0.972 |
| (8) | APwG (FSC) | 6 | 205.927 | 0.3725 | 8.98 | 0.0878 | <0.001 |
| WP (FSC) | 652 | 2524.753 | 3.8723 | 93.36 | 0.0664 | <0.001 | |
| Other | AG (FCT) | 1 | 11.951 | 0.0525 | −1.28 | −0.0128 | 0.795 |
| (10) | APwG (FSC) | 8 | 251.035 | 0.3516 | 8.55 | 0.0845 | <0.001 |
| WP (FSC) | 782 | 2979.756 | 3.8104 | 92.72 | 0.0728 | <0.001 |
Disclaimer/Publisher’s Note: The statements, opinions and data contained in all publications are solely those of the individual author(s) and contributor(s) and not of MDPI and/or the editor(s). MDPI and/or the editor(s) disclaim responsibility for any injury to people or property resulting from any ideas, methods, instructions or products referred to in the content. |
© 2025 by the authors. Licensee MDPI, Basel, Switzerland. This article is an open access article distributed under the terms and conditions of the Creative Commons Attribution (CC BY) license (https://creativecommons.org/licenses/by/4.0/).
Share and Cite
Boone, C.K.; Thompson, K.M.; Henry, P.; Murray, B.W. Host Use Does Not Drive Genetic Structure of the Mountain Pine Beetle, Dendroctonus ponderosae (Coleoptera: Curculionidae: Scolytinae), in Western North America. Forests 2025, 16, 649. https://doi.org/10.3390/f16040649
Boone CK, Thompson KM, Henry P, Murray BW. Host Use Does Not Drive Genetic Structure of the Mountain Pine Beetle, Dendroctonus ponderosae (Coleoptera: Curculionidae: Scolytinae), in Western North America. Forests. 2025; 16(4):649. https://doi.org/10.3390/f16040649
Chicago/Turabian StyleBoone, Celia K., Kirsten M. Thompson, Philippe Henry, and Brent W. Murray. 2025. "Host Use Does Not Drive Genetic Structure of the Mountain Pine Beetle, Dendroctonus ponderosae (Coleoptera: Curculionidae: Scolytinae), in Western North America" Forests 16, no. 4: 649. https://doi.org/10.3390/f16040649
APA StyleBoone, C. K., Thompson, K. M., Henry, P., & Murray, B. W. (2025). Host Use Does Not Drive Genetic Structure of the Mountain Pine Beetle, Dendroctonus ponderosae (Coleoptera: Curculionidae: Scolytinae), in Western North America. Forests, 16(4), 649. https://doi.org/10.3390/f16040649