Article

Using Environmental DNA as a Plant Health Surveillance Tool in Forests

by
Kirsty Elizabeth McLaughlin
1,*,
Hadj Ahmed Belaouni
1,
Andrew McClure
1,
Kelly McCullough
1,
David Craig
1,
Joanne McKeown
1,
Michael Andrew Stevenson
1,
Eugene Carmichael
1,
Johnathan Dalzell
1,
Richard O’Hanlon
2,
Archie Kelso Murchie
1 and
Neil Warnock
1
1
Agri-Food and Bioscience Institute, Belfast BT9 5PX, Northern Ireland, UK
2
Department of Agriculture, Food and the Marine, Dublin D02 WK12, Ireland
*
Author to whom correspondence should be addressed.
Forests 2025, 16(4), 632; https://doi.org/10.3390/f16040632
Submission received: 19 February 2025 / Revised: 31 March 2025 / Accepted: 2 April 2025 / Published: 4 April 2025
(This article belongs to the Special Issue Forest Pathogens: Detection, Diagnosis, and Control)

Abstract

:
Plant pests (including pathogens) threaten forests, reduce carbon sequestration, disrupt trade, and are costly to manage. Traditionally, forest surveys involve the visual inspection of trees for symptoms of disease; however, this process is time consuming and by the time symptoms are observed, the disease may be widespread. New methods of surveillance are needed to help plant health authorities monitor and protect forests from disease. Previous research has shown that metabarcoding of environmental DNA (eDNA) can be used to identify plant pests. This study collected rainwater samples from five forest sites across Northern Ireland every month for a year to examine whether eDNA metabarcoding could help authorities detect plant diseases in forests. Metabarcoding of the internal transcribed spacer (ITS) region was used to determine the fungal and oomycete profile of rainwater samples that passed through the canopy of spruce, pine, oak, and ash trees, along with a non-tree field trap. In total, 65 known plant fungal and oomycete pests were detected; seven were regulated pests, and two were pests that had not been previously identified in Northern Ireland. This work demonstrates that metabarcoding of eDNA from rainwater can detect plant pests and could be used in forest surveillance programmes.

1. Introduction

Plant pests (including pathogens) have a devasting impact on the economy and the environment. The Food and Agriculture Organisation (FAO) estimates that up to 40% of global crop production is lost to plant diseases each year, costing over $220 billion [1]. Invasive alien species, which include plant pests, are a major cause of global biodiversity loss [2] and modern extinctions [3]. Plant pests seriously compromise efforts to increase forest coverage, thus reducing the amount of carbon that forests can sequester [4]. Global trade and a changing climate are two major factors driving the spread of plant pests. Non-native plant pests are routinely intercepted at national trade borders and outbreaks of destructive plant pests occur regularly world-wide [5]. The International Plant Protection Convention (IPPC) has adopted a series of International Standards for Phytosanitary Measures (ISPMs) to help National Plant Protection Organisations (NPPOs) protect plant health [6]. NPPOs are responsible for implementing phytosanitary measures that aim to prevent the entry of plant pests into the NPPO’s territory and control plant pests when they are found. NPPOs are also responsible for conducting national surveys to demonstrate that their jurisdiction is free from regulated or emerging pests. Control actions taken by NPPOs must balance the serious socio-economic impacts of establishing phytosanitary controls, relative to the potential impact of pest establishment.
Internationally, pests are categorised on the basis of risk into ‘quarantine pests’ and ‘regulated non-quarantine pests’. Quarantine pests are generally not present in a region, whereas regulated non-quarantine pests are generally present in the region, but their spread is undesirable. Pests are categorised following a pest risk assessment (PRA), which considers the economic damage of the pest, the pathways of entry, and the likelihood of the pest becoming established. Governments have introduced legislation that requires NPPOs to conduct surveys for non-native plant pests with the most serious pests surveyed continually [7,8]. Contingency plans are created for the highest risk pests, this prepares a response by plant health authorities should a serious pest be intercepted in trade or the wider environment ensuring NPPOs can rapidly implement controls after a finding. ISPM 9 [6] provides guidelines for pest eradication in the event of an environmental finding of a quarantine pest. A delimiting survey is carried out to identify the extent of the outbreak. An assessment on whether eradication is possible will be based on the extent of the outbreak, the potential pathways of spread, the likelihood of establishment, and whether eradication is cost-effective. If eradication is attempted, a management team will be established to coordinate the implementation of controls, monitor the effectiveness of statutory action, and verify whether the pest has been successfully eliminated (ISPM 9). In forests, eradication usually involves the felling and burning of trees, or felling and deep burial, although there may also be chemical treatments of soil and plants [9].
Eradication can be costly. In the UK, the cost of eradicating Asian longhorn beetle in Southern England in 2012 was GBP 2 million [10] and eradication of pinewood nematode in Australia cost USD 5 million [11]. However, eradication costs can be dwarfed by the recurring management costs if a pest becomes established. Management of the Xylella fastidiosa outbreaks in Europe is projected to cost over EUR 20 billion [12]. Ash dieback is predicted to cost the UK GBP 15 billion over the next few decades, with over a third of these costs attributed to safely felling and replanting trees [13].
Pluess et al. undertook a review to examine which factors determined the success or failure of eradication schemes of non-native species [14]. They showed that eradication schemes that were unsuccessful often failed because the infestation had reached a size which made it impossible to contain. Conversely, eradication was more likely to be successful when controls were implemented early in the infestation. To support policymakers and inspectors, scientists at official plant health laboratories participate in statutory diagnostics and surveillance programmes to help NPPOs monitor for the presence of plant pests in trade and the environment. Identification of pests has historically focused on testing plants that are symptomatic. In forestry, identifying disease outbreaks can be challenging because it is impossible to visually inspect all forests and all trees for symptoms of disease. By the time disease outbreaks have been identified, the disease might have been present for several years, and it may have spread over such a large area that it makes eradication challenging.
Quantitative PCR (qPCR) is the most common molecular diagnostic technique in plant health laboratories. It can detect specific plant pests with a high degree of accuracy even when the pest is present at low levels in the sample. It is relatively easy to perform and interpret, it can be quickly adapted to a range of different sample types and pests, and it is inexpensive to run. However, qPCR has its drawbacks; it requires a priori knowledge of the pest to select the correct primers, it can struggle to distinguish between closely related species and pathotypes, and since it is a targeted diagnostic method it is not suitable for the detection of unknown pests [15]. Next Generation Sequencing (NGS) is a flexible molecular technique that allows the biological content of samples to be profiled using either shotgun or targeted sequencing, i.e., 16S ribosomal RNA gene (16S), internal transcribed spacer (ITS) region or Cytochrome c oxidase subunit I (COI). Importantly, NGS is not restricted by a priori knowledge of the pest, and it can detect new or unknown pests from an infested sample [15]. However, it is more expensive than qPCR to perform, and it can be technically challenging to analyse and interpret the data. Currently, NGS is not widely used in plant health diagnostics or surveillance programmes, but the benefits it offers are potentially large and worth studying.
A survey of stakeholders involved in tree and forest management showed that they wanted new ways to detect and manage plant pests [16]. This included the metabarcoding of eDNA obtained from air and water samples. Environmental DNA found in water, soil, and air can contain the DNA of organisms present in the surrounding environment [17,18]. Applying metabarcoding to eDNA could transform the way in which plant scientists undertake surveillance, potentially detecting pests before symptoms are observable. This could shorten the time it takes policymakers and inspectors to implement control measures, decreasing the cost and increasing the chance of successful eradication.
There have been range studies that have used eDNA to detect plant pests. Some of the first studies used eDNA extracted from soil and water samples to perform 454-pyrosequencing to reveal the diversity of Phytophthora species [19,20,21]. In the United States of America (USA), Valentin et al. (2020) used eDNA to detect the spotted lanternfly (Lycorma delicatula), using a combination of PCR and Sanger sequencing. They found that they could detect the spotted lanternfly in eDNA before visual surveys confirmed its presence [22]. Milián-García et al. (2021) used NGS of eDNA to detect pests of regulatory concern in Canada [23]. Apangu et al. (2021) performed NGS of eDNA from air samples to profile Alternaria species [24]. Green et al. (2021) used eDNA from samples collected from plant nurseries in the United Kingdom (UK) to detect 63 Phytophthora species, several of which were regulated quarantine pests, while others were species of Phytophthora which were not known to be present in the UK [25]. In a follow up study, Green et al. (2025) again used eDNA to detect 85 Phytophthora species from UK plant nurseries [26]. Several studies have used eDNA from rainwater to investigate the ecology of trees, however to our knowledge none have focused on the identification of plant pests [27,28].
This study collected eDNA from rainwater that had passed through the canopy of oak, pine, spruce, and ash trees, and rainwater from a trap placed in an open field, from five forest sites in Northern Ireland (NI). The fungal and oomycete pests were characterised by metabarcoding of the internal transcribed spacer (ITS) region.

2. Materials and Methods

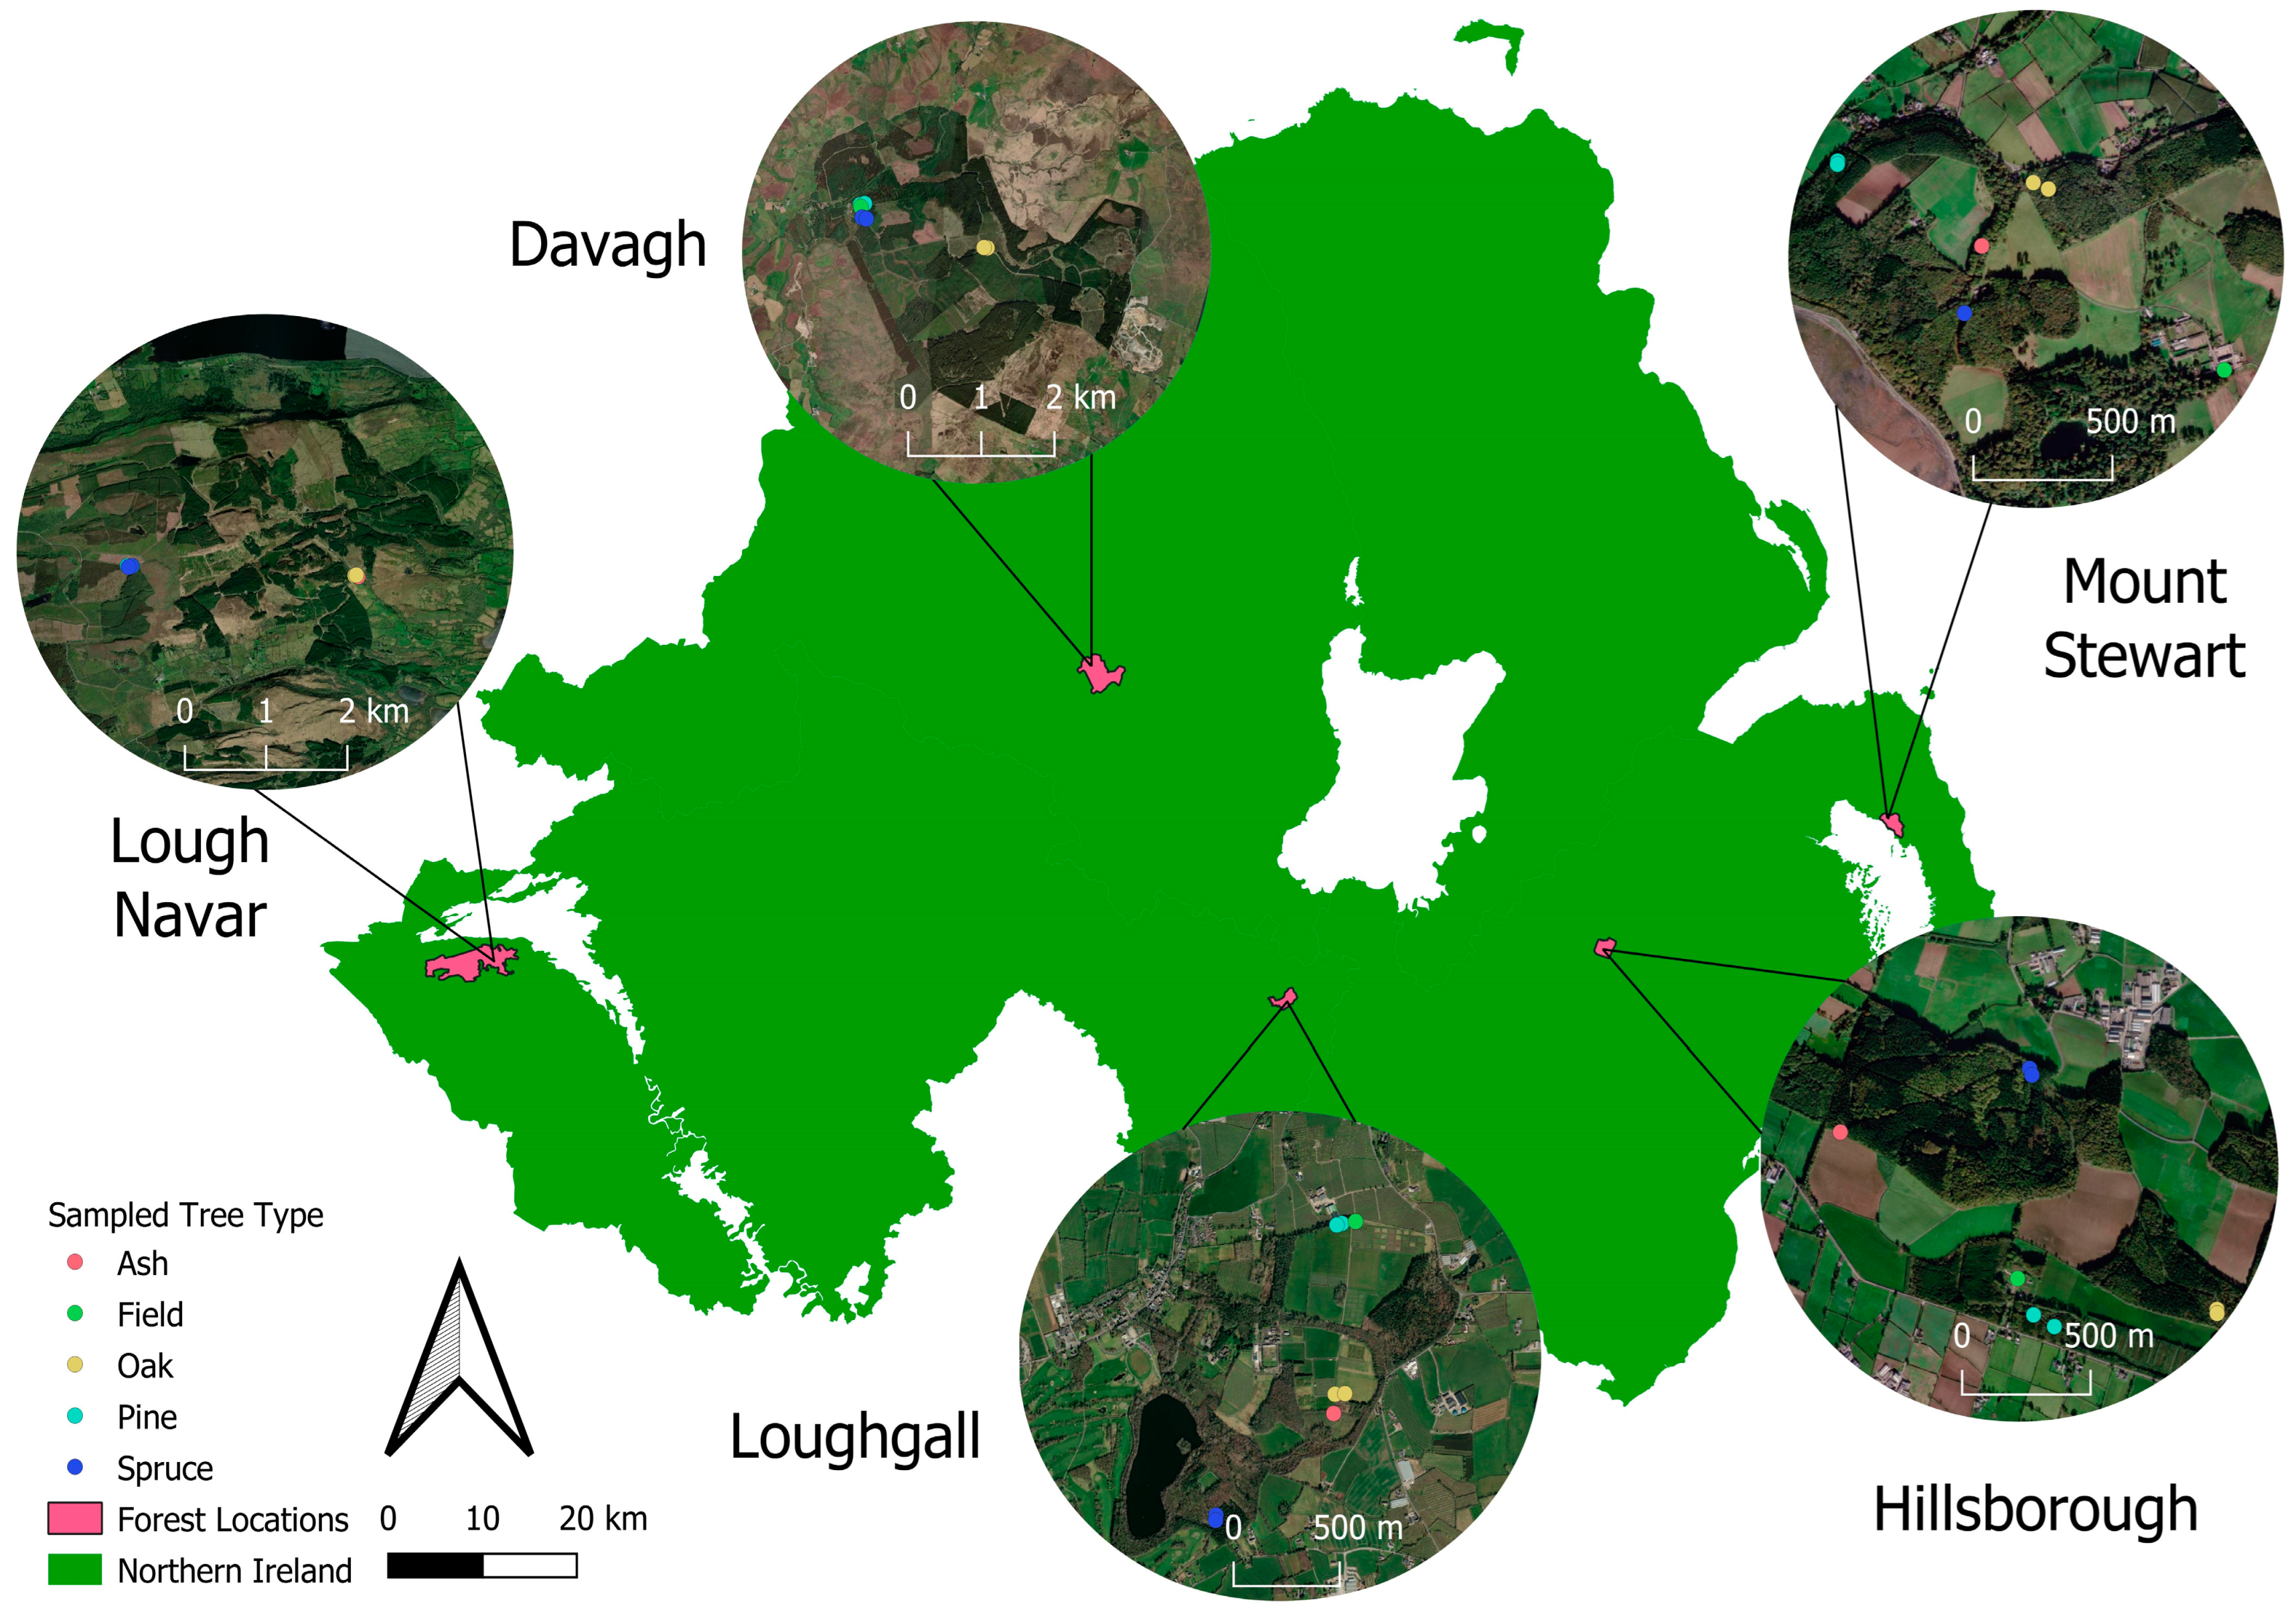
2.1. Information on Sites

Rainwater samples were collected monthly for one year (October 2022 to September 2023) from five forest sites across Northern Ireland (Figure 1). Forest sites were selected to transect east–west across Northern Ireland, the west of Northern Ireland generally experiences cooler temperatures and higher rainfall than the east. The distance between the easternmost forest site (Mount Stewart) and the westernmost site (Lough Navar) is approximately 150 km. The forest sites in this study serve a range of purposes; Lough Navar and Davagh forests are dominated by densely packed monoculture stands of spruce and pine used in the production of timber. By contrast, Mount Stewart, Loughgall, and Hillsborough are smaller forests with a broader range of tree types and recreational areas (lakes, trails, play areas).
Lough Navar forest is on the banks of Lower Lough Erne (54.447181, −7.917266); it is approx. 2628 ha and surrounded by heathland and farmland. Most of the trees are Sitka spruce, although there are several large stands of Lodgepole pine; the average tree age is 28 years. The average annual rainfall at Lough Navar forest over the last 50 years was 1619 mm ± 201 mm; the average annual temperature at Lough Navar forest over the last 50 years was 8.1 °C ± 0.49 °C.
Davagh forest (54.712348, −6.895292) is approx. 1517 ha; it is surround by heathland and farmland. It is dominated by Sitka spruce and Lodgepole pine with an average tree age of 26 years. The average annual rainfall at Davagh forest over the last 50 years was 1443 mm ± 158 mm; the average annual temperature at Davagh forest over the last 50 years was 8.2 °C ± 0.56 °C.
Loughgall forest is by a lake within the village of Loughgall (54.403430, −6.594741); it is approx. 83 ha in size. The spruce trees present are mostly Norway spruce (there is no Sitka on the site), and the pine trees are mostly Scots pine (there is no Lodgepole on the site). There are a wide range of broadleaf trees such beech, ash, sycamore, Horse chestnut, and oak, etc. The average tree age at Loughgall forest is 58 years. The Agri-food and Bioscience Institute (AFBI) has a research facility at the Loughgall site, which breeds plants (mostly grass); willow is grown for biomass; there is an apple orchard and pasture for grazing animals. The site also has a golf course. The average annual rainfall at Loughgall forest over the last 50 years was 810 mm ± 97 mm; the average annual temperature at Loughgall forest over the last 50 years was 9.6 °C ± 0.56 °C.
Hillsborough forest is by a lake in the village of Royal Hillsborough (54.448940, −6.079255); it is approx. 193 ha in size. Large parts of Hillsborough forest have compartments of densely packed spruce (evenly split between Sitka and Norway spruce) and Japanese larch trees used in timber production. Other parts of Hillsborough forest are more recreational, with stands of mixed broadleaf (oak, beech, sycamore) and stands of mixed conifers (Douglas fir, Western hemlock, Scots pine). The average tree age at Hillsborough forest is 47 years. AFBI have a large research farm within Hillsborough forest with cattle and pigs. There are a range plants grown for biomass such as willow and miscanthus. The average annual rainfall at Hillsborough forest over the last 50 years was 911 mm ± 105 mm; the average annual temperature at Hillsborough forest over the last 50 years was 9.1 °C ± 0.56 °C.
Mount Stewart is a National Trust site on the shoreline of Strangford Lough (54.557211, −5.606810); it is approx. 97 ha in size. There are a wide range of tree types (Sitka and Norway spruce, various species of larch, oak, beech, Corsican and Lodgepole pine, Horse chestnut, etc.) and an ornamental garden; the average tree age is 56 years. The average annual rainfall at Mount Stewart over the last 50 years was 819 mm ± 96 mm; the average annual temperature at Mount Stewart over the last 50 years was 9.8 °C ± 0.56 °C [29].

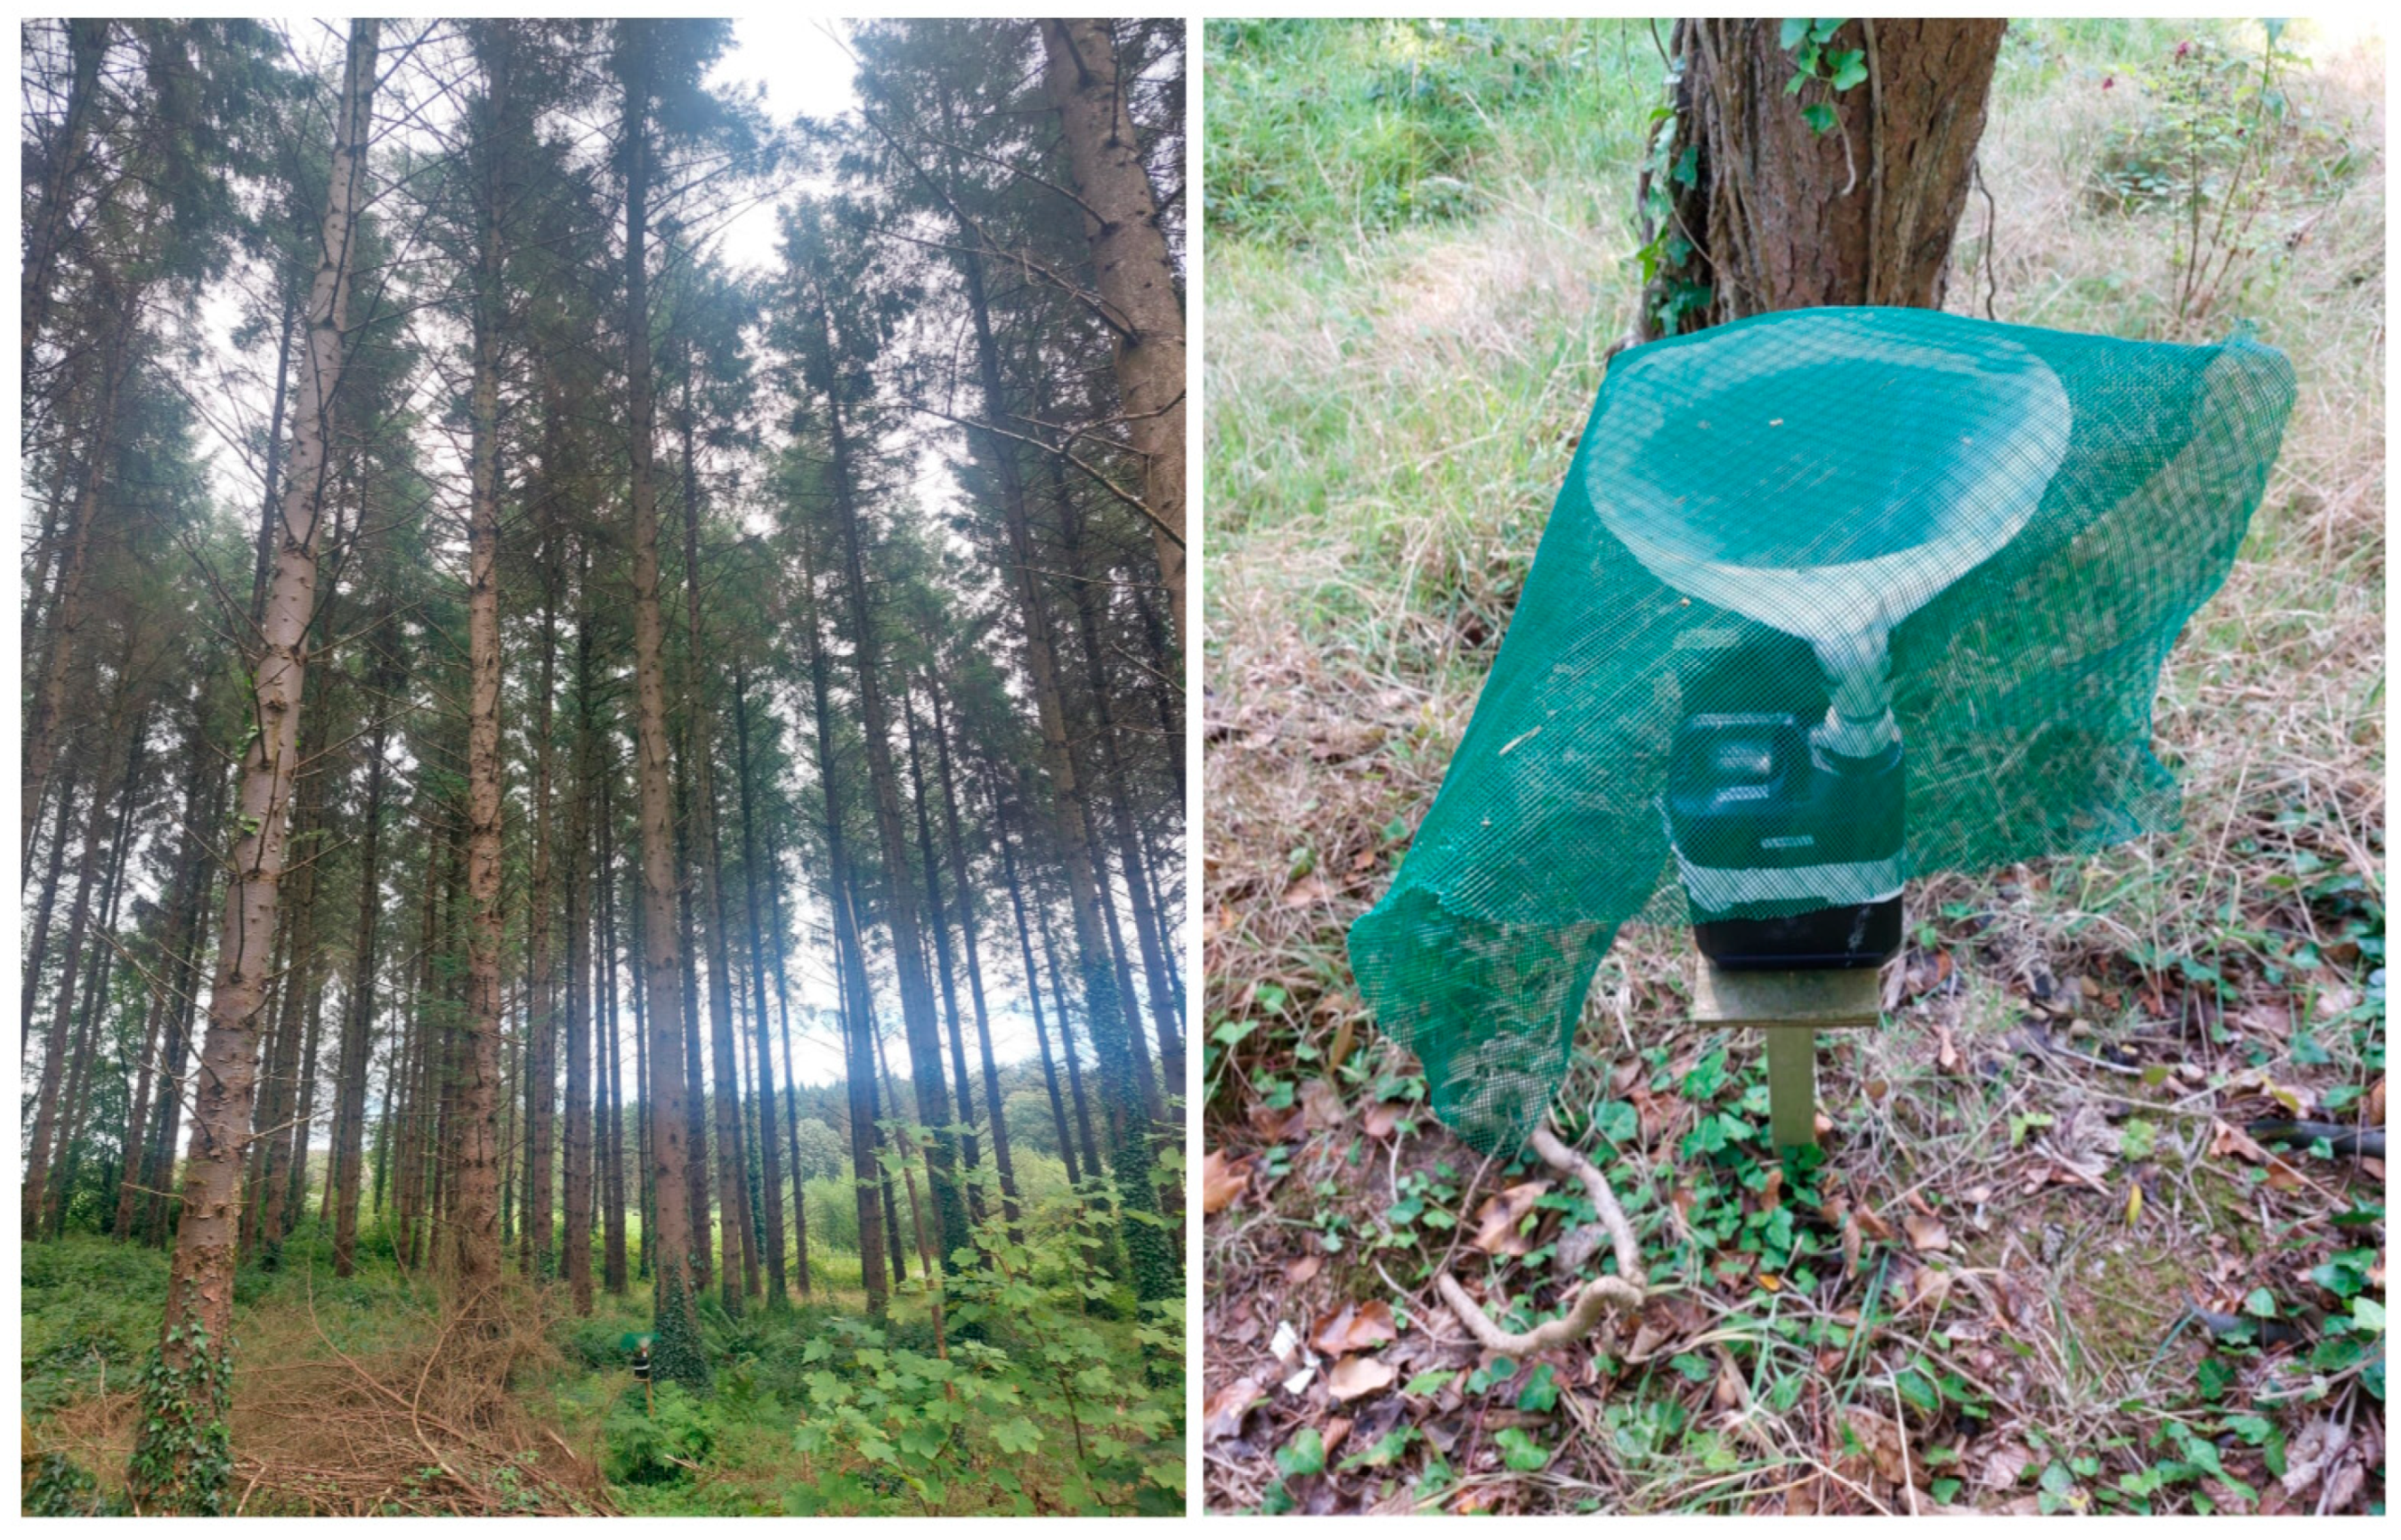
2.2. Rainwater Trap Placement

Selection of which trees to put the rainwater traps under was based on several factors. The sites had to be easily accessible but far enough away from public areas to reduce the risk that traps would be tampered with. The aim was to evenly space the traps around the forest, although in practice this was often not possible because particular stands of trees tended to be grouped in one particular area. Two rainwater samples from underneath oak (Quercus spp.), two samples from underneath spruce (Picea spp.), two samples from underneath pine (Pinus spp.), one sample from underneath ash, and one sample from a non-tree field trap were collected at each site every month. All spruce trees in this study were Sitka spruce, except at Loughgall which was Norway spruce. All pine trees were Lodgepole pine, except at Loughgall, which was Scots pine. We were able to find English oak at every site; however, we were unable to find a suitable ash tree in Davagh, as a result no ash sample was collected from Davagh over the study period. The trap under ash trees was a ‘positive control’, as nearly all ash trees in Northern Ireland have ash dieback; however, as the results will show, the fungus which causes ash dieback was not detected in this study.

2.3. Rainwater Collection and Filtration

Rainwater traps, consisting of a 2.5 L black plastic container with a funnel (22 cm diameter) attached, were placed under the tree canopy on a wooden support structure that was 1 m from the ground and between 1 and 3 m from the trunk, depending on canopy spread (Figure 2). Funnels had mesh (2 mm pore size) placed over them to prevent debris clogging the funnel. The non-tree field trap was placed in an open area/field in the forest at least 15 m away from hedges and trees. The only exception to this was the Mount Stewart non-tree field trap, which was placed in a protected garden area less than 15 m from vegetation cover. The 2.5 L containers were collected at the end of each calendar month and replaced with sterilised containers. The mesh was cleared of any debris and placed back on the funnel. Collected water samples were returned to the laboratory on the same day and stored at 4 °C until filtration.
Filtration of rainwater was carried out within 48 h of sample collection. Rainwater from each replicate was filtered using Nalgene® vacuum filters (Merck Life Science UK Limited, Dorset, UK) (150 mL capacity, 0.2 µm pore size, polyethersulfone (PES) membrane). A maximum of 450 mls of rainwater was passed through the filter. The filter membrane was then removed from the unit and stored on a Petri dish at −20 °C until DNA extraction [18]. The 2.5 L containers were sterilised with 1% sodium hypochlorite solution, triple rinsed, and stored until needed [30]. During the year-long study, 28 of the 480 planned samples could not be collected either because a trap could not be placed, the trap was toppled after placement, or the collection bottle did not have sufficient rainwater.

2.4. DNA Extraction and Next-Generation Sequencing

Extractions were carried out using the Qiagen DNeasy PowerWater Kit (Qiagen, Germantown, MD, USA), which is designed to isolate DNA from filtered water samples. The standard protocol included in this kit was followed, except for the following deviation: DNA was eluted into 50 µL of elution buffer and passed through the spin column twice rather than 100 µL of elution buffer passed through the spin column once. Elutions were stored at −20 °C before sending for Next-Generation Sequencing (NGS).
Sequencing was carried out by Source BioScience (Nottingham, UK) using a MiSeq platform (Illumina, San Diego, CA, USA) to a minimum depth of 100,000 reads. Briefly, the internal transcribed spacer 1 (ITS 1) region [31] was amplified by Polymerase Chain Reaction (PCR) using KAPA HiFi Hot Start Ready Mix (Roche) using ITS1 primers ITS1-F (CTTGGTCATTTAGAGGAAGTAA) as the forward primer and ITS1-R (GCTGCGTTCTTCATCGATGC) as the reverse primer [31]. PCR conditions were as follows: 95 °C for 3 min, followed by 25 cycles of 95 °C for 30 s, 55 °C for 30 s, 72 °C for 30 s, and then 72 °C for 5 min with a hold step at 4 °C. Following the first amplification, all PCR products were purified using AMPure XP beads (Beckman Coulter, Brea, CA, USA). Subsequently, a second round of PCR amplification was performed to incorporate DNA/RNA UD Indexes (Illumina). PCR conditions were as follows: 95 °C for 3 min, followed by 8 cycles of 95 °C for 30 s, 55 °C for 30 s, 72 °C for 30 s, and then 72 °C for 5 min, with a hold step at 4 °C.
The resulting PCR products underwent a second purification step with AMPure XP beads (Beckman Coulter, Brea, CA, USA). Following library creation, quality-checking procedures were implemented to assess library size and concentration. The indexed amplicons were quantified via a fluorometric method involving a Promega QuantiFluor dsDNA assay, and DNA integrity was checked using electrophoretic separation on the Qiagen QIAxcel connect. The libraries were then normalised and sequenced on a MiSeq (Illumina) using the paired-end 2 × 300 bp mode according to manufacturer’s instructions.

2.5. Bioinformatics

A total of 452 samples were used in the bioinformatic analysis. Analysis was conducted on Ubuntu 24.04.1 LTS, running on a high-performance machine equipped with an Intel(R) Xeon(R) W5-2465X processor, 32 CPU threads, and 250 GB of RAM. To ensure the integrity of the sequencing data, initial quality control was performed using FastQC v0.12.1. A custom bash script was employed to loop through all raw sequencing files and generate FastQC reports. The quality of the raw reads was assessed for common sequencing issues such as adapter contamination, GC content, and per-base quality scores.
Following the initial quality check, reads were trimmed using Trimmomatic (version 0.39) [32]. These parameters were carefully chosen to address potential issues such as adapter contamination, low-quality bases, and poor read lengths. A bash script automated the trimming process for paired-end reads. The following rules were applied:
The ILLUMINACLIP option removed adapter sequences, using the Nextera adapter file with specified mismatch and clip thresholds. The HEADCROP option removed the first five bases of each read to eliminate low-quality or primer bases. The LEADING and TRAILING options trimmed bases with a Phred quality score of 20 or lower from the start and end of the reads. The SLIDINGWINDOW approach trimmed reads based on a window of four bases, removing any window with an average quality score below 20. Lastly, the -trimlog option generated a log file documenting the trimming process for review and quality control. Post-trimming, FastQC was used again to verify the quality of the trimmed reads, and MultiQC was employed to combine individual FastQC reports into a single comprehensive overview of the data quality [33].
The sequencing data were processed using a locally run pipeline based on a combination of bash scripts and a Python (version 3.0) script derived from the EDGE bioinformatics framework [34]. The pipeline was designed to process the data through QIIME 2 (version 2023.5), specifically tailored to run from the command line without a graphical user interface (GUI). The Python script was designed to integrate ANCOM-BC [35] for differential abundance testing. A bash script was used to call the Python script, through the activation of the appropriate environment, processing of the raw data, and the production of outputs.
The pipeline utilised DADA2 for denoising, generating feature tables, and representative sequences [36]. A rarefaction depth of 21,000 reads per sample was applied to normalise the data, chosen based on rarefaction curve analysis [37]. This ensured consistent sequencing depth across samples and comparability of microbial diversity metrics and pest presence. After rarefaction a total of 414 samples remained.
A classifier was trained using reference sequences and taxonomy data from the UNITE database (UNITE dynamic ‘all eukaryotes’ version 10, accessed on 4 April 2024, https://doi.org/10.15156/BIO/2959338) [38]. The taxonomy data, imported in a headerless TSV format, enabled accurate taxonomic assignments during classifier training using the “qiime feature-classifier classify-sklearn” method [39]. The trained classifier was evaluated for accuracy using “qiime quality-control evaluate-taxonomy” [39], which compared predicted taxonomic assignments with expected ones from the reference database and produced a report visualising classification accuracy up to the 8th taxonomic level. The evaluation metrics included precision, recall, and F-measure across taxonomic levels (Supplementary S1).
The trained classifier was employed for taxonomic prediction of the eDNA sequences, using the UNITE ITS fungal database for classification. Taxonomic assignments were made with QIIME 2’s feature classifier [39], associating sequences with their closest matches in the database. The resulting taxonomy table facilitated the screening and distribution analysis of fungal pathogens across samples.
All figures presented in this paper are based on the 21,000 rarefied dataset (Supplementary S2). However, to check whether rarefaction omitted plant pests, the analysis was run again without rarefaction.

2.6. Detection and Diversity Metrics and Visualisation

Normalised read counts (at a sequencing depth of 21,000 reads/sample, adjusted from alpha rarefaction curves) for all Amplicon Sequence Varients (ASVs) were converted to presence and absence data represented by 1 and 0, respectively. A total of 179 ASVs corresponding to 65 plant pests were used to generate detection and diversity data. Detection was the occurrence of any of the 179 plant pest ASVs. Diversity (species richness) was the number of unique fungal and oomycete pests (i.e., the redundancy of the 179 plant pests ASVs was removed). These counts were then totalled across sites, tree-traps, months and seasons and plotted in excel. Heatmaps for sites and tree-trap were created using Morpheus [40]. A hierarchical clustering was applied based on Euclidean distance, with a complete linkage method, applied to rows (pests) and columns (sites/tree-trap). The final output was polished using Adobe Illustrator (CC 2014).

2.7. Generalised Linear Mixed Model (GLMM)

To assess the effect of site, tree-trap, month, and season on plant pest detection and diversity a GLMM was used. To account for the repeated measures within the data a random blocking effect of month x tree-trap x replicate was used. The fixed effects were site, tree-trap, month, and season. Month and season were analysed in separate models. A Poisson distribution was selected because the data met all the assumptions for this distribution and was neither underdispersed or overdispersed. Models were run with a Poisson distribution with a log-link function. Fisher’s unprotected least significant difference post hoc test was performed in the log-scale. The GLMMs were carried out in Genstat.

2.8. Analysis of Compositon of Microbiomes with Bias Correction (ANCOM-BC)

Differential abundance was assessed using the plugin ‘composition’ and command ‘ANCOM-BC’ [35]. Davagh forest was used as a reference when comparing between sites, and spruce was used as a reference when comparing between tree-traps. All parameters were used with their default settings, except for ‘--p-prv-cut’ which sets the numerical fraction to a number between 0 and 1. This value was set to 0.01 before running the ANCOM-BC. Any taxa with a prevalence less than this value was excluded from the analysis. A post-ANCOM-BC test, differential abundance barplot (da-barplot) was then run using QIIME2. This used the same plugin as before (composition) alongside the command ‘da-barplot’. All parameters were set to default, except for ‘--p-significance threshold’ which was set to 0.05. The log-fold change data were then taken from any organisms deemed statistically significant and used to graphically represent the data.

2.9. Data Submission and Availability

Sequencing and metadata files were submitted to the National Center for Biotechnology Information (NCBI) (PRJNA1222366).

3. Results

This study generated 9124 ASVs using a trained classifier built on the latest UNITE database. The classifier demonstrated consistently high accuracy across all taxonomic levels. At the strain level, the evaluation yielded exceptionally high confidence, with a precision of 1.0 and a recall of 0.9969 (Supplementary S1). While the accuracy (F-measure) showed a slight decrease at the species and strain levels (0.9996 and 0.9984, respectively), reflecting the inherent challenges of species resolution in the ITS region, it still remained well above 0.99. The evaluation results confirm the robustness of the classifier in assigning taxonomy to fungal sequences, supporting reliable downstream analyses of fungal diversity and potential pathogens.
A total of 4206 ASVs (46%) could be identified to a fungal species; 4685 ASVs (51%) could be identified to fungal genus or lower; 5006 ASVs (55%) could be identified to family or lower. A total of 89 ASVs (<1%) were identified to the Stramenopila kingdom, of which 85 ASVs (<1%) could be identified to species and 88 ASVs could be identified to genus or lower. A total of 312 ASVs (4%) were ‘unassigned’’.
ASVs that resolved to species level were compared to known fungal and oomycete plant pests identified by the governments of Australia, Canada, the European Union, the United States of America, the United Kingdom, and the European and North American Plant Protection Organisations (EPPO and NAPPO, respectively). After this filtering process there were 179 ASVs which corresponded to 65 plant pests (63 fungal and two oomycete pests) (Figure 3 and Figure 4). Nine of these pests were present on the UK plant health risk register (Table 1). The 179 ASVs were taken forward for statistical analysis.
To check whether rarefaction using 21,000 reads significantly affected the amount of plant pests detected, the sequencing data were screened without rarefaction. One additional pathogen, Podosphaera leucotricha, a powdery mildew of apple trees, was detected at Loughgall in May 2023. Loughgall has an apple orchard on site and the forest is surrounded by a large number of apple orchards. This pathogen is not included in any of the figures that follow.

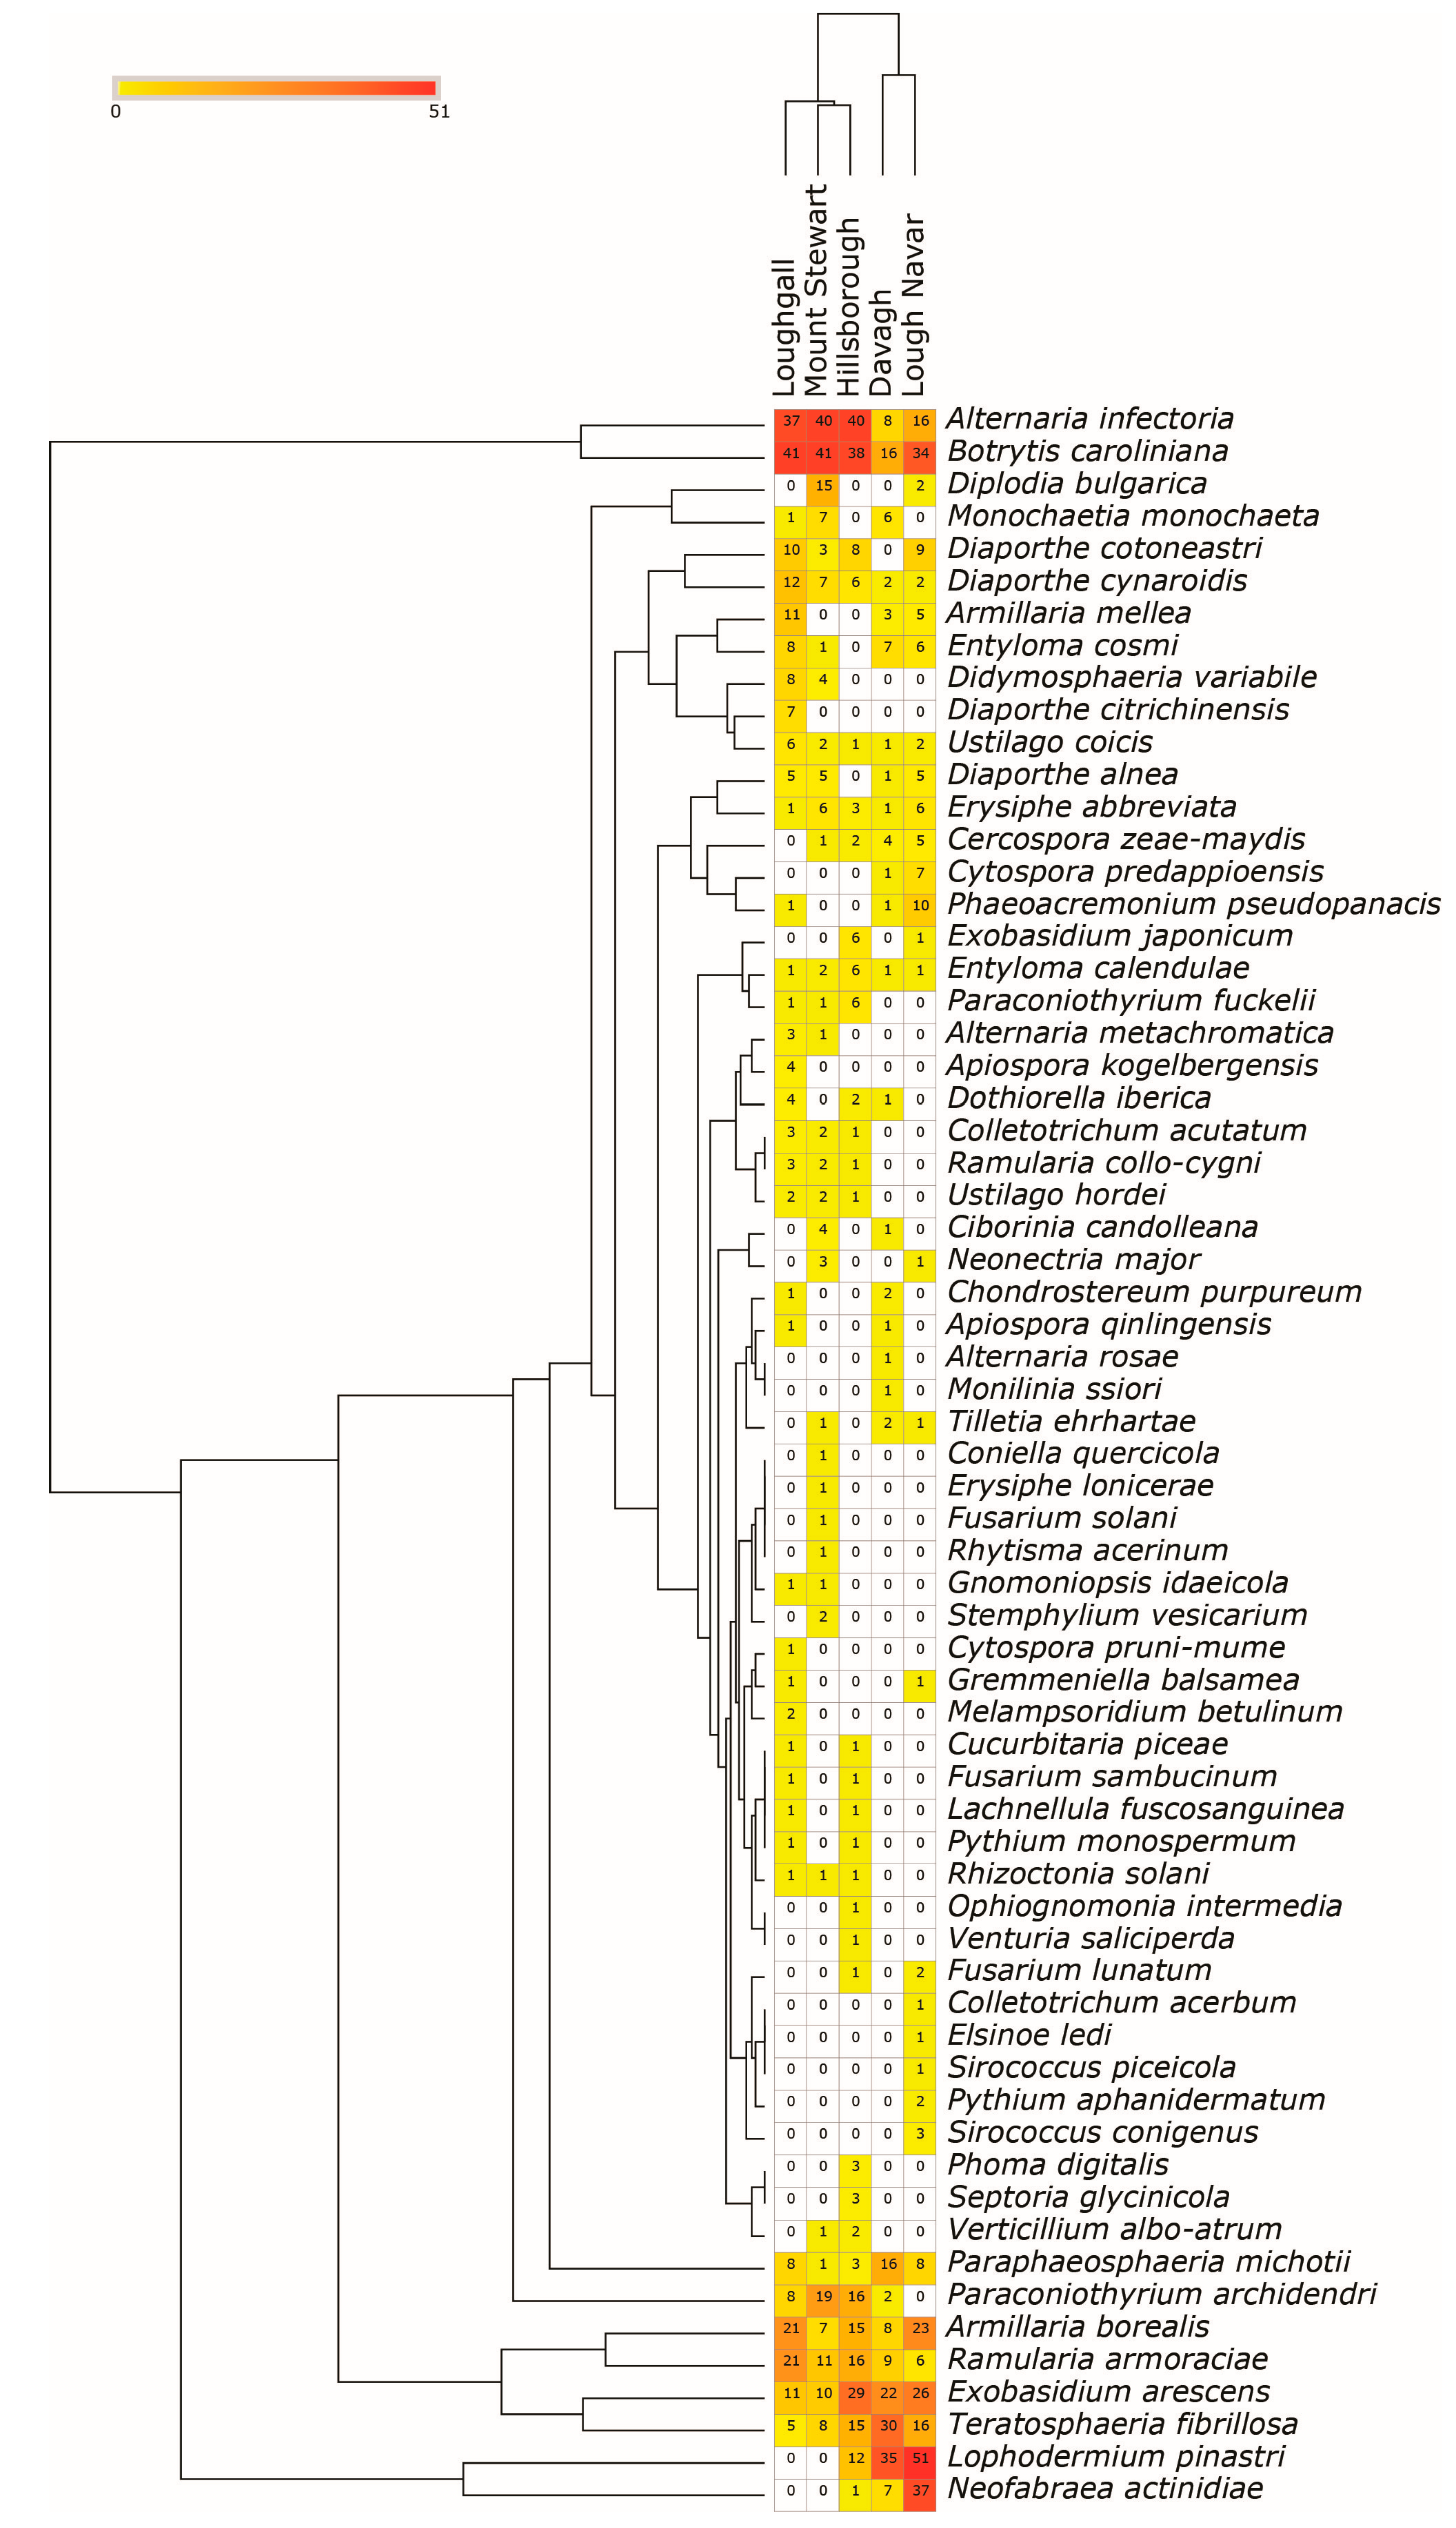
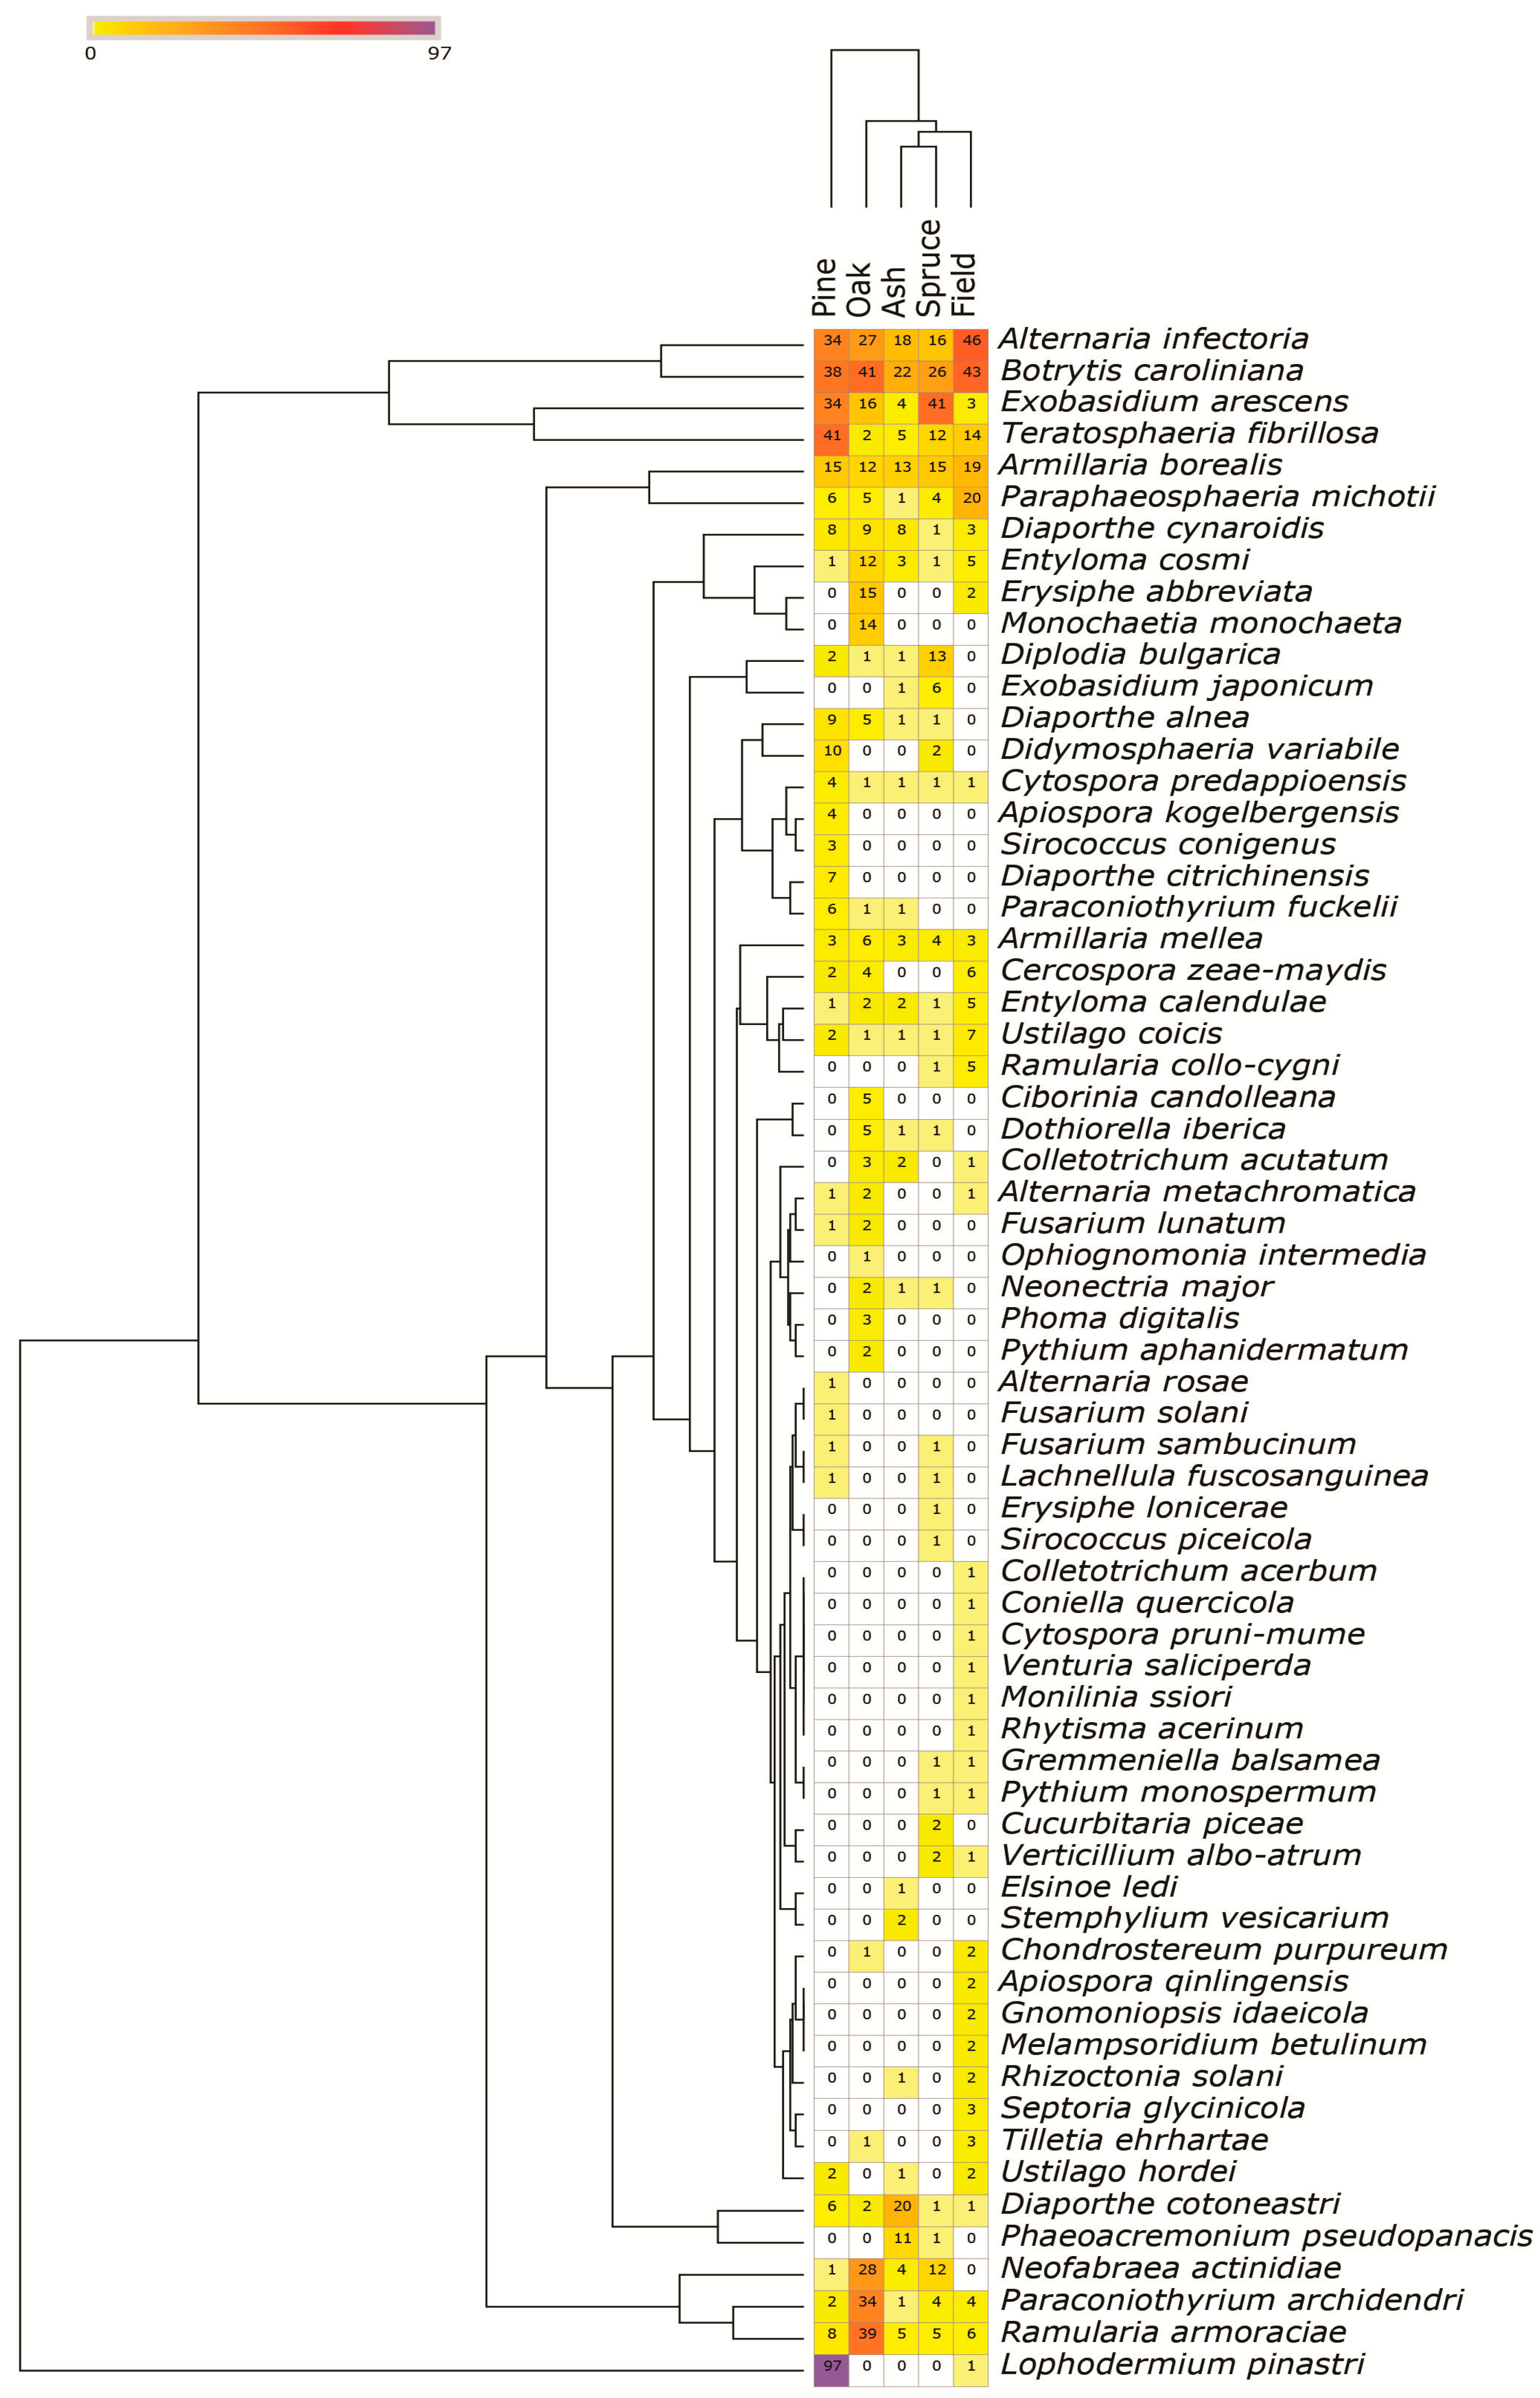
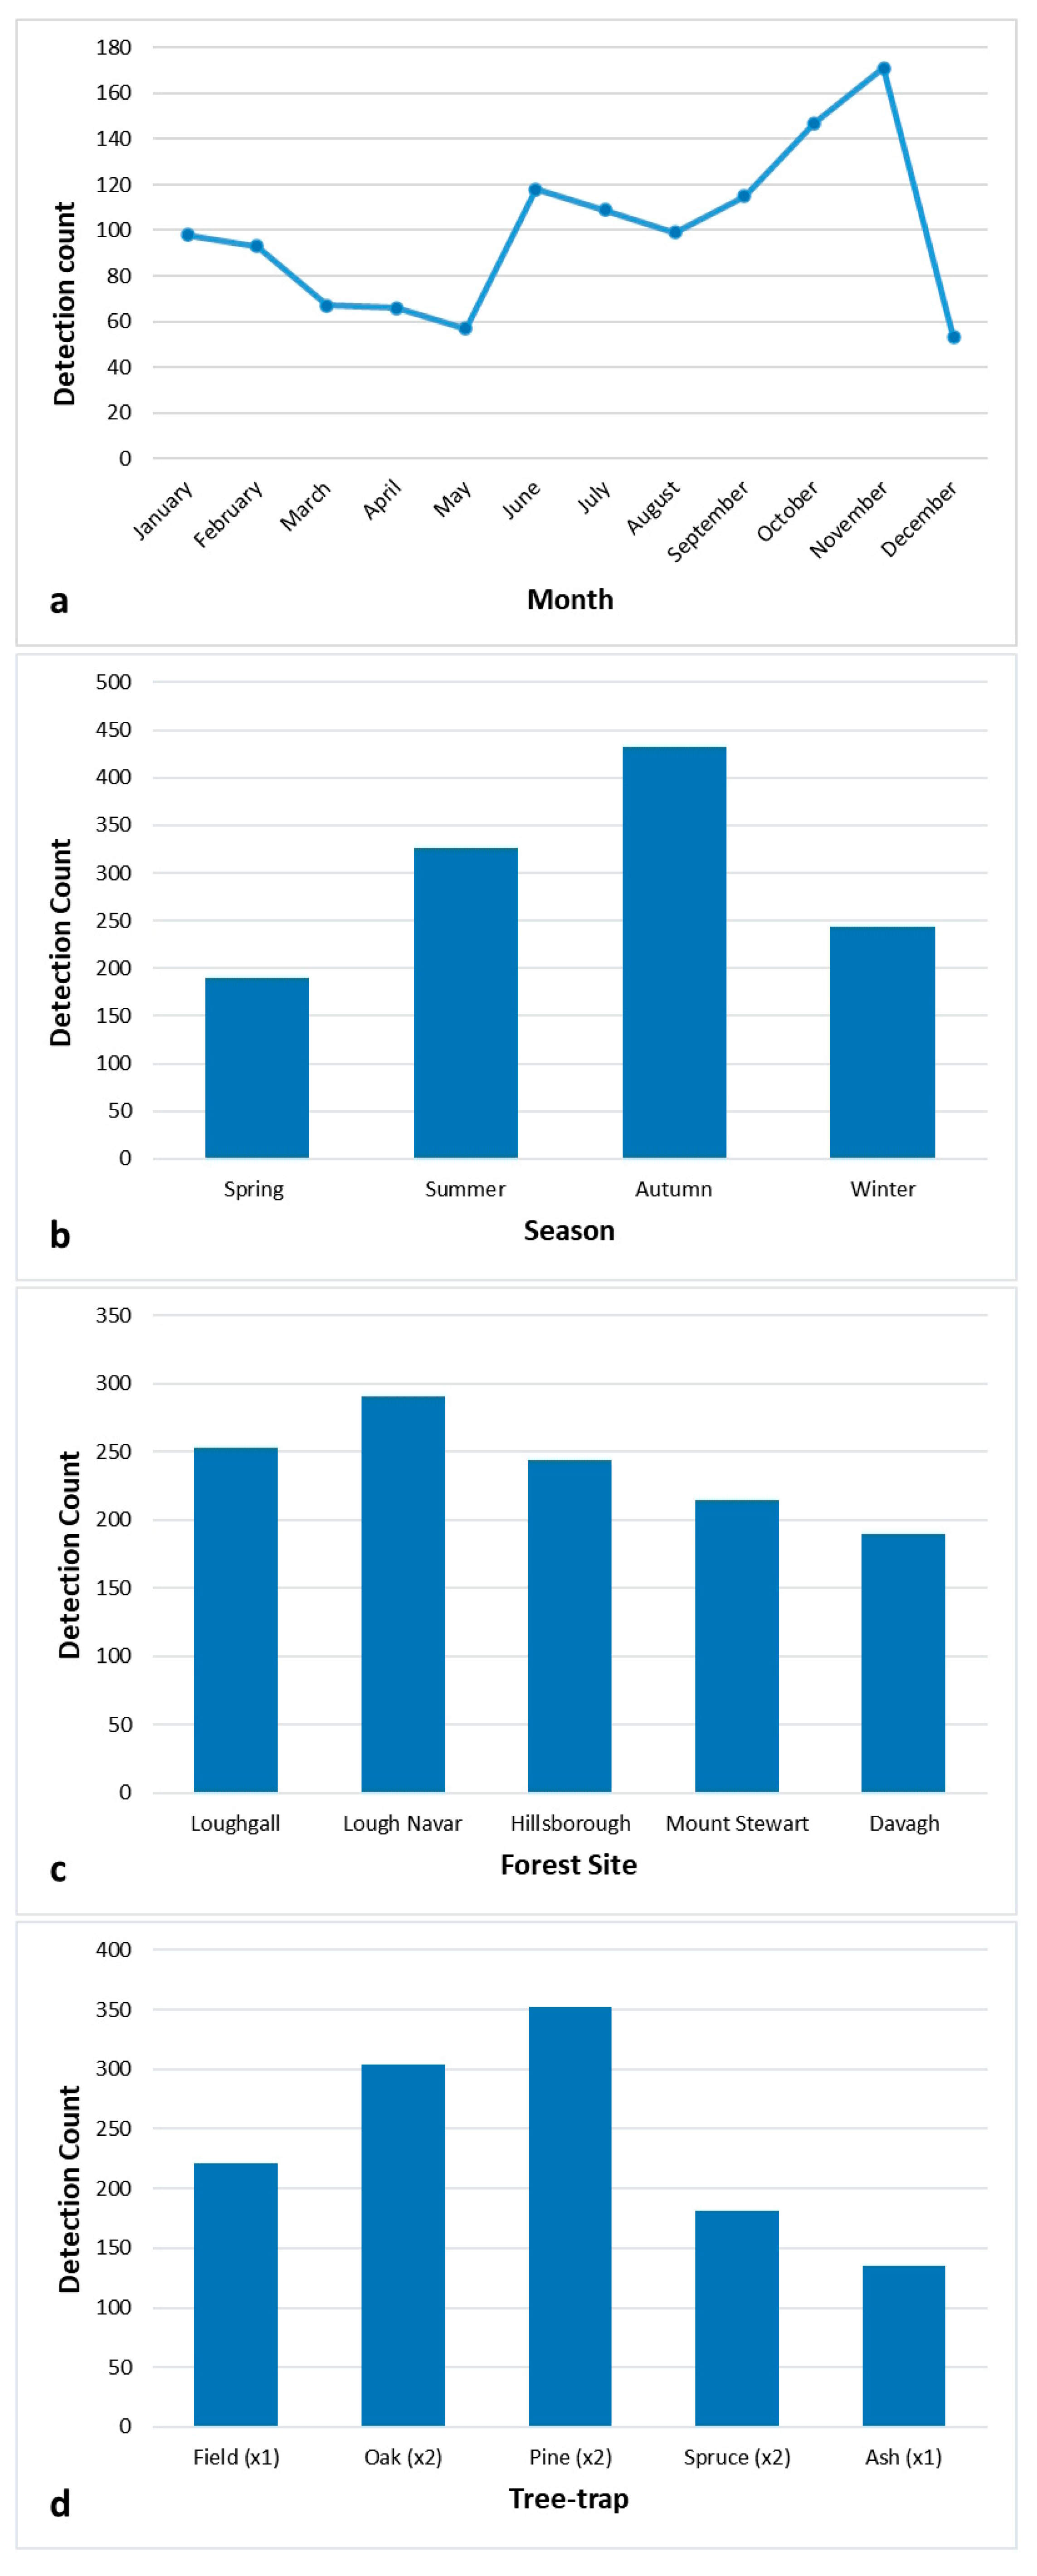
3.1. Trends in the Detection of Fungal and Oomycete Pests

Figure 5 shows the total number of fungal and oomycete pest detections across months, seasons, tree-traps and sites. The month with the greatest number of pest detections was November (171 detections) with the lowest in May (57 detections). Autumn had the highest number of detections of pests (433 detections) while spring the lowest number of detections (190 detections). Most pest detections occurred in traps placed under the canopy of pine trees (353 detections); however, there were twice as many rainwater traps placed under spruce, pine. and oak traps versus the non-tree field trap and the ash tree-trap. When the number of replicates is controlled for, the non-tree field trap had the highest average number of detections (averaging 3.78 detections per trap per month) (Supplementary S3). The site with the largest number of pest detections was Lough Navar (291 detections), whilst the site with the lowest detections was Davagh (190 detections).

3.2. Statisitcal Analysis of Fungal and Oomycete Pest Detection

The month had a highly significant effect on pest detection (Wald statistic: 96.34, df: 11, p value: <0.001), with most detections observed in November. Tree-trap also had a highly significant effect on pest detection (Wald statistic: 30.63 df: 4, p value < 0.001), as did season (Wald statistic: 81.67, df: 3, p value: <0.001), with the non-tree field trap and Autumn having the highest number of detections. Pest detection did not significantly differ across sites (Wald statistic: 4.15, df: 4, p value: 0.386). The predicated means, the upper and lower 95% confidence intervals generated by the GLMMs for all fixed factors for detection, along with the results of the post hoc analysis, are shown in Supplementary S3.

3.3. Trends in the Diversity of Fungal and Oomycetes Pests

Figure 6 shows the total number of unique fungal and oomycete pest found across months, seasons, tree-traps and sites. Pest diversity was highest in July and September (33 findings each), while the month with the lowest diversity of pest was May (18 findings). Summer and Autumn also had the joint highest number of unique pests (42 findings), with the lowest number of unique pests in Spring (29 findings). The tree-trap with the highest number of unique pests was the non-tree field trap (38 findings), this was despite there being roughly half the number of non-tree field traps as spruce, pine and oak tree-traps. The site with the highest number of unique pests was Loughgall followed by Mount Stewart (38 and 35 findings, respectively). Davagh forest had the lowest diversity of pests followed by Lough Navar forest (28 and 31 findings, respectively).

3.4. Statistical Analysis Diversity of Fungal and Oomycete Pest Diversity

Diversity significantly differed across tree-traps (Wald statistic: 21.87, df: 4, p value: <0.001), with most diversity seen in the non-tree field rainwater trap. Diversity was also significantly affected by month (Wald statistic: 62.97, df: 11, p value: <0.001) and season (Wald statistic: 54.79, df: 3, p value: <0.001), with July and Autmn showing the highest diversity of fungal and oomycete pests. Fungal and oomycete diversity did not significantly differ across sites (Wald statistic: 3.24, df: 4, p value: 0.518). The predicated means and upper and lower 95% confidence intervals generated by the GLMMs for all fixed factors for diversity, along with the results of the post hoc analysis, are shown in Supplementary S3.

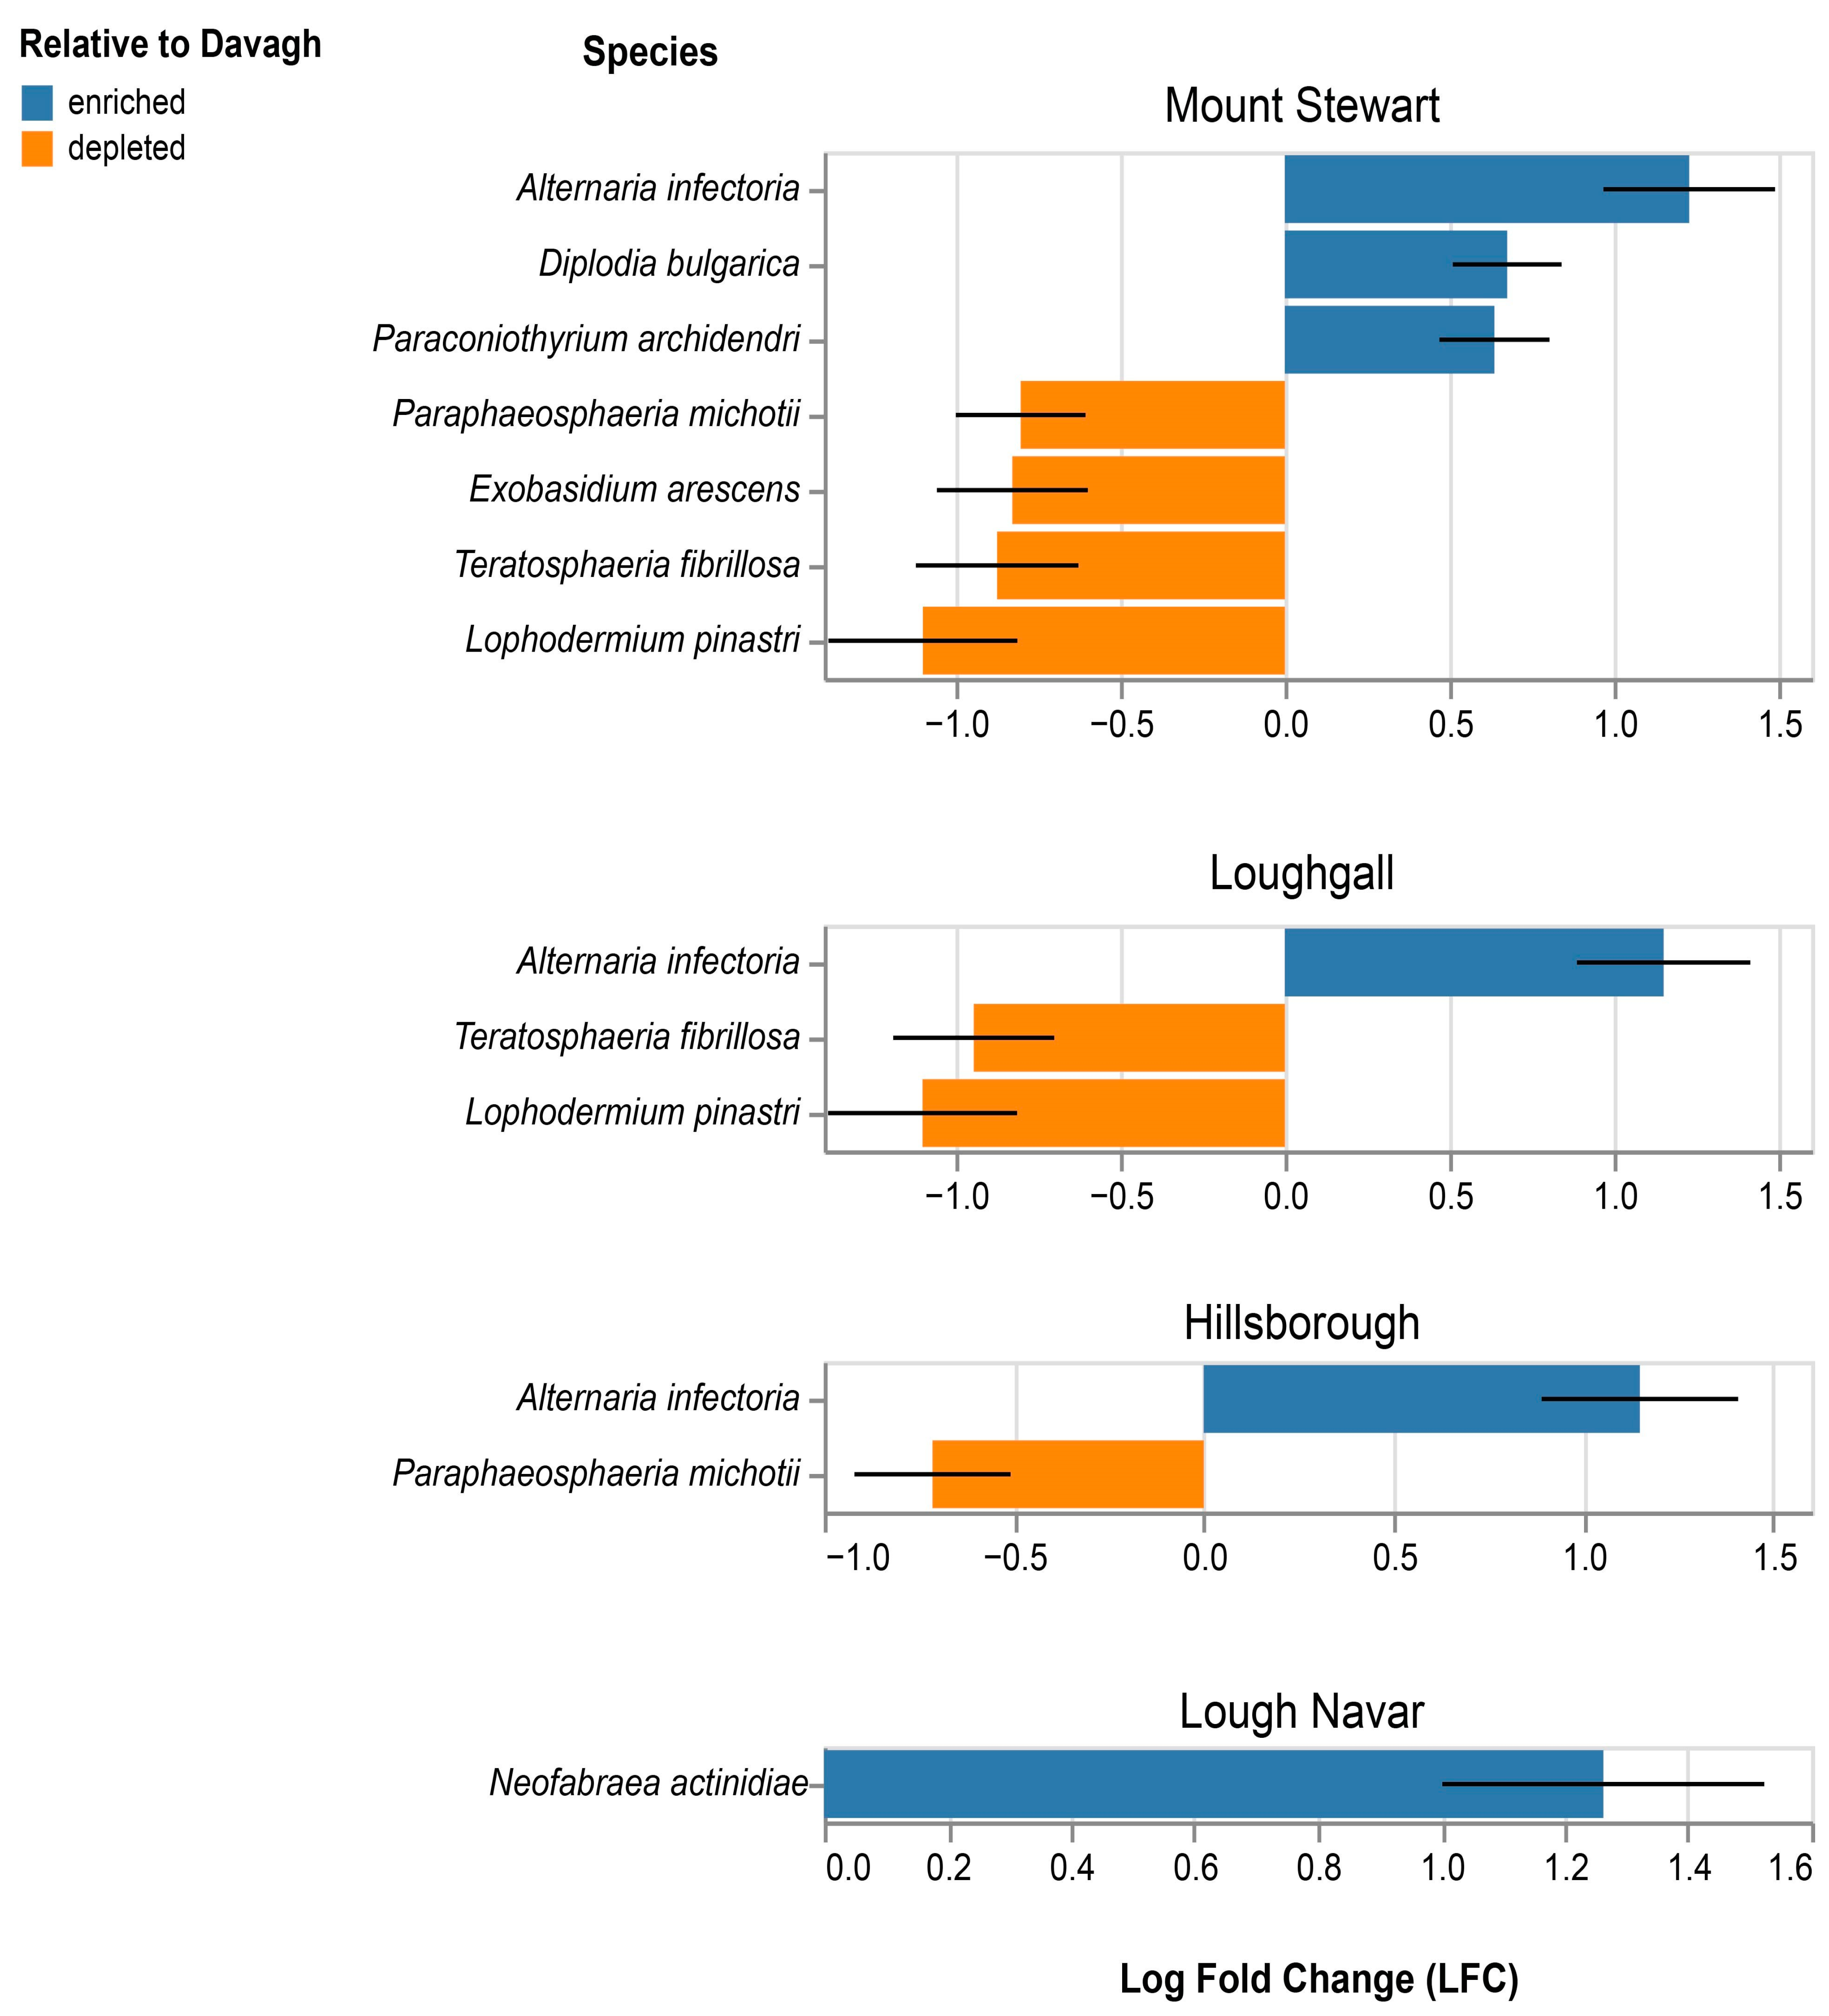
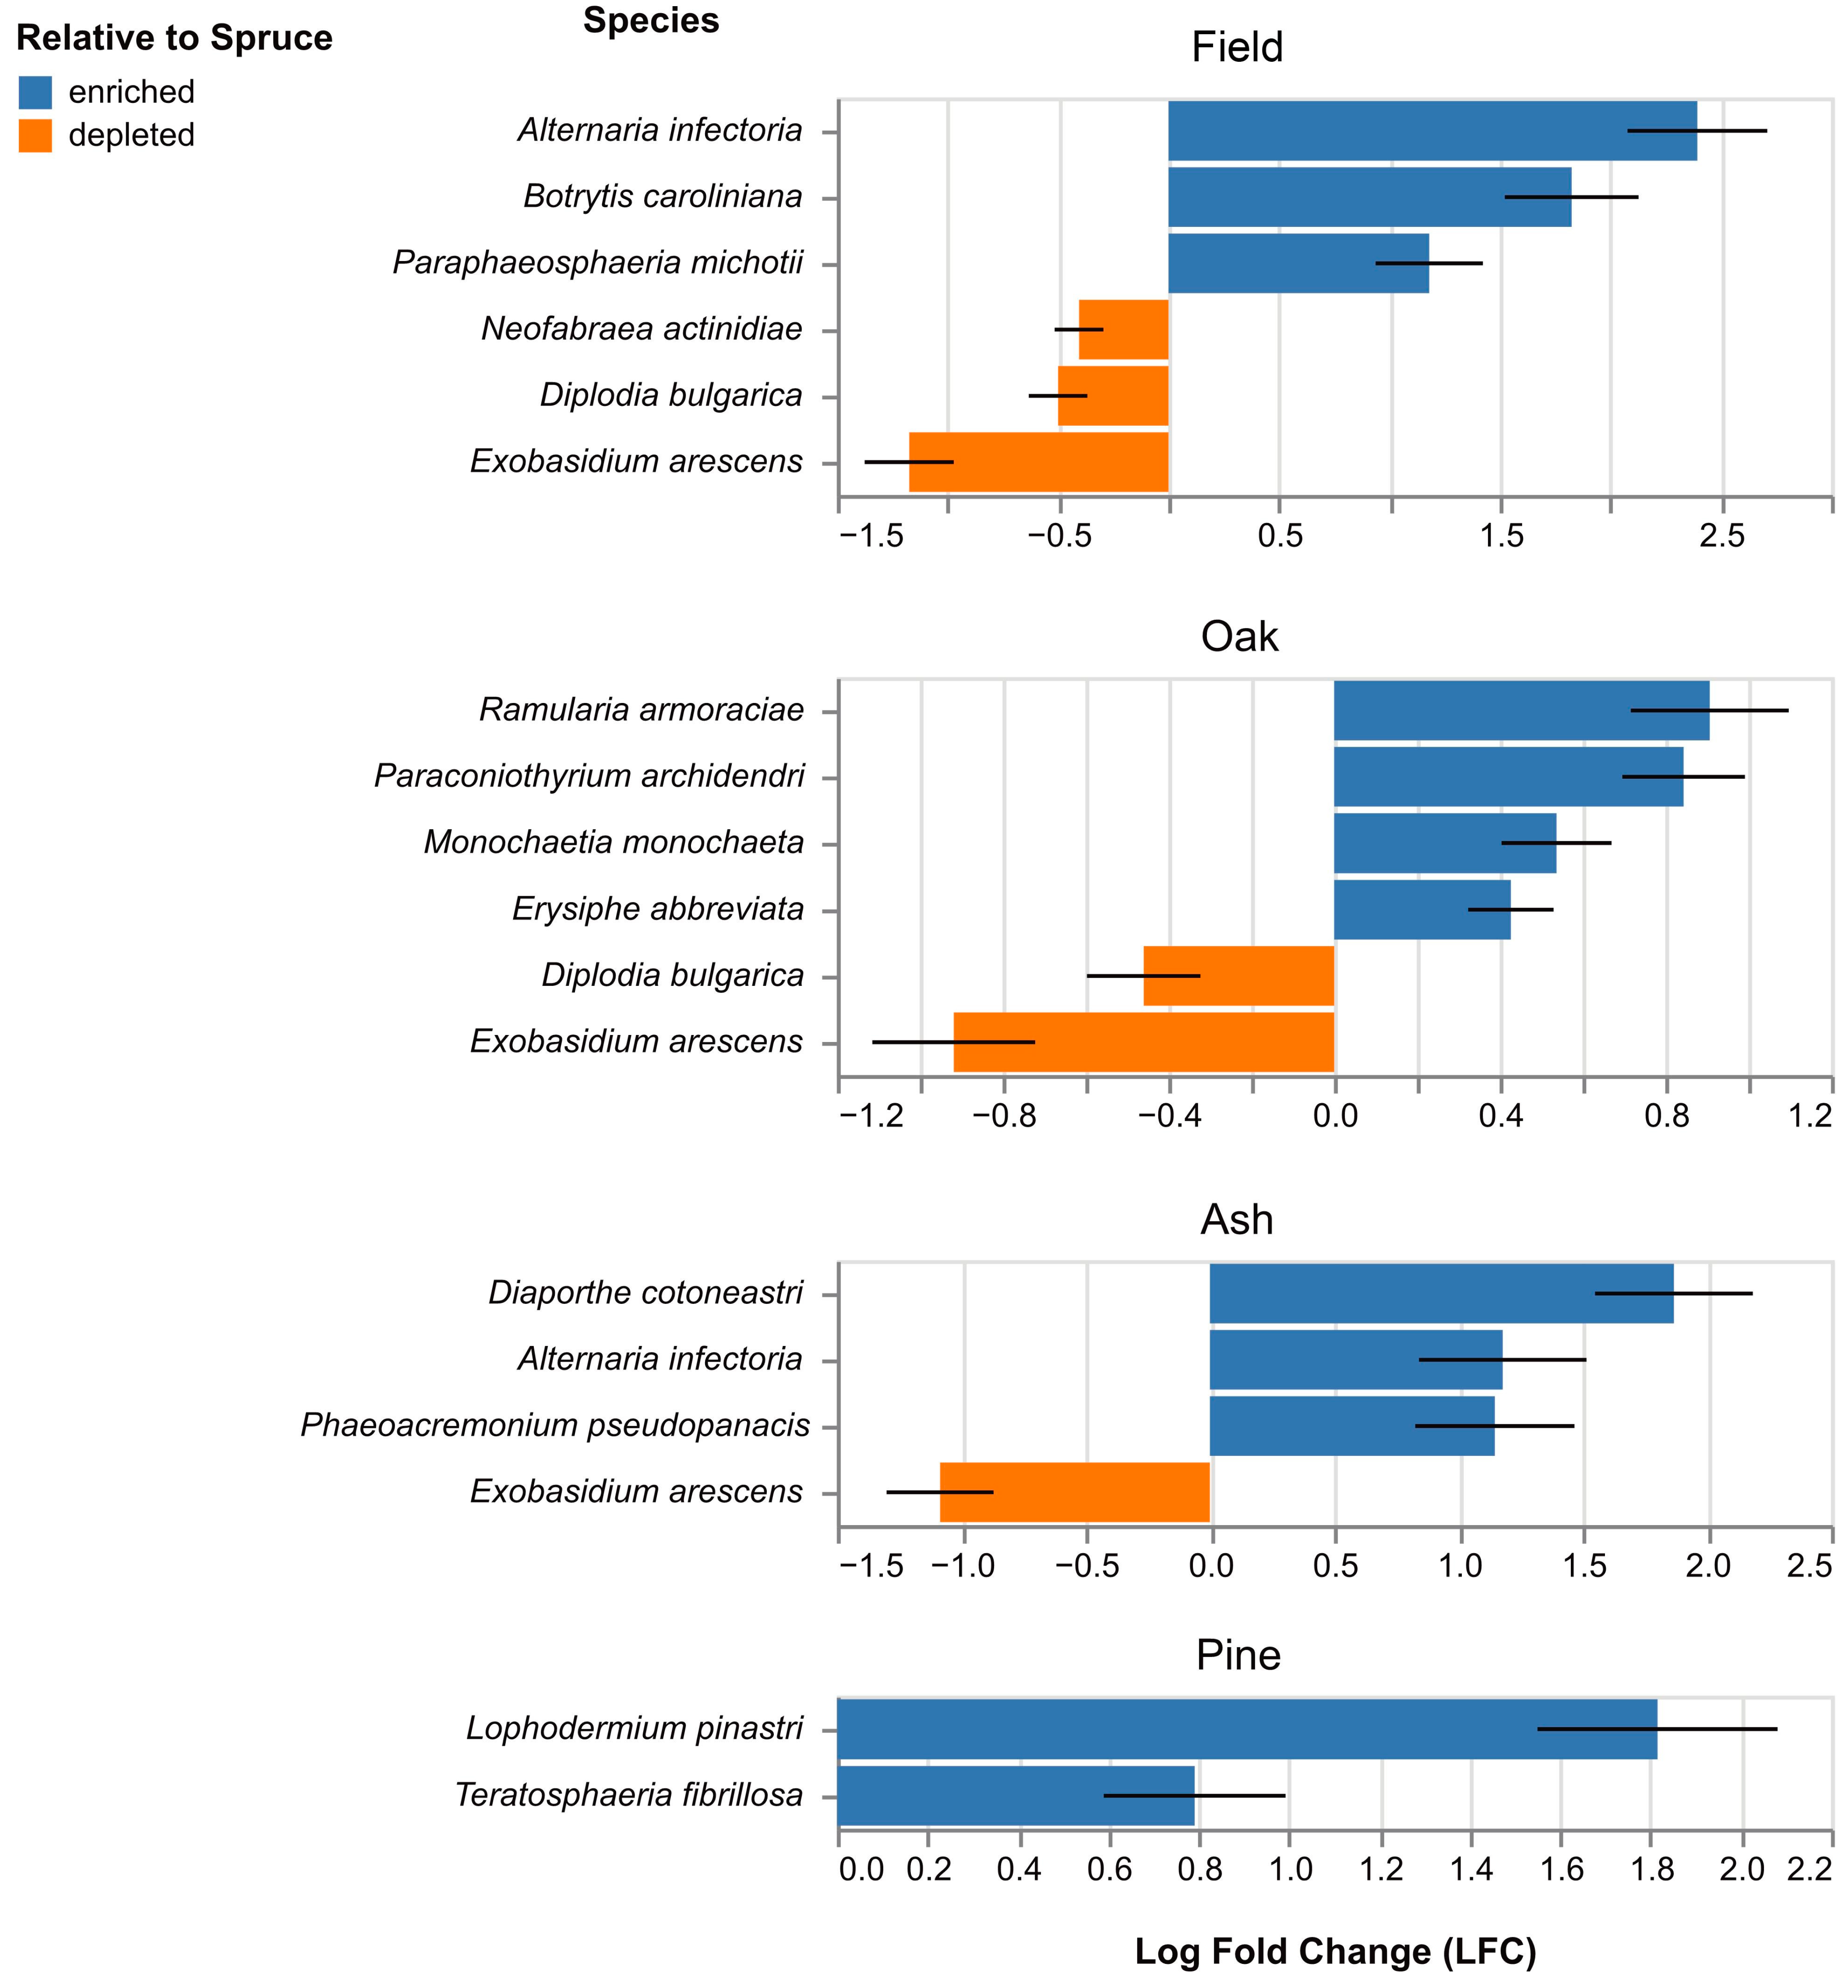
3.5. Composition of Fungal and Oomycete Pests

Analysis of compositions of microbiomes with bias correction (ANCOM-BC) was carried out on four different forest sites across Northern Ireland (Lough Navar, Hillsborough, Loughgall, and Mount Stewart) using Davagh as the reference site (Figure 7). Each graph represents one of these four sites, showing the increase or decrease in statistically significant log-fold changes in fungal and oomycete pests relative to their abundance in the reference site, Davagh. Increases in log-fold change (blue) are labelled as enriched and decreases in log-fold change (orange) are labelled as depleted, both of which are relative to their respective organism present in the reference site.
ANCOM-BC was also carried out on four different tree-traps (ash, non-tree field, oak and pine) using spruce as the reference tree-trap (Figure 8). Each graph represents one of these four traps, showing the increase or decrease in statistically significant log-fold changes in fungal and oomycete pests relative to their abundance in the reference trap.

4. Discussion

One of the aims of NPPOs is to prevent the entry and establishment of non-native plant pests in their territory. This has become more difficult as trade connects distant countries, exposing them to new pests. NPPOs engage in a range of activities to prevent the establishment of serious plant pests; they perform risk assessments, enact legislation, inspect plant products at the point of entry, and perform surveillance in the wider environment. Statutory action to destroy plant pests, with the aim of eradicating or minimising their spread, is the primary means of intervention, but its success is varied. Early implementation of controls has been identified as key in the successful eradication efforts of plant pests, and underpinning this is early detection [51]. In this study, we sought to demonstrate the potential of using eDNA collected from forest rainwater as an advanced surveillance tool for early detection of plant fungal and oomycete pests.
The challenge for plant health scientists working with large eDNA datasets is taking complex scientific data and transforming it into an output that is robust and in line with international standards (e.g., IPPC) yet can be understood and actioned by plant health authorities. In this paper, we aimed to analyse and present the data in a way that would be useful for end-users, the plant health inspectors, and policymakers. One exception to this aim is that we rarefied our sequencing data to 21,000 reads so we could compare sites, tree-traps, months and seasons, and apply statistics. However, for statutory surveillance purposes, authorities could choose to not perform any rarefaction to ensure the greatest chance of picking up plant pathogens.
Most of the plant pests found in this study were native to the UK; none were regulated quarantine pests in either the UK or the European Union (EU), although several were regulated non-quarantine pests. There was a significant difference in both the detection and diversity of plant fungal and oomycete pests across months and seasons. The month and season with the most detections of fungal and oomycete plant pests were November and Autumn (Figure 5 and Supplementary S3), consistent with when many fungi fruit and sporulate [52]. The greatest diversity in fungal and oomycete plant pests throughout the year were again seen in November and Autumn, although there was a spike in pest diversity in July (Figure 6 and Supplementary S3). Detection and diversity across traps were also significantly different. The trap with the highest predicted average detection and diversity in fungal and oomycete pests was the non-tree field trap (Supplementary S3), suggesting that much of the pest detection is not a result of being placed under a particular tree but a result of wind and rain blowing pests into the traps.
Of the 65 fungal and oomycete pests identified in this study, 9 were present on the UK Plant Health Risk Register (Table 1). The UK Plant Health Risk Register is a list of pests that pose a risk to plant health in the UK. The register scores plant pests 1–5 for three criteria, namely: (i) the likelihood of a pest entering and establishing in the UK; (ii) the economic, environmental and social impact of the pest; and (iii) the value at risk from the pest. These three scores are then multiped together to produce a risk rating which allows for the ranking of pests considered to be the most harmful to UK plant health. Colletotrichum acutatum, a fungal pathogen of strawberry and celery [42] and Verticillium albo-atrum, a soil-borne pathogen that causes wilting of a wide range of fruit and ornamental plants [42,53], were found in our study and are present on the UK Plant Health Risk Register, both with the joint highest risk score of 60. Seven of the risk register fungal pathogens are regulated non-quarantine pests which are deemed to have an ‘economically unacceptable impact’; these pathogens are present in the EU and the UK, and statutory action on relevant plant commodities must be taken by producers or authorities to prevent their spread and impact [42].
At least two of the fungal pests identified in this study have not previously been detected in Northern Ireland—Gnomoniopsis idaeicola and Sirococcus piceicola, both of which are listed on the UK Plant Health Risk Register (Table 1). G. idaeicola is a fungal pathogen that causes cankers and wilting of Rubus species, while S. piceicola is a fungal pathogen that causes blight in cedar and hemlock trees [1,2,3]. These pests were found only a handful of times during the study and caution is required when interpreting these results. G. idaeicola was found twice, once at Loughgall and once at Mount Stewart in the non-tree field traps, while S. piceicola was found only once at Lough Navar in a pine tree-trap (Figure 3 and Figure 4). Our laboratories do not keep cultures or the DNA of these fungi; therefore, laboratory-borne contamination of our samples is unlikely. The ASVs of these pests were called with high confidence by the QIIME2 taxonomic classifier, with an estimated probability that the assigned taxonomic assignment is correct of 0.999 and 0.996, respectively. These pests could be present in the environment at low levels but may not be causing any noticeable signs of disease. Follow-up surveillance of these sites, plus laboratory confirmation on any findings, is required to confirm their presence.
There were a range of interesting correlations between fungal and oomycete pests and sites. A number of fungi were present in all the sites in this study, such Botrytis caroliniana, Exobasidium arescens, and Armillaria borealis. B. caroliniana causes mould of blackberry and strawberry [54], while E. arescens causes leafspot on bilberry [55]; some of these plants are widespread in forests, hedgerows, verges, and road-sides across Northern Ireland. A. borealis causes white rot in woody plants; although not as aggressive as other Armillaria species, it has a very wide host range that includes numerous broadleaf and conifers [56]. Other pathogens, such as Lophodermium pinastri and Neofabraea actinidiae, were correlated with forest sites that had large stands of conifers. According to EPPO, L. pinastri is responsible for needle cast of pine and fir trees and its presence in Davagh and Lough Navar correlates with the large number of sprue and pine trees present at these sites [44]. However, N. actinidiae is reported as causing soft rot in a range of fruits, but no fruits are grown in the immediate vicinity of either Davagh or Lough Navar forests [57]. Rhytisma acerinum, the causal agent of tar-spot of sycamore trees [58], was found only at Mount Stewart, but sycamore trees with tar-spot are also present at Loughgall and Hillsborough, and it is widespread in NI. Venturia saliciperda causes scab in willow and was found only at Hillsborough [44]; however, willow is grown at the AFBI research sites in both Loughgall and Hillsborough (Figure 3).
There were also correlations with fungal and oomycete findings and the type of tree the trap was placed under. Monochaetia monochaeta is a pathogen that causes leaf spot in oak and was only found in traps placed under oak trees. Apiospora kogelbergensis, S. conigenus, Diaporthe citrichinensis, Alternaria rosae, and Fusarium solani were found only in traps under pine trees. Erysiphe lonicerae and S. piceicola were found only in traps under spruce trees, while Elsinoe ledi and Stemphylium vesicarium were only found is traps under ash trees. Some of these occurrences make sense, for example, S. conigenus is a disease of pine needles and its finding in pine traps is in keeping with its known pathology. However, we are unable to explain why D. citrichinensis, which causes rot of citrus and pear [59], and A. rosae, which causes black head mould in wheat and barely [60], were found only in traps under pine. It is possible that some of these pests are living in the leaf litter, or they have been blown into the pine traps from further afield. A number of risk-register pests, such as G. idaeicola and C. acutatum, causing disease of blackberry and strawberry (Table 1), were only found in the non-tree field trap. This may be because traps placed in an open field are more exposed to wind and are thus more likely to have pests from nearby plants blown into them.
Some pathogens known to be present in our forests were not detected. Hymenoscyphus fraxineus (the causative agent of ash dieback), which is present throughout Europe [61], was not detected in any of the samples at species level, although some ASVs resolved to the Hymenoscyphus genus and a non-pathogenic species Hymenoscyphus pusillus. Phytophthora, a genus of several important plant pathogens, was also not found in any of the samples. Yet a number of Phytophthora spp. have been identified in NI, including Phytophthora ramorum and Phytophthora lateralis (and others). P. ramorum was found in Hillsborough forest previously [62]. There are several reasons why these pathogens might not have been picked up. (i) For some pests, aerial dispersal is not considered the main way they spread and the rainwater trapping method used in this study may be unsuitable for their detection. While P. ramorum can spread aerially, other Phytophthora spp. (such as P. lateralis) are believed to spread primarily through soil and water [63]. However, two Armillaria spp. were detected in this study, and these are pests mainly thought to spread by soil borne fungal rhizomorphs and root-to-root contact [41]. eDNA taken from soil, leaf litter, or watercourses might be better at picking up pests which are not primarily spread in the air. (ii) The primers used in this study may not amplify some of the pathogens we know to be present in these forests. Using a different primer set, or multiple primers to sequence a range of taxonomic marker genes might help with the detection of a broader range of pathogens [64]. Some of the studies which have applied next generation sequencing to uncover the diversity of Phytophthora spp. used Phytophthora specific primer sets [26]. (iii) The missing pathogens might not be present in sufficiently high concentrations to be detected at 100k read depth using our collection and filtering approach, although given how widespread ash dieback is in NI this does not seem the most likely explanation. (iv) Short-read sequencing technology often does not provide sufficient resolution to differentiate between species of the same genus [65]. While we failed to detect H. fraxineus in this study, we did detect ash dieback in another study that used long-read sequencing (unpublished data). (v) Species identification using ITS region may not always be sufficient for precise species-level resolution. While the ITS region is the official fungal barcode for species identification (as recommended by the Fungal Barcoding Consortium), its effectiveness varies among fungal taxa. Using multiple taxonomic markers should improve species resolution.
In our data, there were over 9000 taxonomic features (ASVs), yet we identified only 65 fungal and oomycete pests (corresponding to 179 ASVs). A number of ASVs were identified to genera that contain plant pests but because species information was absent these were excluded from the final analysis. Approximately half of the ASVs in our data could not be identified to species; this means a large portion of the sequencing data are currently unusable for phytosanitary purposes. The UNITE version 10 classifier, used by QIIME2 to assign ITS sequences to a taxonomy, contains only 58% of the fungal and oomycete pests present on the UK Plant Health Risk Register (Supplementary S1). Plant health scientists need to populate reference databases with the DNA of plant pests to maximise the use of eDNA and NGS for plant health surveillance. The ASVs in this study which were not resolved to species could represent a plant pest for which there is limited genomic data, or plant pests which are yet to be described. These data can act as a historical record that can be re-analysed should a new plant pest emerge, or when genomic databases are improved. The data can also assist authorities to prove that these forest sites have historically been pest-free or help authorities understand how long a pest has been present.
Expert judgement is critical to interpreting the output of NGS data [44]. The information produced by NGS needs to be examined in tandem with the known biology of the pathogen, the relevant phytosanitary legislation, the scenario from which the samples were collected, and the wider taxonomic status of the pathogen and its close relatives. NGS is still a relatively new method in plant health diagnostics and surveillance and a period of time will be needed before the limitations of the method can be understood and addressed [66]. In particular, the uncertainty of taxonomic assignment needs to be clearly communicated to the policymakers. A secondary confirmation of any plant pest found through NGS screening will be required before implementing any phytosanitary controls [67].
There are a number of factors to consider when including eDNA into forestry surveillance programmes. Selecting forest sites in strategic locations where you might expect to encounter non-native pests moving in trade might increase the odds of picking up pests early in eDNA, i.e., forests close to commercial nurseries, border control points, or where timber is processed. Taking environmental samples from a number of fixed forest sites every year might be useful when surveying for serious pests, or for constant monitoring of important habitats. Alternatively, taking environmental samples from a range of different forest sites every few years, might provide better coverage of the NPPOs territory and habitat types. Pests have a wide range of lifecycles and choosing only one sampling approach might limit the number of pests that can be detected. Sequencing eDNA from a range of substrates, e.g., air, water, soil, and leaf litter, will likely be required to provide a fuller understanding of the pests present in a forest.

5. Conclusions

This study illustrates the potential use of eDNA in plant health surveillance. To our knowledge, this is the first widescale application of eDNA from rainwater to detect fungal and oomycete pests of plants present in forest environments. Going forward, the application of next-generation sequencing to detect bacterial and insect pests of forests from eDNA will be important to cover the wide range of pests that can threaten trees. Environmental DNA can provide authorities with an overview of what pests might be present in their forests and where and when these pests might be found, which should allow NPPOs to focus their resources to those pests which pose the greatest threat. This approach has the potential to enhance plant health surveillance efforts through early detection, shortening the time it takes to implement statutory action, reducing the cost of control measures, and improving eradication and containment outcomes.

Supplementary Materials

The following supporting information can be downloaded at: https://www.mdpi.com/article/10.3390/f16040632/s1, Supplementary S1—Figure S1: Classifier evaluation results, confidence and precision; Supplementary S1—Table S1: Comparison of fungi and oomycetes present on the UK Plant Health Risk register (Risk Register 226_08_2024 08_44_07) and the species present in the UNITE database (qiime_ver10_99_s_all). Supplementary S2—Feature table: 21,000 reads feature table, adjusted from alpha rarefaction curves, with taxonomic assignment. Supplementary S3—Results of GLMM with Poisson distribution and post hoc analysis.

Author Contributions

Conceptualization, J.D. and N.W.; methodology, D.C., J.M., A.M., K.M. and K.E.M.; software, H.A.B., M.A.S., K.E.M. and N.W.; validation, H.A.B., M.A.S., K.E.M. and N.W.; formal analysis, H.A.B., M.A.S., K.E.M. and N.W.; investigation, H.A.B., M.A.S., K.E.M. and N.W.; resources, K.E.M., E.C., A.K.M. and N.W.; data curation, H.A.B., M.A.S., K.E.M. and N.W.; writing—original draft preparation, K.E.M., H.A.B., M.A.S. and N.W.; writing—review and editing, H.A.B., M.A.S., E.C., A.K.M., R.O., J.D. and N.W.; visualisation, A.M., H.A.B., M.A.S., K.E.M. and N.W.; supervision, K.E.M., E.C., A.K.M. and N.W.; project administration, K.E.M. and N.W.; funding acquisition, J.D. and N.W. All authors have read and agreed to the published version of the manuscript.

Funding

This research was funded by the Northern Ireland Department of Agriculture, Environment and Rural Affairs, proposal reference 21 3 01.

Data Availability Statement

Sequencing data are submitted to the NCBI SRA database with the accession BioProject: PRJNA1222366. The supplementary files contain data which was used to generate the results presented in this paper.

Acknowledgments

We would like to thank Neil Kaye from the met office for providing the rain and temperature data for the sites, and Alan Gordon from AFBI for his help with statistics.

Conflicts of Interest

The authors declare no conflicts of interest.

References

  1. IPPC Secretariat. Scientific Review of the Impact of Climate Change on Plant Pests—A Global Challenge to Prevent and Mitigate Plant Pest Risks in Agriculture, Forestry and Ecosystems, 1st ed.; Food and Agricultural Organization of the United Nation: (FAO): Rome, Itlay, 2021; p. 88. [Google Scholar]
  2. IPBES. Intergovernmental Science-Policy Platform on Biodiversity and Ecosystem Services. Summary for Policy Makers of the Global Assessment Report on Biodiversity and Ecosystem Services of the Intergovernmental Science-Policy Platform on Biodiversity and Ecosystem Services; IPBES: Bonn, Germany, 2019. [Google Scholar]
  3. Bellard, C.; Cassey, P.; Blackburn, T.M. Alien species as a driver of recent extinctions. Biol. Lett. 2016, 12, 20150623. [Google Scholar] [CrossRef] [PubMed]
  4. Quirion, B.R.; Domke, G.M.; Walters, B.F.; Lovett, G.M.; Fargione, J.E.; Greenwood, L.; Serbesoff-King, K.; Randall, J.M.; Fei, S. Insect and disease disturbances correlate with reduced carbon sequestration in forests of the contiguous United States. Front. For. Glob. Change 2021, 4, 716582. [Google Scholar] [CrossRef]
  5. Keller, R.P.; Perrings, C. International Policy Options for Reducing the Environmental Impacts of Invasive Species. BioScience 2011, 61, 1005–1012. [Google Scholar]
  6. IPPC. Approved Specifications for Adopted ISPMs. 2024. Available online: https://www.ippc.int/en/core-activities/standards-setting/approved-specifications/approved-specifications-for-adopted-ispms/ (accessed on 4 December 2024).
  7. APHIS. Animal and Plant Health Inspection Service, U.S. Department of Agriculture, Laws and Regulations. 2025. Available online: https://www.aphis.usda.gov/laws-regs (accessed on 4 December 2024).
  8. ANON. EU Plant Health Regulation 2016/2031. 2016: EUR-Lex. Available online: https://eur-lex.europa.eu/eli/reg/2016/2031/oj/eng (accessed on 19 February 2025).
  9. Sosnowski, M.R.; Fletcher, J.D.; Daly, A.M.; Rodoni, B.C.; Viljanen-Rollinson, S.L.H. Techniques for the treatment, removal and disposal of host material during programmes for plant pathogen eradication. Plant Pathol. 2009, 58, 621–635. [Google Scholar] [CrossRef]
  10. Straw, N.A.; Fielding, N.J.; Tilbury, C.; Williams, D.T.; Cull, T. History and development of an isolated outbreak of Asian longhorn beetle Anoplophora glabripennis (Coleoptera: Cerambycidae) in southern England. Agric. For. Entomol. 2016, 18, 280–293. [Google Scholar] [CrossRef]
  11. Forest and Wood Products of Australia, Exotic Pest Risk Real and Rising in Australia. 2017. Available online: https://fwpa.com.au/news/exotic-pest-risk-real-and-rising-in-australia-2/ (accessed on 4 December 2024).
  12. Schneider, K.; van der Werf, W.; Cendoya, M.; Mourits, M.; Navas-Cortés, J.A.; Vicent, A.; Oude Lansink, A. Impact of Xylella fastidiosa subspecies pauca in European olives. Proc. Natl. Acad. Sci. USA 2020, 117, 9250–9259. [Google Scholar] [CrossRef] [PubMed]
  13. Hill, L.; Hemery, G.; Hector, A.; Brown, N.; Fajardo, A. Maintaining ecosystem properties after loss of ash in Great Britain. J. Appl. Ecol. 2018, 56, 282–293. [Google Scholar] [CrossRef]
  14. Pluess, T.; Jarosik, V.; Pysek, P.; Cannon, R.; Pergl, J.; Breukers, A.; Bacher, S. Which factors affect the success or failure of eradication campaigns against alien species? PLoS ONE 2012, 7, e48157. [Google Scholar] [CrossRef]
  15. Venbrux, M.; Crauwels, S.; Rediers, H. Current and emerging trends in techniques for plant pathogen detection. Front. Plant Sci. 2023, 14, 1120968. [Google Scholar] [CrossRef]
  16. Green, S.; Dehnen-Schmutz, K.; Drakulic, J.; Eschen, R.; Orazio, C.; Douma, J.C.; Lundén, K.; Colombari, F.; Jactel, H. Awareness, detection and management of new and emerging tree pests and pathogens in Europe: Stakeholders’ perspectives. NeoBiota 2023, 8, 9–40. [Google Scholar] [CrossRef]
  17. Mizumoto, H.; Kishida, O.; Takai, K.; Matsuura, N.; Araki, H. Utilizing environmental DNA for wide-range distributions of reproductive area of an invasive terrestrial toad in Ishikari river basin in Japan. Biol. Invasions 2021, 24, 1199–1211. [Google Scholar] [CrossRef]
  18. Ruiz-Ramos, D.V.; Meyer, R.S.; Toews, D.; Stephens, M.; Kolster, M.K.; Sexton, J.P. Environmental DNA (eDNA) detects temporal and habitat effects on community composition and endangered species in ephemeral ecosystems: A case study in vernal pools. Environ. DNA 2022, 5, 85–101. [Google Scholar] [CrossRef]
  19. Català, S.; Pérez-Sierra, A.; Abad-Campos, P. The Use of Genus-Specific Amplicon Pyrosequencing to Assess Phytophthora Species Diversity Using eDNA from Soil and Water in Northern Spain. PLoS ONE 2015, 10, e0119311. [Google Scholar]
  20. Prigigallo, M.I.; Abdelfattah, A.; Cacciola, S.O.; Faedda, R.; Sanzani, S.M.; Cooke, D.E.L.; Schena, L. Metabarcoding Analysis of Phytophthora Diversity Using Genus-Specific Primers and 454 Pyrosequencing. Phytopathology 2016, 106, 305–313. [Google Scholar] [CrossRef] [PubMed]
  21. Catalá, S.; Berbegal, M.; Pérez-Sierra, A.; Abad-Campos, P. Metabarcoding and development of new real-time specific assays reveal Phytophthora species diversity in holm oak forests in eastern Spain. Plant Pathol. 2017, 66, 115–123. [Google Scholar]
  22. Valentin, R.E.; Fonseca, D.M.; Gable, S.; Kyle, K.E.; Hamilton, G.C.; Nielsen, A.L.; Lockwood, J.L. Moving eDNA surveys onto land: Strategies for active eDNA aggregation to detect invasive forest insects. Mol. Ecol. Resour. 2020, 20, 746–755. [Google Scholar]
  23. Milian-Garcia, Y.; Young, R.; Madden, M.; Bullas-Appleton, E.; Hanner, R.H. Optimization and validation of a cost-effective protocol for biosurveillance of invasive alien species. Ecol. Evol. 2021, 11, 1999–2014. [Google Scholar] [CrossRef]
  24. Apangu, G.P.; Frisk, C.A.; Petch, G.M.; Muggia, L.; Pallavicini, A.; Hanson, M.; Skjøth, C.A. Environmental DNA reveals diversity and abundance of Alternaria species in neighbouring heterogeneous landscapes in Worcester, UK. Aerobiologia 2022, 38, 457–481. [Google Scholar] [CrossRef]
  25. Green, S.; Cooke, D.E.L.; Dunn, M.; Barwell, L.; Purse, B.; Chapman, D.S.; Valatin, G.; Schlenzig, A.; Barbrook, J.; Pettitt, T.; et al. PHYTO-THREATS: Addressing Threats to UK Forests and Woodlands from Phytophthora; Identifying Risks of Spread in Trade and Methods for Mitigation. Forests 2021, 12, 1617. [Google Scholar] [CrossRef]
  26. Green, S.; Cooke, D.E.L.; Barwell, L.; Purse, B.V.; Cock, P.; Frederickson-Matika, D.; Randall, E.; Keillor, B.; Pritchard, L.; Thorpe, P.; et al. The prevalence of Phytophthora in British plant nurseries; high-risk hosts and substrates and opportunities to implement best practice. Plant Pathol. 2025, 74, 696–717. [Google Scholar] [CrossRef]
  27. Ladin, Z.S.; Ferrell, B.; Dums, J.T.; Moore, R.M.; Levia, D.F.; Shriver, W.G.; D'Amico, V.; Trammell, T.L.E.; Setubal, J.C.; Wommack, K.E. Assessing the efficacy of eDNA metabarcoding for measuring microbial biodiversity within forest ecosystems. Sci. Rep. 2021, 11, 1629. [Google Scholar] [CrossRef]
  28. Macher, T.-H.; Schütz, R.; Hörren, T.; Beermann, A.J.; Leese, F. It’s raining species: Rainwash eDNA metabarcoding as a minimally invasive method to assess tree canopy invertebrate diversity. bioRxiv 2022. [Google Scholar] [CrossRef]
  29. Met Office, HadUK-Grid. 2025. Available online: https://www.metoffice.gov.uk/research/climate/maps-and-data/data/haduk-grid/haduk-grid (accessed on 21 January 2025).
  30. Boardman, L.; Marcelino, J.A.P.; Valentin, R.E.; Boncristiani, H.; Standley, J.M.; Ellis, J.D. Novel eDNA approaches to monitor Western honey bee (Apis mellifera L.) microbial and arthropod communities. Environ. DNA 2023, 6, e419. [Google Scholar] [CrossRef]
  31. Usyk, M.; Zolnik, C.P.; Patel, H.; Levi, M.H.; Burk, R.D. Novel ITS1 Fungal Primers for Characterization of the Mycobiome. Clin. Sci. Epidemiol. 2017, 2, e00488-17. [Google Scholar] [CrossRef]
  32. Bolger, A.M.; Lohse, M.; Usadel, B. Trimmomatic: A flexible trimmer for Illumina sequence data. Bioinformatics 2014, 30, 2114–2120. [Google Scholar] [CrossRef] [PubMed]
  33. Ewels, P.; Magnusson, M.; Lundin, S.; Käller, M. MultiQC: Summarize analysis results for multiple tools and samples in a single report. Bioinformatics 2016, 32, 3047–3048. [Google Scholar] [CrossRef] [PubMed]
  34. Li, P.-E.; Lo, C.-C.; Anderson, J.J.; Davenport, K.W.; Bishop-Lilly, K.A.; Xu, Y.; Ahmed, S.; Feng, S.; Mokashi, V.P.; Chain, P.S.G. Enabling the democratization of the genomics revolution with a fully integrated web-based bioinformatics platform. Nucleic Acids Res. 2016, 45, 67–80. [Google Scholar] [CrossRef]
  35. Lin, H.; Peddada, S.D. Analysis of compositions of microbiomes with bias correction. Nat. Commun. 2020, 11, 3514. [Google Scholar]
  36. Callahan, B.J.; McMurdie, P.J.; Rosen, M.J.; Han, A.W.; Johnson, A.J.; Holmes, S.P. DADA2: High-resolution sample inference from Illumina amplicon data. Nat. Methods 2016, 13, 581–583. [Google Scholar] [CrossRef]
  37. Hong, J.; Karaoz, U.; de Valpine, P.; Fithian, W. To rarefy or not to rarefy: Robustness and efficiency trade-offs of rarefying microbiome data. Bioinformatics 2022, 38, 2389–2396. [Google Scholar] [CrossRef]
  38. Abarenkov, K.; Nilsson, R.H.; Larsson, K.H.; Taylor, A.F.S.; May, T.W.; Frøslev, T.G.; Pawlowska, J.; Lindahl, B.; Põldmaa, K.; Truong, C.; et al. The UNITE database for molecular identification and taxonomic communication of fungi and other eukaryotes: Sequences, taxa and classifications reconsidered. Nucleic Acids Res. 2024, 52, D791–D797. [Google Scholar] [CrossRef]
  39. Bokulich, N.A.; Kaehler, B.D.; Rideout, J.R.; Dillon, M.; Bolyen, E.; Knight, R.; Huttley, G.A.; Gregory Caporaso, J. Optimizing taxonomic classification of marker-gene amplicon sequences with QIIME 2’s q2-feature-classifier plugin. Microbiome 2018, 6, 90. [Google Scholar] [CrossRef] [PubMed]
  40. Broad Institute, Morpheus. 2025. Available online: https://software.broadinstitute.org/morpheus/ (accessed on 19 March 2025).
  41. Devkota, P.; Hammerschmidt, R. The infection process of Armillaria mellea and Armillaria solidipes. Physiol. Mol. Plant Pathol. 2020, 112, 101543. [Google Scholar] [CrossRef]
  42. DEFRA. UK Plant Health Risk Register. 2024. Available online: https://planthealthportal.defra.gov.uk/pests-and-diseases/uk-plant-health-risk-register/ (accessed on 16 October 2024).
  43. Hamberg, L.; Saksa, T.; Hantula, J. Role and function of Chondrostereum purpureum in biocontrol of trees. Appl. Microbiol. Biotechnol. 2020, 105, 431–440. [Google Scholar] [CrossRef] [PubMed]
  44. EPPO. EPPO Global Database. Available online: https://gd.eppo.int/ (accessed on 16 October 2024).
  45. Cline, W.O.; Brewer, M.T.; Brannen, P.M.; Scherm, H. Exobasidium leaf and fruit spot of blueberry in the southeastern United States. In Proceedings of the NABREW Conference, Atlantic City, NJ, USA, 25 June 2014. [Google Scholar]
  46. Stevanovic, M.; Ristic, D.; Zivkovic, S.; Aleksic, G.; Stankovic, I.; Krstic, B.; Bulajic, A. Characterization of Gnomoniopsis idaeicola, the Causal Agent of Canker and Wilting of Blackberry in Serbia. Plant Dis. 2019, 103, 249–258. [Google Scholar] [CrossRef]
  47. Yang, G. General Description of Rhizoctonia Species Complex; IntechOpen: London, UK, 2012. [Google Scholar]
  48. Molla, K.A.; Karmakar, S.; Molla, J.; Bajaj, P.; Varshney, R.K.; Datta, S.K.; Datta, K. Understanding sheath blight resistance in rice: The road behind and the road ahead. Plant Biotechnol. J. 2019, 18, 895–915. [Google Scholar] [CrossRef]
  49. Francis, A.; Ghosh, S.; Tyagi, K.; Prakasam, V.; Rani, M.; Singh, N.P.; Pradhan, A.; Sundaram, R.M.; Priyanka, C.; Laha, G.S.; et al. Evolution of pathogenicity-associated genes in Rhizoctonia solani AG1-IA by genome duplication and transposon-mediated gene function alterations. BMC Biol. 2023, 21, 15. [Google Scholar] [CrossRef]
  50. Pérez-Sierra, A.; Hardy, C.; Chitty, R.; Lewis, A.; McCartan, S. First report of Sirococcus piceicola associated with Sitka spruce seed in Britain. New Dis. Rep. 2021, 44, e12048. [Google Scholar] [CrossRef]
  51. White, R.; Marzano, M.; Fesenko, E.; Inman, A.; Jones, G.; Agstner, B.; Mumford, R. Technology development for the early detection of plant pests: A framework for assessing Technology Readiness Levels (TRLs) in environmental science. J. Plant Dis. Prot. 2022, 129, 1249–1261. [Google Scholar] [CrossRef]
  52. Reznik, Y.V.; Yermishev, O.V.; Palamarchuk, O.V.; Bobrovska, O.A.; Rodinkova, V.V. Features of the seasonal dynamics of airborne fungal spore concentrations in Ukraine. Biosyst. Divers. 2023, 31, 71–83. [Google Scholar] [CrossRef]
  53. Inderbitzin, P.; Bostock, R.M.; Davis, R.M.; Usami, T.; Platt, H.W.; Subbarao, K.V. Phylogenetics and taxonomy of the fungal vascular wilt pathogen Verticillium, with the descriptions of five new species. PLoS ONE 2011, 6, e28341. [Google Scholar]
  54. Li, X.; Fernández-Ortuño, D.; Chai, W.; Wang, F.; Schnabel, G. Identification and Prevalence of Botrytis spp. from Blackberry and Strawberry Fields of the Carolinas. Plant Dis. 2012, 96, 1634–1637. [Google Scholar] [CrossRef]
  55. Nannfeldt, J.A. Exobasidium, a Taxonomic Reassessment Applied to the European Species; Almqvist & Wiksell International: Stockholm, Sweden, 1981. [Google Scholar]
  56. Akulova, V.S.; Sharov, V.V.; Aksyonova, A.I.; Putintseva, Y.A.; Oreshkova, N.V.; Feranchuk, S.I.; Kuzmin, D.A.; Pavlov, I.N.; Litovka, Y.A.; Krutovsky, K.V. De novo sequencing, assembly and functional annotation of Armillaria borealis genome. BMC Genom. 2020, 21, 534. [Google Scholar] [CrossRef]
  57. Valentine, D.C.; Shaffer, B.T.; McGhee, G.C.; Bouska, C.; Stockwell, V.O. First Report of Neofabraea actinidiae Causing a Cranberry Fruit Rot in Oregon. Plant Dis. 2024, 108, 1405. [Google Scholar]
  58. Hudler, G.W. Unusual endemic of tar spot on Norway maple in Upstate New York. Plant Dis. 1987, 71, 65–68. [Google Scholar]
  59. Guo, Y.S.; Crous, P.W.; Bai, Q.; Fu, M.; Yang, M.M.; Wang, X.H.; Du, Y.M.; Hong, N.; Xu, W.X.; Wang, G.P. High diversity of Diaporthe species associated with pear shoot canker in China. Persoonia Mol. Phylogeny Evol. Fungi 2020, 45, 132–162. [Google Scholar]
  60. Poursafar, A.; Ghosta, Y.; Orina, A.S.; Gannibal, P.B.; Javan-Nikkhah, M.; Lawrence, D.P. Taxonomic study on Alternaria sections Infectoriae and Pseudoalternaria associated with black (sooty) head mold of wheat and barley in Iran. Mycol. Prog. 2017, 17, 343–356. [Google Scholar]
  61. McMullan, M.; Rafiqi, M.; Kaithakottil, G.; Clavijo, B.J.; Bilham, L.; Orton, E.; Percival-Alwyn, L.; Ward, B.J.; Edwards, A.; Saunders, D.G.O.; et al. The ash dieback invasion of Europe was founded by two genetically divergent individuals. Nat. Ecol. Evol. 2018, 2, 1000–1008. [Google Scholar]
  62. DAERA. Phytophthora Ramorum. 2025. Available online: https://www.daera-ni.gov.uk/articles/phytophthora-ramorum (accessed on 21 January 2025).
  63. Kroon, L.P.N.M.; Brouwer, H.; de Cock, A.W.A.M.; Govers, F. The Genus Phytophthora Anno 2012. Phytopathology 2012, 102, 348–364. [Google Scholar]
  64. Martin, K.J.; Rygiewicz, P.T. Fungal-specific PCR primers developed for analysis of the ITS region of environmental DNA extracts. BMC Microbiol. 2005, 5, 28. [Google Scholar]
  65. Johnson, J.S.; Spakowicz, D.J.; Hong, B.Y.; Petersen, L.M.; Demkowicz, P.; Chen, L.; Leopold, S.R.; Hanson, B.M.; Agresta, H.O.; Gerstein, M.; et al. Evaluation of 16S rRNA gene sequencing for species and strain-level microbiome analysis. Nat. Commun. 2019, 10, 5029. [Google Scholar] [CrossRef] [PubMed]
  66. Olmos, A.; Boonham, N.; Candresse, T.; Gentit, P.; Giovani, B.; Kutnjak, D.; Liefting, L.; Maree, H.J.; Minafra, A.; Moreira, A.; et al. High-throughput sequencing technologies for plant pest diagnosis: Challenges and opportunities. EPPO Bull. 2018, 48, 219–224. [Google Scholar] [CrossRef]
  67. Massart, S.; Candresse, T.; Gil, J.; Lacomme, C.; Predajna, L.; Ravnikar, M.; Reynard, J.-S.; Rumbou, A.; Saldarelli, P.; Škorić, D.; et al. A Framework for the Evaluation of Biosecurity, Commercial, Regulatory, and Scientific Impacts of Plant Viruses and Viroids Identified by NGS Technologies. Front. Microbiol. 2017, 8, 45. [Google Scholar] [CrossRef] [PubMed]
Figure 1. Location of the five forest sites sampled across Northern Ireland and the rainwater traps within each site.
Forests 16 00632 g001
Figure 2. Rainwater trap in situ.
Forests 16 00632 g002
Figure 3. Heatmap, with hierarchical clustering, showing the presence and absence of the 65 plant pests by forest site, the figures in each box represent the number of pest detections over the year.
Forests 16 00632 g003
Figure 4. Heatmap, with hierarchical clustering, showing the presence and absence of the 65 plant pests by tree-trap, the figures in each box represent the number of pest detections over the year.
Forests 16 00632 g004
Figure 5. The total number of detections of fungal and oomycete pests by (a) month, (b) season, (c) forest site, and (d) tree-trap. Note—for panel (d) there were roughly twice as many traps per pine, oak, and spruce trees compared to ash trees and non-tree field traps (see method section).
Forests 16 00632 g005
Figure 6. The total number of unique fungal and oomycete pests by (a) month, (b) season, (c) forest site, and (d) tree-trap. Note—for panel (d), there were roughly twice as many traps per pine, oak and spruce trees compared to ash trees and non-tree field traps (see method section).
Forests 16 00632 g006
Figure 7. ANCOM-BC showing log2-fold change (LFC) (x axes) of statistically significant differential abundance in detection of pests (y axes) in sites (title) relative to reference Site ‘Davagh’. Mount Stewart: Alternaria infectoria, 1.23 ± 0.28, q-value = 0.00015, Diplodia bulgarica, 0.68 ± 0.17, q-value = 0.00273, Paraconiothrium archidendri, 0.64 ± 0.17, q-value = 0.00844, Paraphaeosphaeria michotii, −0.8 ± 0.19, q-value = 0.00292, Exobasidium arescens, −0.83 ± 0.23, q-value = 0.01834, Teratosphaeria fibrillose, −0.87 ± 0.25, q-value = 0.02349, Lophodermium pinastri, −1.09 ± 0.28, q-value = 0.00788. Loughgall: Alternaria infectoria, 1.15 +/− 0.25 lfc, q-value = 0.00079, Teratosphaeria fibrillose, −0.94 ± 0.24, q-value = 0.00708, Lophodermium pinastri, −1.1 ± 0.28, q-value = 0.00794. Hillsborough: Alternaria infectoria, 1.14 ± 0.26 lfc, q-value = 0.00058, Paraphaeosphaeria michotii −0.71 ± 0.21, q-value = 0.3255. Lough Navar: Neofabraea actinidae, 1.26 ± 0.26 lfc, q-value = 0.00008.
Forests 16 00632 g007
Figure 8. ANCOM-BC showing log2-fold change (LFC) (x axes) of statistically significant differential abundance in detection of organisms (y axes) in tree-traps, and the non-tree field trap (title), relative to reference trap ‘spruce’. Field: Alternaria infectoria, 2.39 ± 0.32 lfc, q-value = 2.46 × 10⁻¹²; Botrytis caroliniana, 1.82 ± 0.30 lfc, q-value = 1.06 × 10−07; Paraphaeosphaeria michotii, 1.18 ± 0.24 lfc, q-value = 7.29 × 10−05; Neofabraea actinidiae, −0.40 ± 0.11 lfc, q-value = 0.015; Diplodia bulgarica, −0.50 ± 0.13 lfc, q-value = 0.01; Exobasidium arescens, −1.17 ± 0.20 lfc, q-value = 3.78 × 10−07. Ash: Diaporthe cotoneastri, 1.87 ±0.32 lfc, q-value = 2.70 × 10−07; Alternaria infectoria, 1.18 ±0.34 lfc, q-value = 0.029; Phaeoacremonium pseudopanacis, 1.15 +/− 0.32 lfc, q-value = 0.021; Exobasidium arescens, −1.09 ± 0.21 lfc, q-value = 2.97 × 10−05. Oak: Ramularia armoraciae, 0.91 ± 0.19 lfc, q-value = 1.27 × 10−04; Paraconiothyrium archidendri, 0.84 ± 0.14 lfc, q-value = 7.82 × 10−07; Monochaetia monochaeta, 0.54 ± 0.13 lfc, q-value = 0.003; Erysiphe abbreviate, 0.43 ± 0.10 lfc, q-value = 0.002; Diplodia bulgarica, −0.46 +/− 0.14 lfc, q-value = 0.047; Exobasidium arescens, −0.92 ± 0.20 lfc, q-value = 1.88 × 10−04. Pine: Lophodermium pinastri, 1.82 ± 0.27 lfc, q-value = 5.37 × 10⁻¹⁰; Teratosphaeria fibrillose, 0.79 ± 0.20 lfc, q-value = 0.005.
Forests 16 00632 g008
Table 1. Nine pests were identified that occur on the UK Plant Health Risk Register. The table includes pest species name, pest status, and score (representative of the severity of the risk) on the risk register, the months and sites the pests were present, the number of times a pest was detected, the confidence of taxonomic assignation of ASVs to that species by the QIIME2 classifier (1 being high confidence), and details about the pests pathogenicity.
SpeciesRisk Register StatusMonthSiteDetections over the YearConfidence Limit (CL)Details
Armillaria melleaRegulated non-quarantine pest October and NovemberDavagh, Loughgall and Lough Navar161Highly virulent and is responsible for causing immense damage to fruit and nut trees, as well coniferous and broad leaf trees worldwide [41]. Some of the main hosts of A. mellea include birch, apple, pine, blackcurrant and ash [42]
Chondrostereum purpureumRegulated non-quarantine pest JanuaryDavagh 31Causes silver leaf disease [42,43]. C. purpureum has an extensive list of hosts including ash, maple, birch, pine, stone and pome fruit trees
Colletotrichum acutatumRegulated non-quarantine pest (score 60)June, September, October and NovemberLoughgall, Mount Stewart and Hillsborough60.84C. acutatum poses a risk to the strawberry industry [42]. Hosts include celery, lupine, pine, tomato, strawberry and olive [44]
Exobasidium japonicumRegulated non-quarantine pestJanuary, February, September, October and NovemberHillsborough and Lough Navar70.96Many species of the genus Exobasidium are reported pathogens of the Ericaceae family, causing galls on leaf and stems, spots and red shoots [45]
Gnomoniopsis idaeicolaNon-regulated (score 24)September and OctoberLoughgall and Mount Stewart20.99The hosts of this species mostly belong to the genus Rubus and it is noted as being a risk to the Rubus industry, causing cane canker and wilting in blackberry [42,46]
Rhizoctonia solaniRegulated non-quarantine pestJune and JulyLoughgall, Hillsborough and Mount Stewart30.78R. solani is a necrotrophic pathogen that infects a wide range of hosts, including economically important crops such as potato, rice, turf grass, barely and maize, and can persist in the soil for years without a specific host [47,48,49]
Sirococcus piceicolaRegulated non-quarantine pest (score 40)JulyLough Navar11The first incidence of this pathogen in the UK was recorded in 2021 on Sitka spruce seeds from Wales [50]. This pathogen can negatively impact Sitka spruce production in nurseries or cause damage to established trees [50]
Stemphylium vesicariumNon-regulated (score 36)February and MarchMount Stewart20.99Described as a potential pathogen of pears [42,44]. Other hosts include onion, asparagus and tomato in which S. vesicarium can cause leaf spot or leaf blight [42,44]
Verticillium albo-atrumRegulated non-quarantine pest (score 60)February and MarchHillsbourgh and Mount Stewart30.97A pathogen affecting fruit and nut trees, with major hosts including European hazelnut, quince, strawberry, tomato, apple and pear [42]
Disclaimer/Publisher’s Note: The statements, opinions and data contained in all publications are solely those of the individual author(s) and contributor(s) and not of MDPI and/or the editor(s). MDPI and/or the editor(s) disclaim responsibility for any injury to people or property resulting from any ideas, methods, instructions or products referred to in the content.

