Article

Unveiling the Carbon Secrets: How Forestry Projects Transform Biomass and Soil Carbon on the Tibet Plateau

1
Institute of Loess Plateau, Shanxi University, Taiyuan 030006, China
2
Soil Health Laboratory of Shanxi Province, Institute of Eco-Environment and Industrial Technology, Shanxi Agricultural University, Taiyuan 030031, China
3
Key Laboratory of Forest Ecology and Environment of National Forestry and Grassland Administration, Ecology and Nature Conservation Institute, Chinese Academy of Forestry, Beijing 100091, China
*
Authors to whom correspondence should be addressed.
Forests 2025, 16(4), 631; https://doi.org/10.3390/f16040631
Submission received: 13 February 2025 / Revised: 30 March 2025 / Accepted: 2 April 2025 / Published: 3 April 2025
(This article belongs to the Special Issue Effect of Vegetation Restoration on Forest Soil)

Abstract

:
Afforestation is regarded as a crucial approach to enhancing terrestrial carbon sinks. Nevertheless, in ecologically fragile regions, the impacts of afforestation on carbon in biomass and soil remain highly uncertain. This study employed field investigations to explore the effects of forestry ecological projects on carbon stocks in biomass and soil within the Qinghai–Tibet Plateau, and to deeply analyze its key influencing factors. The key findings are summarized as follows: (1) The total vegetation carbon stocks of arbor forests and shrub forests (ranging from 7.7 to 24.0 Mg/ha) are 1.3–6.8 times that of grasslands (ranging from 3.5 to 6.1 Mg/ha). Afforestation-induced changes in biomass carbon are primarily attributed to the increase in carbon storage within the arbor-shrub layer, while exhibiting negligible effects on herbaceous layer carbon. (2) The soil organic carbon (SOC) stocks (0–100 cm depth) of forestland, shrubland, and grassland are 39.6–64.5 Mg/ha, 40.7–100.2 Mg/ha, and 43.1–121.9 Mg/ha, respectively. There are no significant differences in SOC stocks among shrubland, forestland, and grassland at either the 10- or 25-year development stage. The SOC stocks of 40-year-old shrubland and forestland are 1.5 and 2.3 times that of grassland, respectively. (3) For 10-year-old and 25-year-old arbor and shrub afforestation, biomass carbon increased while SOC decreased, showing a trade-off. In the case of 40- year-old afforestation, both biomass carbon and SOC increased synergistically. (4) Results from the random forest analysis indicate that the understory herbaceous diversity in this region has a significant impact on biomass carbon sequestration, and that soil total nitrogen, ammonium nitrogen, and nitrate nitrogen determine SOC sequestration. (5) Partial least squares analysis further demonstrates that afforestation promotes the retention of SOC stocks by increasing soil nutrients (especially nitrogen and nitrogen availability). Afforestation in alpine and arid regions, especially 40-year shrub afforestation, holds great carbon sequestration potential. The supplementation of soil nitrogen and phosphorus can enhance the carbon sequestration of this system.

1. Introduction

On the backdrop of global warming, terrestrial ecosystems play a significant carbon sink function [1]. The carbon sink of forest ecosystems is significant. Afforestation contributes to this carbon sink by increasing biomass carbon and soil carbon [2], which can help to mitigate increasing atmospheric carbon dioxide levels [3]. For instance, a recent study by Bastin et al. suggested that afforestation has the potential to sequester 205 Gt C in ecosystems, offsetting 68% of global CO2 emissions [4]. In China, the major ecological afforestation projects resulted in a carbon sequestration of 0.78 to 1.14 Pg C by 2008 [5]. Afforestation provides immediate to multi–decadal carbon sequestration benefits in aboveground woody biomass and coarse woody debris pools. In the United States, during the first several decades following the planting, there are two- to three-fold carbon sequestration benefits in biomass [6]. Studying the changes in carbon sinks caused by afforestation is of great significance for enhancing and stabilizing the carbon sinks of terrestrial ecosystems.
Afforestation can influence soil organic carbon (SOC) through several mechanisms. In the early stages following afforestation, SOC content often decreases due to soil disturbance [7]. However, over time, litter, roots, and other organic materials introduced by afforestation serve as new carbon inputs, promoting the formation of a soil carbon sink [8]. Additionally, afforestation efforts typically prioritize minimizing losses caused by erosion and disturbance, while promoting SOC accumulation [9]. In the recent years, the impact of afforestation on SOC has received extensive attention [6,10,11,12]. Hong et al., 2020 [10] investigated 619 sample plots of afforestation projects in northern China. They found that in 52% of the sample plots, SOC increased due to afforestation, while in 48% of the plots, it decreased. Moreover, in carbon-rich soils, the afforestation disturbance increased the decomposability of original soil organic carbon, and the priming effect of newly input organic matter was strong, resulting in a decrease in SOC. Conversely, in carbon-poor soils, microbial activities were carbon-limited, and the newly input litter caused an increase in the soil organic carbon density (SOCD). Some regional and global meta-analyses further reveal that afforestation can lead to an increase, decrease, or no significant change in SOC stocks, with these variations being influenced by a range of factors, including tree species, stand age, land-use history, climate condition, and soil type [8,13,14,15,16]. Additionally, recent research on the regional scale of afforestation in northern China has shown that the changes in biomass carbon and SOC caused by afforestation exhibit asymmetry in some areas [3]. Evidently, there remains great uncertainty regarding the changes in biomass—soil organic carbon caused by afforestation, and more empirical studies are needed to explore the relevant regulatory mechanisms.
The Qinghai–Tibet Plateau is an important factor of climate change in Asia and the Northern Hemisphere, serving as an ecological security barrier and a vital region for both China and Asia. It is also a typical ecologically fragile area. Wang et al. 2023 [17] reported that the current carbon sink of the Qinghai–Tibet Plateau is 26.5–33.7 Tg C per year, accounting for 9.9%–19.6% of the carbon sink of China’s terrestrial ecosystems. An empirical study on the Qinghai–Tibet Plateau showed that afforestation increased SOC stocks by 31.3%, and the main influencing factors were above-ground biomass and soil total nitrogen [18]. However, some research has indicated that an increase in nitrogen input on the Qinghai–Tibet Plateau can cause SOC to shift from a carbon sink to a carbon source [19]. Given the arid and alpine environmental characteristics, the impact of afforestation on the vegetation–soil carbon sink is unclear in the Qinghai–Tibet Plateau, and that especially the carbon dynamics between them still need to be explored. Our objectives were to (1) study the impact of afforestation types and duration on carbon stocks in biomass and soil; (2) study the impact of afforestation on soil nutrients and water-holding capacity; and (3) identify the key biotic (e.g., biomass and understory herbaceous diversity) and abiotic factors (e.g., soil nutrients and moisture) driving the changes in SOC storage following afforestation in alpine and arid regions. We hypothesized that (1) both tree-based and shrub-based afforestation can significantly increase biomass and soil carbon storage, with both showing an increasing trend over time; (2) afforestation directly enhances soil organic carbon (SOC) sequestration through increased soil nutrient availability, while higher plant biomass and understory herbaceous diversity indirectly promote SOC storage by improving soil water-holding capacity. It should be noted that our study focused exclusively on soil water-holding capacity, while other aspects of soil hydrology were not examined.

2. Materials and Methods
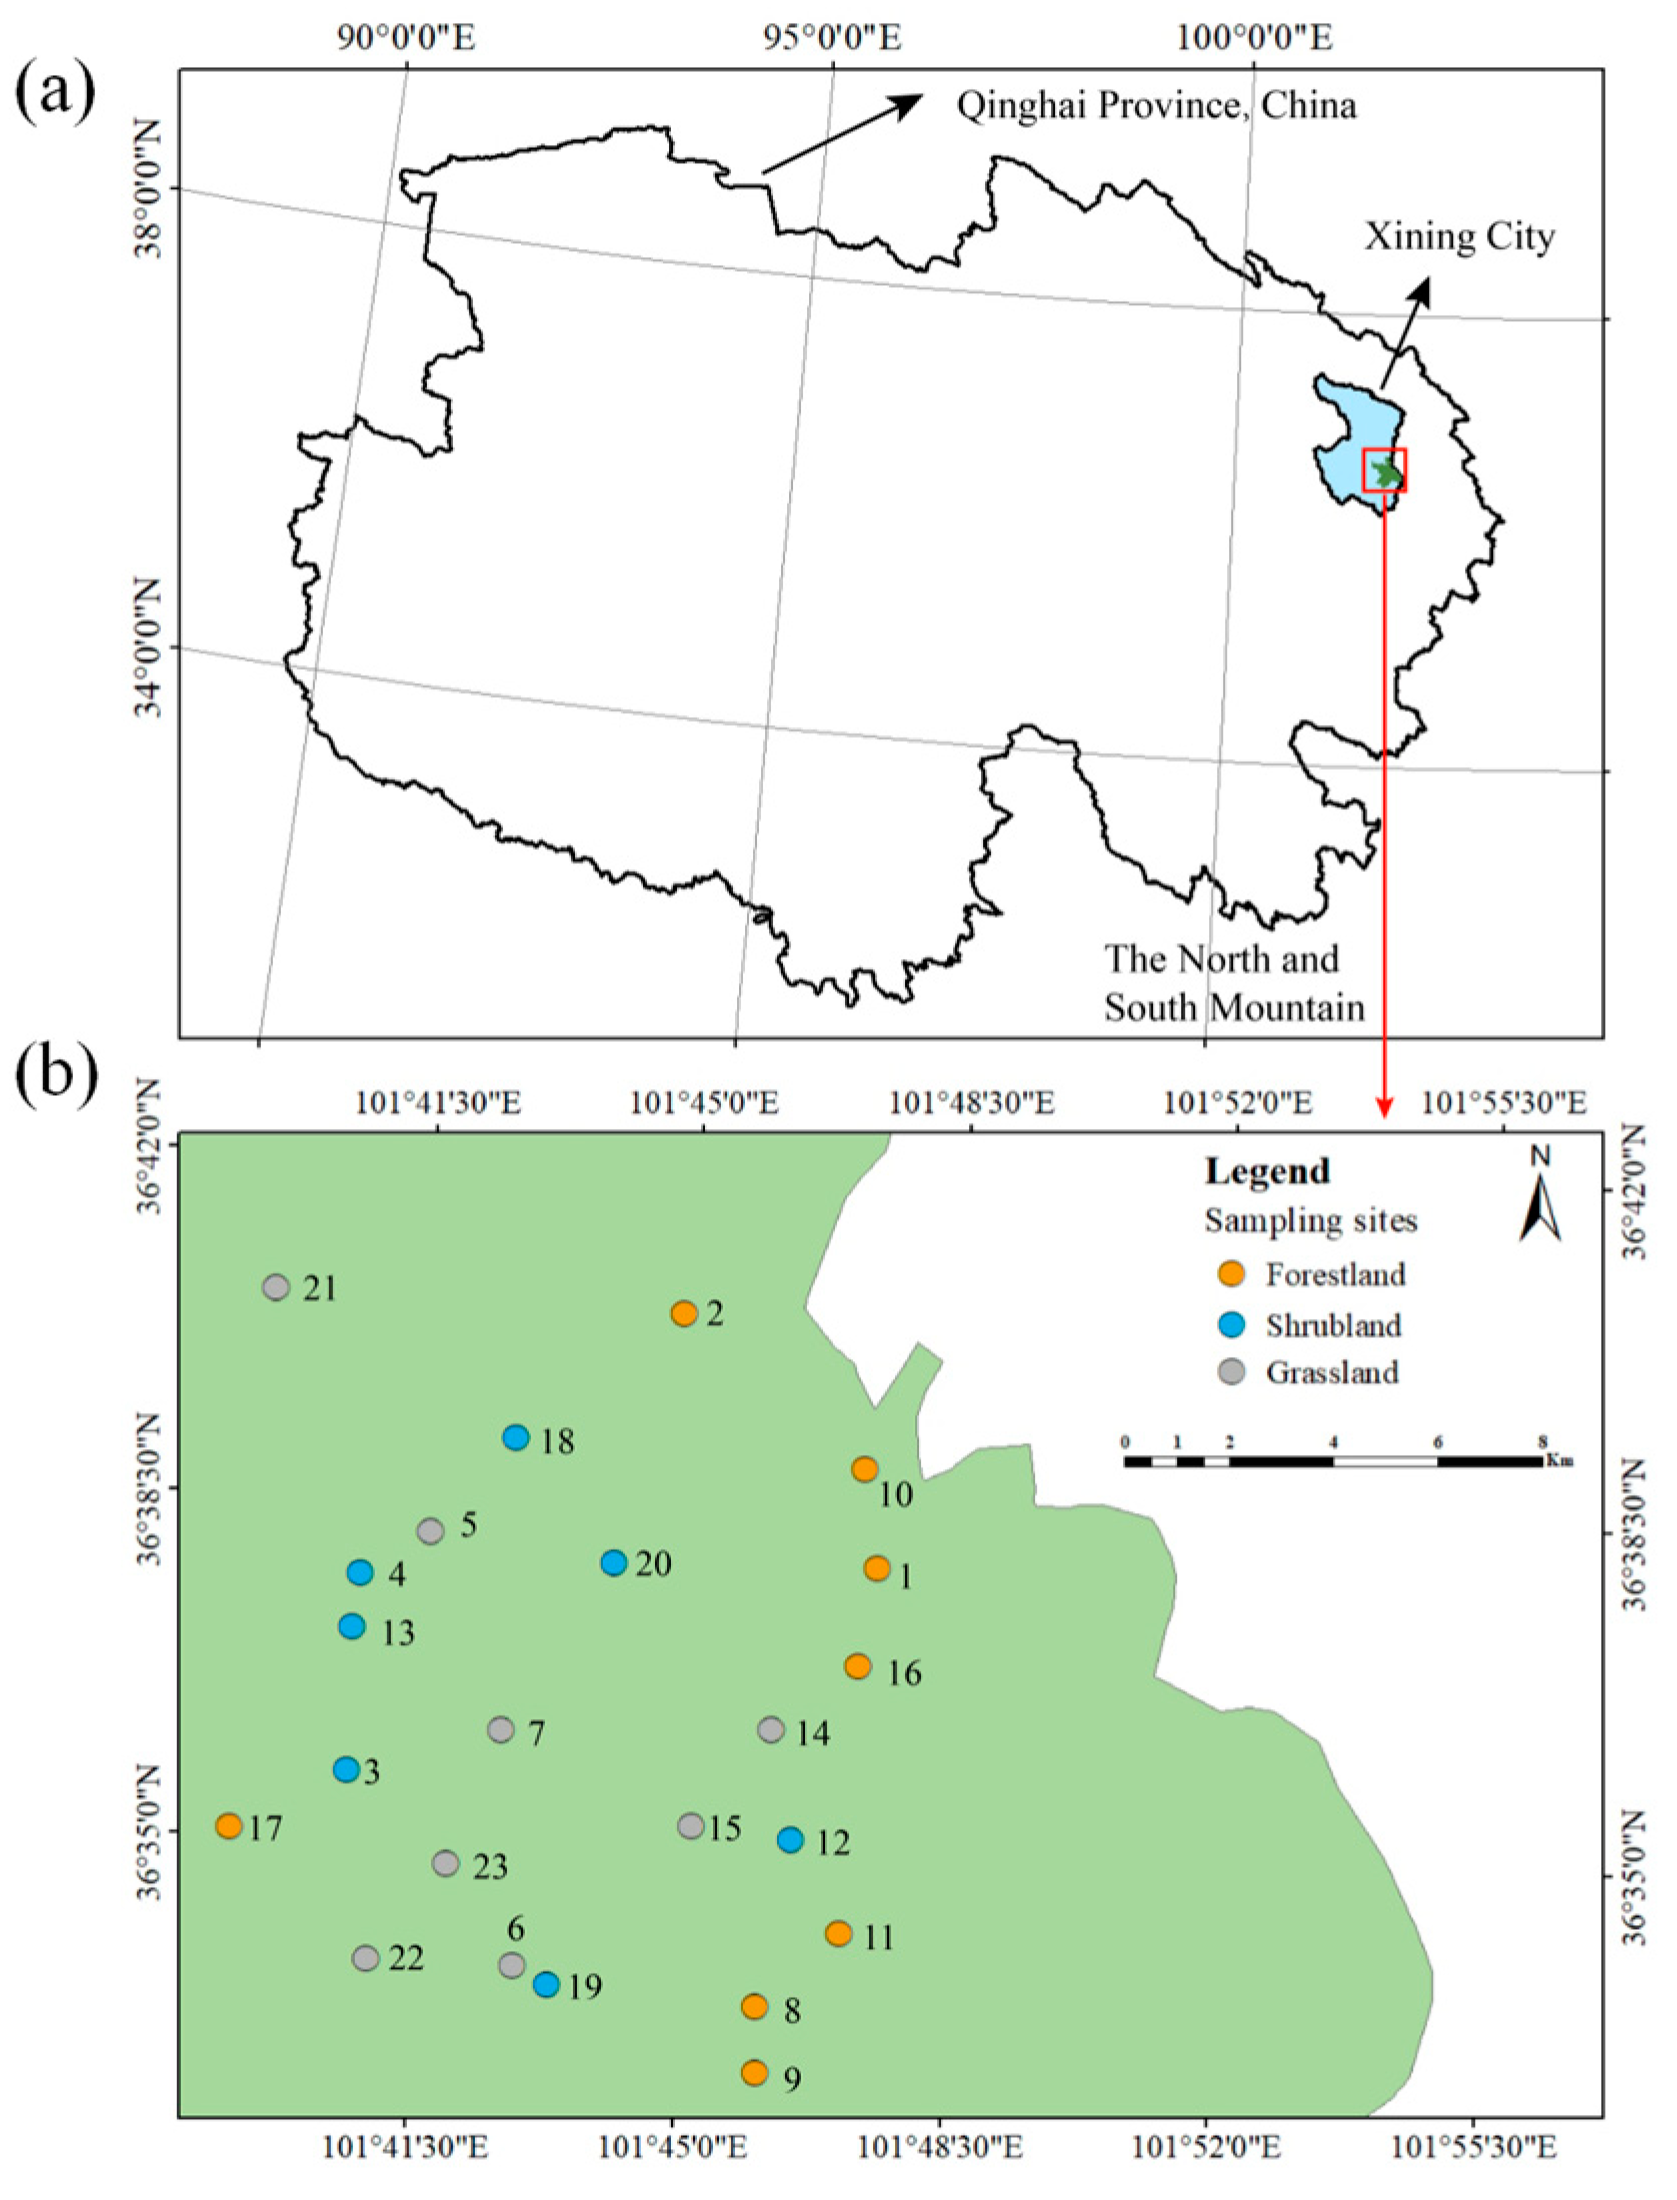
2.1. The Study Area

The study area is located in the northern and southern mountain regions of Xining City, Qinghai Province, China, with geographic coordinates of 101°49′46″ E and 36°36′38″ N. Xining city is situated in the northeastern region of the Qinghai–Tibet Plateau and serves as a key city for ecological conservation and restoration efforts in China’s high-altitude areas. Mountains and hills account for 70% of its territory. The elevation ranges from 2250 to 3100 m above sea level and is characterized by a hilly topography. The study area is characterized by a semi-arid highland continental climate [17]. The region experiences an annual mean temperature of 5.8 °C, with temperature extremes ranging from 41 °C to −26 °C, and an annual accumulated temperature of 2077.5 °C. The average annual precipitation is 368 mm, predominantly occurring between July and September. The region is characterized by high solar radiation and intense evaporation, with an average annual sunshine duration of 2600 h, and an annual potential evaporation of 1100 mm. The soil type in the region is classified as Mollisols, based on the classification system of the U.S. Department of Agriculture (Soil Survey Staff) [20], with pH values ranging from 8 to 9 and a moisture content of 6% to 10%. In winter, the maximum depth of the frozen soil layer reaches 1.34 m.
Afforestation initiatives in the northern and southern mountains of Xining commenced in the 1950s. Since 1989, large-scale afforestation were carried out in three phases, covering a total afforested area of 34,400 hectares. The primary afforestation tree species are Picea asperata Kom., Pinus tabuliformis Carr., and Populus hopeiensis Hu and Chow, while the main artificially planted shrubs include Caragana korshinskii Kom., Hippophae rhamnoides L., and Lycium chinense Mill [21]. After 30 years of afforestation, a relatively stable ecological function has been established with artificial mixed forests. The forest coverage increased from 7% in 1989 to 79% in which year, with a high afforestation survival rate of 86% [21]. The natural vegetation is predominantly grassland in the study area, characterized by a diverse array of plant species, with the most abundant belonging to the families Asteraceae, Poaceae, Leguminosae, and Rosaceae. The natural vegetation exhibits xerophytic, cold-tolerant, and drought-resistant characteristics. The native shrubs mainly include Potentilla fruticosa L. and Rosa multiflora Thunb. The herbaceous plants primarily consist of Agropyron cristatum L., Peganum harmala L., and Aster hispidus Thunb [21].

2.2. Vegetation Survey and Soil Sampling

Between July and October 2021, a series of field surveys and comprehensive sample collections were carried out in the study area. Sixteen sites (including Picea crassifolia pure forestland, Caragana korshinskii pure shrubland and grassland) were employed to assess the impacts of afforestation on soil ecological stoichiometric ratios [22]. To account for vegetation diversity, we subsequently incorporated three mixed-forest sites and four additional grassland plots within this managed landscape, resulting in a comprehensive total of 23 sampling sites spanning forestland, shrubland, and grassland ecosystems. In these plots, the afforestation durations encompassed 10, 25, and 40 years. These sites, sharing similar slope positions and elevation conditions, included forestlands, shrublands, and grasslands, effectively representing the characteristic vegetation landscapes of the region.
In accordance with standard ecological survey methods, three different sample plots were established at each sampling site [23]. A 20 m × 20 m plot was established to measure arborous vegetation parameters, a 10 m × 10 m plot for shrubby vegetation characteristics, and a 1 m × 1 m plot for grassland vegetation features. During vegetation community surveys, key parameters were measured to assess growth and productivity. For tree plots, height, crown width, diameter at breast height, and basal diameter were recorded. Understory vegetation data, including species types, counts, and coverage, were also collected to evaluate biodiversity and ecological structure.
After the establishment of the sample plots, soil samples were collected using a checkerboard sampling method [24]. Soil samples were collected in layers at depths of 0–20 cm, 20–40 cm, 40–60 cm, 60–80 cm, and 80–100 cm. Each sample was immediately sealed in a plastic bag to prevent contamination and minimize moisture loss. In the laboratory, the collected soil samples underwent a careful processing procedure. Initially, all visible impurities, including roots and gravel, were meticulously removed. Subsequently, the samples were placed in a well-ventilated indoor area and left to air dry for approximately 7 days. This natural air-drying process helps to preserve the original chemical properties of the soil while reducing the moisture content to a stable level. Once air-dried, the soil samples were finely ground using a 20 cm inner diameter agate mortar. The ground samples were then successively sieved through 2 mm and 0.149 mm screens. The soil particles passing through these different-sized screens were used for the analysis of various soil physical and chemical properties, such as soil texture, organic matter content, and nutrient composition.
The geographical location of the study area is clearly shown in Figure 1, providing a spatial reference for the research. The basic information of the 23 sample plots, including specific location, vegetation type, and relevant environmental factors, is presented in detail in Table S1. This table serves as a fundamental data source for the subsequent analyses, allowing for a more in-depth exploration of the ecological characteristics and relationships within the study area.

2.3. Determination of Soil Physical and Chemical Properties

Soil organic carbon (SOC) concentrations were determined using the Walkley–Black method, a modified acid–dichromate oxidation technique with FeSO4 titration [25]. Soil total nitrogen (STN) concentrations were quantified using the Kjeldahl method. Soil ammonium nitrogen (SAN) and nitrate nitrogen (SNN) were analyzed using a continuous flow analyzer (Auto Analyzer 3, SEAL, Stuttgart, Germany). Soil total phosphorus (STP) concentrations were determined colorimetrically using the molybdenum antimony reagent, while soil available phosphorus (SAP) was extracted and measured using the Olsen method [24]. Soil bulk density was determined by the ring cutting method [24]. Soil pH was measured at a 1:2.5 soil-to-water ratio [24]. The soil saturated water-holding capacity (SWC), capillary water-holding capacity (CWC) and field water-holding capacity (FWC) were determined by constant head method (LY/T1215-1999) [26] (state forestry).

2.4. Calculation of Carbon Stocks in Biomass and Soil and Diversity Indices

The total biomass (B) is the sum of biomass from the tree, shrub, and herb layers, calculated using diameter at breast height (DBH), plant height, and crown width measurements obtained from the survey plots. For the tree layer, biomass is estimated using the biomass equation for Picea asperata, as developed by Wang et al., 2000 [27]. The biomass of each tree is calculated by summing the biomass of its various organs. For the shrub layer, biomass is estimated using the relative growth equation developed by Guo et al., 2022 [28], based on the measurements of shrub height and crown width (long crown width × short crown width) for the dominant shrub species, Caragana korshinskii, within the sample plots. The aboveground and belowground biomass of the herb layer is obtained through full harvesting of typical sample plots.
The carbon stocks in biomass ( C b , Mg/ha) were obtained by multiplying biomass by the carbon content of the vegetation, as follows:
C b = B × C j
where B represents the biomass of the arbor/shrub layer or the grass layer (Mg/ha), and C j denotes the carbon content of the plant biomass (%). Since the carbon content of most plants and their components ranges from 45% to 50%, this study uses a value of 47.5% for carbon content [29].
Soil organic carbon stocks (Cs, Mg/ha) were obtained by summing the carbon stocks of each soil layer.
C s = i = 1 k C i × D i × E i × 1 G i 100
In the formula, i denotes a specific soil layer; Ci represents the organic carbon content of the i-th soil layer (%); Gi refers to the volumetric percentage of gravel with a diameter greater than 2 mm in the soil sample (%); Ei is the thickness of the i-th soil layer (cm); Di denotes the bulk density of the i-th soil layer (g·cm−3), 100 is a unit conversion factor.
The diversity indices were calculated as described below [30]:
Shannon - Wiener   index = i = 1 s p i ln p i
Simpson   index = 1 i = 1 s p i 2
Pielou   index = i = 1 s p i ln p i ln S
where S is the number of species, Pi represents the importance value of species, i, which was calculated according to formula ( H r + C r + D r 3 ). Where Hr is the relative height, Cr is the relative coverage (%), Dr is the relative frequency.

2.5. Statistical Analysis

The data were organized and processed using Microsoft Excel 2019. All statistical analyses were conducted using IBM SPSS Statistics 27 (SPSS, Inc., Chicago, IL, USA) or R (version 4.4.0). The Shapiro–Wilk test was applied to assess normality, while the Levene test was used to evaluate the homogeneity of variance. A two-way analysis of variance (ANOVA) was conducted to examine the effects of afforestation types, duration, and their interactions on carbon stocks, soil nutrients, and soil water-holding capacity, with significance set at p < 0.05. Tukey’s HSD test was subsequently applied to determine the statistical significance of these parameters at p < 0.05. Moreover, if afforestation type or duration exhibited significant effects, η2 was calculated to quantify the proportion of the total variance explained by each factor [31].
A random forest (RF) analysis was used to identify the main predictors of carbon stocks in biomass and soil. The increase in mean square error (MSE) of variables were computed to evaluate the relative importance of these predictors. The significance of each predictor for the response variables was evaluated using the “rfPermute” package in R.
The partial least squares path model (PLS-PM) was applied to explore the relationships among afforestation types (forest, shrub, and grass), duration (10a, 25a, and 40a), biomass (including the biomass of arbor-shrub layer, herbaceous layer, and total plant), understory herbs diversity (Shannon-Wiener index, Simpson index, and Pielou index), soil nutrients (STN, STP, SAN, SNN, and SAP), soil water-holding capacity (CWC, SWC, and FWC), and SOC stocks. In this model, afforestation types and duration were designated as exogenous variables, while biomass, understory herb diversity, soil nutrients, and soil water-holding capacity were defined as endogenous variables. PLS-PM was performed using the “plspm” package in R. The overall predictive performance of the models was evaluated using the goodness-of-fit (GoF) statistic.

3. Results

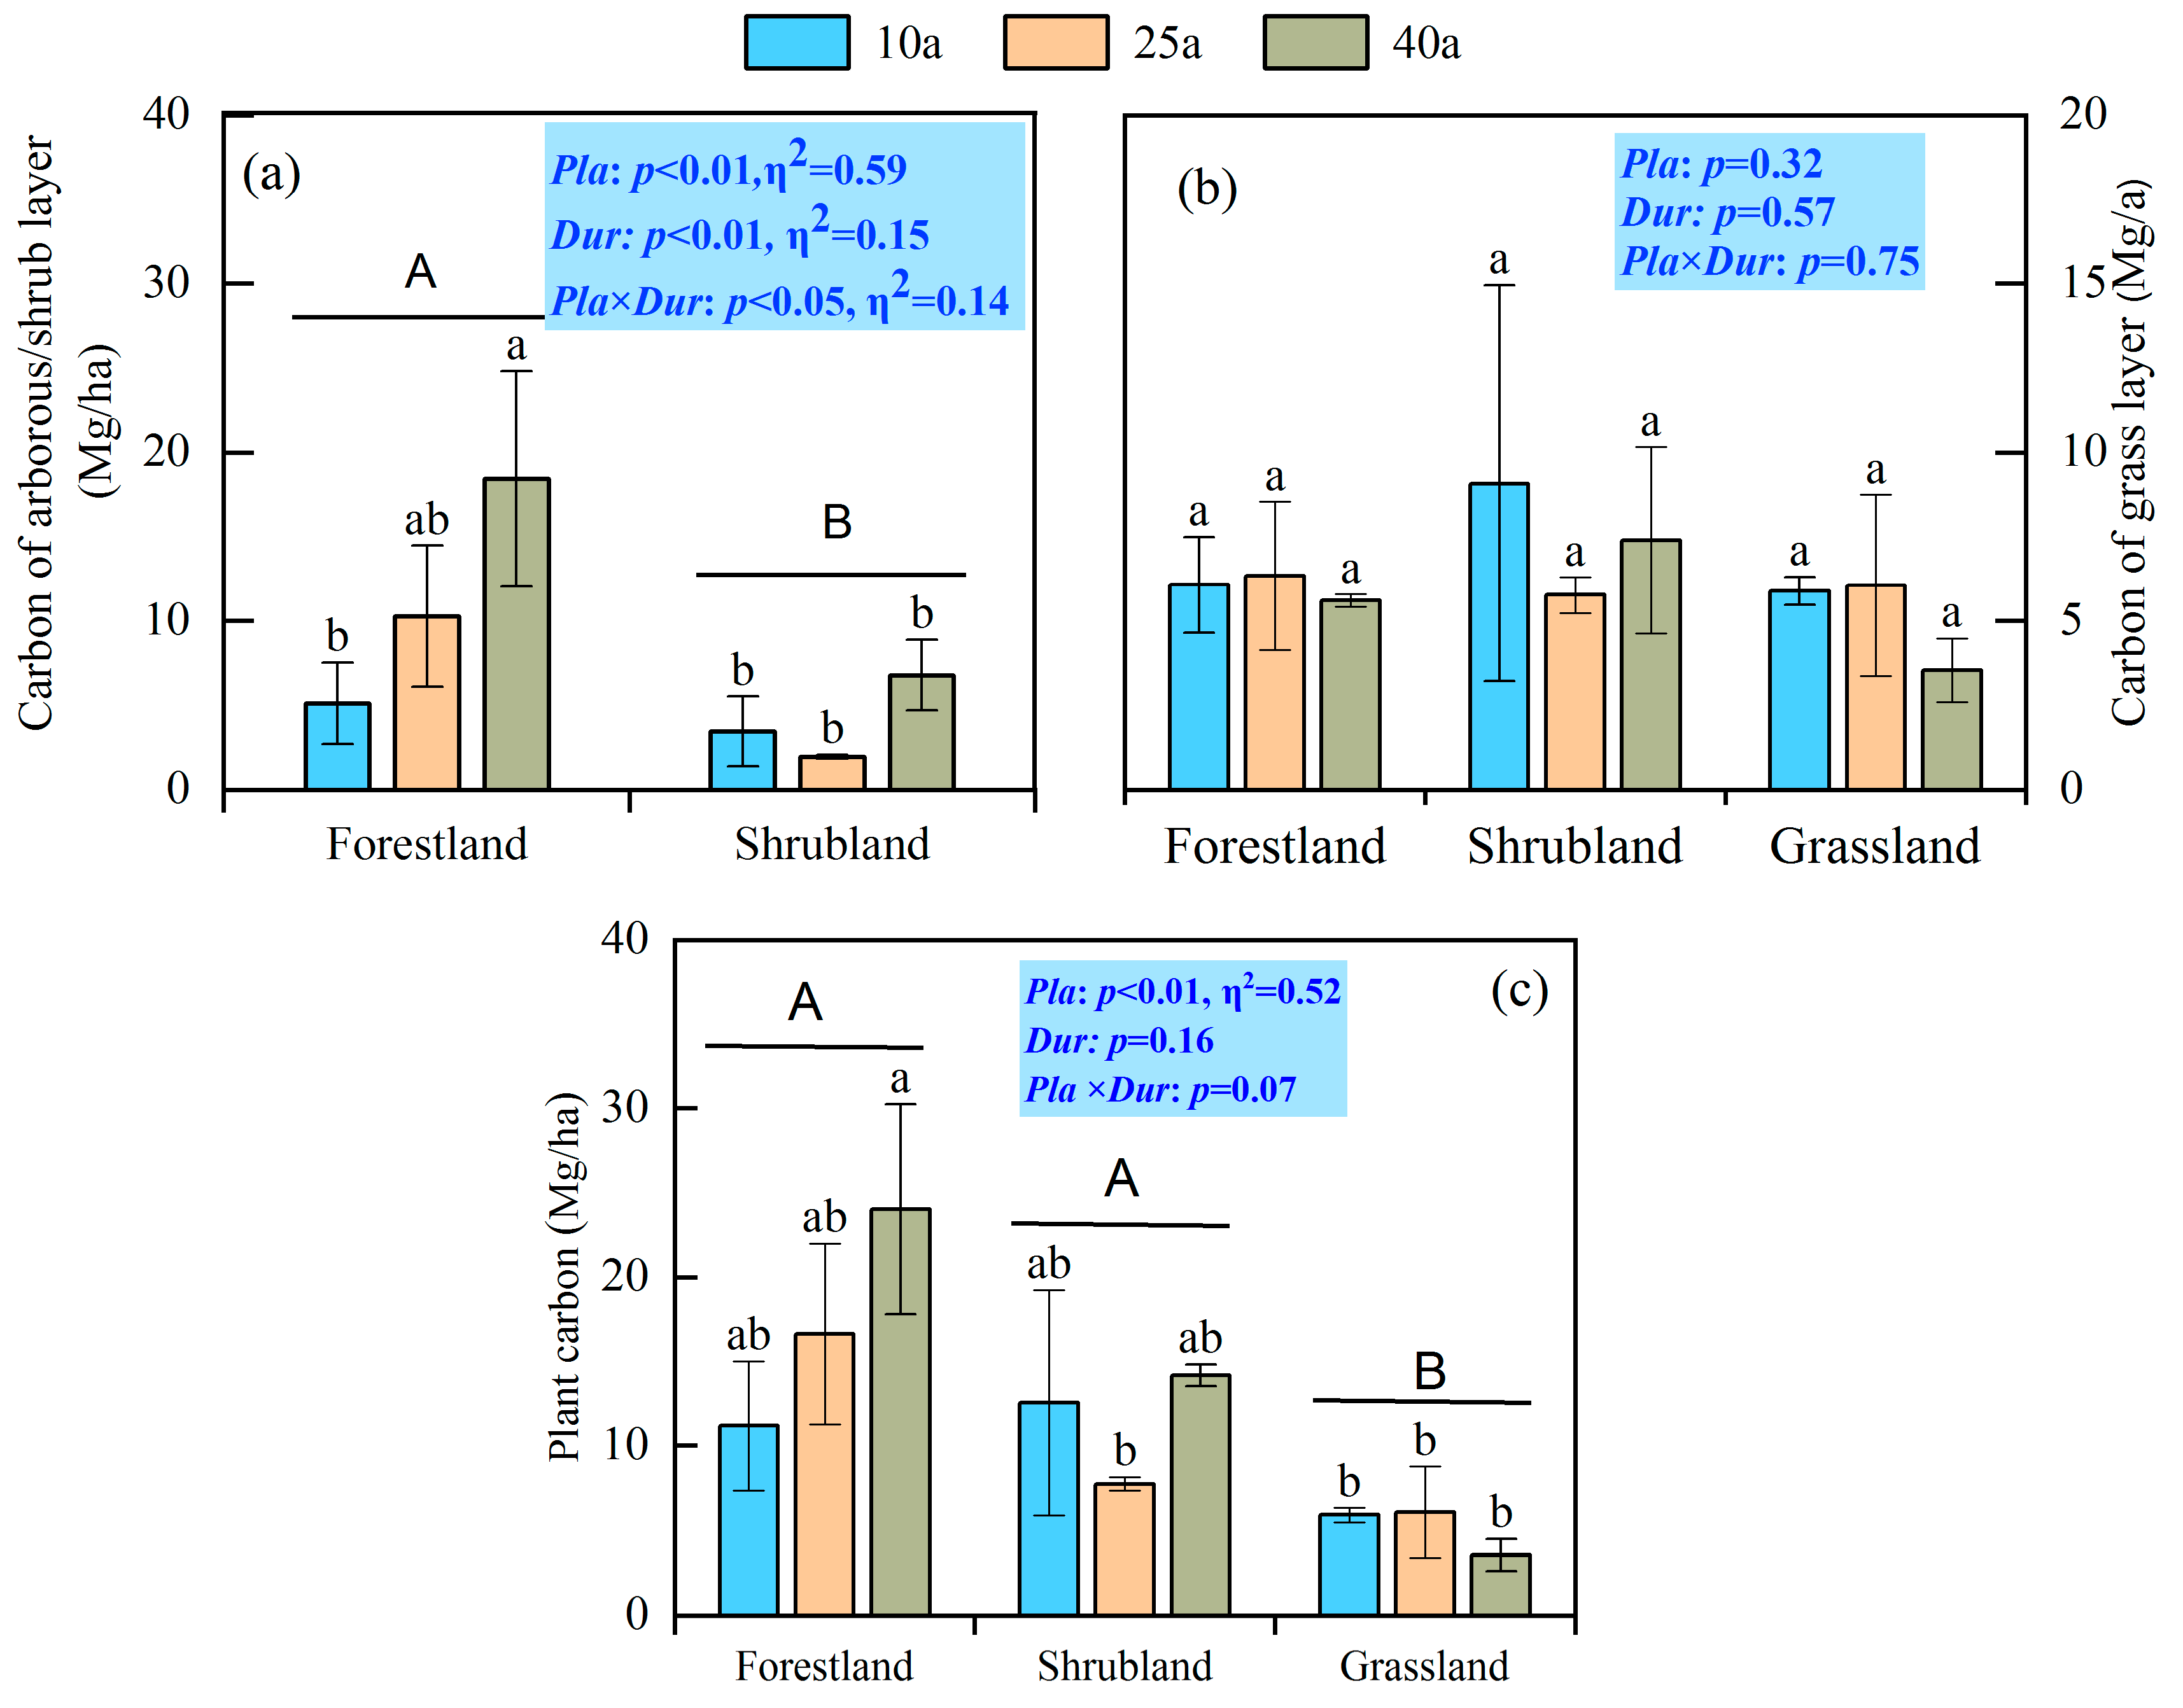
3.1. Carbon Stocks in Biomass and Soil

Both afforestation duration and afforestation methods had a significant impact on the carbon stocks in the arbor/shrub layer (Figure 2a). The carbon stocks in the arbor/shrub layer of forests were significantly higher than those of shrubs (p < 0.01). With the extension of the afforestation duration, the carbon stocks in the arbor/shrub layer of forests gradually increased, while those of shrubs remained basically unchanged. The carbon stocks in the arbor/shrub layer of 40-year-old forests were 3.6 times those of 10-year-old forests. The carbon stocks in the herb layer of the vegetation ranged from 3.5 to 9.1 Mg/ha, and neither the afforestation duration nor the afforestation types had a significant impact on it. The afforestation types had a significant impact on the total vegetation carbon stocks (Figure 2c). The total vegetation carbon stocks of forests and shrubs (7.7–24.0 Mg/ha) were 1.3~6.8 times those of grasslands (3.5–6.1 Mg/ha).
Both afforestation type and the afforestation duration had a significant impact on the organic carbon stocks in the 0–100 cm soil layer, and the contribution of the afforestation duration was greater. The SOC stocks in the 0–100 cm soil layer of forestland, shrubland, and grassland were 39.6–64.5, 40.7–100.2, and 43.1–121.9 Mg/ha, respectively. The SOC stocks in forestland showed no significant change with the extension of the afforestation duration. In shrubland, the SOC stocks in 25-year-old and 40-year-old forests were 2.4 times than those in 10-year-old shrubland, and the SOC stocks in 25-year-old grassland were approximately 2.6 times than those in 10-year-old and 40-year-old grasslands. Compared with grassland, this study found that only 40-year-old shrub afforestation could significantly increase the SOC stocks in the 0–100 cm soil layer. For the analysis of different soil layers, the afforestation types had a significant impact on the organic carbon stocks of all soil layers except the 40–60 cm soil layer (p < 0.05), and the afforestation duration had a highly significant impact on the organic carbon stocks in the 0–20 cm, 20–40 cm, and 60–80 cm soil layers (p < 0.01) (Figure 3). The SOC stocks in the 0–20 cm layer of forestland increased with the extension of the afforestation duration, while those of shrubland and grassland were the highest in 25-year-old forests (Figure 3a).

3.2. Carbon Stocks in Plant–Soil Continuum

The afforestation types did not have a significant impact on the carbon storage of the plant–soil continuum (p > 0.05), while the duration of afforestation had a highly significant effect (p < 0.01), and there was a clear interaction between the two factors (Figure 4a). Both arbor afforestation and shrub afforestation showed that the carbon storage of the plant–soil continuum in 40-year-old stands was 1.7 to 2.1 times that of 10-year-old stands, with no significant difference from the 25-year-old stands. The carbon storage of the plant–soil continuum in 25-year-old grasslands was 2.3 to 2.7 times that of 10-year-old and 40-year-old grasslands. Compared with grasslands, 40-year-old arbor and shrub afforestation could significantly enhance the carbon sequestration capacity of the plant–soil continuum by 1.9 and 2.5 times, respectively. Additionally, the soil carbon storage in forest, shrub, and grassland accounted for 73%–78%, 77%–93%, and 89%–95% of the total plant–soil continuum carbon storage, respectively (Figure 4b). The proportion of vegetation carbon storage in forestlands increased gradually with the progress of afforestation. Both shrublands and grasslands exhibited the lowest vegetation carbon storage proportion at 25 years, intermediate at 40 years, and the highest at 10 years. Interestingly, compared with grasslands, both 10-year-old and 25-year-old arbor and shrub afforestation increased biomass carbon but reduced soil carbon storage, indicating a trade-off between vegetation and soil carbon sequestration in this region during the early stages of afforestation. In contrast, 40-year-old arbor and shrub afforestation showed a synergistic increase in both plant biomass carbon and SOC (Figure 4c).

3.3. Effects of Afforestation Types and Duration on Soil Properties

Except for the 80–100 cm soil layer, afforestation types had no significant impact on STN, STP, SAP, SNN, and SAN (p > 0.05). In contrast, afforestation duration had significant effects on STN in the 0–20 cm and 80–100 cm soil layers, SAN in the 20–80 cm soil layers, and SNN in the 20–100 cm soil layers (p < 0.05) (Table S2). In forestlands, STN in the 0–60 cm soil layer increased gradually with the extension of afforestation duration, while no significant changes were observed in other soil layers. The STN in 40-year-old shrublands was significantly higher than that in 25-year-old and 10-year-old shrublands. The STN in 25-year-old grasslands was 1.7–2.1 times than that of 10-year-old grasslands and 2.5–3.8 times than that of 40-year-old grasslands (Table S3). In the 20–40 cm, 40–60 cm, and 80–100 cm soil layers, the SNN in 40-year-old shrublands was 1.6–2.1 times than that of 25-year-old shrublands, and 1.2–1.9 times that of 10-year-old shrublands.
Afforestation duration had a significant impact on the field capacity of soil layers other than the 20–40 cm layer (p < 0.05). Except for the 80–100 cm soil layer, neither afforestation types nor afforestation duration had significant effects on the saturated water-holding capacity and capillary water-holding capacity (p > 0.05). However, significant interactions between afforestation duration and types were observed for the saturated water-holding capacity and capillary water-holding capacity in the 0–20 cm, 20–40 cm, and 60–80 cm soil layers (p < 0.01) (Table S4).

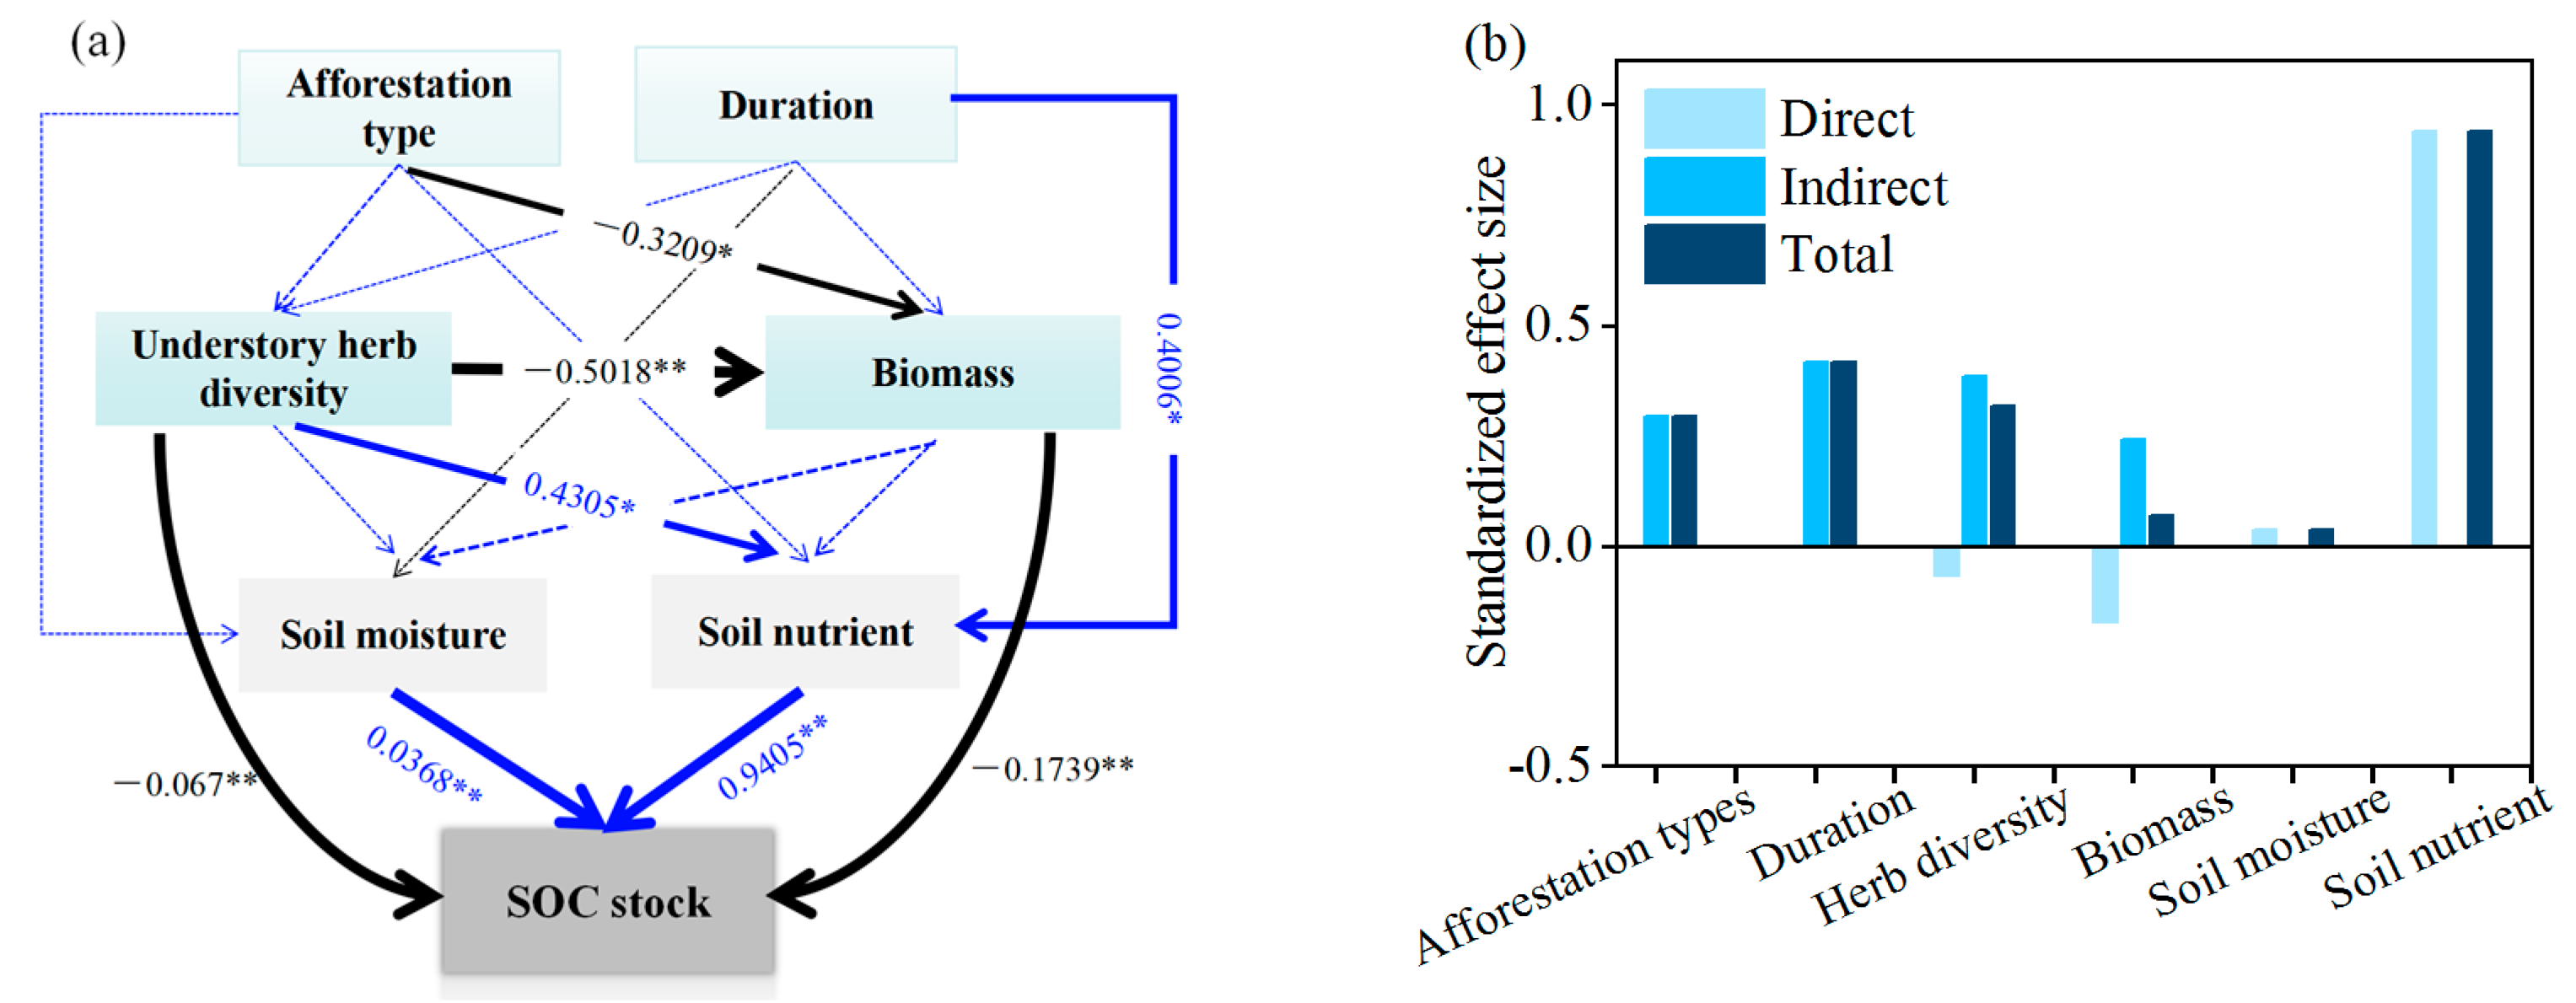
3.4. Factors Affecting the Carbon Sequestration in Plant and Soil

The results of the Random Forest analysis indicated that the primary determinant of biomass carbon was the diversity of understory herbaceous plants, while the key factors influencing soil carbon stocks were STN, SNN, and SAN. Further linear regression analyses revealed highly significant positive correlations between STN, SNN, SAN and SOC (p < 0.01) (Figure 5c–e). Additionally, the diversity of understory herbaceous plants exhibited a significant negative correlation with biomass carbon (p < 0.05) (Figure 5f,g).
The results of the PLS-PM analysis further demonstrated that soil nutrients and soil moisture had significant positive effects on SOC stocks in this forestry ecological project (p < 0.01) (Figure 6). Two distinct indirect pathways were identified: (1) afforestation types influenced the SOC stocks indirectly by affecting biomass (path coefficient = −0.3209, p < 0.01), which in turn affected the SOC stocks (path coefficient = −0.1739, p < 0.01); (2) afforestation duration influenced the SOC stocks indirectly by affecting soil nutrients (path coefficient = 0.4006, p < 0.05), which subsequently affected the SOC stocks (path coefficient = 0.9405, p < 0.01) (Figure 6a). Additionally, the results showed that understory herb diversity indirectly promoted SOC sequestration through its positive effects on biomass and soil nutrients (Figure 6).

4. Discussion

4.1. Divergent Responses of Biomass Carbon Stocks to Afforestation

Terrestrial vegetation serves as a vital carbon sink, sequestering atmospheric carbon dioxide (CO2) and converting it into organic matter through the process of photosynthesis. This biological mechanism plays a pivotal role in modulating atmospheric CO2 concentrations, thereby contributing significantly to the global carbon cycle and climate regulation [32]. Vegetation carbon in the Tibetan Plateau accounts for approximately 13% of China’s total terrestrial carbon, occupying a significant position in the carbon cycle [33]. Investigations by Cai et al. (2025) revealed that forest and shrub vegetation carbon in the Tibetan Plateau represent 78.5% and 9.7% of the total vegetation carbon, respectively [33]. In this forestry ecological project, the biomass carbon stocks of the trees were significantly lower than the national average (55.7 Mg/ha) [34] and the global average (94.2 Mg/ha) [35], while shrubs and grasslands exhibited higher values than the national average (8.9 Mg/ha and 4.8 Mg/ha, respectively). The lower biomass carbon stocks in tree stands in this study can be partly attributed to their relatively young age. Research by Tang et al. (2018) indicated that tree stands younger than 60 years had a biomass of 60 Mg/ha, which is far lower than that of stands older than 100 years (104.7 Mg/ha) [34]. This suggests that, considering the biomass–age effect, the potential for future biomass carbon sink development in this region is substantial. On the other hand, the limited precipitation in this area leads to intense competition for water among vegetation, resulting in slow tree growth. In contrast, shrubs, which consume less water than trees, tend to have a higher plant carbon content. Future efforts should focus on timely updating forest inventory data, refining estimation methods, and monitoring the current status and development trends of forest management. Additionally, it was observed in this study that afforestation types and stand age had no significant impact on herbaceous layer carbon. This finding is consistent with studies by Menezes et al. [36] in seasonally dry tropical forests in Brazil and Yue et al. [37] in the subalpine Tibetan Plateau. However, studies in other regions showed that herbaceous biomass increased with afforestation time in the Loess Plateau [38], but decreased during vegetation succession in northeastern Brazil [39]. The factors influencing the biomass of the herbaceous layer due to afforestation are highly complex. Afforestation species, planting density, and site conditions can all significantly affect herbaceous layer biomass [38]. In summary, the biomass carbon sink potential induced by afforestation in this region remains considerable.

4.2. Divergent Responses of SOC Stocks to Afforestation

In this study, the average soil organic carbon (SOC) stocks in the 0–100 cm soil layer for forestland, shrubland, and grassland were 68.4 Mg/ha, 64.3 Mg/ha, and 58.2 Mg/ha, respectively. The SOC stocks in forested areas were significantly lower than the national average of 126.0 Mg/ha [34], while those in shrublands and grasslands were comparable to the national averages of 60.2 Mg/ha and 58.4 Mg/ha [34], respectively. Additionally, we observed that changes in soil carbon storage varied with different afforestation types. SOC stocks in shrublands exhibited an increasing trend, whereas afforestation duration had no significant impact on SOC stocks in forests. In contrast, SOC stocks in grasslands were higher at 25 years than at 10 and 40 years. The findings for shrublands align with our first hypothesis and are consistent with the results of Deng et al. (2013) [38], who reported that as afforestation time increased, the continuous input of roots and litter from plants into the soil enhanced soil carbon density. In this study, organic carbon in the 0–20 cm soil layer of forests increased with stand age (10, 25, and 40 years), while no significant changes were observed in the 0–100 cm soil layer. This finding is not entirely consistent with previous studies [40,41,42,43]. For example, Cao et al. (2019) [43] reported changes in SOC stocks in the 0–60 cm soil layer of spruce forests in the northeastern part of the Tibetan Plateau over a stand age range of 29 to 46 years. For grasslands, vegetation growth was favorable during the initial recovery phase, with substantial root inputs. However, in the later stages, grasslands entered a decline phase, with partial vegetation mortality. This phenomenon of grassland degradation has also been observed in other empirical studies [44,45,46,47,48]. This may be attributed to the region’s high-altitude arid conditions and infertile soils, which result in a short growing season for herbaceous plants and limited supply capacities for water, temperature, and nutrients, thereby restricting the increase in herbaceous biomass [39]. Additionally, the limited herbaceous diversity in this region, predominantly composed of annual plants, constrains biomass variations. The differential responses of SOC to afforestation types and durations imply that the soil carbon sequestration effects of vegetation restoration are long-term and influenced by the life cycles of aboveground vegetation.
In this study, carbon stocks in plant biomass and soil accounted for 7%–27% and 73%–93%, respectively. This indicates that soil has a strong carbon sink capacity in this region. This finding contrasts with the results of the study by Hong et al. on afforestation in northern China, where 74% of carbon was stored in biomass and 26% in SOC [3]. This discrepancy may be due to the study area’s high-altitude arid conditions, which limit the growth of trees and shrubs due to soil moisture and temperature constraints, resulting in a lower proportion of system carbon in biomass and a larger proportion in the soil carbon pool. Interestingly, our study found that afforestation of trees and shrubs over 10 and 25 years increased plant biomass carbon but decreased soil carbon stocks, indicating a trade-off between vegetation and soil carbon sequestration in this region over these durations. In contrast, afforestation for 40 years resulted in a synergistic increase in both plant biomass and soil organic carbon. This finding is not entirely consistent with our hypothesis (1), suggesting that soil acts as a carbon source in 15- and 25-year afforestation, similar to the results of Li et al. (2015) [49] in the Loess Plateau of China. However, after 40 years of afforestation, soil transitions from a carbon source to a carbon sink. The results of the partial least squares analysis also corroborate this, indicating that afforestation-induced changes in biomass carbon have two pathways affecting SOC: a direct negative effect and an indirect positive effect. This reflects that the increase in biomass carbon at 10 and 25 years led to a reduction in soil nutrients, as plants required substantial nutrients for maintenance. In contrast, at 40 years, biomass return exceeded nutrient (especially nitrogen) uptake (as shown in Table S3). Hong et al. (2023) [3] also reported, through extensive paired surveys, that biomass carbon and SOC do not always act together in northern China’s afforestation projects. These results highlight the need for caution when utilizing earth system models, which often assume a strong SOC response to increased carbon input (i.e., net primary productivity, NPP) [50]. In summary, in the high-altitude arid regions of the Tibetan Plateau, vegetation restoration primarily sequesters carbon in the soil. From a cost–benefit analysis of carbon sequestration in this region, shrub afforestation is a preferable option compared to tree afforestation.

4.3. Regulation of Afforestation Types and Duration on Carbon Stocks

The dynamic equilibrium processes of soil carbon input and output are influenced by numerous factors, including vegetation type, recovery time, soil physicochemical properties, organic carbon components, microbial communities, and climatic factors [51]. The mechanisms by which plants, soil, and microbes influence soil carbon sequestration dynamics vary significantly. This study emphasizes the impact of soil nutrients and moisture on soil carbon sequestration in afforestation projects. Both soil nutrient availability and moisture retention capacity can have highly significant positive effects on the sequestration of SOC. The positive impact of soil moisture retention capacity on soil organic carbon density is consistent with previous findings [52]. Previous studies have shown that soil with a high humidity holds more SOC by influencing microbial metabolic entropy and organo–metallic mineral interaction [53,54]. Additionally, the results of this study highlight the positive effect of increased nitrogen and nitrogen availability on SOC sequestration in afforestation (Figure 5 and Figure 6). This is in line with the findings of most studies [55,56,57]. The promotion of soil carbon sequestration by nitrogen and nitrogen availability is mainly due to the fact that higher nitrogen and nitrogen availability can, on the one hand, reduce soil priming effects by altering microbial composition and function [58], thereby decreasing carbon output, and on the other hand, enhance plant root biomass, increasing carbon input. Isotopic tracing studies have also shown that increased nitrogen availability can enhance the incorporation of fungal necromass carbon into SOC stocks [59]. Recent studies have also shown that nitrogen can promote the accumulation of plant-derived carbon [60]. The complex mechanisms by which nitrogen and nitrogen availability promote SOC sequestration require further in-depth research.
Therefore, in the early stages of afforestation, supplementing soil nutrients, especially nitrogen, can promote soil carbon sequestration and stabilization, thereby reducing the loss of SOC that may occur during the initial phase of afforestation.

5. Conclusions

This study conducted an in-depth investigation into the forestry ecological projects in key ecological cities on the Tibetan Plateau, focusing on the sequestration characteristics of both plant biomass and soil carbon, as well as the coupling relationships between the carbon pools, soil nutrients, and moisture. Both tree and shrub plantations significantly enhanced biomass carbon sequestration, primarily in the tree and shrub layers. Only 40-year-old shrub plantations significantly increased soil organic carbon. In contrast, 10- and 25-year-old tree and shrub plantations exhibited a trade-off between soil and biomass carbon sequestration, while 40-year-old plantations achieved coordinated increases in both. Soil moisture and nutrients, particularly nitrogen and available nitrogen, played significant roles in promoting SOC sequestration. From the perspective of carbon sink functionality, shrub plantations were found to be more beneficial in this region. We recommend scientifically quantified nitrogen supplementation for afforestation sites in the early stages (<25 years) to mitigate the potential losses of soil carbon stocks. Our findings offer novel insights into the carbon sink potential of forestry ecological projects on the Tibetan Plateau.

Supplementary Materials

The following supporting information can be downloaded at: https://www.mdpi.com/article/10.3390/f16040631/s1, Table S1: The characteristics of vegetation. Table S2: The source of variance and multiple comparisons of soil nutrient characteristics. Table S3: Soil nutrient characteristics. Table S4: The source of variance and multiple comparisons of soil water-holding capacity. Table S5: Soil moisture characteristics.

Author Contributions

Conceptualization, M.C. and X.W.; methodology, Y.X.; software, X.X.; validation, X.X., Z.C. and Y.W.; formal analysis, X.W.; investigation, M.C.; resources, M.C.; data curation, M.C. and X.X.; writing—original draft preparation, M.C.; writing—review and editing, X.W. and Y.W.; visualization, M.C.; supervision, M.C.; project administration, M.C.; funding acquisition, X.W. and Y.W. All authors have read and agreed to the published version of the manuscript.

Funding

This research was financially supported by the National Key Research and Development Program of China (grant number 2022YFF0801803), Fundamental Research Program of Shanxi Province (grant number 202203021211317, 202303021211011, 202403021221094), Research Project Supported by Shanxi Scholarship Council of China (grant number 2023-020), and National Natural Science of China (grant number U24A20641).

Data Availability Statement

All data generated during the study can be found in Supplementary Materials.

Conflicts of Interest

The authors declare no conflicts of interest.

References

  1. Schmidt, M.W.I.; Torn, M.S.; Abiven, S.; Dittmar, T.; Guggenberger, G.; Janssens, I.A.; Kleber, M.; Kögel-Knabner, I.; Lehmann, J.; Manning, D.A.C.; et al. Persistence of soil organic matter as an ecosystem property. Nature 2011, 478, 49–56. [Google Scholar] [CrossRef]
  2. Lal, R. Forest soils and carbon sequestration. Forest Ecol. Manag. 2005, 220, 242–258. [Google Scholar] [CrossRef]
  3. Hong, S.; Ding, J.; Kan, F.; Xu, H.; Chen, S.; Yao, Y.; Piao, S. Asymmetry of carbon sequestrations by plant and soil after forestation regulated by soil nitrogen. Nat. Commun. 2023, 14, 3196. [Google Scholar] [CrossRef] [PubMed]
  4. Bastin, J.F.; Finegold, Y.; Garcia, C.; Mollicone, D.; Marcelo, R.; Routh, D.; Zohner, C.M.; Crowther, T.W. The global tree restoration potential. Science 2019, 365, 76–79. [Google Scholar] [CrossRef]
  5. He, B.; Miao, L.; Cui, X.; Wu, Z. Carbon sequestration from China’s afforestation projects. Environ. Earth Sci. 2015, 74, 5491–5499. [Google Scholar] [CrossRef]
  6. Nave, L.E.; Walters, B.F.; Hofmeister, K.L.; Perry, C.H.; Mishra, U.; Domke, G.M.; Swanston, C.W. The role of reforestation in carbon sequestration. New Forest. 2018, 50, 115–137. [Google Scholar] [CrossRef]
  7. Harden, J.W.; Hugelius, G.; Ahlstrom, A.; Blankinship, J.C.; Bond-Lamberty, B.; Lawrence, C.R.; Loisel, J.; Malhotra, A.; Jackson, R.B.; Ogle, S.; et al. Networking our science to characterize the state, vulnerabilities, and management opportunities of soil organic matter. Glob. Change Biol. 2018, 24, e705–e718. [Google Scholar] [CrossRef] [PubMed]
  8. Li, D.; Niu, S.; Luo, Y. Global patterns of the dynamics of soil carbon and nitrogen stocks following afforestation: A meta-analysis. New Phytol. 2012, 195, 172–181. [Google Scholar] [CrossRef]
  9. Crowther, T.W.; Todd-Brown, K.E.; Rowe, C.W.; Wieder, W.R.; Carey, J.C.; Machmuller, M.B.; Snoek, B.L.; Fang, S.; Zhou, G.; Allison, S.D.; et al. Quantifying global soil carbon losses in response to warming. Nature 2016, 540, 104–108. [Google Scholar] [CrossRef]
  10. Hong, S.; Yin, G.; Piao, S.; Dybzinski, R.; Cong, N.; Li, X.; Wang, K.; Peñuelas, J.; Zeng, H.; Chen, A. Divergent responses of soil organic carbon to afforestation. Nat. Sustain. 2020, 3, 694–700. [Google Scholar] [CrossRef]
  11. Cortijos-Lόpez, M.; Sánchez-Navarrete, P.; Lasanta, T.; Cammeraat, E.L.H. Afforestation, natural secondary forest or dehesas? looking for the best post-abandonment forest management for soil organic carbon accumulation in mediterranean mountains. Forests 2024, 15, 166. [Google Scholar] [CrossRef]
  12. Schneider, M.V.; Oberholzer, S.; Speranza, C.I. Revegetation is key for soil organic carbon sequestation on abandoned and degraded land in northern Spain. Geoderma Reg. 2024, 38, e00835. [Google Scholar] [CrossRef]
  13. Paul, K.I.; Polglase, P.J.; Nyakuengama, J.G.; Khanna, P.K. Change in soil carbon following afforestation. Forest Ecol. Manag. 2002, 168, 241–257. [Google Scholar] [CrossRef]
  14. Laganiere, J.; Angers, D.A.; Pare, D. Carbon accumulation in agricultural soils after afforestation: A meta-analysis. Glob. Change Biol. 2010, 16, 439–453. [Google Scholar] [CrossRef]
  15. Gundale, M.J.; DeLuca, T.H.; Fiedler, C.E.; Ramsey, P.W.; Harrington, M.G.; Gannon, J.E. Restoration treatments in a Montana ponderosa pine forest: Effects on soil physical, chemical and biological properties. Forest Ecol. Manag. 2005, 213, 25–38. [Google Scholar] [CrossRef]
  16. Don, A.; Schumacher, J.; Freibauer, A. Impact of tropical land-use change on soil organic carbon stocks—A meta-analysis. Glob. Change Biol. 2011, 17, 1658–1670. [Google Scholar] [CrossRef]
  17. Wang, T.; Piao, S. Estimate of terrestrial carbon balance over the Tibetan Plateau: Progresses, challenges and perspectives. Quat. Sci. 2023, 43, 313–323. [Google Scholar] [CrossRef]
  18. Liu, X.; Ding, J.; Zhao, W. Divergent responses of ecosystem services to afforestation and grassland restoration in the Tibetan Plateau. J. Environ. Manag. 2023, 344, 118471. [Google Scholar] [CrossRef]
  19. Luo, R.; Fan, J.; Wang, W.; Luo, J.; Kuzyakov, Y.; He, J.S.; Chu, H.; Ding, W. Nitrogen and phosphorus enrichment accelerates soil organic carbon loss in alpine grassland on the Qinghai-Tibetan Plateau. Sci. Total Environ. 2019, 650, 303–312. [Google Scholar] [CrossRef]
  20. Soil Survey Staff. Keys to Soil Taxonomy, 13th ed.; USDA-Natural Resources Conservation Service: Washington, DC, USA, 2022. [Google Scholar]
  21. Li, X.L. Implementation Study of the Master Plan for the Third Phase of the North-South Mountains Afforestation Project in Xining (2015–2020). Mod. Agric. Sci. Technol. 2021, 2, 132–135. [Google Scholar] [CrossRef]
  22. Chen, Z.X.; Xu, X.; Wen, Y.L.; Cheng, M.; Wang, X. The critial roles of soil ecological stoichiometric ratios: How does reforestation improve soil nitrogen and phosphorus availabiliy? Plants 2024, 13, 2320. [Google Scholar] [CrossRef]
  23. Fang, J.Y.; Wang, X.P.; Shen, Z.B.; Tang, Z.Y.; He, J.S.; Yu, D.; Jiang, Y.; Wang, Z.H.; Zheng, C.Y.; Zhu, J.L.; et al. Methods and protocols for plant community inventory. Biodivers. Sci. 2009, 17, 533–548. [Google Scholar] [CrossRef]
  24. Bao, S.D. Soil and Agricultural Chemistry Analysis, 3rd ed.; China Agriculture Press: Beijing, China, 2008; ISBN 9787109066441. [Google Scholar]
  25. Walkley, A.; Black, I.A. An Examination of the Degtjareff Method for Determining Soil Organic Matter, and a Proposed Modification of the Chromic Acid Titration Method. Soil Sci. 1934, 37, 29–38. [Google Scholar]
  26. LY/T1215-1999; Forest Soil Moisture-Determination of Physical Properties. State Forestry Administration of People’s Republic of China: Beijing, China, 1999.
  27. Wang, J.; Che, K.; Jiang, Z. A Study on Carbon Balance of Picea crassifolia in Qilian Mountains. J. Northwest For. Univ. 2000, 15, 9–14. [Google Scholar] [CrossRef]
  28. Guo, Y.; Zhang, Q.; Chen, X.; Zhang, R.; Chanlumen, B.; Bayaer, A.; Bilige, S.; Wang, Y. Establishment of biomass models for artificial shrubbery in the Kubuqi desert area. J. Northwest A&F Univ (Nat. Sci. Ed.) 2022, 50, 74–82. [Google Scholar] [CrossRef]
  29. Wang, X.K.; Liu, W.W.; Lu, F. 166 Questions & Answers Carbon Sequestration in Terrestrial Ecosystems; Science Press: Beijing, China, 2015; ISBN 9787030439208. [Google Scholar]
  30. Song, Y.C. Vegetation Ecology; East China Normal University Press: Shanghai, China, 2001; ISBN 9787561726402. [Google Scholar]
  31. Meng, X.T.; Zhang, X.C.; Li, Y.N.; Jiao, Y.P.; Fan, L.C.; Jiang, Y.J.; Qu, C.Y.; Filimonenko, E.; Jiang, Y.H.; Tian, X.H.; et al. Nitrogen fertilizer builds soil organic carbon under straw return mainly via microbial necromass formation. Soil Biol. Biochem. 2024, 188, 109223. [Google Scholar] [CrossRef]
  32. Skrzypczak, D.; Gorazda, K.; Mikula, K.; Mironiuk, M.; Kominko, H.; Sawska, K.; Evrard, D.; Trzaska, K.; Moustakas, K.; Chojnacka, K. Towards carbon neutrality: Enhancing CO2 sequestration by plants to reduce carbon footprint. Sci. Total Environ. 2025, 966, 178763. [Google Scholar] [CrossRef] [PubMed]
  33. Cai, W.; Xu, L.; Wen, D.; Zhou, Z.; Li, M.; Wang, T.; He, N. The carbon sequestration potential of vegetation over the Tibetan Plateau. Renew. Sust. Energ. Rev. 2025, 207, 114937. [Google Scholar] [CrossRef]
  34. Tang, X.; Zhao, X.; Bai, Y.; Tang, Z.; Wang, W.; Zhao, Y.; Wan, H.; Xie, Z.; Shi, X.; Wu, B.; et al. Carbon pools in China’s terrestrial ecosystems: New estimates based on an intensive field survey. Proc. Natl. Acad. Sci. USA 2018, 115, 4021–4026. [Google Scholar] [CrossRef]
  35. Pan, Y.; Birdsey, R.A.; Phillips, O.L.; Jackson, R.B. The Structure, Distribution, and Biomass of the World’s Forests. Annu. Rev. Ecol. Evol. Syst. 2013, 44, 593–622. [Google Scholar] [CrossRef]
  36. Menezes, R.S.C.; Sales, A.T.; Primo, D.C.; Albuquerque, E.R.G.M.d.; Jesus, K.N.d.; Pareyn, F.G.C.; Santana, M.d.S.; Santos, U.J.d.; Martins, J.C.R.; Althoff, T.D.; et al. Soil and vegetation carbon stocks after land-use changes in a seasonally dry tropical forest. Geoderma 2021, 390, 114943. [Google Scholar] [CrossRef]
  37. Yue, J.; Guan, J.; Deng, L.; Zhang, J.; Li, G.; Du, S. Dynamics and allocation patterns of carbon and nitrogen storage in Picea asperata plantations in subalpine areas of Gansu Province. Acta Ecol. Sin. 2018, 38, 7790–7800. [Google Scholar]
  38. Deng, L.; Wang, K.B.; Chen, M.L.; Shangguan, Z.P.; Sweeney, S. Soil organic carbon storage capacity positively related to forest succession on the Loess Plateau, China. Catena 2013, 110, 1–7. [Google Scholar] [CrossRef]
  39. Moura, P.M.; Althoff, T.D.; Oliveira, R.A.; Souto, J.S.; Souto, P.C.; Menezes, R.S.C.; Sampaio, E.V.S.B. Carbon and nutrient fluxes through litterfall at four succession stages of Caatinga dry forest in Northeastern Brazil. Nutr. Cycl. Agroecosyst. 2016, 105, 25–38. [Google Scholar] [CrossRef]
  40. Lee, Y.J.; Lee, M.K.; Lee, C.B. Combined effects of environmental conditions and stand age–induced tree size variation on temperate forest carbon pools among stand types in South Korea. Forest Ecol. Manag. 2025, 581, 122553. [Google Scholar] [CrossRef]
  41. Lee, Y.J.; Lee, H.I.; Lee, C.B.; Lee, K.H.; Kim, R.H.; Ali, A. Abiotic and stand age-induced changes in tree diversity and size inequality regulate aboveground biomass and soil organic carbon stock in temperate forests of South Korea. Catena 2024, 237, 107827. [Google Scholar] [CrossRef]
  42. Ismail, M.; Roy, S.K.; Dey, T.; Basak, J.K.; Chowdhury, M.A.A.; Ullah, F.; Ahmed, S. Carbon sequestration potential of Sonneratia apetala plantation forests in the Chakaria Sundarbans: Effects of stand age and structure. Reg. Stud. Mar. Sci. 2025, 84, 104104. [Google Scholar] [CrossRef]
  43. Cao, J.; Gong, Y.; Adamowski, J.F.; Deo, R.C.; Zhu, G.; Dong, X.; Zhang, X.; Liu, H.; Xin, C. Effects of stand age on carbon storage in dragon spruce forest ecosystems in the upper reaches of the Bailongjiang River basin, China. Sci. Rep. 2019, 9, 3005. [Google Scholar] [CrossRef]
  44. Wang, T.; Wang, X.; Liu, D.; Lv, G.; Ren, S.; Ding, J.; Chen, B.; Qu, J.; Wang, Y.; Piao, S.; et al. The current and future of terrestrial carbon balance over the Tibetan Plateau. Sci. China Earth Sci. 2023, 66, 1493–1503. [Google Scholar] [CrossRef]
  45. Lewińska, K.E.; Hostert, P.; Buchner, J.; Bleyhl, B.; Radeloff, V.C. Short-term vegetation loss versus decadal degradation of grasslands in the Caucasus based on Cumulative Endmember Fractions. Remote Sens. Environ. 2020, 248, 111969. [Google Scholar] [CrossRef]
  46. Andrade, B.O.; Koch, C.; Boldrini, I.I.; Vélez-Martin, E.; Hasenack, H.; Hermann, J.M.; Kollmann, J.; Pillar, V.D.; Overbeck, G.E. Grassland degradation and restoration: A conceptual framework of stages and thresholds illustrated by southern Brazilian grasslands. Nat. Conserv. 2015, 13, 95–104. [Google Scholar] [CrossRef]
  47. Dlamini, L.X.; Lévêque, J.; Thevenot, M.; Feig, G.T.; Mathieu, O.; Kotzé, E. Afforestation and wildfire-induced grassland degradation: Impact on soil carbon dynamics in temperate grasslands, Drakensberg, South Africa. Catena 2025, 252, 108886. [Google Scholar] [CrossRef]
  48. Fassnacht, F.E.; Li, L.; Fritz, A. Mapping degraded grassland on the Eastern Tibetan Plateau with multi-temporal Landsat 8 data—Where do the severely degraded areas occur? Int. J. Appl. Earth Obs. 2015, 42, 115–127. [Google Scholar] [CrossRef]
  49. Li, T.; Ren, B.; Wang, D.; Liu, G. Spatial variation in the storages and age-related dynamics of forest carbon sequestration in different climate zones-evidence from black locust plantations on the Loess Plateau of China. PLoS ONE 2015, 10, e0121862. [Google Scholar] [CrossRef] [PubMed]
  50. Todd-Brown, K.E.O.; Randerson, J.T.; Post, W.M.; Hoffman, F.M.; Tarnocai, C.; Schuur, E.A.G.; Allison, S.D. Causes of variation in soil carbon simulations from CMIP5 Earth system models and comparison with observations. Biogeosciences 2013, 10, 1717–1736. [Google Scholar] [CrossRef]
  51. Davidson, E.A.; Trumbore, S.E.; Amundson, R. Soil warming and organic carbon content. Nature 2000, 408, 789–790. [Google Scholar] [CrossRef]
  52. Tang, K.; Li, F.Y.; Jaesong, S.; Liu, Y.; Sun, T.; Liu, J.; Gao, X.; Wang, Y. Soil water retention capacity surpasses climate humidity in determining soil organic carbon content but not plant production in the steppe zone of Northern China. Ecol. Indic. 2022, 141, 109129. [Google Scholar] [CrossRef]
  53. Shabtai, I.A.; Das, S.; Inagaki, T.M.; Azimzadeh, B.; Richards, B.; Martínez, C.E.; Kögel-Knabner, I.; Lehmann, J. Soil organic carbon accrual due to more efficient microbial utilization of plant inputs at greater long-term soil moisture. Geochim. Cosmochim. Acta 2022, 327, 170–185. [Google Scholar] [CrossRef]
  54. Butcher, K.R.; Nasto, M.K.; Norton, J.M.; Stark, J.M. Physical mechanisms for soil moisture effects on microbial carbon-use efficiency in a sandy loam soil in the western United States. Soil Biol. Biochem. 2020, 150, 107969. [Google Scholar] [CrossRef]
  55. Kazempour Larsary, M.; Pourbabaei, H.; Salehi, A.; Yousefpour, R.; Ali, A. Few functionally acquisitive big-sized trees restrict but soil nutrients promote soil organic carbon storage in temperate deciduous forests. Forest Ecol. Manag. 2023, 541, 121059. [Google Scholar] [CrossRef]
  56. Ahirwal, J.; Gogoi, A.; Sahoo, U.K. Stability of soil organic carbon pools affected by land use and land cover changes in forests of eastern Himalayan region, India. Catena 2022, 215, 106308. [Google Scholar] [CrossRef]
  57. Dai, L.; Ge, J.; Wang, L.; Zhang, Q.; Liang, T.; Bolan, N.; Lischeid, G.; Rinklebe, J. Influence of soil properties, topography, and land cover on soil organic carbon and total nitrogen concentration: A case study in Qinghai-Tibet plateau based on random forest regression and structural equation modeling. Sci. Total Environ. 2022, 821, 153440. [Google Scholar] [CrossRef] [PubMed]
  58. Wang, Q.; Wang, S.; He, T.; Liu, L.; Wu, J. Response of organic carbon mineralization and microbial community to leaf litter and nutrient additions in subtropical forest soils. Soil Biol. Biochem. 2014, 71, 13–20. [Google Scholar] [CrossRef]
  59. Liao, C.; Men, X.; Wang, C.; Chen, R.; Cheng, X. Nitrogen availability and mineral particles contributed fungal necromass to the newly formed stable carbon pool in the alpine areas of Southwest China. Soil Biol. Biochem. 2022, 173, 108788. [Google Scholar] [CrossRef]
  60. Zhao, X.; Tian, P.; Zhang, W.; Wang, Q.; Guo, P.; Wang, Q. Nitrogen deposition caused higher increases in plant-derived organic carbon than microbial-derived organic carbon in forest soils. Sci. Total Environ. 2024, 925, 171752. [Google Scholar] [CrossRef]
Figure 1. The location of the study area (a) and the spatial distribution of sampling sites (b).
Forests 16 00631 g001
Figure 2. Carbon stocks in arbor/shrub layer (a), grass layer (b), and plant layer (c). Pla means plants, Dur means duration. Different uppercase letters indicate significant differences among plant species at p < 0.05, while lowercase letters denote significant differences among all treatments at p < 0.05. η2 represents the contribution of each factor to the total effect size.
Forests 16 00631 g002
Figure 3. Carbon stocks in 0–20 cm soil layer (a), 20–40 cm soil layer (b), 40–60 cm soil layer (c), 60–80 cm soil layer (d), 80–100 cm soil layer (e), and 0–100 cm soil layer (f). Pla means plants, Dur means duration. Different lowercase letters indicate significant differences among all treatments at p < 0.05. η2 represents the contribution of each factor to the total effect size.
Forests 16 00631 g003
Figure 4. Carbon stocks in plant and soil continuum (a). The percentage of carbon stocks in the soil layer and the plant layer (b). The change of carbon stocks in biomass and soil caused by afforestation (c). Note: Pla means plants, Dur means duration. Different lowercase letters indicate significant differences among all the treatments at p < 0.05. η2 represents the contribution of each factor to the total effect size.
Forests 16 00631 g004
Figure 5. Relative importance of plant and soil characteristics to biomass carbon (a) and soil organic carbon (b) quantified by the percentage increase in the mean squared error (MSE%) using random forest models. Spearman correlations of SOC for STN (c), SNN (d) and SAN (e). Spearman correlations of biomass carbon for herbs: Shannon index (f) and Simpson’s index (g). ** and * denote significance levels at p < 0.01 and p < 0.05, respectively (n = 23). The black dots indicate the observed x and y values for each sample, the red line shows the best-fit regression line, and the light red shaded area represents the 95% confidence interval.
Forests 16 00631 g005aForests 16 00631 g005b
Figure 6. Partial least squares path modeling (PLS-PM) of the drivers influencing soil organic carbon (SOC) stocks (a) and the standardized effect size of these drivers (b). The numbers adjacent to the arrows represent path coefficients, with blue and black colors indicating positive and negative effects, respectively. The asterisks indicate statistically significant differences, with * representing p < 0.05 and ** representing p < 0.01. The goodness-of-fit was used to evaluate the performance of the PLS-PM (GOF = 0.52).
Forests 16 00631 g006
Disclaimer/Publisher’s Note: The statements, opinions and data contained in all publications are solely those of the individual author(s) and contributor(s) and not of MDPI and/or the editor(s). MDPI and/or the editor(s) disclaim responsibility for any injury to people or property resulting from any ideas, methods, instructions or products referred to in the content.

