Article

Characteristics and Controlling Factors of Nutrient Resorption in Populus euphratica Oliv Across Various Environments

1
Key Laboratory of Oasis Ecology, Ministry of Education, Xinjiang University, Urumchi 830017, China
2
College of Ecology and Environment, Xinjiang University, Urumchi 830017, China
3
Institute of Desert Meteorology, China Meteorological Administration (CMA), Urumqi 830002, China
*
Authors to whom correspondence should be addressed.
Forests 2025, 16(4), 629; https://doi.org/10.3390/f16040629
Submission received: 6 March 2025 / Revised: 29 March 2025 / Accepted: 1 April 2025 / Published: 3 April 2025
(This article belongs to the Section Forest Ecology and Management)

Abstract

:
Populus euphratica Oliv, a representative species in arid ecosystems, serves vital ecological functions, including windbreak, sand stabilization and carbon sequestration. Investigating its nutrient resorption mechanisms is important for elucidating plant adaptation and growth strategies in nutrient-deficient environments. This study selected thirty sampling sites in Xinjiang across different locations and collected Populus euphratica leaves. Correlation analysis, regression analysis and redundancy analysis (RDA) were employed to assess the characteristics of nutrient resorption in Populus euphratica and their driving factors. We determined the leaf nitrogen (N) and phosphorus (P) concentrations in plants and then calculated the N:P ratio, nitrogen resorption efficiency (NRE) and phosphorus resorption efficiency (PRE). The results of the correlation analysis indicated that the NRE was not significantly correlated with the N and P contents or the N:P ratio in green leaves but was significantly related to those in senescent leaves. In contrast, the PRE was negatively correlated with the P content in the senescent leaves. The NRE:PRE ratio was positively correlated with the N in the green leaves and the P in the senescent leaves but negatively related to the N:P ratio in the senescent leaves. Nutrient resorption efficiency appeared to change with varying environments. Regression analysis revealed that both the NRE:PRE ratio and the NRE were positively correlated with latitude and mean annual precipitation (MAP) but negatively correlated with altitude and mean annual temperature (MAT). However, the PRE showed a negative correlation with latitude and MAP and positive correlations with altitude and MAT. Among these factors, the contribution of the MAP was the greatest, accounting for 85.1% and thus dominating the nutrient resorption processes in Populus euphratica. This study has enhanced the understanding of nutrient resorption conservation strategy and contributes to revealing the adaptation mechanisms of Populus euphratica under stress conditions such as drought and high temperatures.

1. Introduction

Nutrient resorption is the process whereby plants transfer nutrients from senesced leaves to other organs to enhance nutrient use efficiency [1,2]. This conservation mechanism plays a vital role in the plant nutrient economy by reducing dependence on the nutrient availability from soils [3,4]. As such, most researchers have believed that plant species have higher efficiency in resorbing nutrients in nutrient-poor soils relative to fertile environments [2,5,6]. However, some studies have suggested that nutrient resorption is not a simple function of soil fertility, especially for plant species adapted to nutrient-poor environments [6,7,8]. These findings challenge the simplistic view of resorption as merely reflecting soil fertility gradients. Therefore, elucidating nutrient resorption characteristics across plant species is essential for understanding biogeochemical cycles and plant adaptation to environmental changes.
Among plant nutrient elements, nitrogen and phosphorus serve as the primary limiting factors for plant growth, and their uptake and utilization efficiency can effectively quantify a plant’s nutrient retention capacity under stressful environmental conditions [9,10]. Nitrogen resorption efficiency (NRE) and phosphorus resorption efficiency (PRE) serve as crucial indicators for assessing plant nutrient conservation capacity across ecosystems [11]. A global-scale analysis indicated that approximately 49% of nitrogen and 53% of phosphorus were typically resorbed from senescing leaves [9]. However, other research found considerable variability in the N and P resorption dynamics, as these nutrients play vital roles in plant reproduction and their resorption patterns exhibit significant environmental dependence [8]. The relationship between leaf nutrient content and resorption efficiency remains controversial, with studies reporting negative [12], positive [4] or neutral correlations [13]. Environmental stressors such as drought and salinity have been shown to reduce nutrient resorption efficiency in desert shrubs [14]. Meta-analysis has indicated that both NRE and PRE have varied systematically with latitude, mean annual temperature (MAT) and precipitation (MAP) [3,15], though these relationships may be indirect in herbaceous species. However, a few studies have indicated that MAT and MAP indirectly affect the NRE and PRE in herbaceous plants [16], though Wang et al. [17] documented contrasting patterns in 277 perennial herbaceous species, with MAT showing positive and MAP showing negative correlations with resorption efficiency. Despite these advances, the key drivers regulating nutrient resorption in arid ecosystems remain poorly understood, particularly regarding how multiple environmental factors interact to influence this process. As a typical representative of arid ecosystems, studies on the nutrient uptake mechanisms of Populus euphratica may provide critical insights into this field.
Populus euphratica Oliv, a deciduous species of the Salicaceae family, is a key desert riparian tree widely distributed across arid regions in northwest China, especially in Xinjiang [18]. As a pioneer tree species in these ecosystems, Populus euphratica exhibits remarkable adaptation to nutrient-poor environments and extreme abiotic stresses, including drought, wind erosion and sand burial. The species is characterized by its substantial size (reaching 30 m high and 1.5 m in diameter) and distinctive grayish–brown bark [19]. In addition, Populus euphratica displays heterophylly, with the lower leaves being narrow lanceolates that gradually transition to broader, rounded leaves in the upper canopy [20]. These morphological adaptations contribute significantly to its drought-tolerant and wind-resistant nature, making it crucial for maintaining arid ecosystem stability [21]. While previous studies have extensively investigated Populus euphratica’s physiological traits [22] water use strategy [23,24], ecological stoichiometry [25] and stress tolerance mechanism [26,27], the characteristics, patterns and environmental controls of its nutrient resorption remains poorly understood. Given its ecological importance, elucidating the nutrient resorption processes of Populus euphratica is critical for advancing the understanding of nutrient recycling in arid ecosystems and informing effective ecological restoration strategies.
This study aims to investigate the characteristics and environmental drivers of nutrient resorption in Populus euphratica across Xinjiang’s arid ecosystems. We selected thirty sampling sites along key environmental gradients to examine leaf nutrient resorption dynamics in relation to latitude, altitude, MAT and MAP. Specifically, the objectives of this study are (i) to quantify the nutrient statuses of Populus euphratica leaves across different populations, (ii) to assess the relationship between nutrient resorption efficiency and environmental variables and (iii) to identify the dominant factors regulating nutrient resorption processes in arid environments.

2. Materials and Methods

2.1. Overview of the Study Area

The study area was located in Xinjiang, Northwestern China (36°86′–47°10′ N, 76°70′–95°01′ E), and the altitudes ranged from 235 m to 1411 m (Figure 1). The annual mean temperature there varies between 6.2 °C and 13.5 °C, while the annual mean precipitation ranges from 27.2 to 192.4 mm. This region exemplifies an extreme desert ecosystem, with an aridity index of 0.09 (an aridity index of <0.2 classifies it as an arid region; the aridity index is defined as the ratio of annual total precipitation to potential evapotranspiration) [28]. The main woody plant species in the study area include Populus euphratica, Elaeagnus angustifolia L., Tamarix ramosissima Ledeb., Juglans regia L. and Lycium barbarum L. Populus euphratica, as a representative woody plant, is widely distributed in Xinjiang. The main growing season is between June and July, and the leaf-fall period occurs from October to November. The study area characteristics are detailed in Appendix A (Table A1).

2.2. Sampling and Analyzing

2.2.1. Sample Acquisition

This study selected thirty sampling sites in Xinjiang where Populus euphratica trees were present. At each site, we selected three Populus euphratica trees as sampling objects. In June 2023, we collected green, fully expanded and pest-free leaves from these trees for nutrient content analysis. In addition, we recorded the latitude, longitude and altitude of each site to facilitate the subsequent collection of senescent leaves. In October 2023, we collected senescent leaves with clear aging signs for this study (leaves turned yellow and fell off or could be detached by gently shaking). Both the collected green and senescent leaves during the two periods were placed in envelope bags and then brought back to the laboratory for further analysis. Due to the heterophylly characteristic of Populus euphratica, we sampled leaves including all leaf types to avoid the impacts of environmental factors and leaf morphology. Healthy leaves were collected from the middle and lower canopy layers in four directions (east, south, west and north), and five leaves were taken from each direction for the determination of the nutrient content.

2.2.2. Experimental Analysis

To determine the nutrient content of the green and senescent leaves of Populus euphratica, we conducted a series of treatments in the laboratory. First, the leaves collected were placed in an oven at 105 °C for 30 min for enzyme deactivation, aiming to stabilize the nutrient content in the collected leaf samples. They were then further dried at 75 °C for at least 24 h until a constant mass was reached. The dried samples were then ground using a grinder or porcelain mortar and passed through a 100-mesh sieve for further analysis. Leaf N content was measured using Nessler’s reagent colorimetric method, and P content was determined using the concentrated sulfuric acid–hydrogen peroxide digestion–molybdenum antimony anti-spectrophotometric method [29].
The resorption efficiency was calculated using the following equation:
N u R E = ( 1 N u s e n N u g r M L C F ) × 100
where N u g r and N u s e n represent the nutrient content of the corresponding element in green and senescent leaves, respectively. MLCF is the mass loss correction factor, with a value of 0.784 [30].
The resorption ratio was calculated using the following equation:
N i j R R = N i R E N j R E
where N i R E and N j R E represent the resorption efficiencies of element i and element j, respectively.

2.3. Identifying the Controlling Factors of Nutrient Resorption

Nutrient resorption processes are affected not only by the nutrients in soils and plants but also by environmental factors. Therefore, to identify the dominant factors influencing nutrient resorption, we explored the relationships between nutrient resorption efficiencies and ratios and climate and geography. Regression analysis was employed to explore the connections between latitude, altitude, MAT, MAP and resorption efficiencies and ratios. Additionally, redundancy analysis was conducted using Canoco 5 software to identify the primary factors influencing nutrient resorption. Before the analysis, a detrended correspondence analysis (DCA) was conducted for the species data. The maximum gradient length (LGA) of the four ordination axes for nutrient resorption in Populus euphratica leaves was 0.14, which is below 3, satisfying the requirements for redundancy analysis.
Temperature and precipitation data were obtained from the Loess Plateau SubCenter, National Earth System Science Data Center, National Science & Technology Infrastructure of China (http://loess.geodata.cn, accessed on 26 April 2024) [31]. For this study, we extracted long-term average temperature and precipitation data from 2001 to 2020 in each sampling site using ArcGIS 10.8 software.

2.4. Statistical Analysis

All data were tested by the Shapiro–Wilk (S–W) test for normality. If the data did not follow a normal distribution, they were log-transformed prior to analysis. Correlation analysis was used to examine the differences between plant nutrient status and resorption efficiencies and ratios. Data analysis was performed using SPSS 26.0, and redundancy analysis plots of nutrient resorption in Populus euphratica and environmental factors were generated using Canoco 5. All tests were two-sided, and p values of <0.05 were considered statistically significant.

3. Results

3.1. Nutrient Status of Populus euphratica Leaves

The contents of N (15.37 g/kg) and P (0.96 g/kg) in the green leaves were significantly higher than those in the senescent leaves (N: 4.35 g/kg, P: 0.42 g/kg), with the N content being greater than the P content (Table 1). This indicates that Populus euphratica undergoes obvious nutrient resorption during leaf senescence. The N:P ratio was 17.40 in the green leaves and 11.99 in the senescent leaves. The NRE (77.14%) was higher than the PRE (65.10%), demonstrating that Populus euphratica adapts to nutrient-poor soil environments through efficient nutrient resorption, thereby reducing its reliance on external nutrient sources.

3.2. Correlation Between Leaf Nutrient and Nutrient Resorption

No significant correlation was observed between the N and P contents in the leaves. The N content in the green leaves was not significantly correlated with the NRE (p > 0.05) but significantly correlated with the PRE and NRE:PRE, with correlation coefficients of −0.47 (p < 0.01) and 0.52 (p < 0.01), respectively. The P content in the green leaves had no significant correlations with the NRE, PRE or NRE:PRE (p > 0.05). The N:P ratio in the green leaves was significantly correlated with the PRE, with a correlation coefficient of −0.41 (p < 0.05), but not significantly related to the NRE or NRE:PRE. The N content in the senescent leaves was significantly correlated with the NRE, with a correlation coefficient of −0.63 (p < 0.01), while it had no significant correlations with the PRE or NRE:PRE. The P content in the senescent leaves was significantly correlated with the NRE, NRE:PRE and PRE, with correlation coefficients of 0.39 (p < 0.05), 0.82 (p < 0.01) and −0.75 (p < 0.01), respectively (Figure 2). These results indicate that the nitrogen and phosphorus contents in soil play important roles in plant nutrient uptake and utilization and ecosystem nutrient balance. The complex relationships between leaf nutrient content and nutrient resorption indicate that nutrient resorption processes may be influenced by multiple factors.

3.3. Relationship Between Nutrient Resorption and Environmental Factors

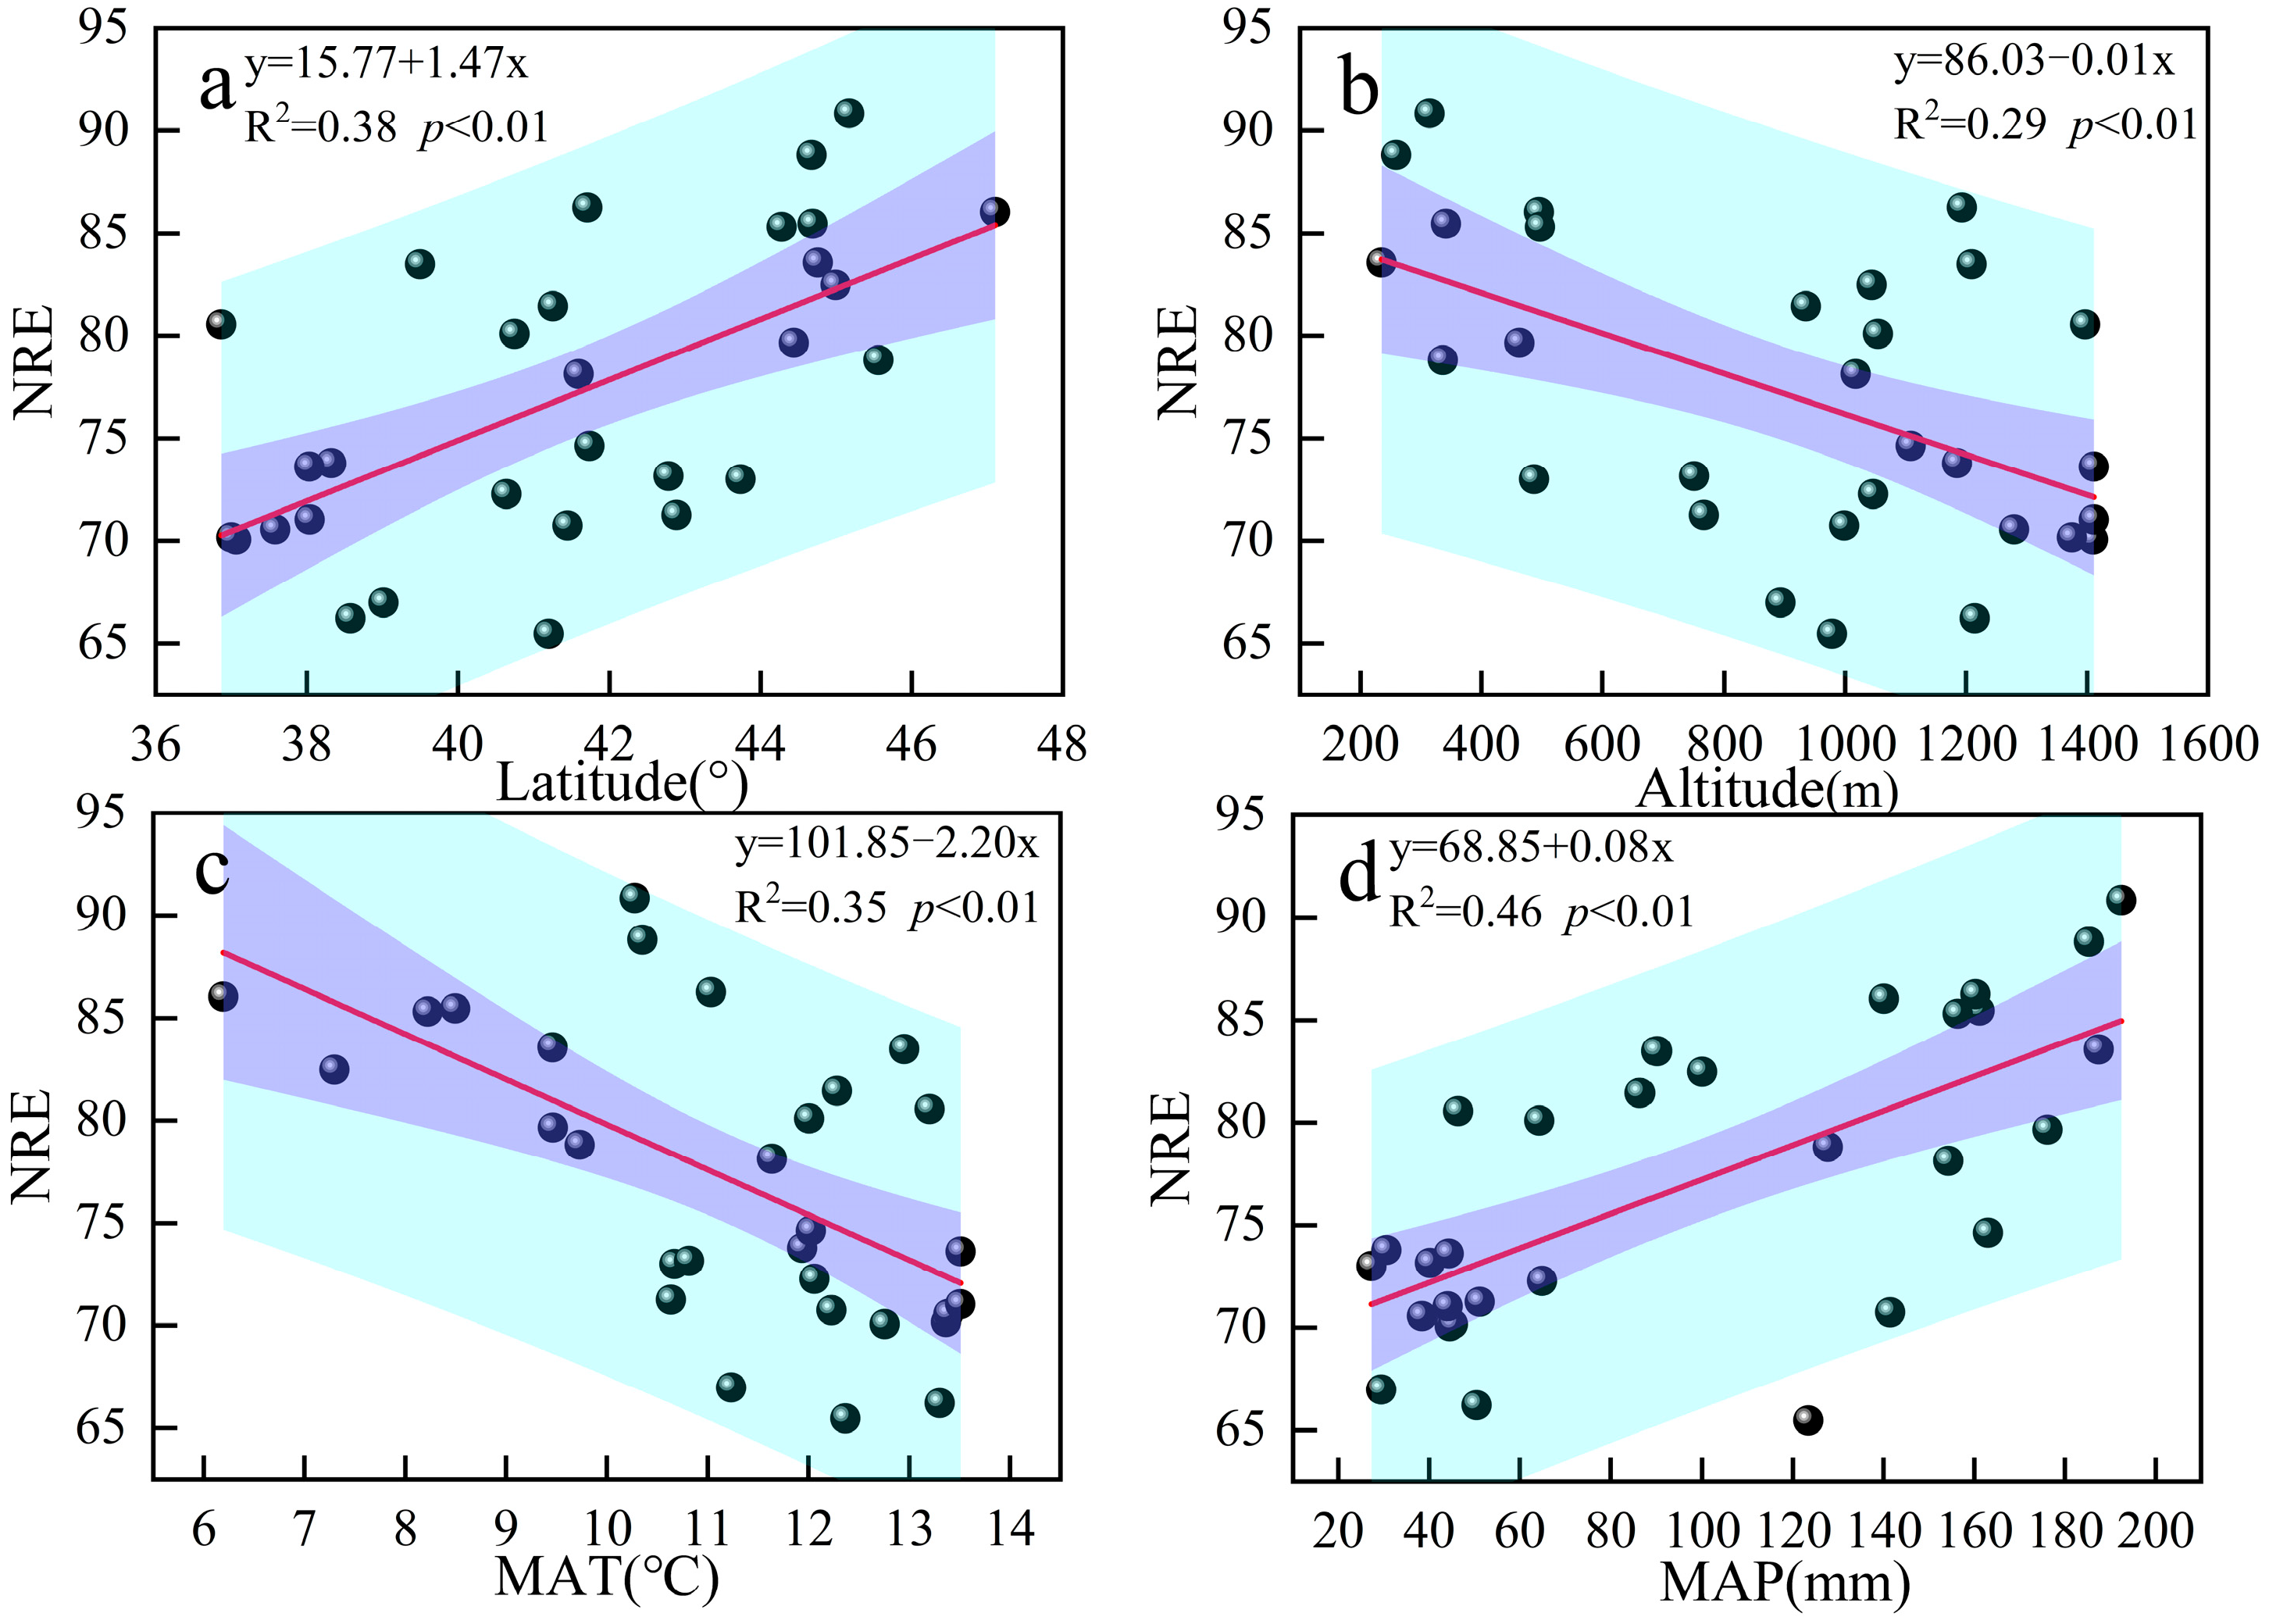
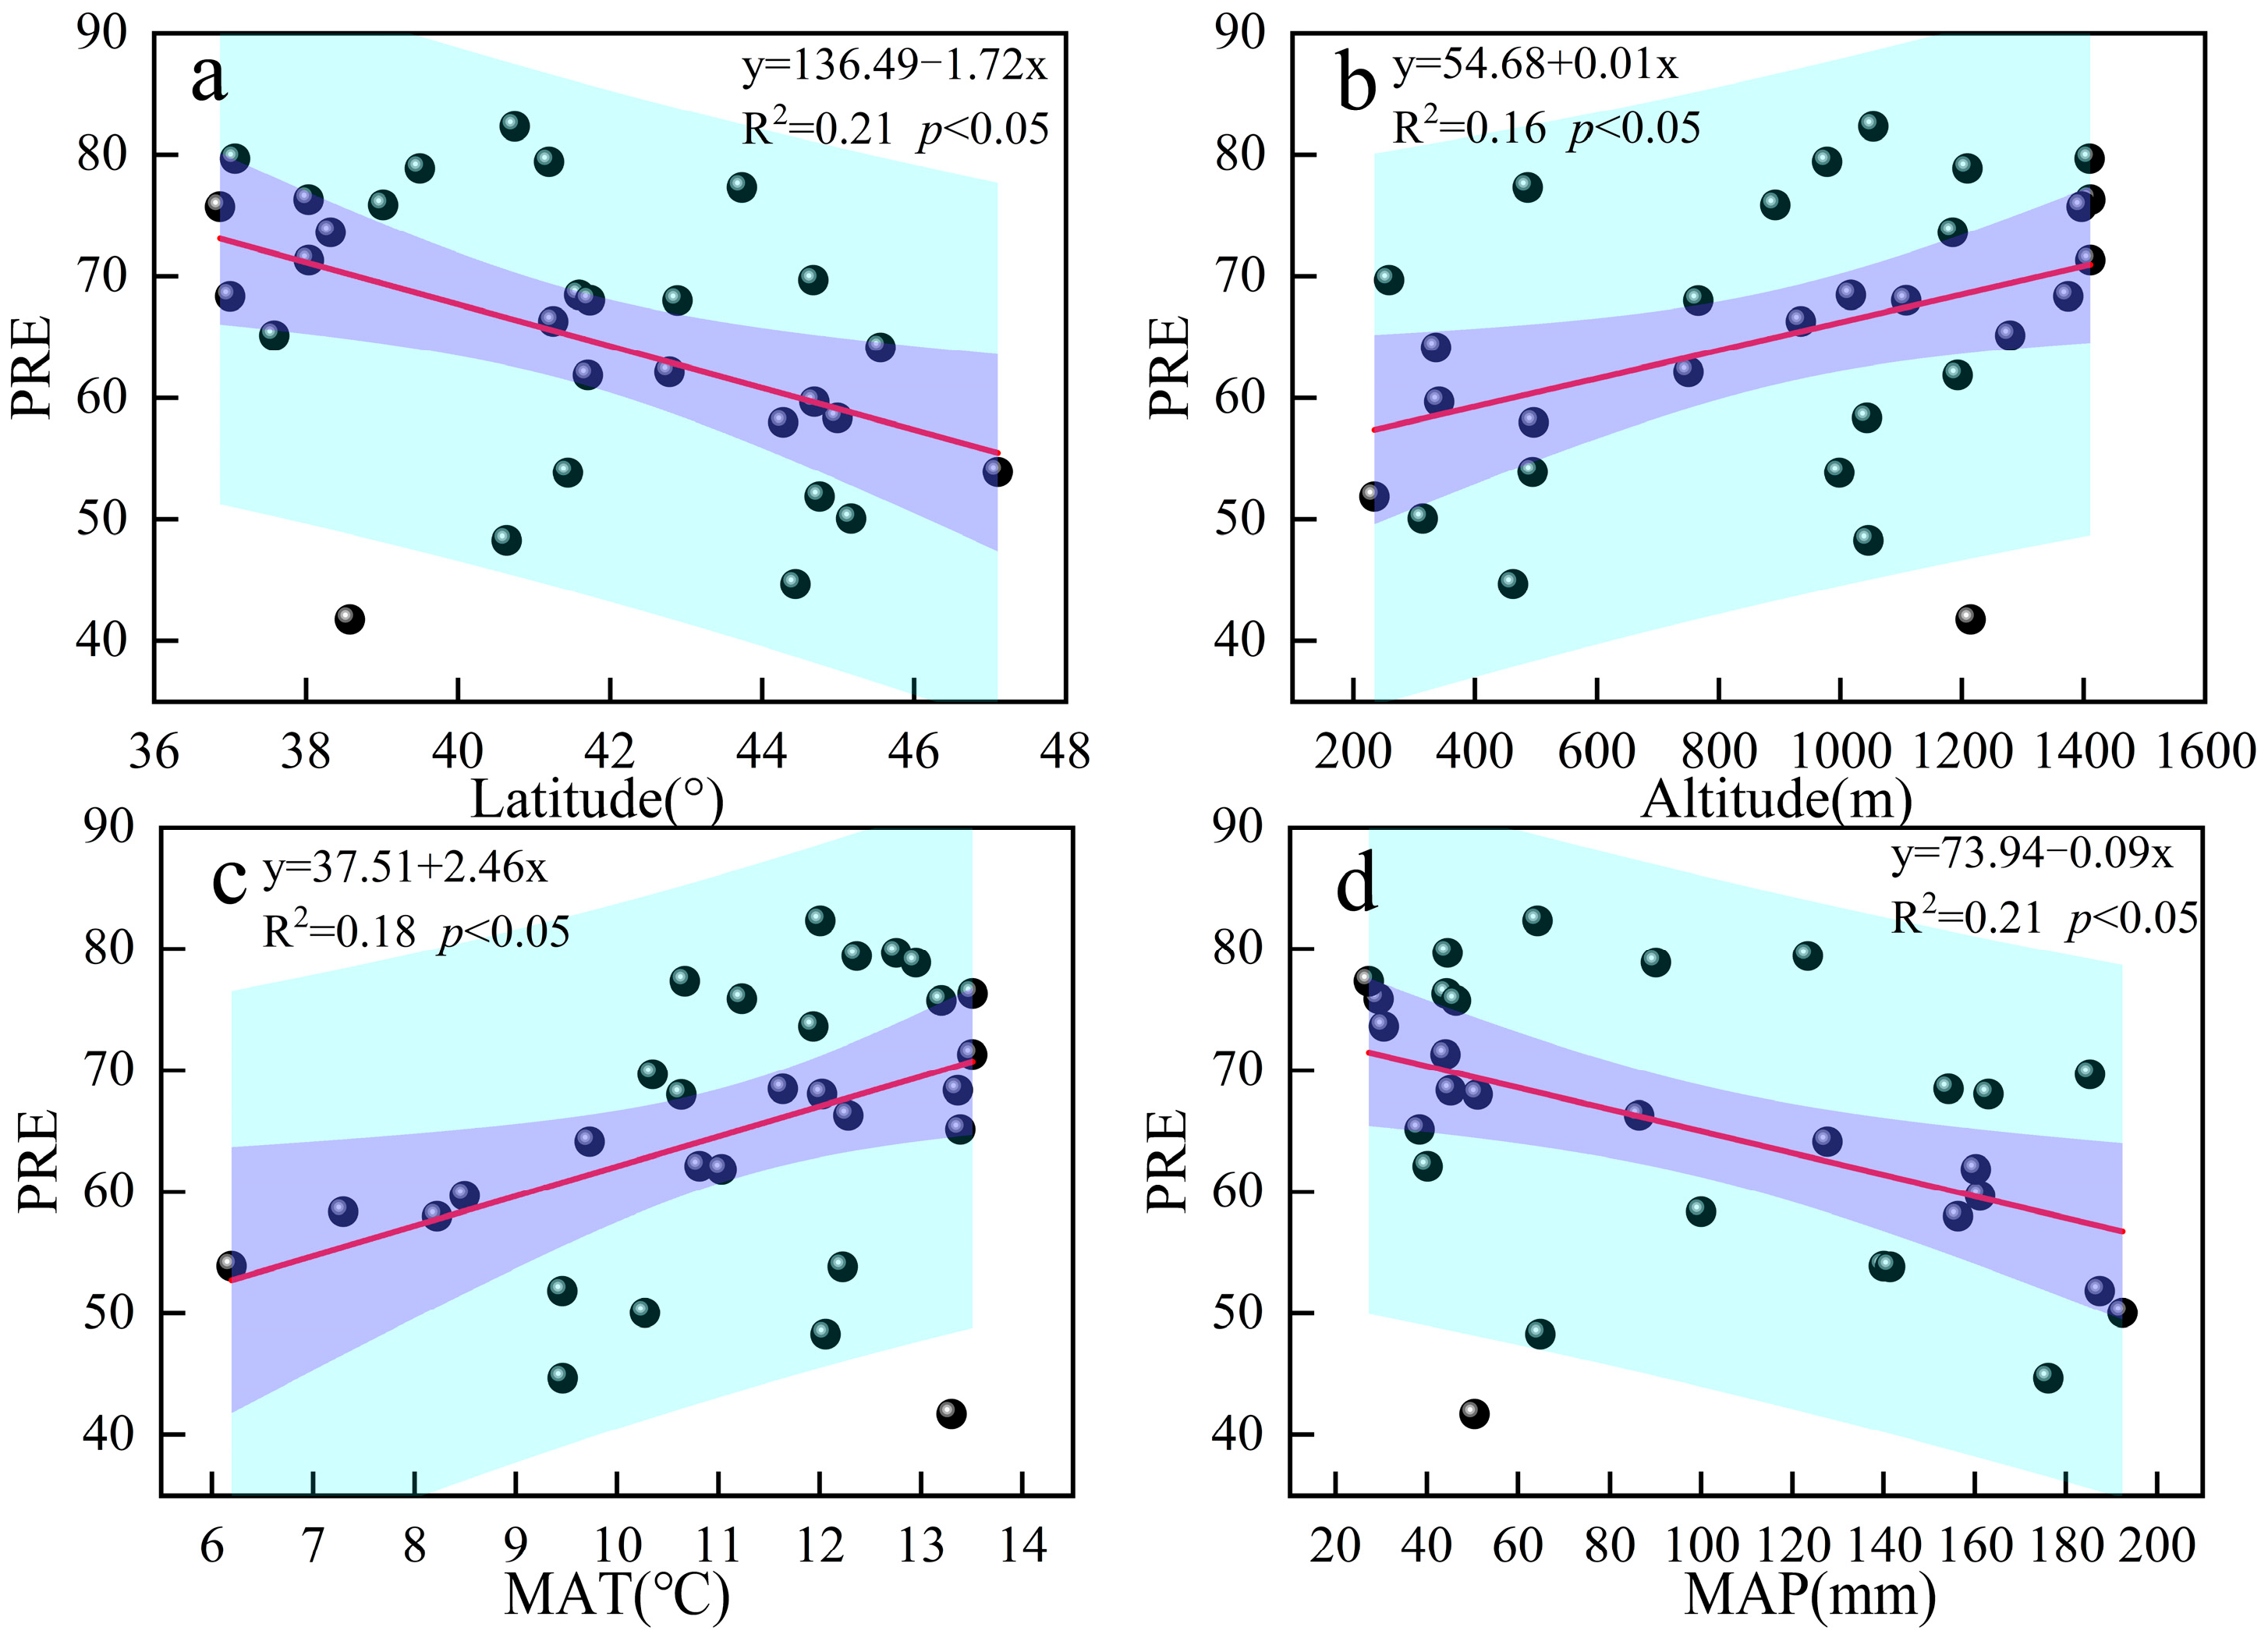
We further analyzed the relationship between nutrient resorption patterns and environmental factors to clarify the strategy of nutrient resorption. Overall, the NRE and PRE were closely correlated with latitude, altitude, MAT and MAP, but the impact for NRE was greater than that for PRE (Figure 3 and Figure 4). However, the NRE and PRE exhibited opposite patterns in relation to the environmental factors. Specifically, the NRE increased with rising latitude and MAP, while it decreased with altitude and MAT (p < 0.01); conversely, the PRE decreased with increasing latitude and MAP but increased with altitude and MAT (p < 0.05). The NRE:PRE ratio increased with rising latitude and MAP but decreased with increasing altitude and MAT (p < 0.01, Figure 5).

3.4. Key Environmental Drivers of Nutrient Resorption

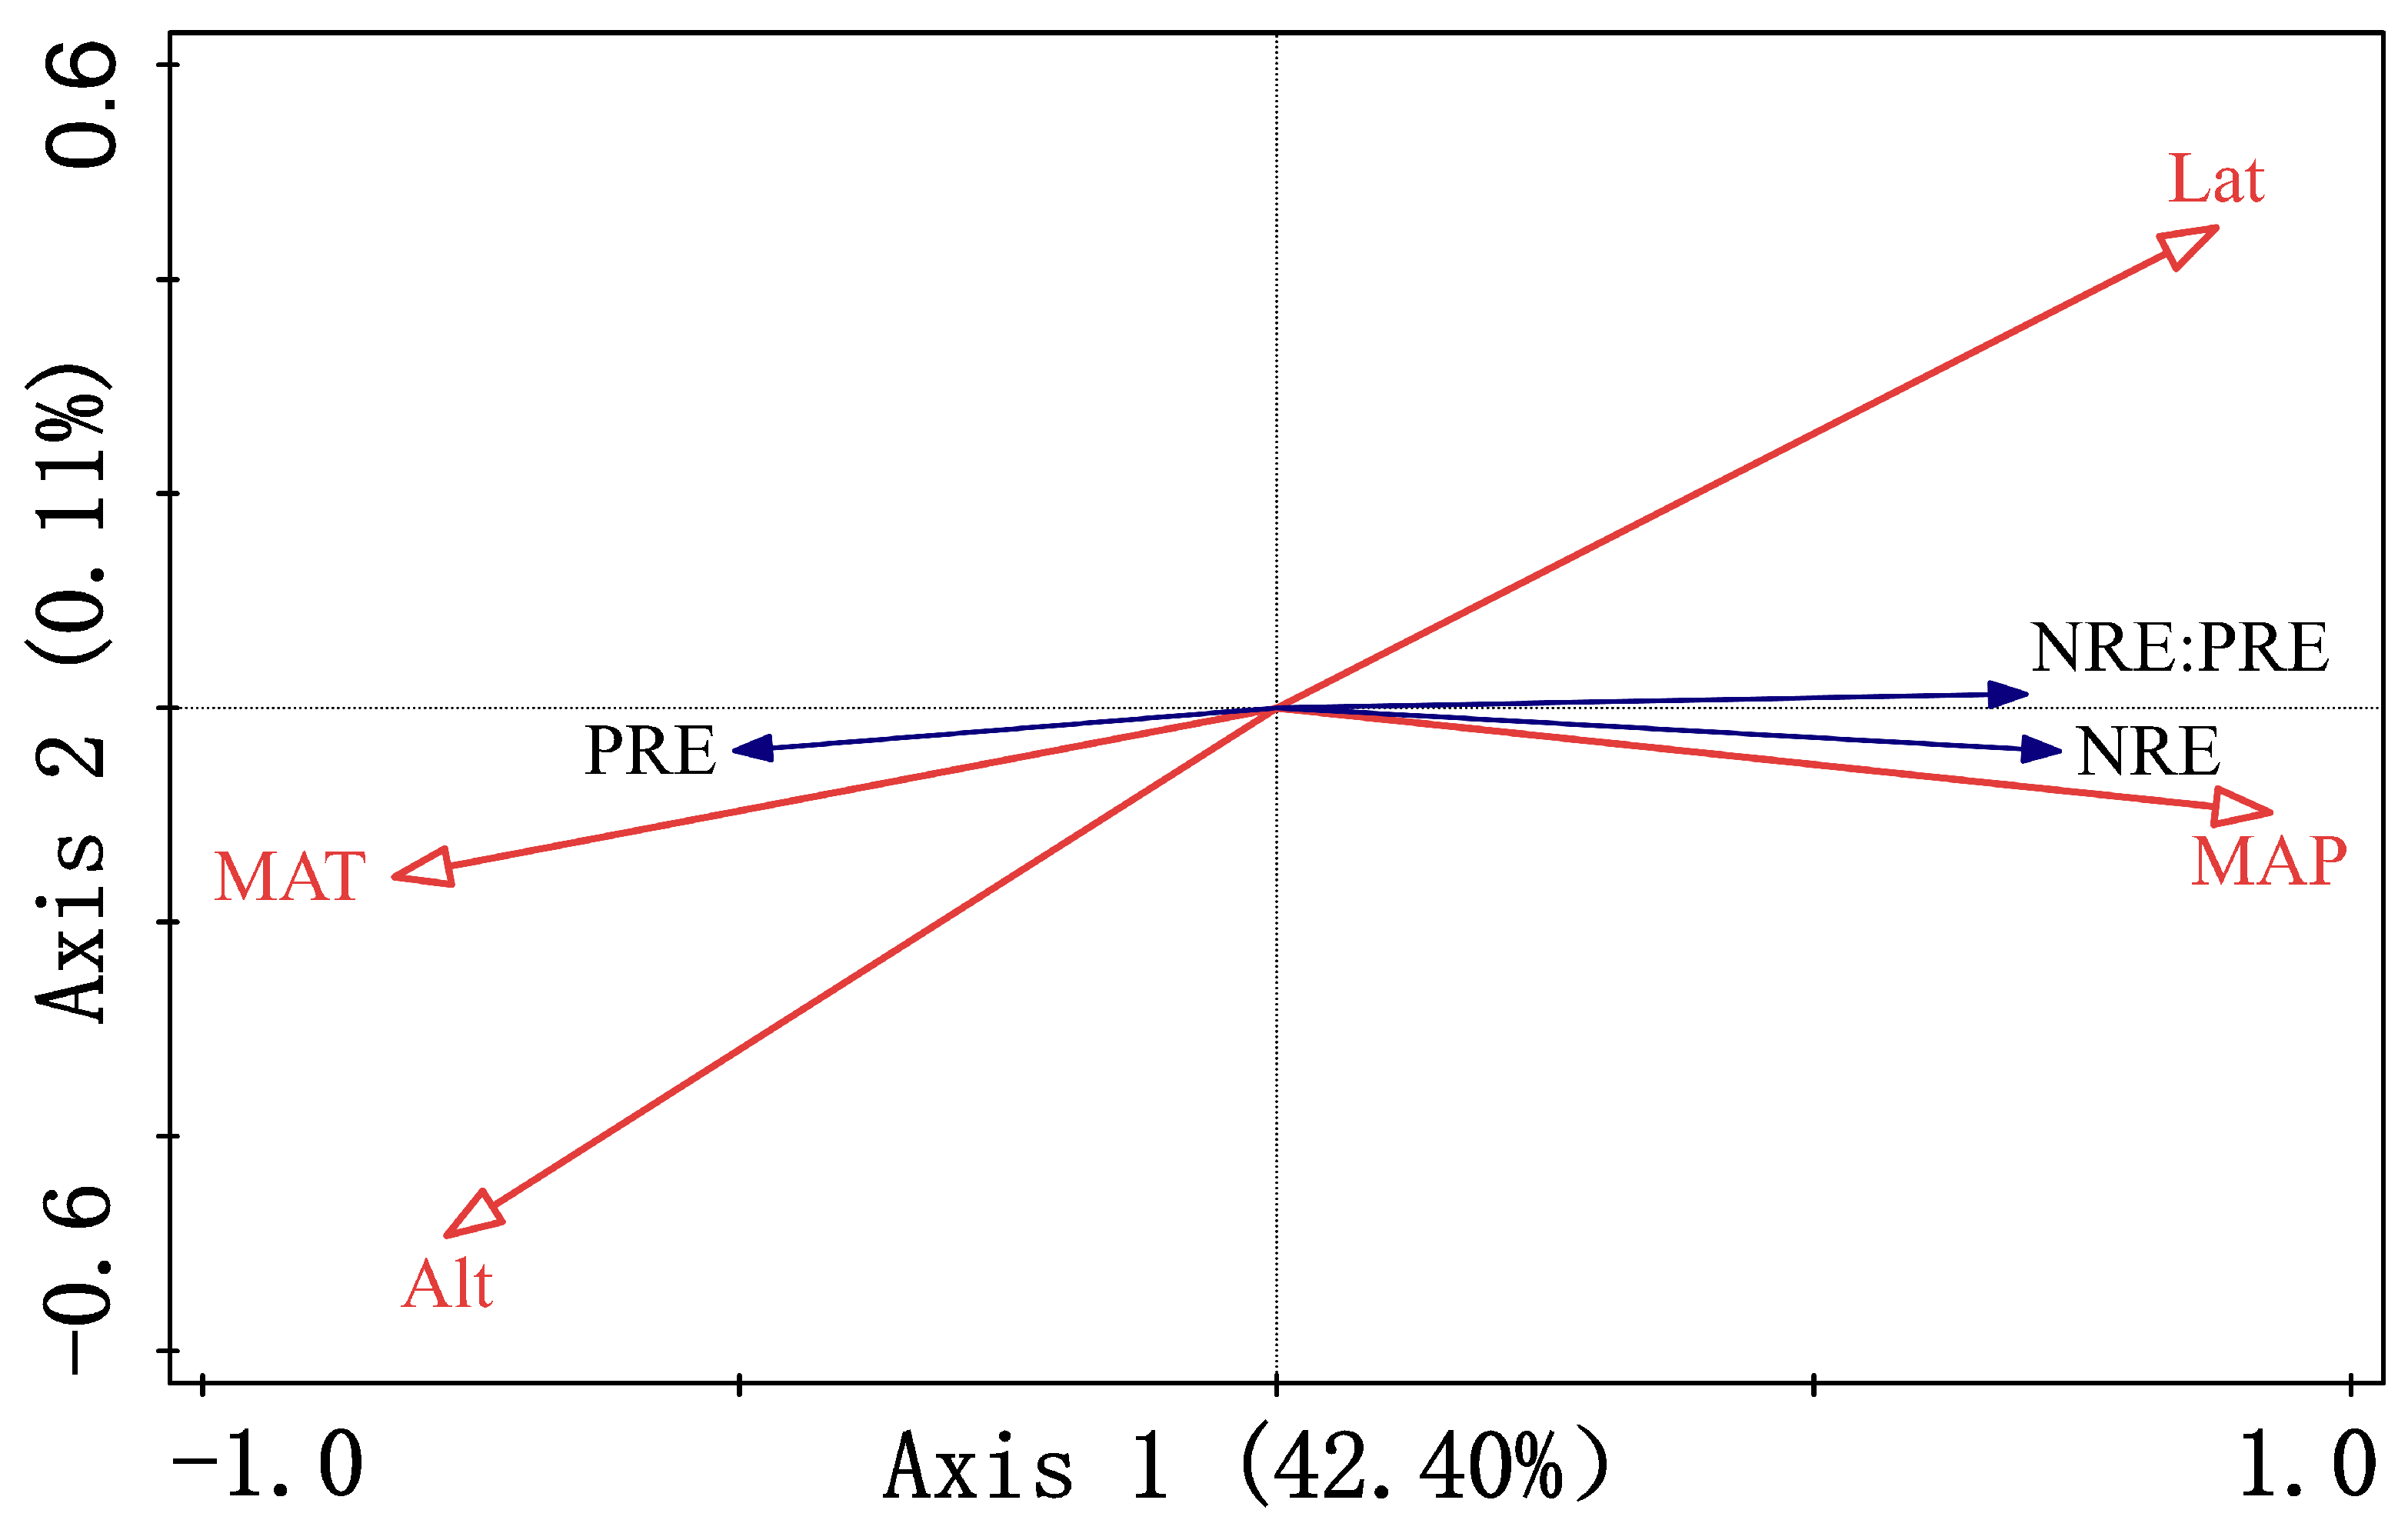
To examine and clarify the relationships of NRE, PRE and NRE:PRE with environmental factors, redundancy analysis was used. The results show that the cumulative explanatory power of axes 1 and 2 for the relationship between leaf resorption characteristics and environmental factors exceeds 99% for Populus euphratica (Table 2). Therefore, axes 1 and 2 can be fully used to explain the impacts of environmental factors on nutrient resorption. The results of the redundancy analysis were consistent with those of the regression analysis. This indicates that variation in NRE:PRE is aligned with that of NRE but opposite to that of PRE under different environments (Figure 6).
We further quantified the contributions of environmental factors to nutrient resorption efficiencies. According to these contributions of environmental factors to leaf nutrient resorption, we ranked the controlling factors (Table 3). The results indicate that MAP and MAT have high contributions to nutrient resorption, with values of 85.1% and 14.5%, showing significant correlations between MAP and nutrient resorption efficiencies (p < 0.01). However, the contributions of the other factors were less than 1% and had no significant correlations. Therefore, the MAP dominated the nutrient resorption processes for Populus euphratica in the study area.

4. Discussion

4.1. Connection Between Nutrient Resorption and Leaf Nutrients

Generally, the nutrient status of leaves is closely related to nutrient resorption efficiency. Some studies have indicated that leaf nutrient status negatively correlates with resorption efficiency because plants can enhance their nutrient resorption rates to sustain growth under lower leaf nutrient contents [32]. However, our results indicated that NRE and PRE were negatively related to nutrient contents in leaves under different periods. Specifically, the NRE and PRE were not significantly correlated with the nutrient content in the green leaves but were significantly negatively correlated with that in the senescent leaves (Table 3). This study found that nutrient loss was reduced in the senescent Populus euphratica leaves by enhancement of nutrient use efficiency, which may be attributed to the arid environment. In arid or semi-arid regions, nutrient resorption in Populus euphratica leaves may be influenced by the ratio of the soluble or insoluble N and P compounds in the leaves. Therefore, there was shown an insignificant correlation with the nutrient content of the green leaves, which is consistent with previous studies [33].
In this study, the NRE and PRE were, respectively, 77.1% and 65.1% higher than the global averages (49.2% for NRE and 53.5% for PRE) (Table 1) [9]. Our study further confirmed previous conclusions that plants in impoverished habitats exhibit higher nutrient resorption efficiencies compared with fertile habitats [34]. The N:P ratio, an indicator of nutrient limitation, was N-limited when the N:P ratio was less than 14 and P-limited when it was greater than 16 [35]. However, the N:P ratio in the Populus euphratica leaves ranged from 2.5 to 46.8, making it unsuitable for determining nutrient limitation in this study (Table 1). This discrepancy may arise from the fact of the threshold proposed by Koerselman and Meuleman [35], which was established through fertilization experiments, and may not apply to plants in other ecosystems [36]. Moreover, an NRE:PRE ratio exceeding 1 suggests N limitation, and if it is less than 1, it suggests P limitation. As such, the NRE:PRE ratio has been widely used on various plant species within various ecosystems [15]. In this study, the NRE:PRE ratio ranged from 0.8 to 1.8, with an average of 1.2, and increased with latitude, suggesting a shift from phosphorus to nitrogen limitation in Populus euphratica. This pattern aligns with previous findings that higher latitudes experience N limitation while lower latitudes are more P-limited [3]. Plants under nitrogen or phosphorus limitation are more likely to increase either NRE or PRE. In this study, NRE exceeded PRE, consistent with the “relative resorption hypothesis” proposed by Han et al. [37].

4.2. Nutrient Resorption in Response to Environmental Factors

In this study, the observed positive correlations of NRE:PRE with latitude and MAP and negative correlation with MAT are consistent with previous research findings [15]. These relationships between NRE:PRE and environmental factors are primarily due to the opposite patterns of NRE and PRE. The availability of P is mainly governed by soil parent material [38,39], while N availability is shaped by biological N fixation and mineralization [40]. This indicates that the conservation strategies for N and P vary with climate change.
The relationship between NRE, latitude and MAT suggests that plants in high-latitude (low-temperature) regions primarily rely on the recycling of their internal N content. This finding is consistent with previous studies reporting that plant species in such areas can increase their NRE [34,41]. However, Bai et al. [42] found that altitude was negatively correlated with NRE but positively correlated with PRE and MAT was positively correlated with NRE but negatively correlated with PRE. This contrasts with the pattern observed in this study, where NRE decreased and PRE increased with decreasing altitude and rising MAT (Figure 3 and Figure 4). This phenomenon can be attributed to the following aspects: firstly, the altitude variation was minimal in our study sites, implying that the temperature did not exhibit significant changes with the altitude. Secondly, the differences in nutrient resorption processes are not directly related to altitude but are correlated with soils associated with altitude. The distribution of plant competition is essentially a result of long-term adaptation to soil resources and climate [9]. Additionally, this study found that the impact of environmental factors on NRE was greater than that for PRE. This is due to the fact that as MAT increases and MAP decreases, the N content in green leaves diminishes, leading to a reduction in NRE. Conversely, plants enhance their PRE to adapt to warm and drought environment. These results indicated that the NRE decreased with increasing MAT, suggesting plants can modulate nutrient resorption processes to enhance resilience against drought stress [43].

4.3. Identifying Main Drivers of Nutrient Resorption in Populus euphratica

Identifying the controlling factors of nutrient resorption is important for understanding biogeochemical cycles. Therefore, this study used redundancy analysis to explore the relationship between nutrient resorption and environmental factors. The results showed that MAP was the main factor influencing the characteristics of nutrient resorption. In this study, environmental factors such as MAT, latitude and altitude did not emerge as key drivers of the nutrient resorption process. This may be attributed to the minor variations in MAT across the study area and the homogeneity of the tree species [29]. The diversity of plant physiological traits allows plants to adopt different nutrient resorption strategies in response to environmental changes [44]. In addition, nutrient resorption efficiency is influenced by a combination of factors, including light, soil properties and atmospheric composition. The interactions of these factors in different regions are complex and variable, making it difficult for a single environmental factor to dominate changes in nutrient resorption efficiency [45].
In this study, MAP dominated the nutrient resorption due to precipitation of less than 200 mm in the study area. The scarcity of soil water severely hindered the growth of Populus euphratica. As a key factor, MAP not only directly participates in photosynthesis and nutrient absorption [46] but also affects soil nutrient availability [47]. Studies have demonstrated that decreased precipitation results in soil moisture reduction, impacting soil microbial activity and N mineralization and inhibiting the microbial decomposition of total P [48]. Additionally, the leaching effect of precipitation impacts leaf nutrient content [49], with nutrient loss due to leaching increasing as leaves senesce [50]. Therefore, MAP is the primary controller of nutrient resorption efficiencies for Populus euphratica. This highlights the significance of precipitation in the nutrient cycling of Populus euphratica in arid regions.

5. Conclusions

Understanding nutrient resorption dynamics and their controlling factors is crucial for developing effective ecological restoration and sustainable management strategies. This study investigated the patterns and environmental drivers of nutrient resorption in Populus euphratica across diverse regions of Xinjiang. Our findings revealed a latitudinal shift in nutrient limitation, with Populus euphratica transitioning from a phosphorus limitation to a nitrogen limitation at higher latitudes. The results indicate that the growth of Populus euphratica in the study area shifted from phosphorus limitation to nitrogen limitation with increasing latitude. A significant negative correlation was observed between senescent leaf nutrient content and nutrient efficiency, suggesting that Populus euphratica employs a nutrient conservation strategy by reducing residual nutrients in senescent leaves to adapt to arid, nutrient-deficient environments. Among the examined environmental factors (latitude, altitude, MAT and MAP), MAP emerged as the most influential determinant of nutrient resorption. Notably, nitrogen resorption efficiency and phosphorus resorption efficiency exhibited contrasting responses to environmental gradients, with environmental factors exerting stronger effects on NRE than on PRE.

Author Contributions

Conceptualization: J.Z. and Z.X.; methodology: J.Z., P.S., Z.X. and Y.W.; experiment: J.Z.; data analysis: J.Z. and P.S.; writing—original draft preparation: J.Z.; writing—review and editing: J.Z., P.S. and Z.X.; supervision: P.S., Z.X. and Y.W.; project administration: Z.X. and Y.W.; funding acquisition: Z.X. All authors have read and agreed to the published version of the manuscript.

Funding

This study was funded by the Natural Science Foundation of Xinjiang Uygur Autonomous Region (2022D01C399, 20243122520), Talent Program of Xinjiang Uygur Autonomous Region (5105240150b) and National Natural Science Foundation of China (32401348).

Data Availability Statement

Data are contained within the article.

Acknowledgments

We sincerely thank all contributors to this study, and we are particularly grateful to the anonymous reviewers and the handling editor for their insightful comments and constructive suggestions, which have significantly improved the quality of our manuscript.

Conflicts of Interest

The authors declare no conflicts of interest.

Abbreviations

The following abbreviations are used in this manuscript:
NgrNitrogen concentration in green leaves
PgrPhosphorus concentration in green leaves
NsenNitrogen concentration in senescent leaves
PsenPhosphorus concentration in senescent leaves
N:PgrDenotes the ratio of nitrogen to phosphorus concentration in green leaves
N:PsenDenotes the ratio of nitrogen to phosphorus concentration in senescent leaves
NRENitrogen resorption efficiency
PREPhosphorus resorption efficiency
NRE:PREDenotes the ratio of nitrogen to phosphorus resorption efficiency
MATMean annual temperature
MAPMean annual precipitation
LatLatitude
AltAltitude

Appendix A

Table A1. Geographical location information of the sampling sites.
Sampling SiteLongitude (°E)Latitude (°N)Altitude (m)MAT (°C)MAP (mm)
182.5944.762359.46187.43
282.8944.6725910.35185.31
382.7337.07141012.7544.57
488.2539.0189311.2329.39
576.7139.50120912.9590.10
680.2840.74105412.0164.27
780.3940.64104612.0664.88
880.9937.00137513.3645.25
985.5638.32118511.9430.59
1093.2742.8976610.6351.12
1195.0243.7348710.6727.25
1287.4847.104956.20140.06
1384.2141.2593512.2886.38
1493.5542.7875010.8140.16
1590.6844.9910447.3099.96
1682.5745.1731410.28192.41
1776.9638.03141113.5144.32
1884.8344.693418.50161.18
1986.2144.284978.22156.30
2079.9737.58129713.3938.38
2177.2538.58121413.3050.45
2284.8745.563369.73127.70
2384.9044.444639.46176.13
2482.7741.2097812.37123.37
2581.7136.87139713.2046.38
2682.6541.59101711.64154.27
2781.9841.71119311.03160.26
2882.5041.4599812.23141.46
2976.9638.03141113.5144.09
3083.0241.74110812.02163.01
Note: MAT represents mean annual temperature, and MAP represents mean annual precipitation.

References

  1. Killingbeck, K.T. Nutrients in Senesced Leaves: Keys to the Search for Potential Resorption and Resorption Proficiency. Ecology 1996, 77, 1716–1727. [Google Scholar] [CrossRef]
  2. Urbina, I.; Grau, O.; Sardans, J.; Margalef, O.; Peguero, G.; Asensio, D.; Llusia, J.; Ogaya, R.; Gargallo-Garriga, A.; Van Langenhove, L.; et al. High foliar K and P resorption efficiencies in old-growth tropical forests growing on nutrient-poor soils. Ecol. Evol. 2021, 11, 8969–8982. [Google Scholar] [CrossRef] [PubMed]
  3. Reed, S.C.; Townsend, A.R.; Davidson, E.A.; Cleveland, C.C. Stoichiometric patterns in foliar nutrient resorption across multiple scales. New Phytol. 2012, 196, 173–180. [Google Scholar] [CrossRef] [PubMed]
  4. Song, D.; Liu, S.; Fan, L.; Yang, J.; Li, H.; Xia, Y.; Li, Y. Nutrient stoichiometric and resorption characteristics of the petals of four common urban greening Rosaceae tree species. Front. Plant Sci. 2023, 14, 1201759. [Google Scholar] [CrossRef]
  5. Drenovsky, R.E.; Pietrasiak, N.; Short, T.H. Global temporal patterns in plant nutrient resorption plasticity. Glob. Ecol. Biogeogr. 2019, 28, 728–743. [Google Scholar] [CrossRef]
  6. Chen, H.; Reed, S.C.; Lu, X.; Xiao, K.; Wang, K.; Li, D. Coexistence of multiple leaf nutrient resorption strategies in a single ecosystem. Sci. Total Environ. 2021, 772, 144951. [Google Scholar] [CrossRef]
  7. Zhang, Y.; Yang, G.-S.; Shi, F.-X.; Mao, R. Biomass allocation between leaf and stem regulates community-level plant nutrient resorption efficiency response to nitrogen and phosphorus additions in a temperate wetland of Northeast China. J. Plant Ecol. 2021, 14, 58–66. [Google Scholar] [CrossRef]
  8. Zhang, J.; Yu, W.; Wang, Y.; Huang, Z.; Liu, G. Effects of climate, soil, and leaf traits on nutrient resorption efficiency and proficiency of different plant functional types across arid and semiarid regions of Northwest China. BMC Plant Biol. 2024, 24, 1093. [Google Scholar] [CrossRef]
  9. Xu, M.; Zhu, Y.; Zhang, S.; Feng, Y.; Zhang, W.; Han, X. Global scaling the leaf nitrogen and phosphorus resorption of woody species: Revisiting some commonly held views. Sci. Total Environ. 2021, 788, 147807. [Google Scholar] [CrossRef]
  10. Sun, X.; Li, D.; Lu, X.; Fang, Y.; Ma, Z.; Wang, Z.; Chu, C.; Li, M.; Chen, H. Widespread controls of leaf nutrient resorption by nutrient limitation and stoichiometry. Funct. Ecol. 2023, 37, 1653–1662. [Google Scholar] [CrossRef]
  11. Yu, L.-L.; Zhang, X.-H.; Shi, F.-X.; Mao, R. Effect of shrub encroachment on leaf nutrient resorption in temperate wetlands in the Sanjiang Plain of Northeast China. Ecol. Process. 2022, 11, 67. [Google Scholar] [CrossRef]
  12. Zhu, D.; Peng, S.; Wang, J.; Hui, D. Responses of Nutrient Resorption to Human Disturbances in Phoebe bournei Forests. Forests 2022, 13, 905. [Google Scholar] [CrossRef]
  13. Shao, J.; Chen, X.-P.; Li, J.-L.; Hu, D.-D.; Wang, M.-T.; Zhong, Q.-L.; Cheng, D.-L. Nitrogen and phosphorus contents and resorption efficiency of thirty broadleaved woody plants in Yangjifeng, Jiangxi, China. Chin. J. Appl. Ecol. 2021, 32, 1193–1200. [Google Scholar] [CrossRef]
  14. Zhang, M.; Luo, Y.; Yan, Z.; Chen, J.; Eziz, A.; Li, K.; Han, W. Resorptions of 10 mineral elements in leaves of desert shrubs and their contrasting responses to aridity. J. Plant Ecol. 2019, 12, 358–366. [Google Scholar] [CrossRef]
  15. Du, E.Z.; Terrer, C.; Pellegrini, A.F.A.; Ahlström, A.; Van Lissa, C.J.; Zhao, X.; Xia, N.; Wu, X.H.; Jackson, R.B. Global patterns of terrestrial nitrogen and phosphorus limitation. Nat. Geosci. 2020, 13, 221–226. [Google Scholar] [CrossRef]
  16. Liu, X.; Wang, Y.; Fu, W.; Yuan, Z.; Yu, Q.; Peng, C.; Koerner, S.E.; Guo, L. Growing season temperature and precipitation affect nutrient resorption in herbaceous species through a foliar stoichiometric control strategy. Plant Soil. 2023, 493, 45–60. [Google Scholar] [CrossRef]
  17. Wang, Z.; Fan, Z.; Zhao, Q.; Wang, M.; Ran, J.; Huang, H.; Niklas, K.J. Global Data Analysis Shows That Soil Nutrient Levels Dominate Foliar Nutrient Resorption Efficiency in Herbaceous Species. Front. Plant Sci. 2018, 9, 1431. [Google Scholar] [CrossRef]
  18. Yao, S.; Wang, J.; Huang, W.; Jiao, P.; Peng, C.; Li, Y.; Song, S. Adaptation Strategies of Populus euphratica to Arid Environments Based on Leaf Trait Network Analysis in the Mainstream of the Tarim River. Forests 2024, 15, 437. [Google Scholar] [CrossRef]
  19. Yang, X.; Ye, M.; Munire, M. Structural parameter acquisition of Populus euphratica by WorldView-2 remote sensing image. Arid Zone Res. 2021, 38, 1659–1667. [Google Scholar]
  20. Wu, Z.; Jiang, Z.; Li, Z.; Jiao, P.; Zhai, J.; Liu, S.; Han, X.; Zhang, S.; Sun, J.; Gai, Z.; et al. Multi-omics analysis reveals spatiotemporal regulation and function of heteromorphic leaves in Populus. Plant Physiol. 2023, 192, 188–204. [Google Scholar] [CrossRef]
  21. Li, X.; Zhai, J.; Song, Z.; Li, Y.; Li, Z. Sex differences in morphological and stoichiometric characteristics of Populus euphratica Oliv. branches and leaves. Chin. J. Ecol. 2023, 42, 1586–1594. [Google Scholar] [CrossRef]
  22. Guo, X.F.; Zhai, J.T.; Zhang, S.H.; Li, Z.J. Relationship of changes in the stem and leaf morphology, nutrient and endogenous hormone contents and flower bud number of Populus euphratica Oliv. Appl. Ecol. Environ. Res. 2022, 20, 3873–3891. [Google Scholar] [CrossRef]
  23. Zhou, H.; Chen, Y.; Zhu, C.; Li, Z.; Fang, G.; Li, Y.; Fu, A. Climate change may accelerate the decline of desert riparian forest in the lower Tarim River, Northwestern China: Evidence from tree-rings of Populus euphratica. Ecol. Indic. 2020, 111, 105997. [Google Scholar] [CrossRef]
  24. Fan, X.; Hao, X.; Zhang, S.; Zhao, Z.; Zhang, J.; Li, Y. Populus euphratica counteracts drought stress through the dew coupling and root hydraulic redistribution processes. Ann. Bot. 2023, 131, 451–461. [Google Scholar] [CrossRef]
  25. Zhang, X.; Zheng, Y. Variation in leaf carbon, nitrogen, and phosphorus stoichiometric characteristics of Populus euphratica along a vertical riverbank gradient and associated environmental explanation in a desert riparian area in China. Chin. J. Appl. Environ. Biol. 2023, 29, 1093–1099. [Google Scholar]
  26. Liu, Y.; Han, Z.J.; Su, M.X.; Zhang, M. Transcriptomic Profile Analysis of Populus talassica × Populus euphratica Response and Tolerance Under Salt Stress Conditions. Genes 2022, 13, 1032. [Google Scholar] [CrossRef]
  27. Han, X.L.; Qiu, C.; Sun, J.H.; Xu, J.D.; Zhang, X.; Zhai, J.T.; Zhang, S.H.; Wu, Z.H.; Li, Z.J. Identification of AP2/ERF gene family of Salicaceae and their response to salt stress, abscisic acid, and gibberellic acid in Populus euphratica seeds. Biol. Plant. 2023, 67, 88–99. [Google Scholar] [CrossRef]
  28. Luo, Y.; Chen, Y.; Peng, Q.; Li, K.; Mohammat, A.; Han, W. Nitrogen and phosphorus resorption of desert plants with various degree of propensity to salt in response to drought and saline stress. Ecol. Indic. 2021, 125, 107488. [Google Scholar] [CrossRef]
  29. Bagedeng; Xia, G.; Lin, T.; Xu, Z.; Wang, Y. Analysis of nutrient resorption efficiency and homeostasis of four tree species in Kanas natural forest, Xinjiang, China. Front. Ecol. Evol. 2022, 10, 1046444. [Google Scholar] [CrossRef]
  30. Vergutz, L.; Manzoni, S.; Porporato, A.; Novais, R.F.; Jackson, R.B. Global resorption efficiencies and concentrations of carbon and nutrients in leaves of terrestrial plants. Ecol. Monogr. 2012, 82, 205–220. [Google Scholar] [CrossRef]
  31. Peng, S.; Ding, Y.; Liu, W.; Li, Z. 1 km monthly temperature and precipitation dataset for China from 1901 to 2017. Earth Syst. Sci. Data 2019, 11, 1931–1946. [Google Scholar] [CrossRef]
  32. Kobe, R.K.; Lepczyk, C.A.; Iyer, M. Resorption efficiency decreases with increasing green leaf nutrients in a global data set. Ecology 2005, 86, 2780–2792. [Google Scholar] [CrossRef]
  33. Pugnaire, F.I.; Chapin, F.S. Controls over Nutrient Resorption from Leaves of Evergreen Mediterranean Species. Ecology 1993, 74, 124–129. [Google Scholar] [CrossRef]
  34. Yuan, Z.Y.; Chen, H.Y.H. Global-scale patterns of nutrient resorption associated with latitude, temperature and precipitation. Glob. Ecol. Biogeogr. 2009, 18, 11–18. [Google Scholar] [CrossRef]
  35. Koerselman, W.; Meuleman, A.F.M. The vegetation N:P ratio: A new tool to detect the nature of nutrient limitation. J. Appl. Ecol. 1996, 33, 1441–1450. [Google Scholar] [CrossRef]
  36. Yan, Z.; Tian, D.; Han, W.; Tang, Z.; Fang, J. An assessment on the uncertainty of the nitrogen to phosphorus ratio as a threshold for nutrient limitation in plants. Ann. Bot. 2017, 120, 937–942. [Google Scholar] [CrossRef]
  37. Han, W.; Tang, L.; Chen, Y.; Fang, J. Relationship Between the Relative Limitation and Resorption Efficiency of Nitrogen vs Phosphorus in Woody Plants. PLoS ONE 2013, 8, e83366. [Google Scholar] [CrossRef]
  38. Augusto, L.; Achat, D.L.; Jonard, M.; Vidal, D.; Ringeval, B. Soil parent material—A major driver of plant nutrient limitations in terrestrial ecosystems. Glob. Chang. Biol. 2017, 23, 3808–3824. [Google Scholar] [CrossRef]
  39. Zheng, C.; Wan, L.; Wang, R.; Wang, G.; Dong, L.; Yang, T.; Yang, Q.; Zhou, J. Effects of rock lithology and soil nutrients on nitrogen and phosphorus mobility in trees in non-karst and karst forests of southwest China. For. Ecol. Manag. 2023, 548, 121392. [Google Scholar] [CrossRef]
  40. Deng, M.; Liu, L.; Jiang, L.; Liu, W.; Wang, X.; Li, S.; Yang, S.; Wang, B. Ecosystem scale trade-off in nitrogen acquisition pathways. Nat. Ecol. Evol. 2018, 2, 1724–1734. [Google Scholar] [CrossRef]
  41. Güsewell, S. Nutrient resorption of wetland graminoids is related to the type of nutrient limitation. Funct. Ecol. 2005, 19, 344–354. [Google Scholar] [CrossRef]
  42. Bai, K.; Mo, L.; Liu, M.; Zhang, D.; He, C.; Wan, X.; Jiang, D. Nutrient resorption patterns of evergreen and deciduous tree species at different altitudes on Mao’er Mountain, Guangxi. Acta Ecol. Sin. 2015, 35, 5776–5787. [Google Scholar] [CrossRef]
  43. Sophia, G.; Caldararu, S.; Stocker, B.D.; Zaehle, S. Leaf habit drives leaf nutrient resorption globally alongside nutrient availability and climate. Biogeosciences 2024, 21, 4169–4193. [Google Scholar] [CrossRef]
  44. Ning, Q.; Li, S.; Jiang, L.; Tao, J.; Chen, H.; Liu, C.; Yang, X. Characteristics and factors influencing foliar nutrient resorption in plants. Chin. J. Appl. Environ. Biol. 2017, 23, 811–817. [Google Scholar]
  45. Brant, A.N.; Chen, H.Y.H. Patterns and Mechanisms of Nutrient Resorption in Plants. Crit. Rev. Plant Sci. 2015, 34, 471–486. [Google Scholar] [CrossRef]
  46. He, M.-S.; Luo, Y.; Peng, Q.-w.; Yang, S.-q.; Li, K.-h.; Han, W.-x. Leaf C:N:P stoichiometry of 67 plant species and its relations with climate factors across the deserts in Xinjiang, China. Yingyong Shengtai Xuebao 2019, 30, 2171–2180. [Google Scholar] [CrossRef]
  47. Li, X.; Yuan, Z.; Jiao, F. Response of Nutrient Resorption of Herbs, Shrubs and Trees to Temperature and Precipitation in China. Res. Soil Water Conserv. 2023, 30, 87–92. [Google Scholar] [CrossRef]
  48. Xu, M.; Zhu, X.; Chen, S.; Pang, S.; Liu, W.; Gao, L.; Yang, W.; Li, T.; Zhang, Y.; Luo, C.; et al. Distinctive pattern and mechanism of precipitation changes affecting soil microbial assemblages in the Eurasian steppe. iScience 2022, 25, 103893. [Google Scholar] [CrossRef]
  49. Touche, J.; Calvaruso, C.; De Donato, P.; Turpault, M.P. Drought events influence nutrient canopy exchanges and green leaf partitioning during senescence in a deciduous forest. For. Ecosyst. 2024, 11, 100173. [Google Scholar] [CrossRef]
  50. Touche, J.; Calvaruso, C.; De Donato, P.; Turpault, M.P. Five successive years of rainfall exclusion induce nutritional stress in a mature beech stand. For. Ecol. Manag. 2022, 507, 119987. [Google Scholar] [CrossRef]
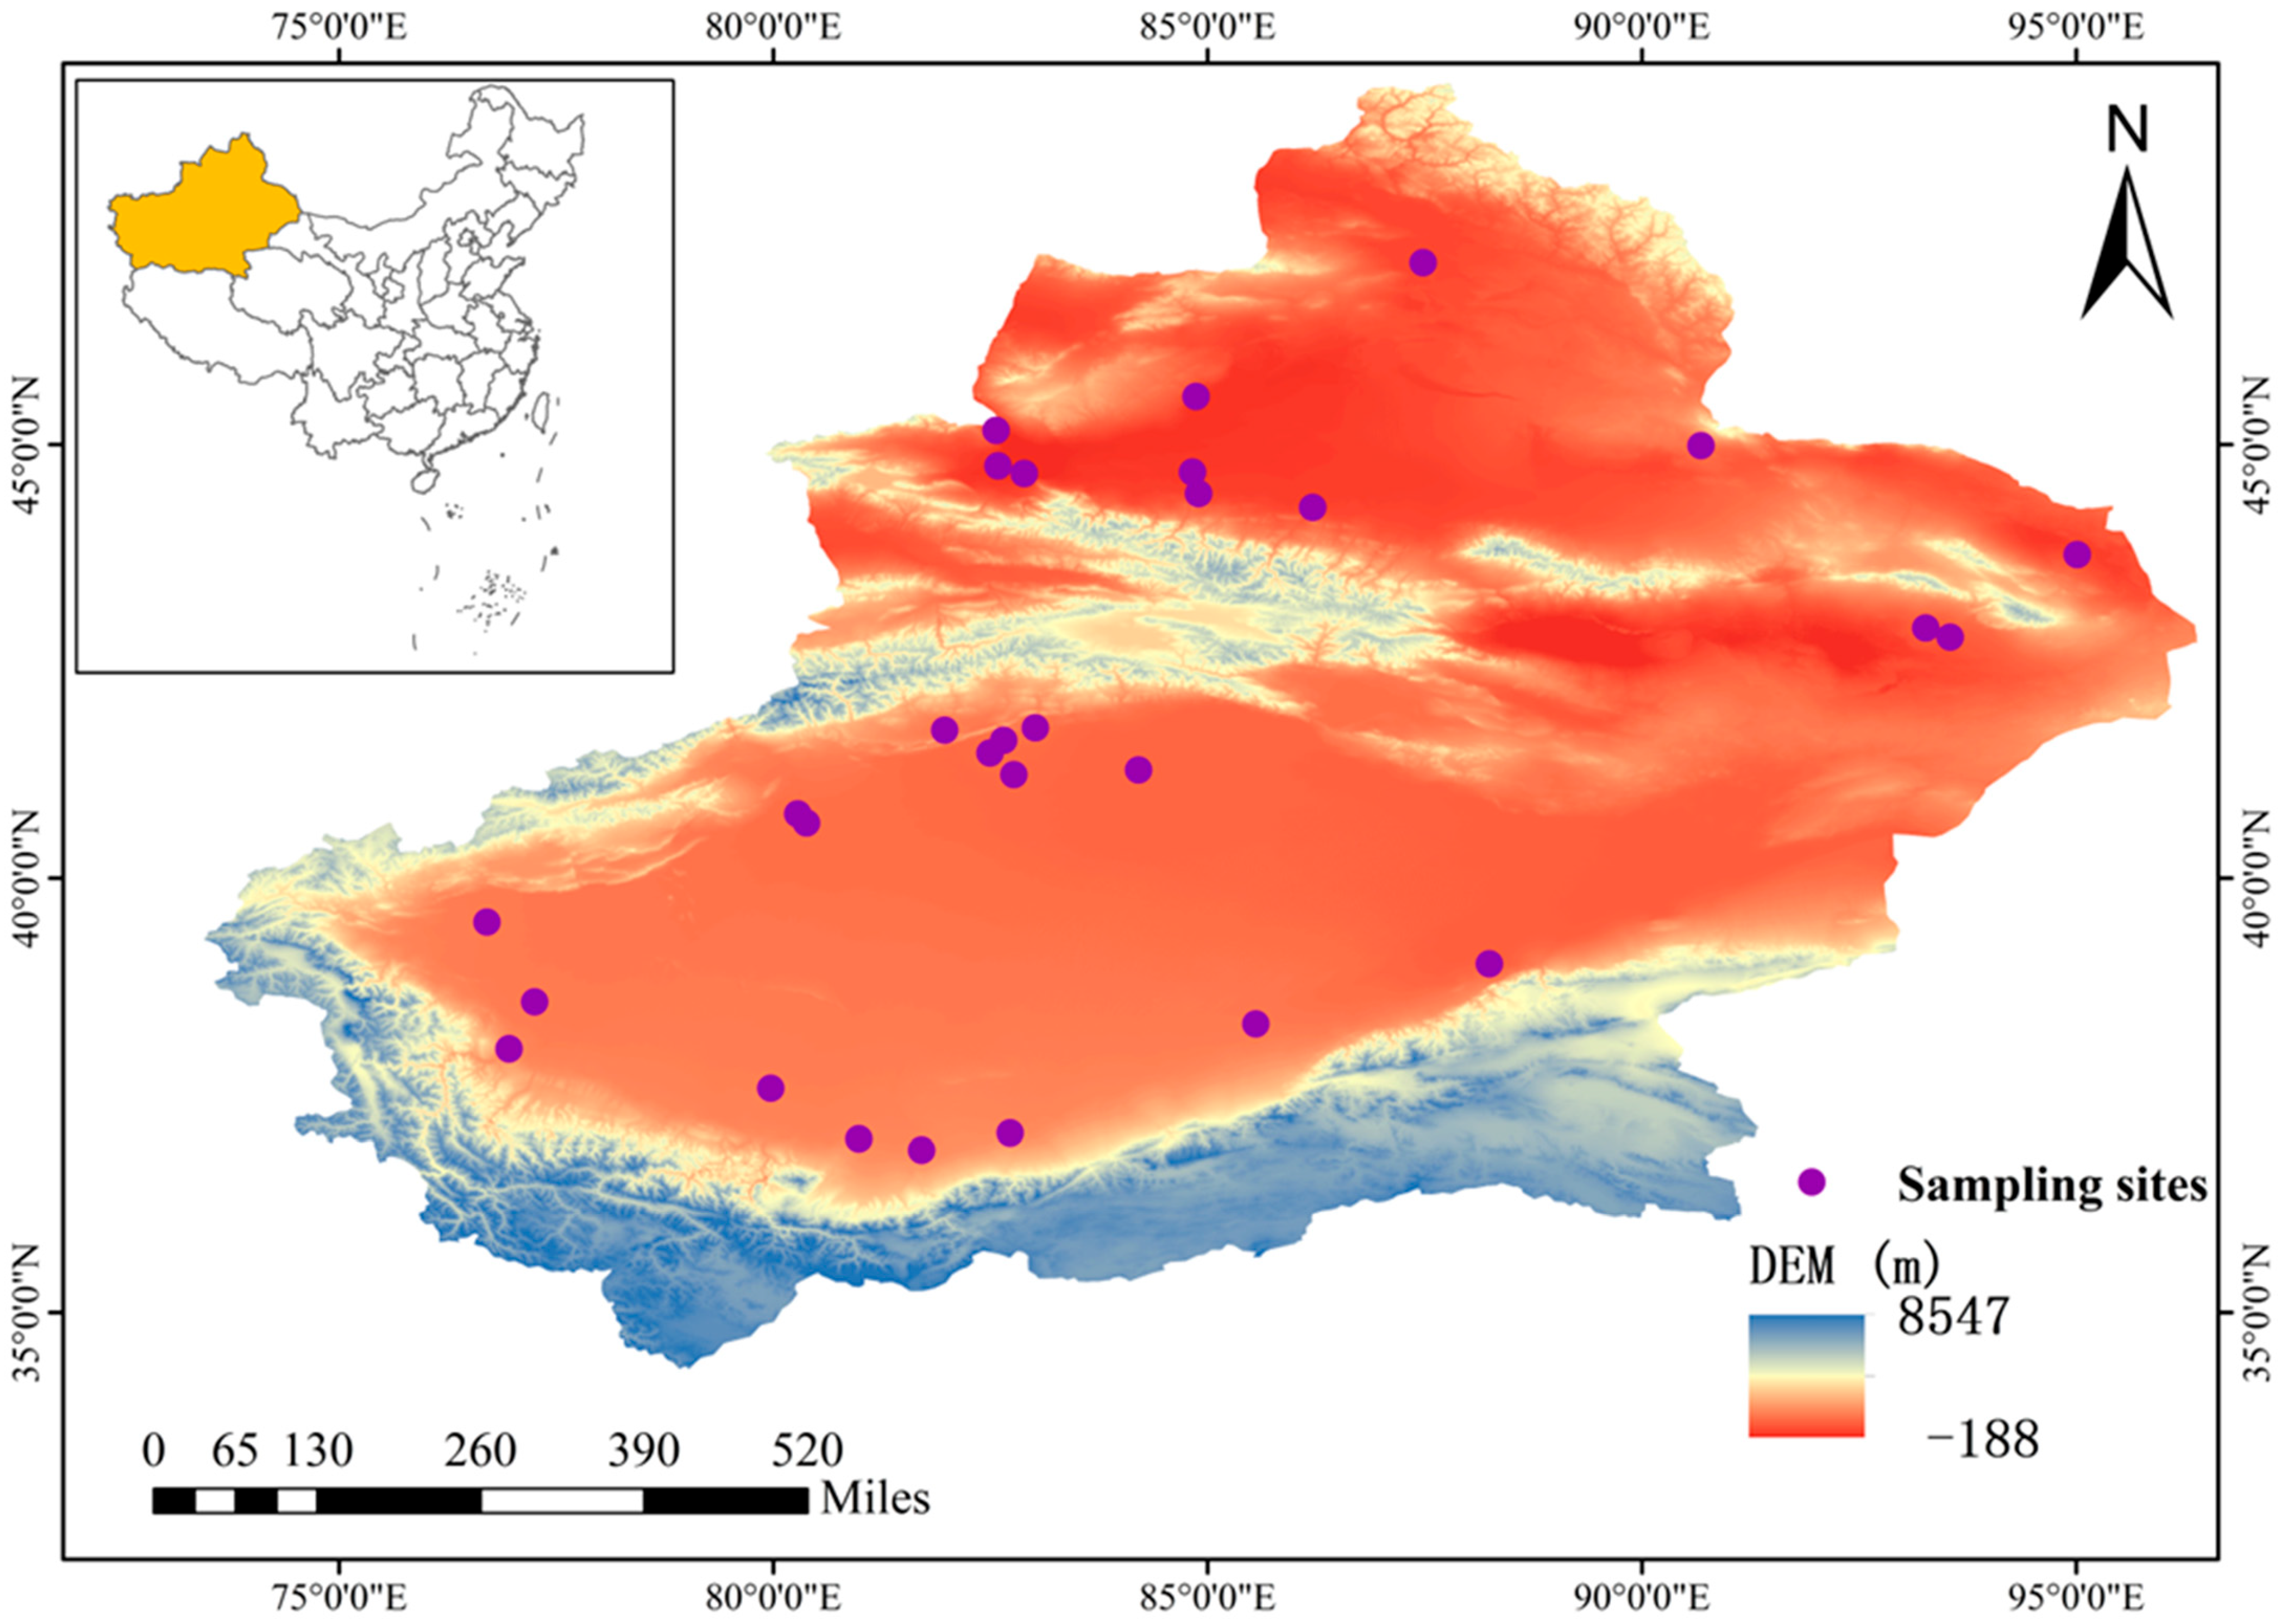
Figure 1. Location of the study area. The sampling sites in the figure represent the leaf sample collection sites in this study.
Forests 16 00629 g001
Figure 2. Correlation between leaf nutrient resorption and nutrient content. “*” represents a p value that is significant at the 0.05 level, and “**” represents a p value that is significant at the 0.01 level. Ngr and Pgr, respectively, represent nitrogen and phosphorus concentrations in green leaves; Nsen and Psen, respectively, represent nitrogen and phosphorus concentrations in senescent leaves; N:Pgr and N:Psen, respectively, denote the ratios of nitrogen to phosphorus concentrations in green leaves and senescent leaves; NRE and PRE, respectively, represent nitrogen and phosphorus resorption efficiency; and NRE:PRE denotes the ratio of nitrogen to phosphorus resorption efficiency.
Forests 16 00629 g002
Figure 3. Relationships between nitrogen resorption efficiency and latitude (a), altitude (b), mean annual temperature (c) and mean annual precipitation (d). NRE represents nitrogen resorption efficiency; MAT and MAP represent mean annual temperature and precipitation.
Forests 16 00629 g003
Figure 4. Relationships between phosphorus resorption efficiency and latitude (a), altitude (b), mean annual temperature (c) and mean annual precipitation (d). PRE represents phosphorus resorption efficiency; MAT and MAP represent mean annual temperature and precipitation.
Forests 16 00629 g004
Figure 5. Relationships between the ratio of nitrogen and phosphorus resorption efficiency and latitude (a), altitude (b), mean annual temperature (c) and mean annual precipitation (d). NRE:PRE denotes the ratio of nitrogen to phosphorus resorption efficiency; MAT and MAP represent mean annual temperature and precipitation.
Forests 16 00629 g005
Figure 6. Redundancy analysis plotting of nutrient resorption and environmental factors. NRE and PRE, respectively, represent nitrogen and phosphorus resorption efficiency; NRE:PRE denotes the ratio of nitrogen to phosphorus resorption efficiency. Lat, Alt, MAT and MAP represent latitude, altitude, mean annual temperature and mean annual precipitation, respectively.
Forests 16 00629 g006
Table 1. Nutrient status of Populus euphratica leaves.
VariablesMaximumMinimumAverageStandard Deviation
Green leavesN (g/kg)26.627.5215.374.42
P (g/kg)1.580.570.960.26
N:P46.777.4817.408.08
Senescent leavesN (g/kg)7.721.624.351.61
P (g/kg)0.990.180.420.18
N:P28.372.5311.996.12
NRE (%)90.8565.4677.147.03
PRE (%)82.3141.7465.1011.00
NRE:PRE1.810.821.230.27
Note: N and P, respectively, represent nitrogen and phosphorus nutrient concentrations in leaves, N:P denotes the ratio of nitrogen to phosphorus nutrient concentrations, NRE and PRE, respectively, represent nitrogen and phosphorus resorption efficiency and NRE:PRE denotes the ratio of nitrogen to phosphorus resorption efficiency.
Table 2. Redundancy analysis of nutrient resorption and environmental factors.
Ordination AxesAxis 1Axis 2Axis 3Axis 4
Explanatory power of quantitative characteristics0.420.000.000.40
Cumulative explanatory power of quantitative characteristics42.442.5142.5482.92
Correlation between quantitative characteristics and environmental factors0.780.060.210
Cumulative explanation of the relationship between quantitative characteristics and environmental factors99.6799.94100100
Table 3. Ranking of environmental factor importance.
Importance RankingEnvironmental FactorExplanatory Power (%)Contribution Efficiency (%)F-Valuep-Value
1MAP36.285.115.90.002
2MAT6.214.52.90.07
3Lat0.10.3<0.10.96
4Alt<0.10.1<0.10.986
Note: MAP and MAT represent mean annual precipitation and mean annual temperature. Lat and Alt represent latitude and altitude, respectively.
Disclaimer/Publisher’s Note: The statements, opinions and data contained in all publications are solely those of the individual author(s) and contributor(s) and not of MDPI and/or the editor(s). MDPI and/or the editor(s) disclaim responsibility for any injury to people or property resulting from any ideas, methods, instructions or products referred to in the content.