Article

A Simulation of a Suitable Habitat for Acer yangbiense and Cinnamomum chago Under Climate Change

1
College of Forestry, Southwest Forestry University, Kunming 650024, China
2
Key Laboratory of Conservation and Utilization of Southwest Mountain Forest Resources, Ministry of Education, Kunming 650024, China
*
Author to whom correspondence should be addressed.
Forests 2025, 16(4), 621; https://doi.org/10.3390/f16040621
Submission received: 27 February 2025 / Revised: 22 March 2025 / Accepted: 28 March 2025 / Published: 2 April 2025
(This article belongs to the Section Forest Biodiversity)

Abstract

:
Species migration or extinction events may occur on a large scale with the intensification of climate change. Plant Species with Extremely Small Populations (PSESP) are more sensitive to climate change as compared to other plants. To date, the potential effect of climate change on Acer yangbiense and Cinnamomum chago, both of which belong to PSESP, remain unknown. In this study, we modeled the distribution dynamics of A. yangbiense and C. chago spanning from the Last Glacial Maximum (LGM) to the end of the 21st century based on the MaxEnt model, optimized using the Kuenm package. The results revealed that the parameter settings of the optimal models were RM (regularization multiplier) = 3.5, FC (feature combination) = QP, and RM = 2, FC = QPT. A. yangbiense and C. chago had AUCs of 0.982 and 0.993, respectively, indicating that the model predictions are highly accurate while effectively balancing complexity and avoiding overfitting. The distribution of A. yangbiense and C. chago was mostly influenced by the precipitation of the driest quarter (bio17) and the min temperature of the coldest month (bio6). From the LGM to the present, the total suitable areas of A. yangbiense and C. chago initially declined before showing a subsequent increase, but it is projected to experience significant reductions in the future, with decreases of 32.98%–64.99% and 63.48%–99.49%, respectively. The distribution centroids of A. yangbiense and C. chago showed a migration trend from south to north from the LGM to the present, and this trend is expected to continue. To enhance the resilience of A. yangbiense and C. chago to meet the challenges of climate change in the future, we proposed that the introduction and artificial cultivation of these species should be carried out in Baoshan, Dali, and Nujiang in the northwest of Yunnan Province, which were the areas with high heat values, so as to expand the populations gradually.

1. Introduction

Climate change is an important factor affecting the survival of plants and one of the main threats to biodiversity protection in the future [1]. Studies have shown that many plants will show a trend of decreasing their suitable distribution range and migrating to higher altitudes under future climate scenarios, and some may even face the risk of extinction [1,2]. In particular, Plant Species with Extremely Small Populations (PSESP) exhibit heightened sensitivity to climate change due to their narrow distribution, population isolation, and reproductive barriers [3,4]. Many species with extremely small populations are endemic and serve as keystone species within their respective ecosystems, playing an irreplaceable role in maintaining ecosystem functions. However, their extremely small population characteristics render them highly susceptible to the dual threats of climate change and habitat degradation [5,6]. Therefore, accurately predicting the spatiotemporal changes in the suitable habitats of PSESP is a critical prerequisite for formulating scientifically sound conservation strategies [7,8].
Species Distribution Models (SDMs) provide an effective tool for analyzing the relationship between species distribution and environmental factors [9]. By integrating known occurrence records with relevant environmental factors, these models utilize specific algorithms to predict species distributions and assess their potential reactions to changing climatic conditions [10,11]. MaxEnt (Maximum Entropy Model) is a machine learning method widely used in SDM. It predicts species distributions by maximizing entropy. Compared to other models, MaxEnt offers advantages such as flexibility, high accuracy, effective simulation capabilities, excellent visualization results, and the requirement of only species presence data [12,13]. Researchers have successfully used MaxEnt to predict the responses of many endangered plant species to climate change, including Magnolia wufengensis [14], Abies chensiensis [15], and Firmiana kwangsiensis [16]. These research efforts have established a foundational framework for safeguarding these threatened species, offering critical insights and evidence-based strategies for their conservation.
Acer yangbiense Y. S. Chen and Q. E. Yang and Cinnamomum chago B. S. Sun and H. L. Zhao are Plant Species with Extremely Small Populations (PSESP) endemic to China, belonging to the families Sapindaceae and Lauraceae, respectively. Aceryangbiense has significant scientific research value due to its unique characteristics and endangered status. Five mature individuals were reported at its first discovery [17]. Cinnamomum chago has important economic and systematic values [18]. Field survey results indicate that the distribution points of the two species are primarily concentrated in Yunlong County and Yangbi County of Dali Prefecture, Yunnan Province, with most located outside the nature reserve [19,20]. Previous studies have indicated that the conservation of both species primarily relies on in situ and ex situ protection measures, yet their wild populations still face challenges, such as low population and individual numbers, narrow distribution range, habitat fragmentation, species bottlenecks, and serious human interference [17,18]. To date, the research on A. yangbiense and C. chago has mainly focused on biological characteristics [18,20], protective genome [17,21], germplasm resource investigation [20,22], and nutritional analysis [23]. However, studies on their potential distributions have not yet been reported.
It is noteworthy that although the current distribution areas of A. yangbiense and C. chago are geographically close, they belong to different families and genera, suggesting that their niche characteristics may differ significantly. This study aims to reconstruct their historical suitable habitat patterns and predict future distribution changes under different climate scenarios using the MaxEnt model, with the following objectives: (1) to reveal the driving mechanisms of key environmental factors on the distributions of the two species; (2) to quantify the potential impacts of climate change on their suitable habitats; and (3) to analyze the niche differentiation process by comparing the response differences between the two species. The results will provide theoretical support for the adaptive management of PSESP and offer new perspectives for understanding the heterogeneity of species’ responses to climate change.

2. Materials and Methods

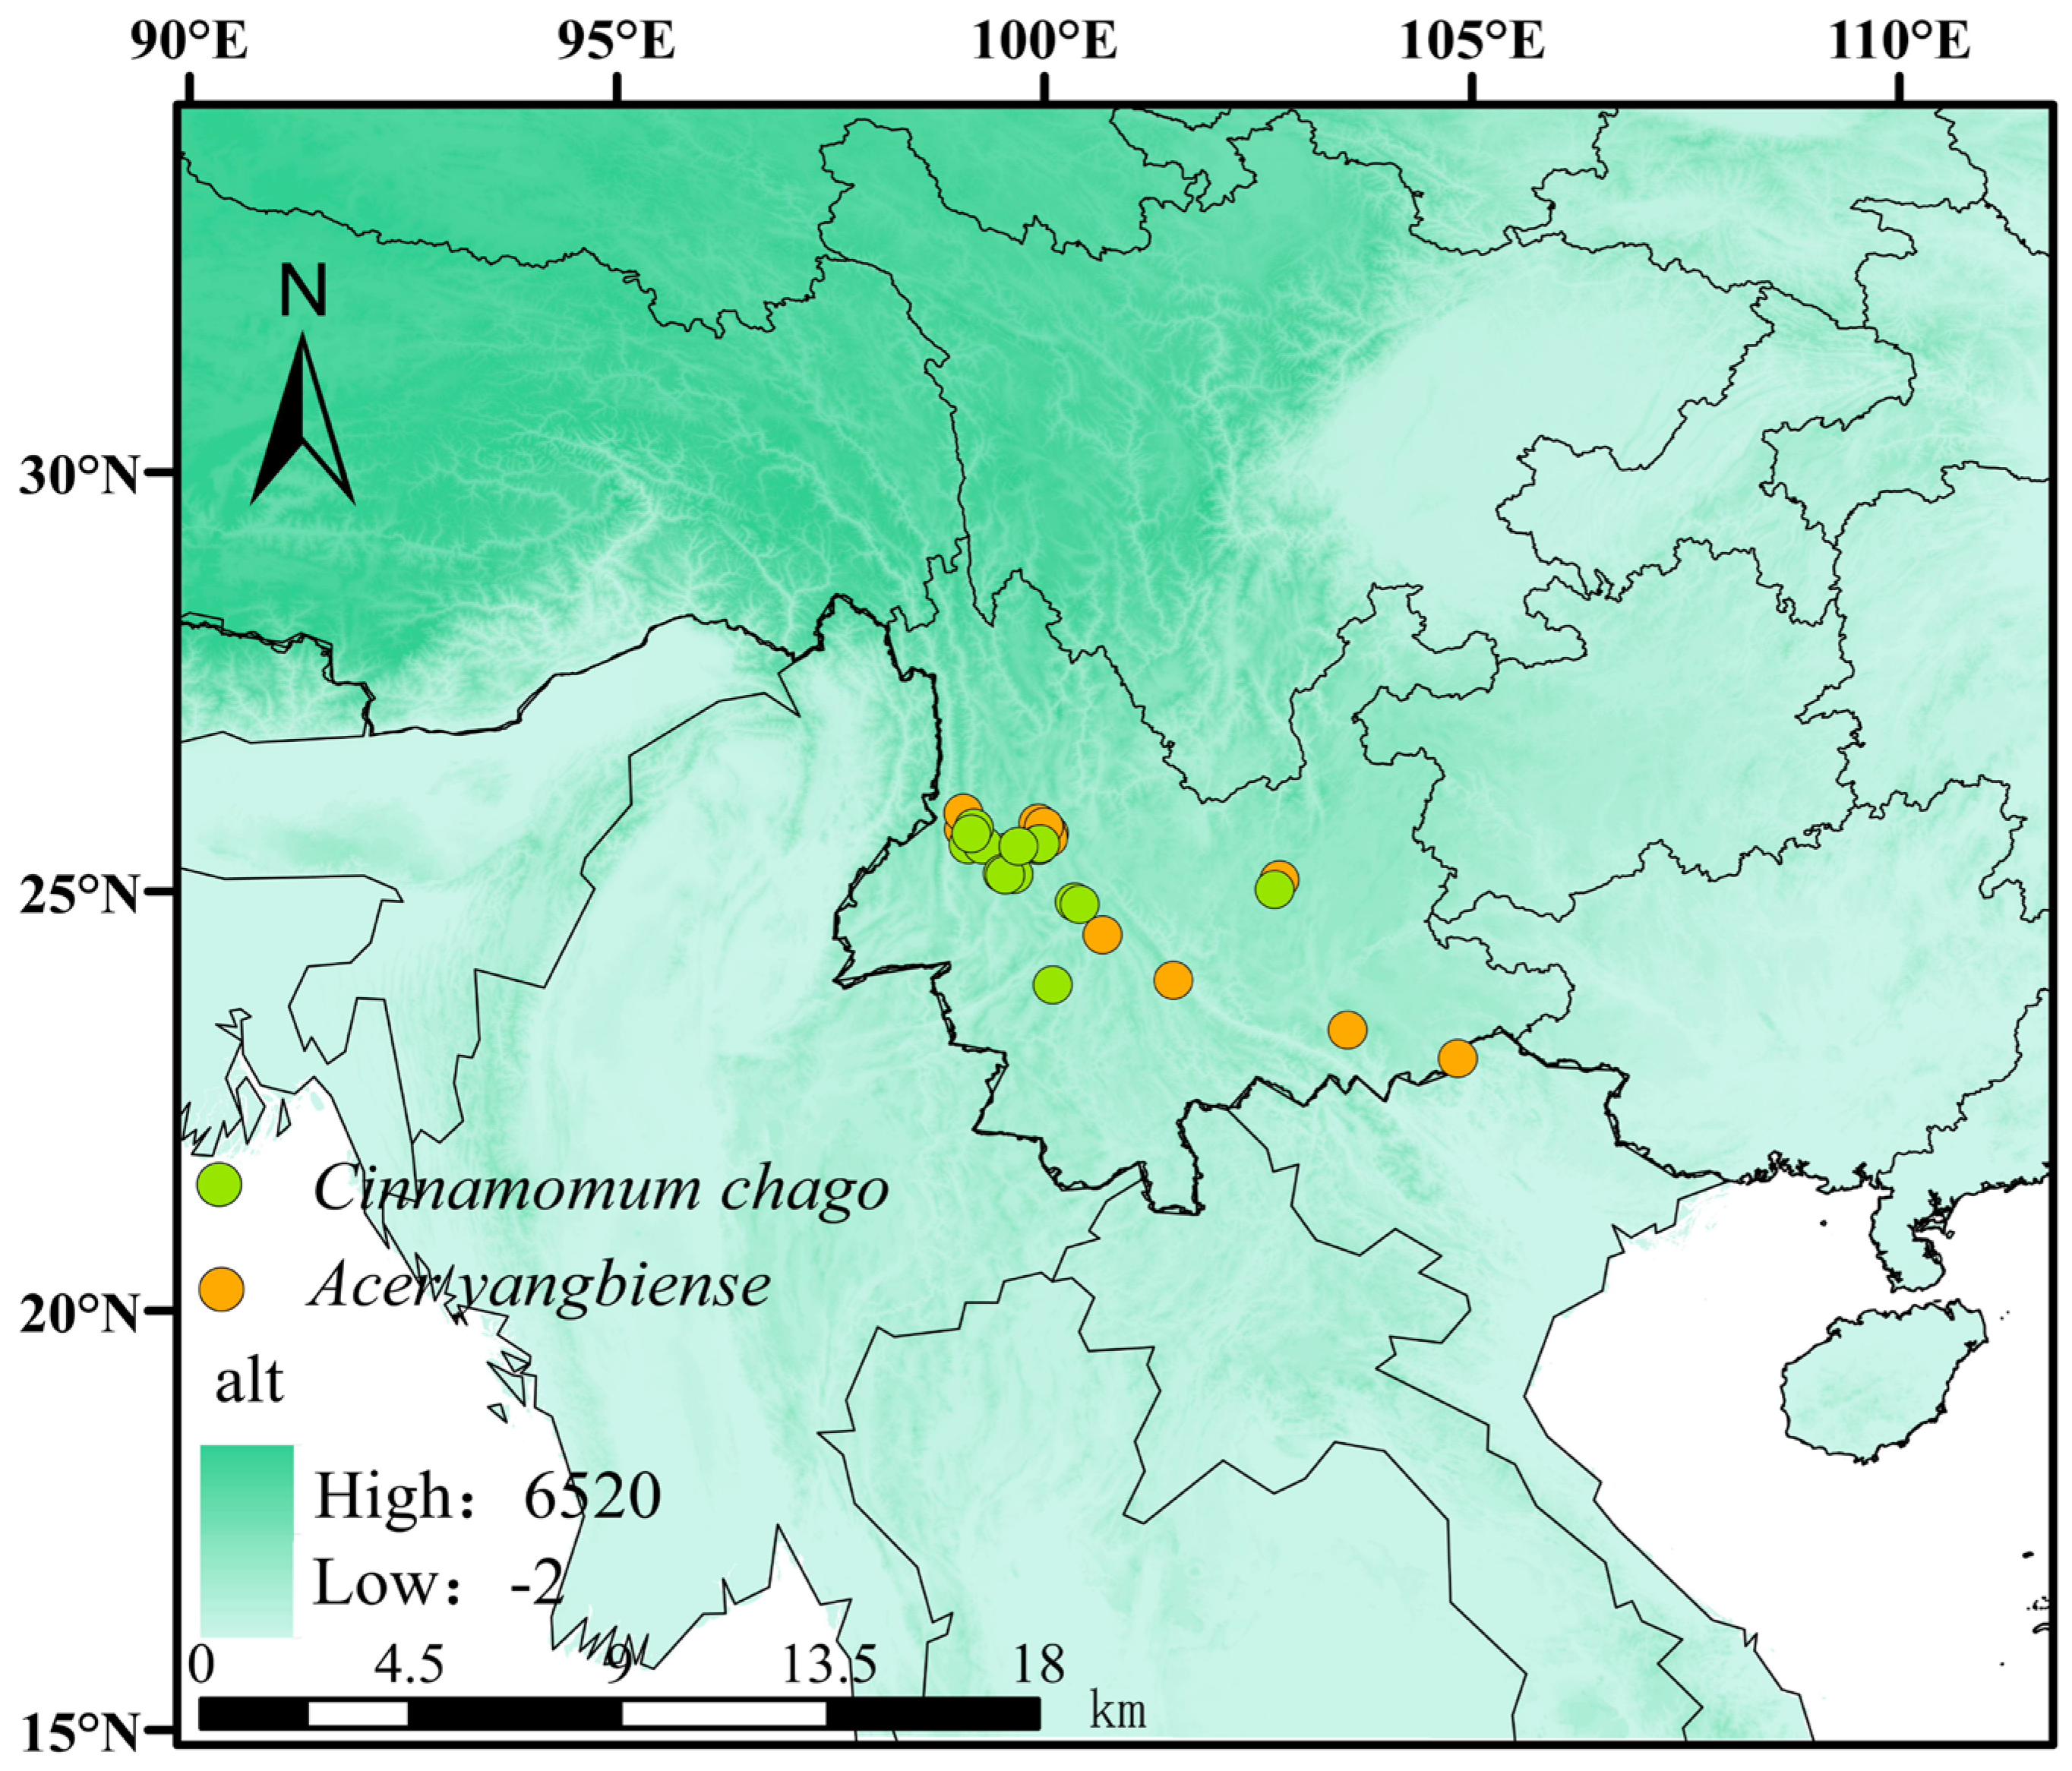
2.1. Research Area and Species Occurrence Data

Taking into account the glacial and future distributions, we buffered the existing distribution points of A. yangbiense and C. chago outward by about 300 km as the research area (about 15° N–35° N, 90° E–112° E) to cover all possible habitable ranges of both species from the past to the future (Figure 1).
Through a comprehensive collection of field investigation records of A. yangbiense and C. chago, we obtained the detailed geographical locations of the natural populations found so far, and the distribution points of A. yangbiense and C. chago were 25 and 18, respectively. To mitigate sampling errors caused by densely clustered distribution points and to improve the predictive performance, we used ENMTools package (version 1.1.0) to filter species distribution data and eliminate redundant points that were repeated and located in the same grid of environmental variables [24]. Ultimately, A. yangbiense and C. chago had 18 and 13 effective distribution points, respectively, which were used to construct Species Distribution Models (Figure 1).

2.2. Predictive Variables

Environmental variables affecting plant distribution include climate, soil, topography, and UV-B radiation factors [25,26,27]. Hence, we collected 33 environmental variables from public online databases, including 19 climatic variables, 3 topographic variables, 5 soil variables, and 6 UV-B variables (Table S1). The bioclimatic factors and topographic factors are from the World Climate website (http://www.worldclim.org (accessed on 8 February 2025)), with a resolution of 2.5 min. The 5 soil variables are from the Harmonized World Soil Database v2.0 (https://www.fao.org (accessed on 8 February 2025)), and the 6 UV-B variables are from the Global UV-B Radiation Datbase (https://www.ufz.de/gluv (accessed on 8 February 2025)). Seven periods of 19 bioclimatic data records were selected: Last Glacial Maximum (LGM), Mid Holocene (MH), Current (averages for 1970–2000), 2030s (averages for 2021–2040), 2050s (averages for 2041–2060), 2070s (averages for 2061–2080), and 2090s (averages for 2081–2100). Two representative concentration pathways, sustainable development conditions (SSP126) and normal development conditions (SSP585), were selected from the BCC-CSM2-MR climate system model, which has demonstrated good performance in simulating temperature and precipitation in China [28,29,30]. All data were uniformly resampled to a resolution of 2.5 min. Since the topographic factors, soil factors, and UV-B factors were only for the current period, these factors remained constant in past and future modeling [31,32].
However, correlations between all environmental parameters may result in model overfitting and reduced accuracy in simulations [33]. To reduce the effects of spatial collinearity on the MaxEnt model’s accuracy, we empl parameters oyed a four-step strategy. The process began with running the model using default to evaluate the percent contribution and permutation importance of each variable [34]. Next, Pearson correlation analysis between variables was performed with ENMTools package [35,36]. Additionally, a review of the relevant literature helped identify variables linked to the growth of A. yangbiense and C. chago [20,37]. Finally, only the one with the higher contribution rate was retained if any two variables were strongly correlated (|r| ≥ 0.75) [38,39,40]. If the contribution rate was the same, the variable with the lower permutation importance was excluded. As a result, there were 11 and 12 major environmental variables of A. yangbiense and C. chago in the simulations using MaxEnt 3.4.4 (Table 1).

2.3. Model Optimization and Accuracy Evaluation

Model performance is heavily affected by the feature combination (FC) and regularization multiplier (RM) settings [41]. Consequently, the “Kuenm” package in R was employed to optimize the MaxEnt model in this research [42]. Initially, we set the regularization multiplier (RM) to range from 0.5 to 4, incrementing by 0.5 each time, resulting in 8 distinct values [42]. Feature combinations (FCs) encompassed Linear (L), Quadratic (Q), Product (P), Hinge (H), and Threshold (T), generating 31 possible combinations, which collectively produced 248 unique settings [43]. From these, models with statistically significant results, omission rates ≤ 5%, and delta AICc values < 2 were identified as potential candidates. If multiple candidate models met these criteria, the optimal model was selected based on the lowest omission rate and delta AICc value [44].
For this analysis, distribution data and key environmental variables for A. yangbiense and C. chago were input into MaxEnt. The data were split into a 25% test set and a 75% training set. The parameters were set to the optimal combination, and the Crossvalidate method was applied with 10 repetitions [42]. Additionally, the options “Create response curves” and “Do importance of folding variables” were enabled to assess the significance of each environmental factor and examine the relationship between variable values and habitat suitability [38]. All other settings remained at their default values. The accuracy of the model was assessed by calculating the area under the curve (AUC) of the receiver operating characteristic (ROC) curve [45]. AUC scores range between 0 and 1, where values below 0.7 indicate failed or very poor performance, values between 0.7 and 0.8 represent moderate performance, values between 0.8 and 0.9 denote good performance, and values between 0.9 and 1.0 reflect excellent performance [38,43]. Moreover, the smaller the AUCDiff, the more reliable the model [44].

2.4. Suitable Area Division and Centroid Migration

We used GIS’s reclassification function to classify regions by their suitability grade for A. yangbiense and C. chago and calculated the corresponding area using the grid calculation tool. In this study, the suitable areas are divided into four grades using the manual classification method: high suitability area (p ≥ 0.6), medium suitability area (0.4 ≤ p < 0.6), low suitability area (0.2 ≤ p < 0.4), and unsuitable area (p < 0.2) [45,46]. We utilized the SDM toolbox to determine the distribution centroids of suitable habitats and analyze their shifting trends across different time periods [47,48].

3. Results

3.1. Optimization Outcomes and Model Accuracy Evaluation

After the model optimization with the Kuenm package, when RM = 3.5 and FC = QP, the model was the best model for A. yangbiense, the omission rate was 0.25%, the average AUC of 10 repeated runs was 0.982, and the AUCDiff was 0.0079. When RM = 2 and FC = QPT, the model was the best model for C. chago, the omission rate was 0.33%, the average AUC of 10 repeated runs was 0.993, and the AUCDiff was 0.0029 (Table 2). These results indicat that the model performance improved through optimization, and the reliability of the prediction results is high.

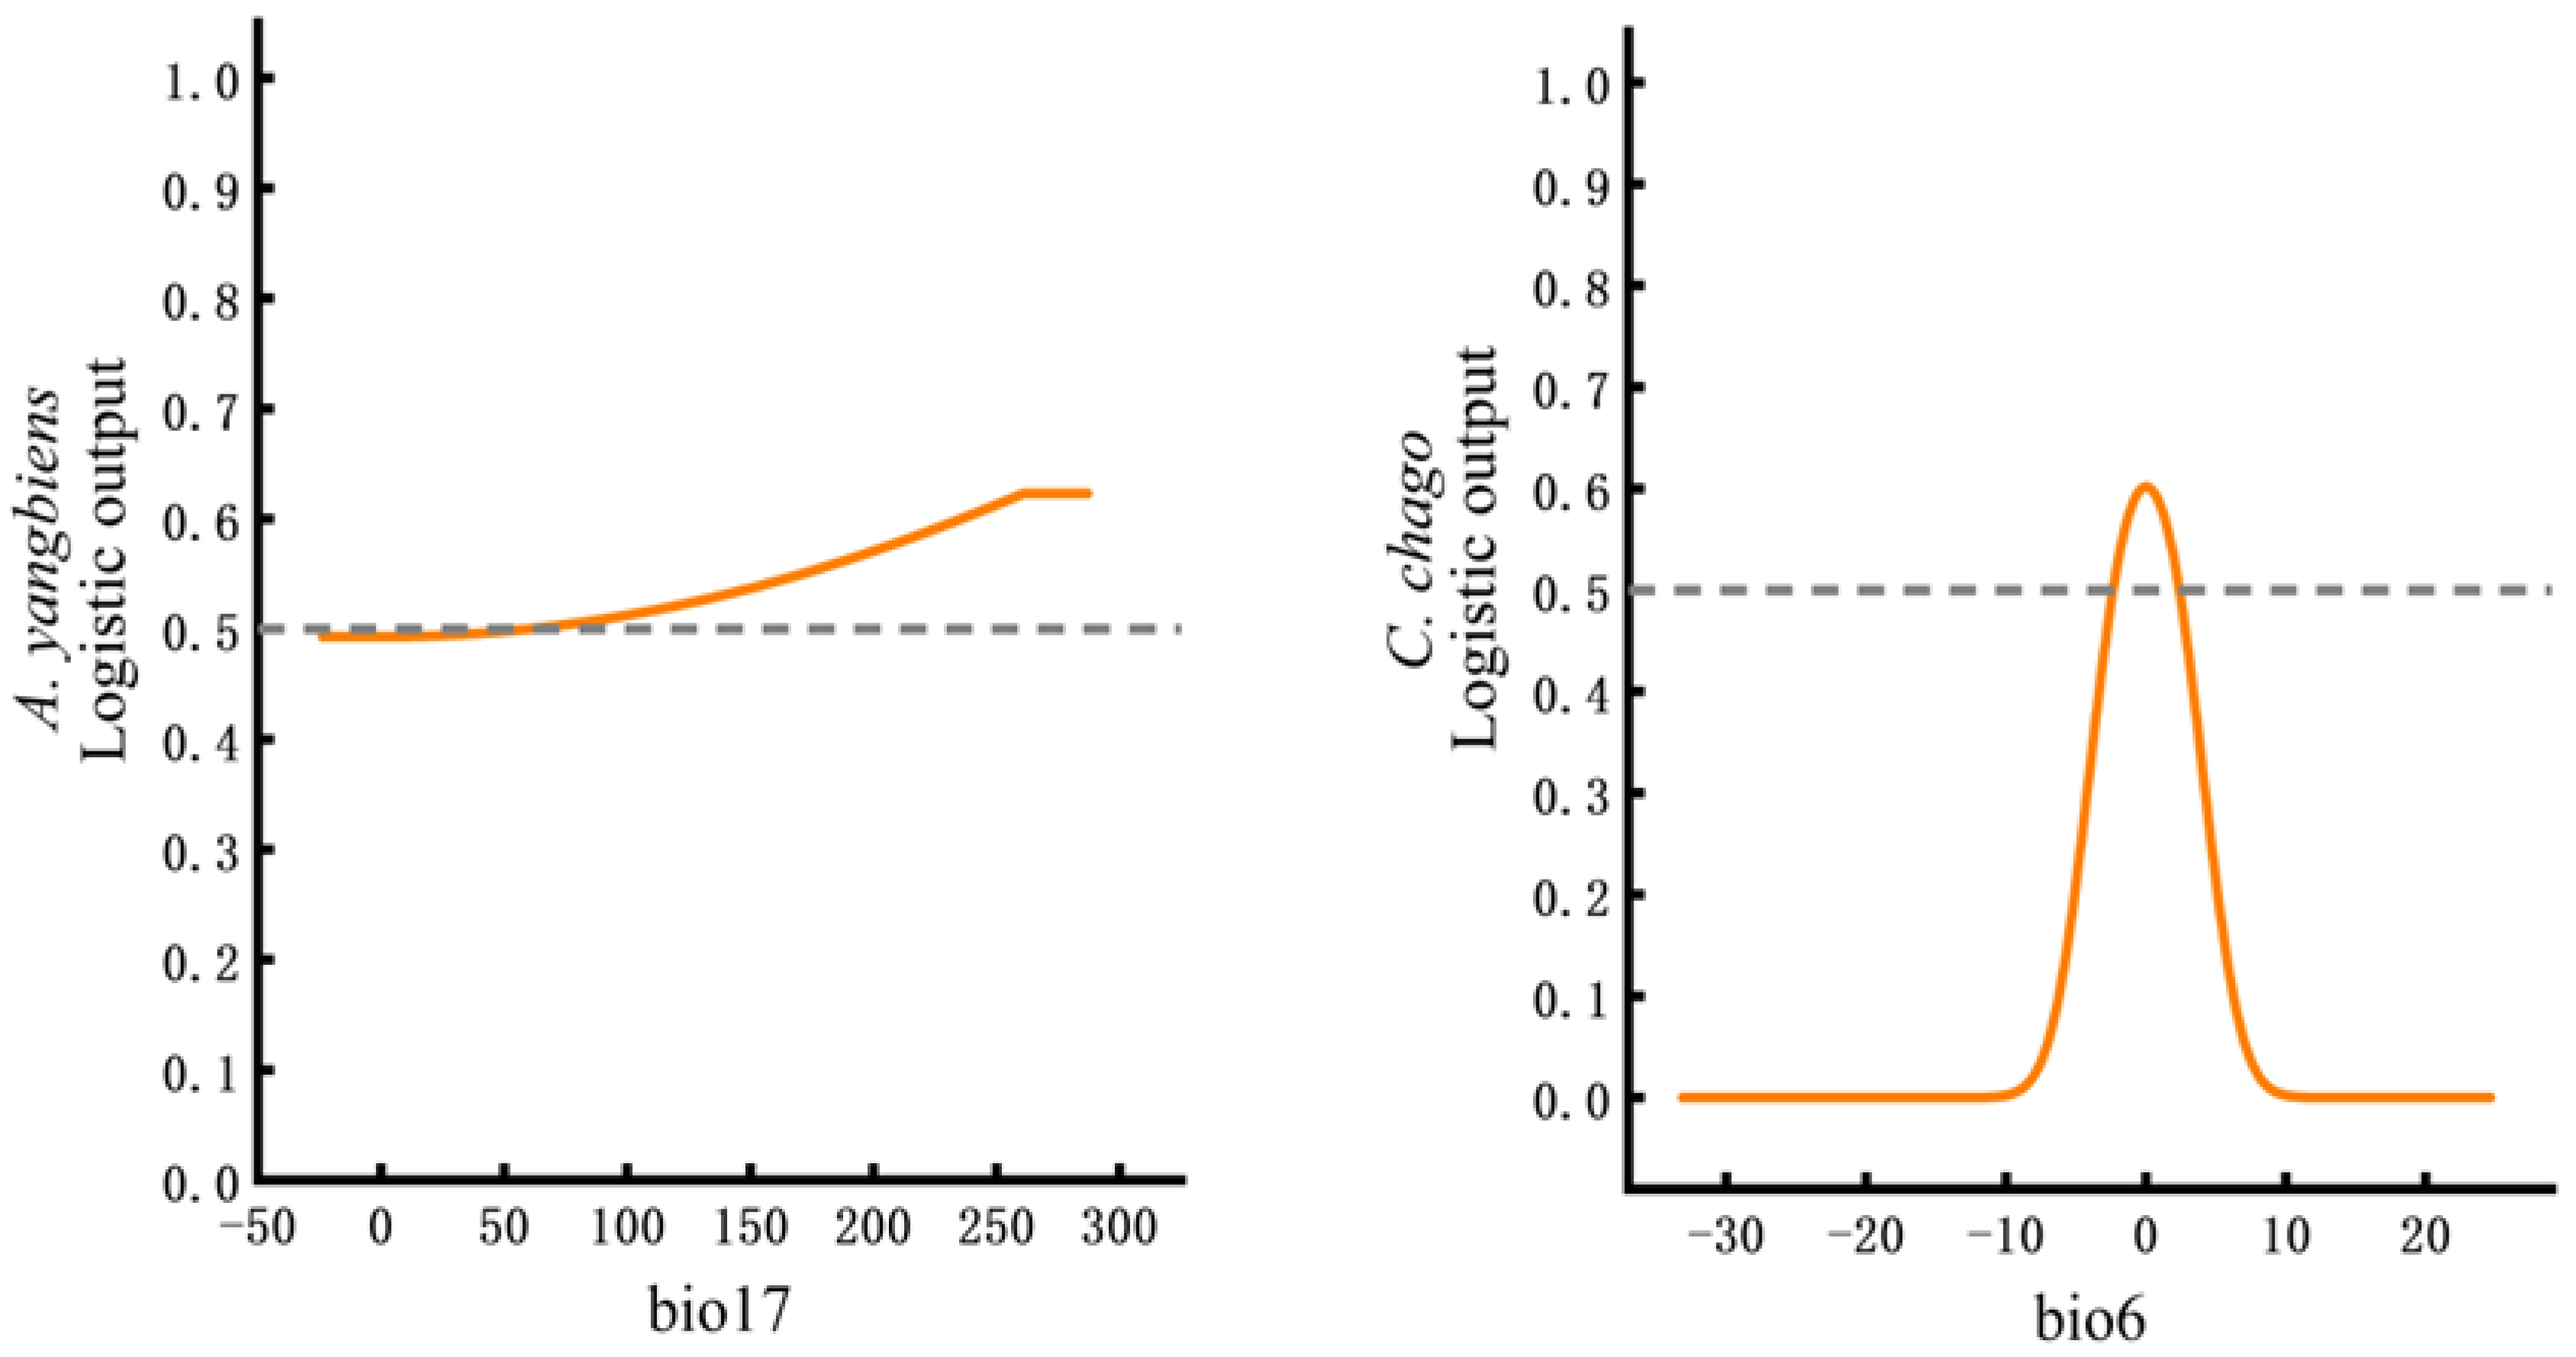
3.2. Key Factors Affecting the Potential Distributions of A. yangbiense and C. chago

As indicated in Table 3 and Table 4, the primary environmental factors influencing the distributions of A. yangbiense and C. chago were the precipitation of the driest quarter (biol7) and the minimum temperature of the coldest month (bio6), respectively. The contribution rate of the two factors was significantly greater than other environmental factors. The response curves can reflect the relationship between species survival probability and environmental factors. Here, a survival probability greater than 0.5 (p > 0.5) was identified as the range supporting optimal species growth. The optimal ranges of key environmental factors for the two species are bio17 ≥ 60 mm and −2.36 °C < bio6 < 2.32 °C, which are suitable for the growth of A. yangbiense and C. chago, respectively (Figure 2).

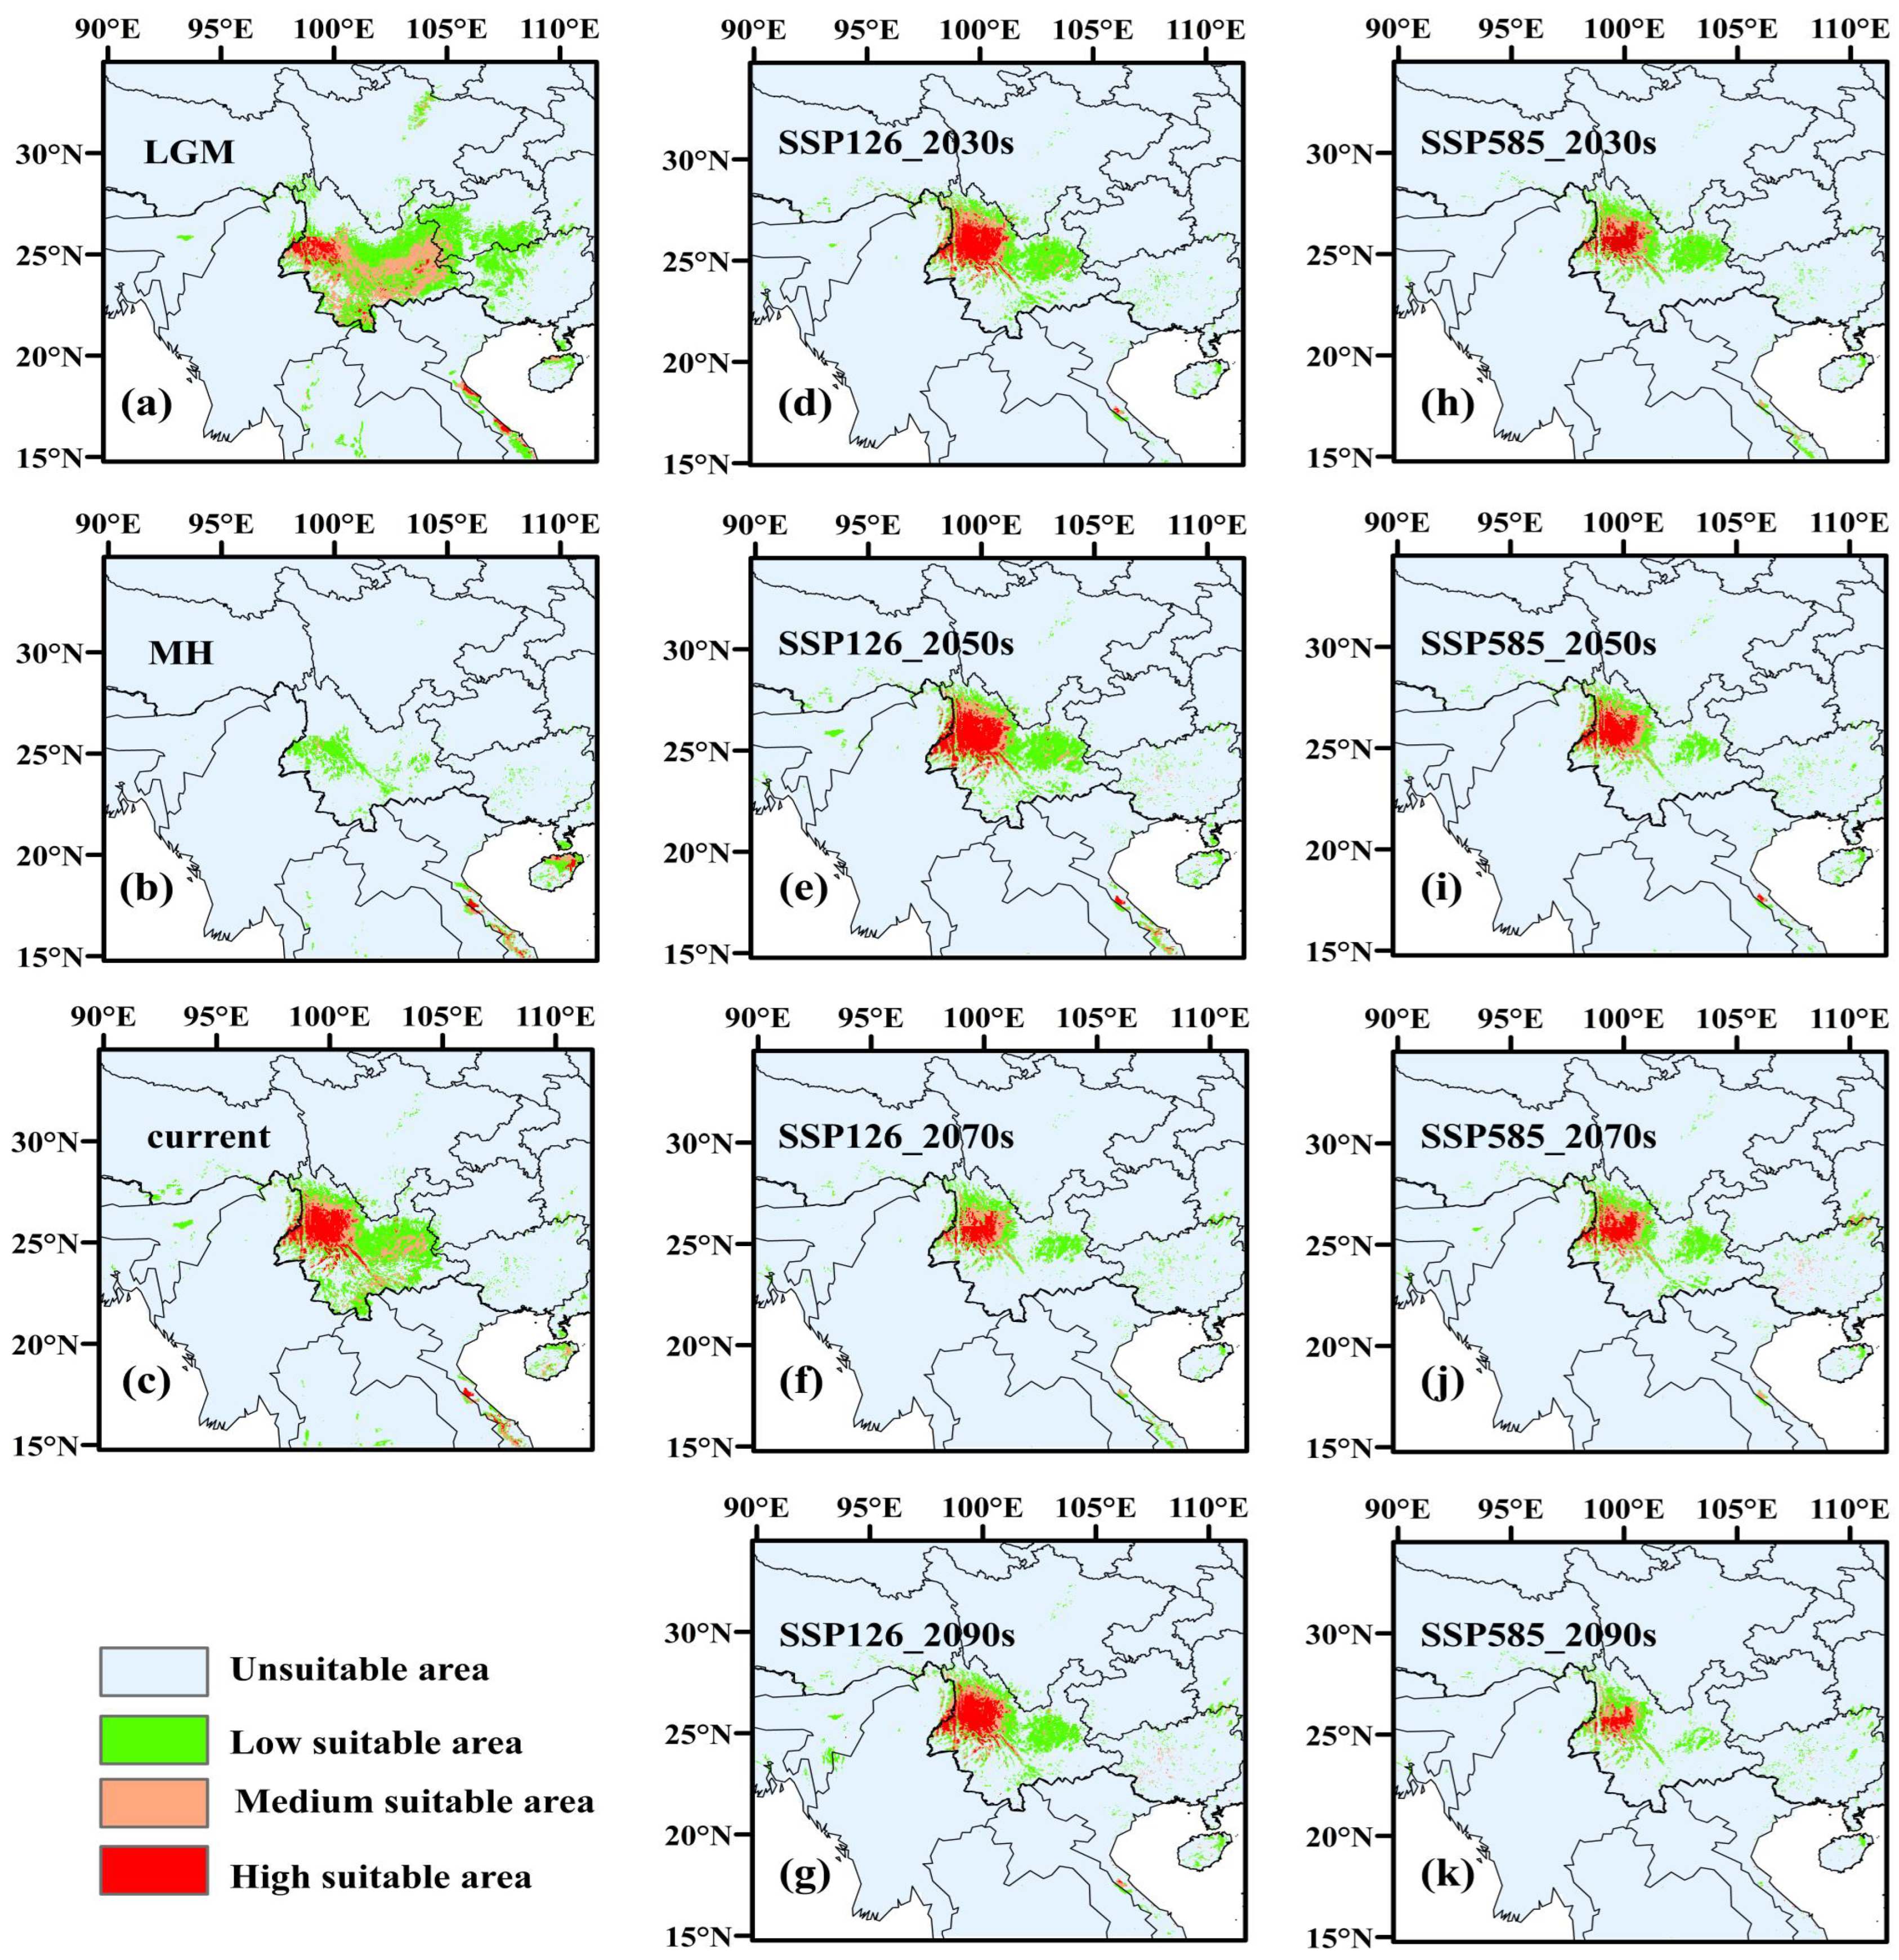
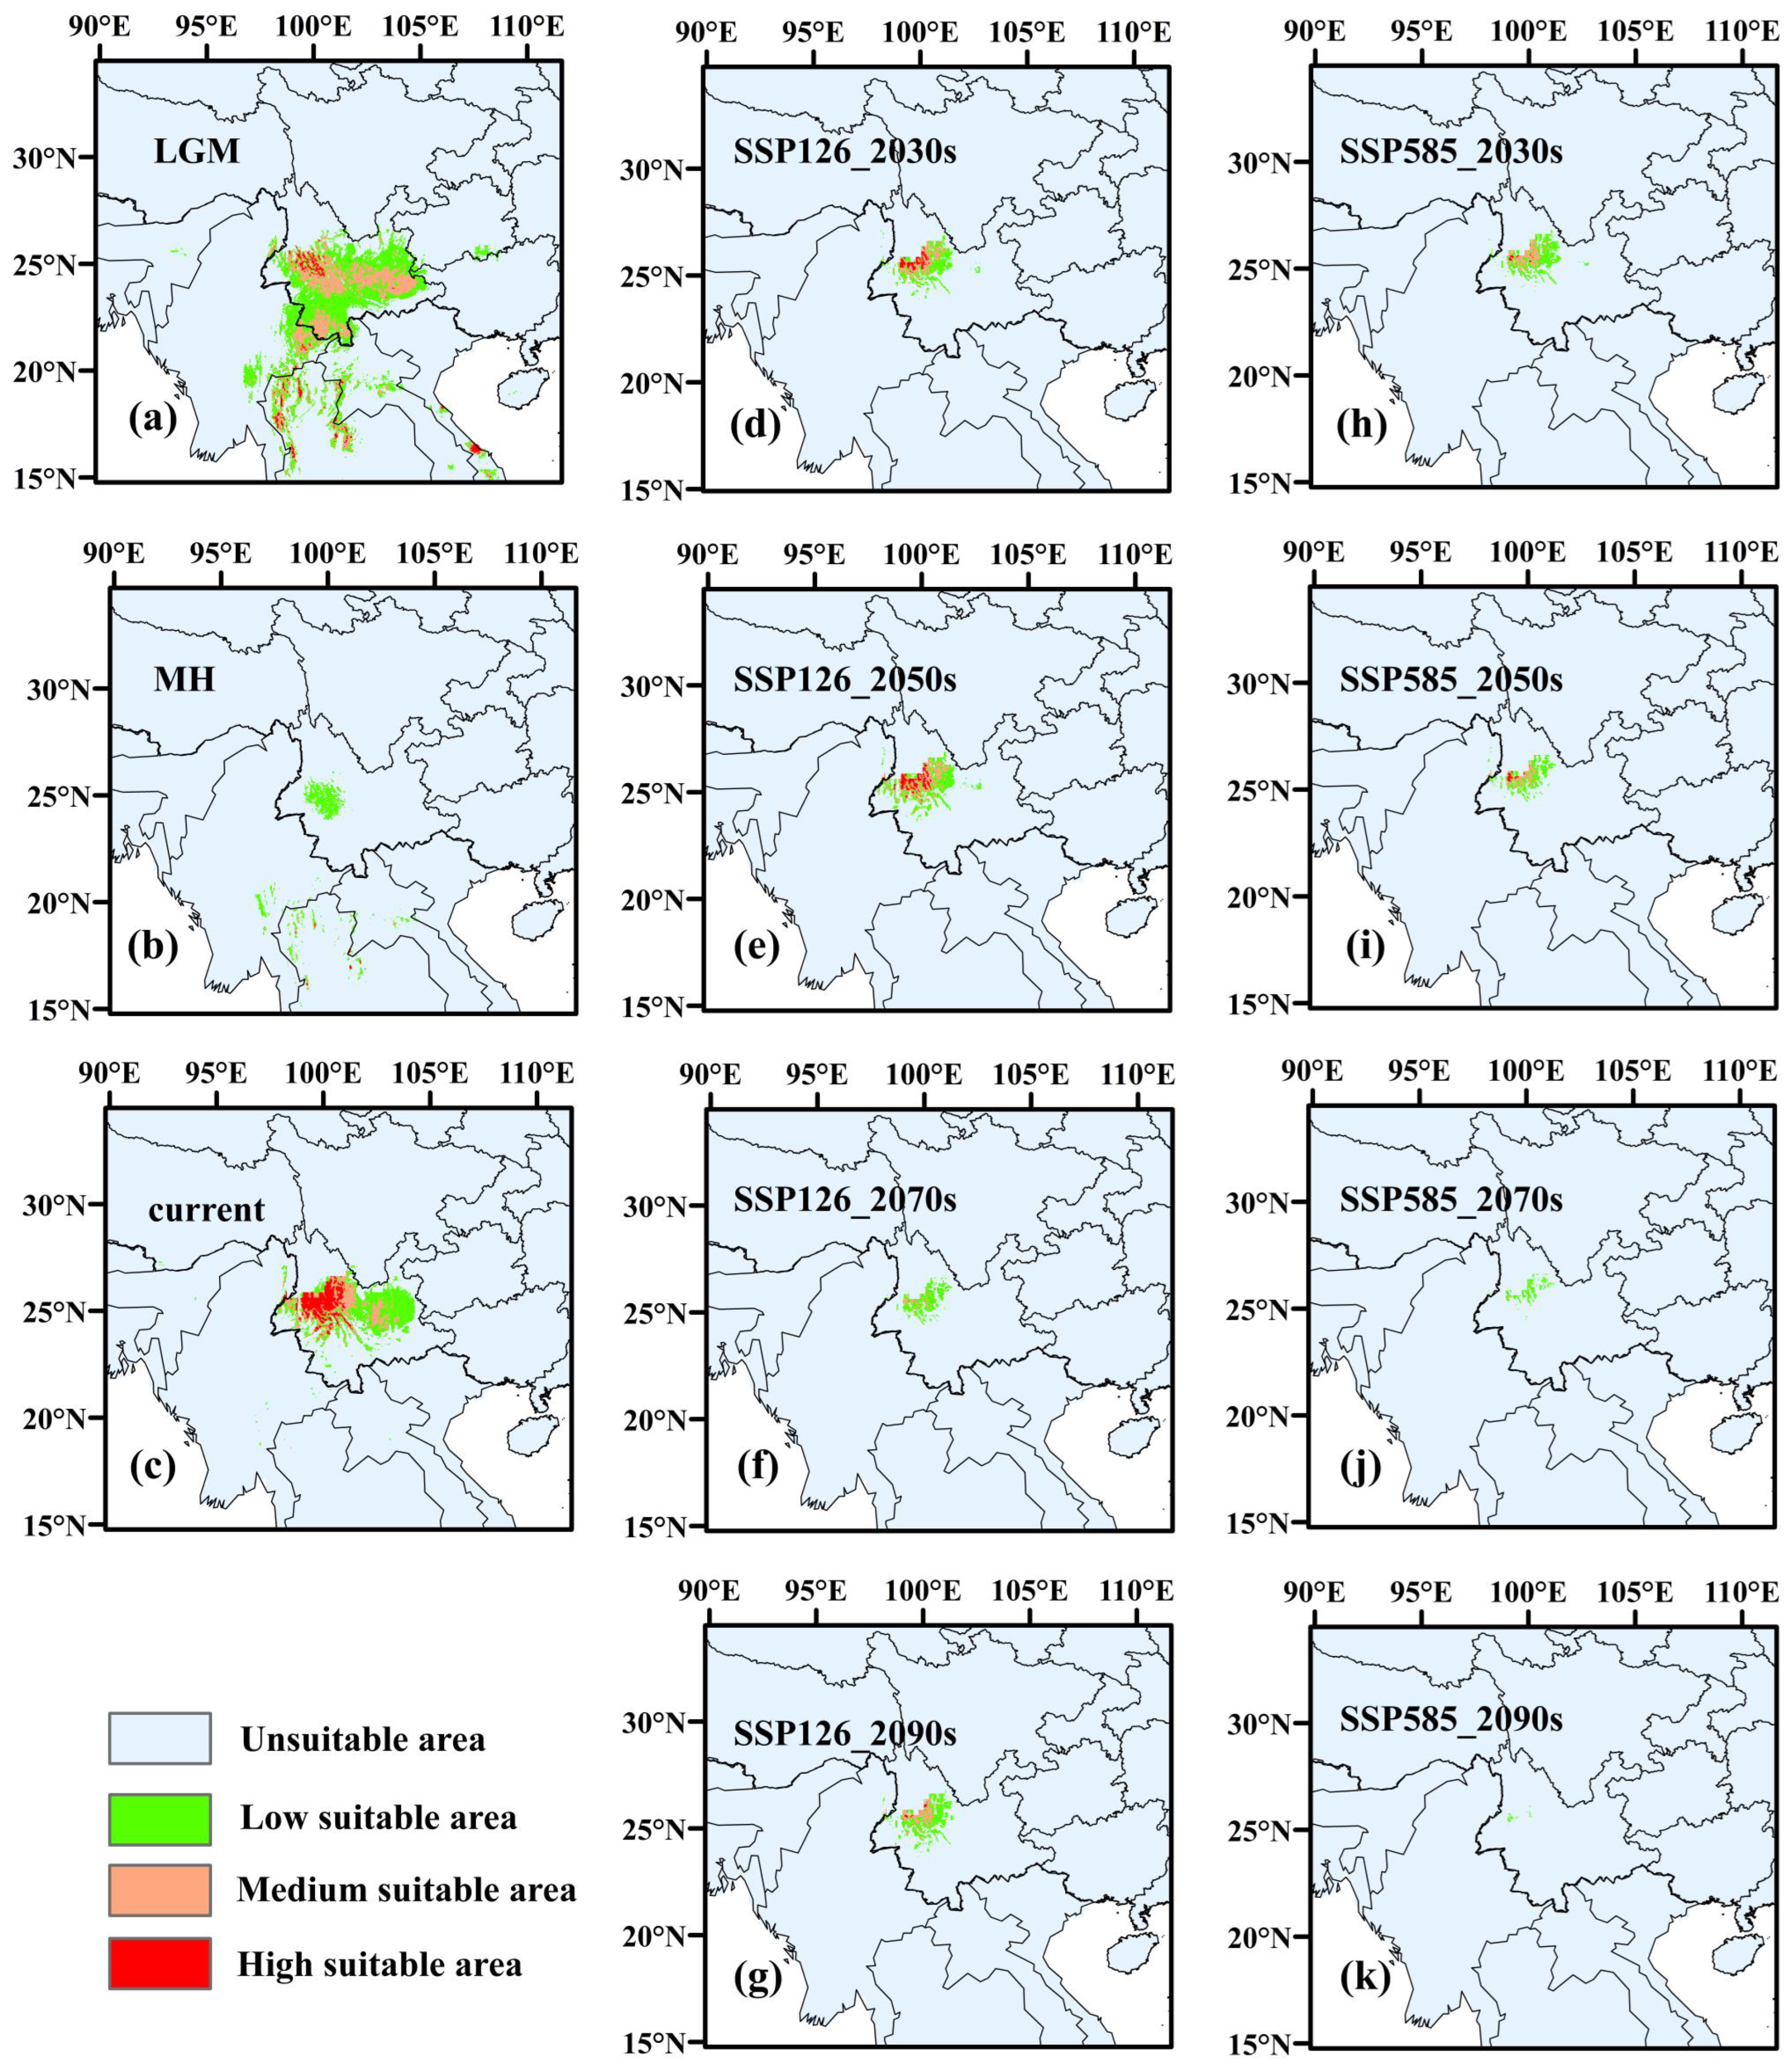
3.3. Potentially Suitable Areas for A. yangbiense and C. chago

3.3.1. Current Habitable Zones for A. yangbiense and C. chago

The optimized MaxEnt model indicates that the total suitable areas for A. yangbiense and C. chago currently span 29.06 × 10⁴ km2 and 13.33 × 10⁴ km2, respectively. The middle and high suitability areas of the two species were mainly located in the northwest of Yunnan. However, the distribution areas of C. chago were narrower than those of A. yangbiense. Specifically, the suitable areas of C. chago were only distributed in the Yunnan and Xizang Provinces in China and scattered in India, Myanmar, Thailand, and Laos abroad. Besides the above-mentioned sites, A. yangbiense also had suitable areas in Sichuan, Guizhou, Hunan, Guangxi, Guangdong, and Hainan in China, as well as in Bhutan, Bangladesh, and Vietnam abroad (Figure 3 and Figure 4; Table S2).

3.3.2. Potentially Habitable Zones for A. yangbiense and C. chago in Historical Periods

Many of the southern and central regions of Yunnan were ideal for the growth of A. yangbiense and C. chago, which had the biggest suitable areas overall during the Last Glacial Maximum (LGM). Compared to the present, the total suitable areas for A. yangbiense and C. chago rose by 45.58% and 163.51%, respectively. During this period, the low suitability areas and medium suitability areas of two species expanded considerably, while the area of high suitability dropped (decreased by 57.05% and 44.76%, respectively). In the Middle Holocene (MH), all types of suitable areas (low, medium, and high suitability areas) for A. yangbiense and C. chago showed varying degrees of reduction. (Figure 3, Figure 4 and Figure 5; Table S2).

3.3.3. Potentially Habitable Zones for A. yangbiense and C. chago in Future Scenarios

In the future, the predicted total areas of A. yangbiense and C. chago decreased to different degrees based on the two climate conditions in each period (decreased by 32.98%–64.99% and 63.48%–99.49%, respectively). In the 2070s, based on the SSP126 scenario, the total suitability areas of A. yangbiense and C. chago were the lowest, with a decrease of 52.40% and 86.25% compared with the current climate conditions, respectively. At this point, C. chago’s middle and high suitability zones had shrunk by over 92%, and even the high suitability areas were in danger of going extinct. In the 2090s, A. yangbiense and C. chago had the lowest total suitability areas according to the SSP585 scenario, declining 64.99% and 99.49%, respectively, in comparison to the current climate. Meanwhile, all types of suitable areas (low, medium, and high suitability areas) for C. chago decreased by 99%–100% (Figure 3, Figure 4 and Figure 5; Table S2).
Except for the 2070s, the total areas of A. yangbiense in the two scenarios (SSP126 and SSP585) were as follows: SSP126 > SSP585. The comparison of C. chago’s total adaptability area in each scenario yielded the following results: SSP126 > SSP585. Except for the 2030s, when the areas of low suitability for C. chago based on SSP126 were slightly lower than SSP585, the suitable areas for all levels (low, medium, and high suitability areas) gradually decreased with increasing carbon emission concentration (SSP126, SSP585) (Figure 3, Figure 4 and Figure 5; Table S2).

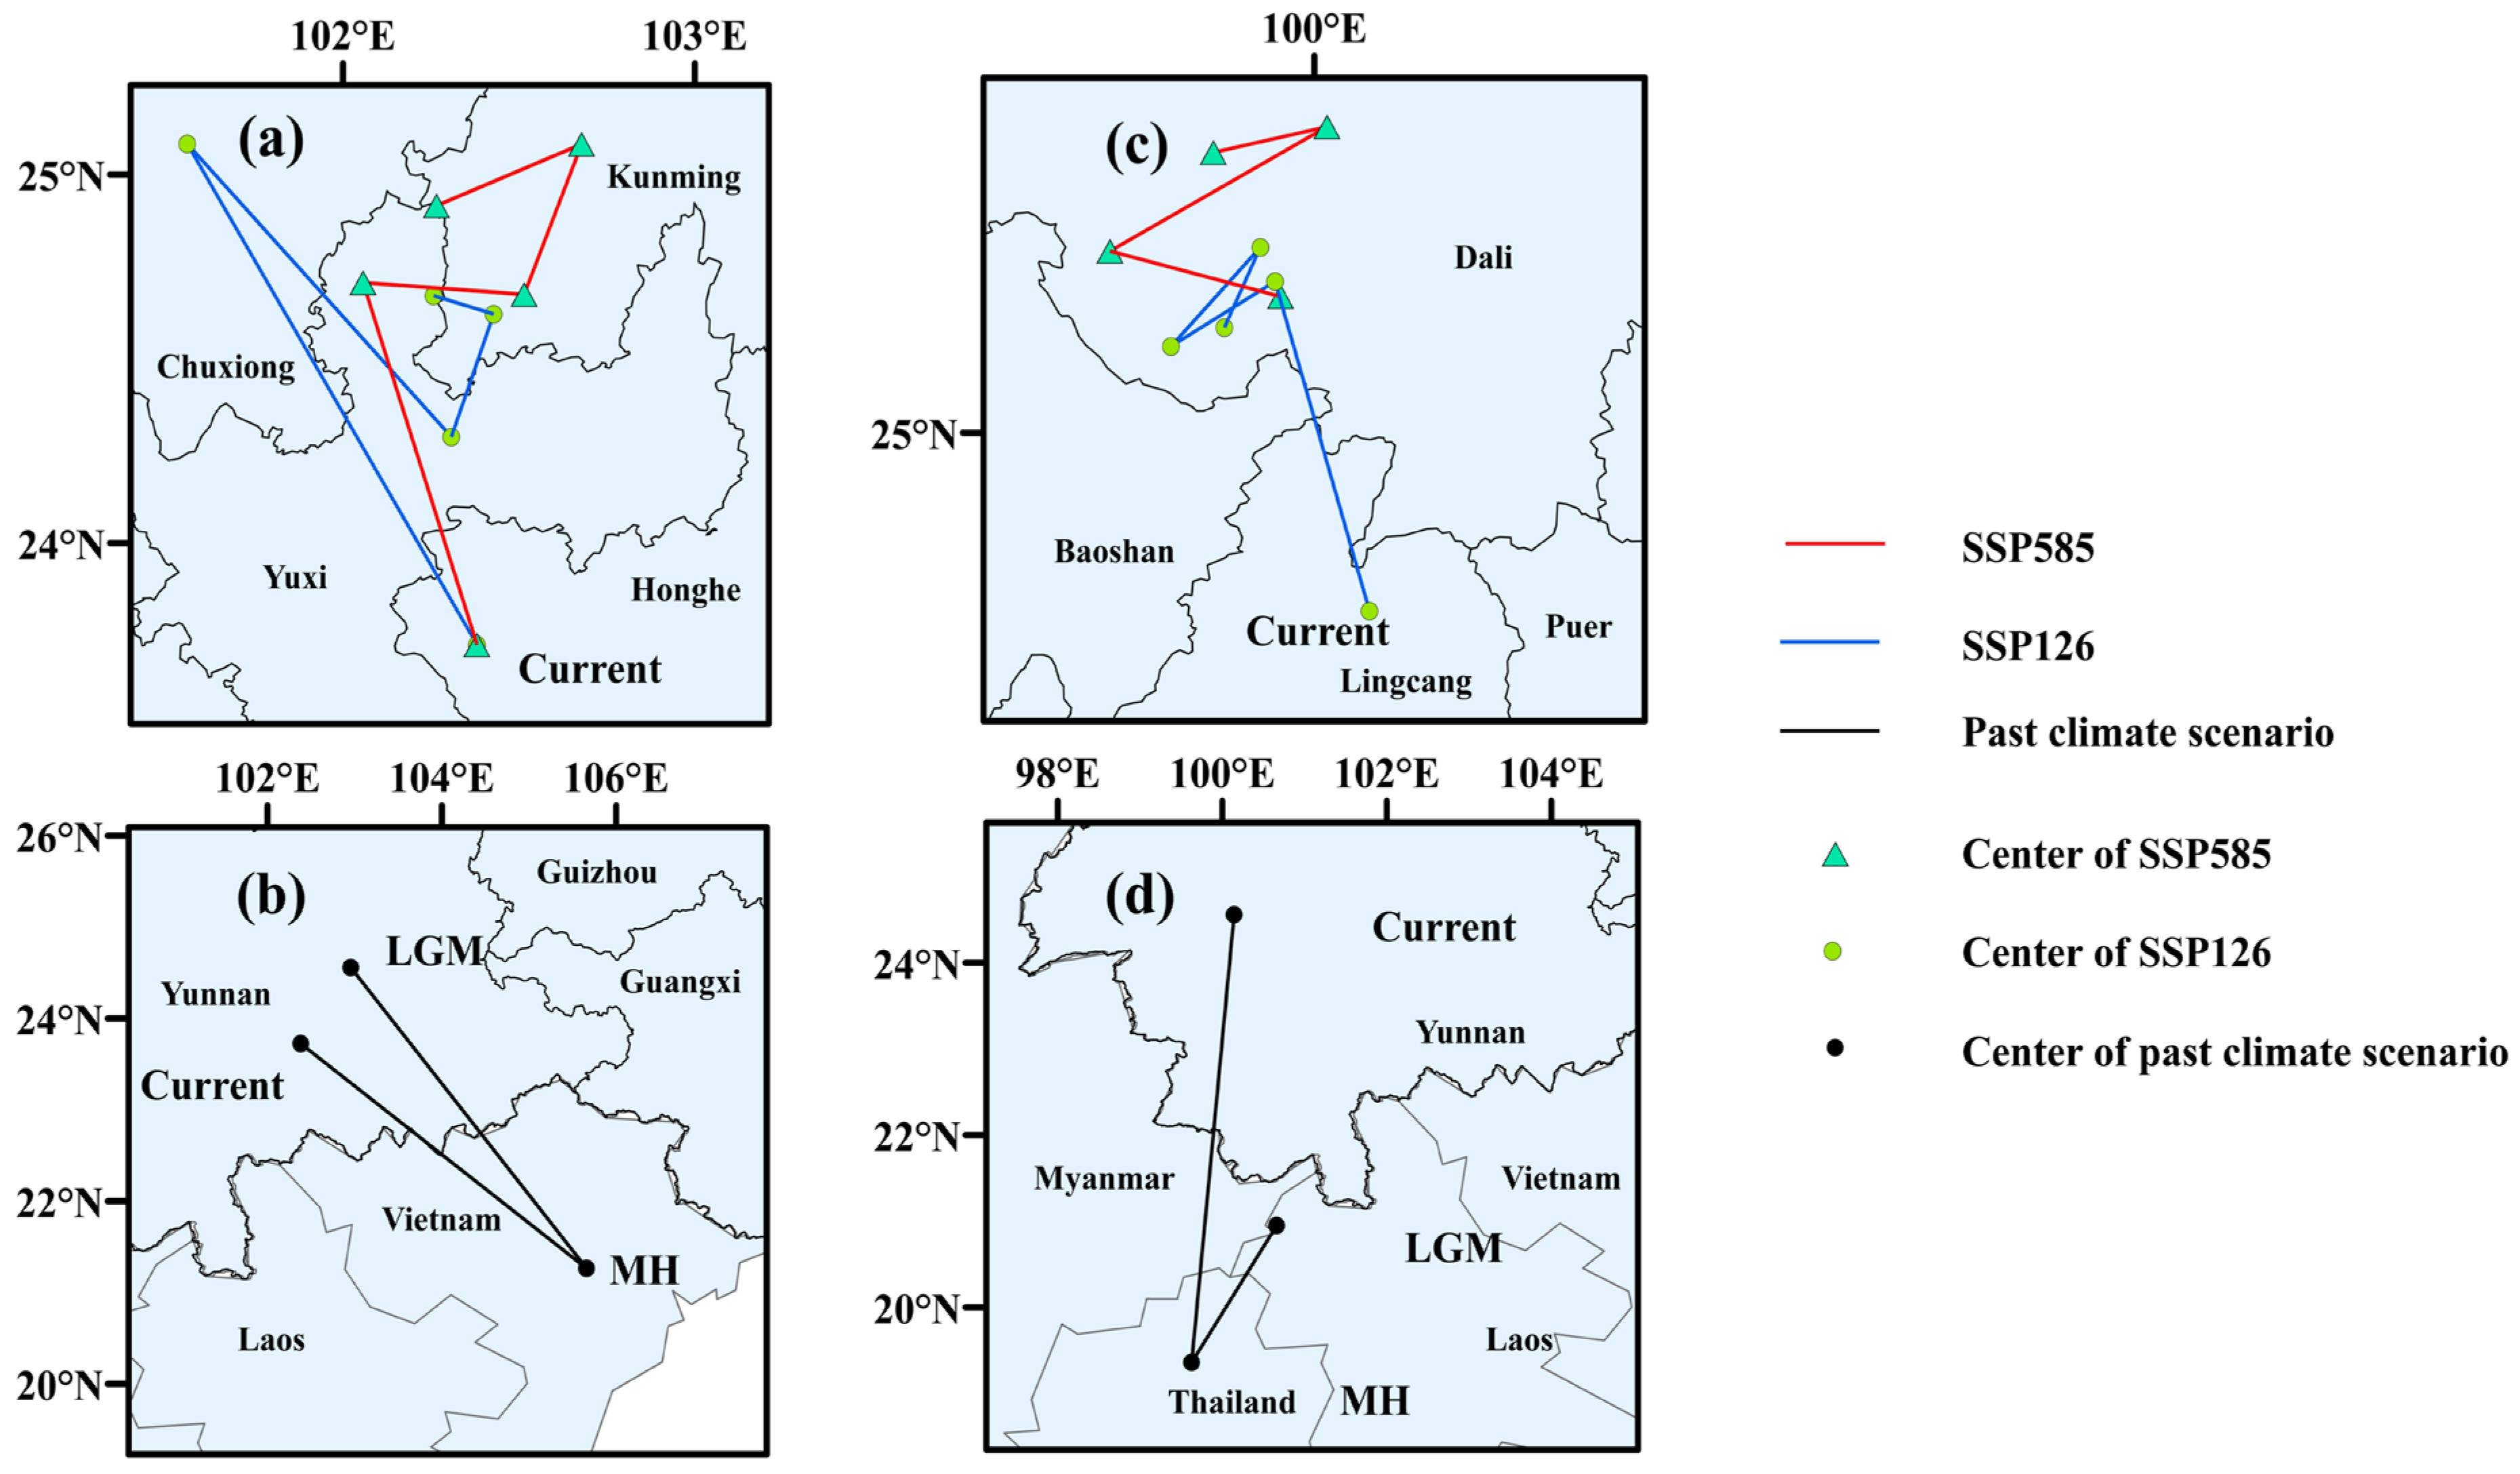
3.4. Shift of Suitable Habitat Centroids

Both A. yangbiense and C. chago’s distribution centroids from the LGM to the present demonstrated a south-to-north migratory pattern; A. yangbiense’s center traveled from Yunnan to Vietnam and back to Yunnan. After migrating from Laos to Thailand, the centroid of C. chago eventually settled in Yunnan. The centers of A. yangbiense and C. chago continued to migrate northward overall in the future, and as climate change grew, so did the migration amplitude (Figure 6).

4. Discussion

4.1. Accuracy of MaxEnt After Optimization

The Maxent model is sensitive to sampling bias and is prone to overfitting. In this study, we screened the distribution data with ENMTools, which associated species distribution data with environmental data for matching analysis and retained only one effective distribution point in the same environmental data grid (in a similar ecological niche), which greatly reduced the overfitting problem caused by the excessive concentration of distribution data. The performance of the MaxEnt model is largely influenced by FC and RM. Optimizing these settings not only reduces overfitting but also significantly improves prediction quality [41,45]. In this study, the Kuenm package in R was used to optimize the MaxEnt model, and the best model was selected based on statistical significance (partial ROC), omission rate (E = 5%), and model complexity [42,49]. The results showed that the optimal models of A. yangbiense and C. chago were RM = 3.5, FC = QP and RM = 2, FC = QPT, respectively. The AUC values were 0.982 and 0.993 after 10 repeated runs, indicating that the optimized model had high accuracy and reliability and can predict species distribution well [50]. A smaller AUCDiff (difference between training and test data) value indicates greater model reliability [45]. In this study, the AUCDiff values for A. yangbiense and C. chago were 0.0079 and 0.0029, respectively, indicating good model reliability. Furthermore, our research findings indicate that under current climatic conditions, the highly suitable habitats for A. yangbiense and C. chago are primarily in northwestern Yunnan, which is consistent with the findings from the germplasm resource survey results.

4.2. The Impact of Key Environmental Factors on the Distributions of A. yangbiense and C. chago

Climate has a major influence on the geographical distributions of plants, with hydrothermal conditions dominating the distribution pattern [10]. According to the percentage contribution and the jackknife test of the MaxEnt model, we concluded that the precipitation of the driest quarter (bio17) and the min temperature of the coldest month (bio6) were the most important environmental variables restricting the current distributions of A. yangbiense and C. chago, respectively. This finding was similar to that from the study by Qi et al. [51], who reached similar conclusions on Cinnamomum mairei H. Lév. They found that the min temperature in the coldest month (bio6) was the most influential environmental variable for the distribution of Cinnamomum mairei H. Lév, and its threshold was −0.63–4.36 °C. In this study, the threshold of precipitation of the driest quarter (bio17) and min temperature of the coldest month (bio6) was bio17 > 60 mm and −2.36 °C < bio6 < 2.32 °C.

4.3. Changes of Suitable Areas of A. yangbiense and C. chago from Past to Current

The following pattern was observed in the possible distributions of A. yangbiense and C. chago from the LGM to the MH: the suitable area peaked in the LGM and declined in the MH, which could support the findings of Zhang et al. and Ma et al. [17,19]. Relevant research suggested that A. yangbiense has experienced repeated bottleneck events in the past, particularly the most recent one occurring within the last ~10,000 years, which decreased its effective population size (Ne) < 200 [17]. Zhang et al. hypothesized that the majority of C. chago populations had experienced the recent bottleneck impact [19]. Furthermore, we hypothesized that these phenomena might also be connected to the unique climatic conditions of that era. During the LGM, the global climate was generally colder. These climatic conditions aligned well with the ecological requirements of A. yangbiens and C. chago, particularly as C. chago exhibited strong adaptability to low temperatures. As a result, the suitable habitat areas for these species significantly expanded. However, compared to the Last Maximum Ice Age, the temperature displayed an upward trend, the monsoon strength steadily rose, and the Middle Holocene experienced the historical Great Warm Period pattern [52,53]. The suitable regions for A. yangbiense and C. chago may have been diminished due to the warming, but temperatures displayed a slow cooling tendency in the Late Holocene [54], followed by the Little Ice Age in China. Human activities and life progressively impacted the species’ suitable distribution [55].
In our study, there was a clear “recovery period” following the MH, and the potential distributions of A. yangbiense and C. chago increased from the MH to the present. The alpine canyon regions of western Yunnan are a transitional zone between paleo-tropical and paleo-Arctic flora, which is a potential refuge from the Ice Ages [56]. Dali, Baoshan, and Lincang in Yunnan Province have been identified as probable appropriate habitats for A. yangbiense and C. chago from the LGM to the present; thus, we hypothesize that these locations may have served as A. yangbiense and C. chago’s refuges during the glacial period. It is important to note that pollen records indicate that severe human disturbance occurred in the Cangshan Mountains 6370 years ago, when many forestswere cleared for conversion to agricultural land [57]. Additionally, evidence of Han Chinese migration and settlement in the region has been found [58]. However, our model did not account for human disturbances (such as deforestation, agricultural, and urban expansion), which inevitably led to some discrepancies between the predicted results and the actual distributions.

4.4. Changes of Suitable Areas of A. yangbiense and C. chago in Future Scenarios

In the future, as global warming progresses, temperature and precipitation patterns will undergo changes, and extreme events will become more frequent [59]. Plants have certain thresholds for environmental factors; when these thresholds are exceeded, it becomes detrimental to their growth and reproduction, leading to a reduction in suitable habitats [60]. The suitable habitats for A. yangbiense and C. chago are expected to diminish markedly with global warming. The total suitable areas for both species under the SSP126 scenario were larger compared to those under the SSP585 scenario. This suggested that as the greenhouse effect intensifies, temperature and precipitation will exceed the tolerance range of A. yangbiense and C. chago, leading to a reduction in their suitable habitats. We hypothesized that a low-emission scenario would be more favorable for the survival of A. yangbiense and C. chago. Furthermore, the areas of different suitability (low, medium, and high suitability areas) and the total suitable area of C. chago were lowered more than those of A. yangbiense throughout the same period based on the same climate scenario. As a result, C. chago might encounter greater survival difficulties in the future than A. yangbiense. In terms of suitable distribution, the difference in prevailing environmental conditions and the richer distribution sites of A. yangbiense may be the reason why the acceptable regions of A. yangbiense were significantly wider than those of C. chago. Since it is the most stable region for A. yangbiense and C. chago and consistently has the greatest heat value, northwestern Yunnan is probably going to offer a good haven for these species in the future.
One of the key responsibilities of nature conservation is the preservation and sustainable use of biodiversity, particularly the preservation of rare and endangered plant resources [61]. The greatest threat to biodiversity, according to research, is habitat loss, and the most crucial tactic for protecting biodiversity is habitat protection [51]. According to earlier research, the majority of A. yangbiense and C. chago’s distribution sites were found outside of protected natural areas, leading to difficulties in population sustainability [18,20]. Field investigations have revealed that there are frequent activities of land reclamation, grazing, and large-scale seed collection by humans in the vicinity of C. chago populations [19,21]. Based on the results of our study, the conservation of A. yangbiense and C. chago can be carried out in the following aspects. Firstly, the protection of existing populations should be enhanced, especially that of adult plants, as they serve as the foundational source for species’ natural regeneration and population growth. Therefore, prioritizing the conservation of adult plants can safeguard their evolutionary potential and ensure population sustainability. Secondly, areas with high suitability, such as Baoshan, Dali, and Nujiang in Yunnan Province, should be designated as core zones for the introduction and cultivation of A. yangbiense and C. chago to gradually expand their populations. Up to now, there remains a substantial void in the foundational research pertaining to the biological characteristics of A. yangbiense and C. chago [19]. We propose that, on the basis of conducting biological trait studies of these two species, the population size should be augmented through the establishment of artificial populations and genetic configuration methods, among other strategies. Thirdly, land use type has a significant effect on species distribution [62]; thus, future land use planning must be fair and sustainable in order to reduce the negative effects of human disturbance activities on A. yangbiense and C. chago.
In the course of implementing the aforementioned endeavors, it is possible that the dispersal rates of A. yangbiense and C. chago may not keep pace with the rate of climate change, particularly for species like A. yangbiense and C. chago, which have small population sizes and fragmented distributions. Research has indicated that A. yangbiense has a low capacity for harmful environmental adaptation due to its low genetic diversity [17]; we speculate that it is unlikely for A. yangbiense to accumulate many mutations in the coming decades to enhance genetic diversity in response to environmental changes. These are questions that future research will need to address.

4.5. Centroid Migration

From the LGM to the present, the distribution centroids of A. yangbiense and C. chago showed a migration trend from south to north. In the future, the centers of A. yangbiense and C. chago will continue to migrate northward in general, and the migration amplitude will increase as climate change intensifies. This finding aligns with previous research suggesting that numerous species are likely to shift toward higher latitudes due to global warming [63]. Based on relevant research, we conjecture the following trends: (1) A. yangbiense and C. chago are more vulnerable to climate change due to their small distribution areas and limited ecological adaptability [64]. (2) By reducing local population size and gene flow from neighboring populations, habitat fragmentation lowers genetic variety, outcrossing rates, and climatic tolerance [64,65]. Nevertheless, the degree to which habitat fragmentation impacts the reproductive potential and population dynamics of A. yangbiense and C. chago remains unclear. Additional experimentation and research will be necessary in the future to elucidate these effects.

4.6. Potential Limitations

This study represents the first application of an optimized Maximum Entropy (MaxEnt) model to predict the distribution of A. yangbiense and C. chago. Although the results exhibit high reliability, certain limitations remain. Previous studies have demonstrated that ensemble modeling approaches are more suitable for rare species with limited occurrence records [66], suggesting that the reliance on a single-model framework in this study may introduce potential constraints [67]. Additionally, the current model only incorporates variables such as climatic factors, topographic features, soil properties, and UV-B radiation to forecast the potential distributions of A. yangbiense and C. chago while omitting critical variables such as vegetation dynamics, land-use changes, and anthropogenic disturbances. Therefore, future research should consider integrating these additional variables into the modeling framework to enhance predictive accuracy and generate more ecologically robust and reliable results.

5. Conclusions

The research highlighted that the distributions of A. yangbiense and C. chago were mainly influenced by bio17 (precipitation of the driest quarter) and bio6 (minimum temperature of the coldest month), respectively. For the current climate, Yunnan is the largest potentially suitable area for A. yangbiense and C. chago, and the middle and high suitability areas of both are mainly located in northwest Yunnan. From the LGM to the present, the total suitable areas of A. yangbiense and C. chago showed a trend of decreasing first and then increasing. In the future, with global warming, the habitable areas for both species will be reduced greatly, with the extent of reduction escalating alongside rising emission concentrations. Meanwhile, C. chago may face more severe survival challenges in the future because its suitable area was reduced more than that of A. yangbiense. In addition, in the future, the suitable areas of C. chago were limited to Yunnan and Myanmar, while the suitable areas of A. yangbiense were relatively wider. The distribution centroids of A. yangbiense and C. chago showed a migration trend from south to north from the LGM to the present and should continue to move north in the future, and the migration amplitude should increase with the increase in climate change. We suggested the following to strengthen A. yangbiense and C. chago’s ability to withstand the effects of climate change in the future: (1) The effective protection of existing populations should be strengthened, particularly for adult plants. (2) In order to gradually increase the populations, A. yangbiense and C. chago should be introduced and cultivated artificially in Baoshan, Dali, and Nujiang, which are located in the northwest of Yunnan Province and have high heat values. (3) To reduce the effects of human disturbance on A. yangbiense and C. chago, sensible and sustainable land use planning should be developed.

Supplementary Materials

The following supporting information can be downloaded at: https://www.mdpi.com/article/10.3390/f16040621/s1; Table S1: The environment variable; Table S2: The potential suitable distribution areas of A. yangbiense and C. chago under climate change.

Author Contributions

Conceptualization, K.G. and H.W.; methodology, K.G. and H.W.; software, K.G.; formal analysis, K.G.; investigation, C.C., Y.L. and M.D.; data curation, K.G.; writing—original draft preparation, K.G.; writing—review and editing, K.G., H.W., C.L. and C.W.; visualization, K.G., G.L. and T.Z.; supervision, C.W.; project administration, C.W.; funding acquisition, C.W. All authors have read and agreed to the published version of the manuscript.

Funding

This research was funded by the National Natural Science Foundation of China (No. 31460169).

Data Availability Statement

The data in this paper need to remain confidential for the time being and, therefore, cannot currently be made public.

Conflicts of Interest

The authors declare that they have no known competing financial interests or personal relationships that could affect the work reported here.

References

  1. McClean, C.J.; Lovett, J.C.; Kueper, W.; Hannah, L.; Sommer, J.H.; Barthlott, W.; Termansen, M.; Smith, G.F.; Tokamine, S.; Taplin, J.R.D. African plant diversity and climate change. Ann. Mo. Bot. Gard. 2005, 92, 139–152. [Google Scholar]
  2. Tang, S.L.; Song, Y.B.; Zeng, B.; Dong, M. Potential distribution of the extremely endangered species Ostrya rehderiana (Betulaceae) in China under future climate change. Environ. Sci. Pollut. Res. 2022, 29, 7782–7792. [Google Scholar]
  3. Zhao, R.; Huang, N.; Zhang, Z.; Luo, W.; Xiang, J.; Xu, Y.; Wang, Y. Genetic Diversity Analysis and Prediction of Potential Suitable Areas for the Rare and Endangered Wild Plant Henckelia longisepala. Plants 2024, 13, 2093. [Google Scholar] [CrossRef]
  4. Tao, L.; Liu, Y.-H.; Dao, Z.-L.; Liu, D.; Yang, J.; Sun, W. Guiding Conservation Strategies for China’s Corybas Species through Species Distribution Modeling. Glob. Ecol. Conserv. 2024, 53, e03008. [Google Scholar]
  5. Bhat, I.A.; Fayaz, M.; Roof ul, Q.; Rafiq, S.; Guleria, K.; Qadir, J.; Wani, T.A.; Kaloo, Z.A. Predicting potential distribution and range dynamics of Aquilegia fragrans under climate change: Insights from ensemble species distribution modelling. Environ. Monit. Assess. 2023, 195, 623. [Google Scholar]
  6. Yu, F.; Wang, T.; Groen, T.A.; Skidmore, A.K.; Yang, X.; Ma, K.; Wu, Z. Climate and land use changes will degrade the distribution of Rhododendrons in China. Sci. Total Environ. 2019, 659, 515–528. [Google Scholar]
  7. Wu, Y.-M.; Shen, X.-L.; Tong, L.; Lei, F.-W.; Mu, X.-Y.; Zhang, Z.-X. Impact of Past and Future Climate Change on the Potential Distribution of an Endangered Montane Shrub Lonicera oblata and Its Conservation Implications. Forests 2021, 12, 125. [Google Scholar] [CrossRef]
  8. Abolmaali, S.M.-R.; Tarkesh, M.; Bashari, H. MaxEnt modeling for predicting suitable habitats and identifying the effects of climate change on a threatened species, Daphne mucronata, in central Iran. Ecol. Inform. 2018, 43, 116–123. [Google Scholar]
  9. Lee-Yaw, J.; McCune, J.; Pironon, S.; Sheth, S. Species distribution models rarely predict the biology of real populations. Ecography 2021, 2022, e05877. [Google Scholar]
  10. Sun, S.; Zhang, Y.; Huang, D.; Wang, H.; Cao, Q.; Fan, P.; Yang, N.; Zheng, P.; Wang, R. The effect of climate change on the richness distribution pattern of oaks (Quercus L.) in China. Sci. Total Environ. 2020, 744, 140786. [Google Scholar]
  11. Liu, L.F.; Qin, F.C.; Liu, Y.; Hu, Y.N.; Wang, W.F.; Duan, H.; Li, M.Y. Forecast of potential suitable areas for forest resources in Inner Mongolia under the Shared Socioeconomic Pathway 245 scenario. Ecol. Indic. 2024, 167, 13. [Google Scholar]
  12. Ji, Q.; Wang, R.; Huang, Z.; Yuan, J.; Ren, G.; Xiao, W. Effects of sample size and study range on accuracy of MaxEnt in predicting species distribution: A case study of the black-and-white snub-nosed monkey. Acta Theriol. Sin. 2019, 39, 126–133. [Google Scholar]
  13. Wang, Y.; Huo, W.; Wu, K.; Cao, J.; Zhao, G.; Zhang, F. Prediction of the potentially suitable areas of Paeonia lactiflora in China based on Maxent and Marxan models. Front. Plant Sci. 2025, 15, 1516251. [Google Scholar]
  14. Shi, X.D.; Yin, Q.; Sang, Z.Y.; Zhu, Z.L.; Jia, Z.K.; Ma, L.Y. Prediction of potentially suitable areas for the introduction of Magnolia wufengensis under climate change. Ecol. Indic. 2021, 127, 14. [Google Scholar]
  15. Dong, P.B.; Wang, L.Y.; Wang, L.J.; Jia, Y.; Li, Z.H.; Bai, G.; Zhao, R.M.; Liang, W.; Wang, H.Y.; Guo, F.X.; et al. Distributional Response of the Rare and Endangered Tree Species Abies chensiensis to Climate Change in East Asia. Biology 2022, 11, 1659. [Google Scholar] [CrossRef]
  16. Gao, X.X.; Liu, J.; Huang, Z.H. The impact of climate change on the distribution of rare and endangered tree Firmiana kwangsiensis using the Maxent modeling. Ecol. Evol. 2022, 12, 10. [Google Scholar]
  17. Ma, Y.; Liu, D.; Wariss, H.M.; Zhang, R.; Tao, L.; Milne, R.I.; Sun, W. Demographic history and identification of threats revealed by population genomic analysis provide insights into conservation for an endangered maple. Mol. Ecol. 2021, 31, 767–779. [Google Scholar]
  18. Dong, W.; Zhang, X.; Yang, G.; Yang, L.; Wang, Y.; Shen, S. Biological characteristics and conservation genetics of the narrowly distributed rare plant Cinnamomum chago (Lauraceae). Plant Diversity 2016, 38, 247–252. [Google Scholar]
  19. Zhang, X. Species Germplasm Conservation of the Wild Plants with Extremely Small Populations—Cinnamomum chago. Ph.D. Thesis, Yunan University, Kunming, China, 2019. [Google Scholar]
  20. Tao, L.; Han, C.; Song, K.; Sun, W. A tree species with an extremely small population: Recategorizing the Critically Endangered Acer yangbiense. Oryx 2020, 54, 474–477. [Google Scholar]
  21. Tao, L.D.; Guo, S.W.; Xiong, Z.Z.; Zhang, R.G.; Sun, W.B. Chromosome-level genome assembly of the threatened resource plant Cinnamomum chago. Sci. Data 2024, 11, 9. [Google Scholar]
  22. Li, S.F.; Yang, J.H.; Li, S.L.; Hou, M.; Xi, X.L.; Chen, Q. Investigation and Protection on Germplasm Resources of Cinnamomum chago in Yangbi County. For. Investig. Plan. 2020, 45, 88–91+127. [Google Scholar]
  23. Hou, M.; Li, J.N.; Li, S.F.; Yang, J.H.; Xiong, X.W.; Wang, G.S. Nutritional Composition Analysis and Evaluation of Cinnamomum chago. For. Investig. Plan. 2019, 48, 80–85. [Google Scholar]
  24. Warren, D.L.; Glor, R.E.; Turelli, M. ENMTools: A toolbox for comparative studies of environmental niche models. Ecography 2010, 33, 607–611. [Google Scholar]
  25. Wang, D.; Cui, B.; Duan, S.; Chen, J.; Fan, H.; Lu, B.; Zheng, J. Moving north in China: The habitat of Pedicularis kansuensis in the context of climate change. Sci. Total Environ. 2019, 697, 133979. [Google Scholar]
  26. Huang, E.H.; Chen, Y.X.; Fang, M.; Zheng, Y.; Yu, S.X. Environmental drivers of plant distributions at global and regional scales. Glob. Ecol. Biogeogr. 2021, 30, 697–709. [Google Scholar]
  27. Khalil, T.; Asad, S.A.; Khubaib, N.; Baig, A.; Atif, S.; Umar, M.; Kropp, J.P.; Pradhan, P.; Baig, S. Climate change and potential distribution of potato (Solanum tuberosum) crop cultivation in Pakistan using Maxent. AIMS Agric. Food 2021, 6, 663–676. [Google Scholar]
  28. Gan, T.; Qian, Q.; Liu, Z.; Xu, D. Simulation of Suitable Distribution Areas of Magnolia officinalis in China Based on the MaxEnt Model and Analysis of Key Environmental Variables. Agriculture 2024, 14, 2303. [Google Scholar] [CrossRef]
  29. Xu, J.; Wu, Y.; Wang, S.; Xu, Y.; Du, C.; Rohani, E.R.; Tong, X.; Wang, T.; Han, R. Predicting the potential distribution of Arisaema heterophyllum in China under current and future climate change based on ArcGIS and MaxEnt model. Plant Biosyst. 2024, 158, 1326–1334. [Google Scholar]
  30. Wang, Y.S.; Wang, Z.H.; Xing, H.F.; Li, J.W.; Sun, S. Prediction of potential suitable distribution of Davidia involucrata Baill in China based on MaxEnt. Chin. J. Ecol. 2019, 38, 1230–1237. [Google Scholar]
  31. Zhu, D.P.; Yang, L.; Li, Y.H.; Huang, P.; Yao, B.; Kong, Z.; Xiang, Y.Z. Predicting the Potential Distribution of the Endangered Pyrethrum tatsienense in China Using an Optimized Maxent Model Under Climate Change Scenarios. Ecol. Evol. 2024, 14, 12. [Google Scholar]
  32. Wu, H.-Y.; Liu, Y.-H.; He, Q.-X.; Ye, J.-W.; Tian, B. Differential distribution shifts in two subregions of East Asian subtropical evergreen broadleaved forests—A case of Magnoliaceae. Front. Plant Sci. 2024, 14, 1326207. [Google Scholar]
  33. Gu, C.; Tu, Y.; Liu, L.; Wei, B.; Zhang, Y.; Yu, H.; Wang, X.; Yangjin, Z.; Zhang, B.; Cui, B. Predicting the potential global distribution of Ageratina adenophora under current and future climate change scenarios. Ecol. Evol. 2021, 11, 12092–12113. [Google Scholar]
  34. Phillips, S.J.; Anderson, R.P.; Schapire, R.E. Maximum entropy modeling of species geographic distributions. Ecol. Model. 2006, 190, 231–259. [Google Scholar]
  35. Chen, C.; Zhou, L.L.; Han, Y.; Wen, J.W.; Liu, L.Q.; Liu, Q.P.; Peng, C.; He, Y. Comprehensive analysis of the effects of climate change on the species distribution and active components of Leonurus japonicus Houtt. Ind. Crop. Prod. 2024, 218, 11. [Google Scholar]
  36. Chen, J.; He, D. Potential geographical distribution of Cordyceps cicadae and its two hosts in China under climate change. Front. Microbiol. 2025, 15, 1519560. [Google Scholar] [PubMed]
  37. Zhang, X.; Zhou, X.-L.; Liu, Y.-H.; Mo, J.-Q.; Zhang, L.-Q.; Wang, Y.-H.; Shen, S.-K. Investigating the status of Cinnamomum chago (Lauraceae), a plant species with an extremely small population endemic to Yunnan, China. Oryx 2020, 54, 470–473. [Google Scholar]
  38. He, H.; Zheng, X.; Wang, Y.; Wang, W.; Li, M.; Wang, S.; Wang, J.; Wang, C.; Zhan, H. Effects of Climate Change and Environmental Factors on Bamboo (Ferrocalamus strictus), a PSESP Unique to China. Forests 2022, 13, 2108. [Google Scholar] [CrossRef]
  39. Janitza, S.; Strobl, C.; Boulesteix, A.-L. An AUC-based permutation variable importance measure for random forests. BMC Bioinform. 2013, 14, 119. [Google Scholar]
  40. Hanley, J.A.; McNeil, B.J. The meaning and use of the area under a receiver operating characteristic (ROC) curve. Radiology 1982, 143, 29–36. [Google Scholar]
  41. Merow, C.; Smith, M.J.; Silander, J.A., Jr. A practical guide to MaxEnt for modeling species’ distributions: What it does, and why inputs and settings matter. Ecography 2013, 36, 1058–1069. [Google Scholar]
  42. Cobos, M.E.; Peterson, A.T.; Barve, N.; Osorio-Olvera, L. kuenm: An R package for detailed development of ecological niche models using Maxent. PeerJ 2019, 7, e6281. [Google Scholar] [CrossRef] [PubMed]
  43. Pérez-Suárez, M.; Ramírez-Albores, J.E.; Martinez-Campos, A.R. Predicting the impacts of climate change on potential suitability habitats of three Juniperus trees in Mexico. Plant Ecol. 2024, 225, 37–51. [Google Scholar] [CrossRef]
  44. Warren, D.; Seifert, S. Ecological niche modeling in Maxent: The importance of model complexity and the performance of model selection criteria. Ecol. Appl. 2011, 21, 335–342. [Google Scholar] [CrossRef]
  45. Shi, X.; Wang, J.; Zhang, L.; Chen, S.; Zhao, A.; Ning, X.; Fan, G.; Wu, N.; Zhang, L.; Wang, Z. Prediction of the potentially suitable areas of Litsea cubeba in China based on future climate change using the optimized MaxEnt model. Ecol. Indic. 2023, 148, 110093. [Google Scholar] [CrossRef]
  46. Zhang, K.; Yao, L.; Meng, J.; Tao, J. Maxent modeling for predicting the potential geographical distribution of two peony species under climate change. Sci. Total Environ. 2018, 634, 1326–1334. [Google Scholar] [CrossRef]
  47. Yue, Y.; Huang, Y.; Liu, W.; Yang, X.; Wang, L. Predicting the Global Potential Suitable Areas of Sweet Osmanthus (Osmanthus fragrans) Under Current and Future Climate Scenarios. Ecol. Evol. 2024, 14, e70435. [Google Scholar] [CrossRef]
  48. Qiu, L.; Jacquemyn, H.; Burgess, K.S.; Zhang, L.G.; Zhou, Y.D.; Yang, B.Y.; Tan, S.L. Contrasting range changes of terrestrial orchids under future climate change in China. Sci. Total Environ. 2023, 895, 13. [Google Scholar] [CrossRef]
  49. Tao, H.; Kingston, K.; Xu, Z.H.; Bai, S.H.; Guo, L.; Liu, G.L.; Hui, C.M.; Liu, W.Y. Predicting Potential Suitable Areas of Dendrocalamus brandisii under Global Climate Change. Forests 2024, 15, 1301. [Google Scholar] [CrossRef]
  50. Kim, C.; Kim, W.; Song, W.K.Y.; Cho, J.P.; Choi, J. Prediction of Native Seed Habitat Distribution According to SSP Scenario and Seed Transfer Zones: A Focus on Acer pictum subsp. mono and Quercus acuta. Forests 2023, 14, 87. [Google Scholar] [CrossRef]
  51. Qi, S.; Luo, W.; Chen, K.-L.; Li, X.; Luo, H.-L.; Yang, Z.-Q.; Yin, D.-M. The Prediction of the Potentially Suitable Distribution Area of Cinnamomum mairei H. Lév in China Based on the MaxEnt Model. Sustainability 2022, 14, 7682. [Google Scholar] [CrossRef]
  52. Rao, Z.; Qin, Q.; Wei, S.; Guo, H.; Li, Y. Holocene temperature history and its significance to studies on historical human-land relationship in China. Acta Geogr. Sin. 2022, 77, 1169–1180. [Google Scholar]
  53. Tian, Z.P.; Jiang, D.B. Mid-holocene and last glacial maximum changes in monsoon area and precipitation over China. Chin. Sci. Bull. 2015, 60, 400–410. [Google Scholar]
  54. Chen, F.; Duan, Y.; Hao, S.; Chen, J.; Feng, X.; Hou, J.; Cao, X.; Zhang, X.; Zhou, T. Holocene thermal maximum mode versus the continuous warming mode: Problems of data-model comparisons and future research prospects. Sci. China Earth Sci. 2023, 53, 1699–1717. [Google Scholar] [CrossRef]
  55. He, Y. Changes over the past 5000 years in the warming and cooling of southern China. Chin. Hist. Geogr. 1999, 197–207. [Google Scholar]
  56. Chen, D.; Kang, H.; Liu, C. An Overview on the Potential Quaternary Glacial Refugia of Plants in China Mainland. Bull. Bot. Res. 2011, 31, 623–632. [Google Scholar]
  57. Shen, J. The Holocene vegetation history of Lake Erhai, Yunnan province southwestern China: The role of climate and human forcings. Holocene 2006, 16, 265–276. [Google Scholar] [CrossRef]
  58. Dearing, J.A.; Jones, R.T.; Shen, J.; Yang, X.; Boyle, J.F.; Foster, G.C.; Crook, D.S.; Elvin, M.J.D. Using multiple archives to understand past and present climate–human–environment interactions: The lake Erhai catchment, Yunnan Province, China. J. Paleolimnol. 2008, 40, 3–31. [Google Scholar] [CrossRef]
  59. Uchale, N.N.; Singh, B.B. Characteristics and projected changes in maximum daily precipitation across the globe. Q. J. R. Meteorol. Soc. 2024, 151, e4912. [Google Scholar]
  60. Chmura, D.J.; Banach, J.; Kempf, M.; Kowalczyk, J.; Mohytych, V.; Szeligowski, H.; Buraczyk, W.; Kowalkowski, W. Growth and productivity of European beech populations show plastic response to climatic transfer at the north-eastern border of the species range. For. Ecol. Manag. 2024, 565, 9. [Google Scholar] [CrossRef]
  61. Adhikari, D.; Tiwary, R.; Singh, P.P.; Upadhaya, K.; Singh, B.; Haridasan, K.E.; Bhatt, B.B.; Chettri, A.; Barik, S.K. Ecological niche modeling as a cumulative environmental impact assessment tool for biodiversity assessment and conservation planning: A case study of critically endangered plant Lagerstroemia minuticarpa in the Indian Eastern Himalaya. J. Environ. Manag. 2019, 243, 299–307. [Google Scholar]
  62. Stanton, J.C.; Pearson, R.G.; Horning, N.; Ersts, P.; Akcakaya, H.R. Combining static and dynamic variables in species distribution models under climate change. Methods Ecol. Evol. 2012, 3, 349–357. [Google Scholar]
  63. Wilson, R.J.; Gutiérrez, D.; Gutiérrez, J.; Monserrat, V.J. An elevational shift in butterfly species richness and composition accompanying recent climate change. Glob. Change Biol. 2007, 13, 1873–1887. [Google Scholar]
  64. Xian-Ge, H.; Yuqing, J.; Xiao-Ru, W.; Jian-Feng, M.; Yue, L. Predicting Impacts of Future Climate Change on the Distribution of the Widespread Conifer Platycladus orientalis. PLoS ONE 2015, 10, e0132326. [Google Scholar]
  65. Newman, B.J.; Ladd, P.; Brundrett, M.; Dixon, K.W. Effects of habitat fragmentation on plant reproductive success and population viability at the landscape and habitat scale. Biol. Conserv. 2013, 159, 16–23. [Google Scholar]
  66. Breiner, F.T.; Nobis, M.P.; Bergamini, A.; Guisan, A. Optimizing ensembles of small models for predicting the distribution of species with few occurrences. Methods Ecol. Evol. 2018, 9, 802–808. [Google Scholar]
  67. Hao, T.; Elith, J.; Lahoz-Monfort, J.J.; Guillera-Arroita, G. Testing whether ensemble modelling is advantageous for maximising predictive performance of species distribution models. Ecography 2020, 43, 549–558. [Google Scholar]
Figure 1. Distribution records of A. yangbiense and C. chago.
Forests 16 00621 g001
Figure 2. Response curves of A. yangbiense and C. chago for major environmental variables.
Forests 16 00621 g002
Figure 3. Potential distribution areas of A. yangbiense at different times. (a,b) past: LGM and MH; (c) current; (dg) SSP126: 2030s, 2050s, 2070s, and 2090s; (hk) SSP585: 2030s, 2050s, 2070s, and 2090s.
Forests 16 00621 g003
Figure 4. Potential distribution areas of C. chago at different times. (a,b) past: LGM and MH; (c) current; (dg) SSP126: 2030s, 2050s, 2070s, and 2090s; (hk) SSP585: 2030s, 2050s, 2070s, and 2090s.
Forests 16 00621 g004
Figure 5. Change in suitable areas for A. yangbiense and C. chago. (a) A. yangbiense; (b) C. chago.
Forests 16 00621 g005
Figure 6. Shifts of the centroids of A. yangbiense and C. chago at different times. (a,b) The distribution centers of A. yangbiense. (c,d) The distribution centers of C. chago.
Forests 16 00621 g006
Table 1. Screening results for environmental factors of A. yangbiense and C. chago.
SpeciesRetained Environmental Factors
A. yangbienseBio3, bio4, bio13, bio15, bio17, alt, aspect, slope, uvb1, T_sand, T_silt
C. chagoBio3, bio4, bio6, bio13, bio15, bio17, alt, uvb2, uvb6, T_sand, T_silt, T_ph
Table 2. Best models for A. yangbiense and C. chago.
SpeciesRMFCOmission RateDelta AICcMean AUcStandard DeviationAUCDiff
A. yangbiense3.5QP0.2500.9820.0290.0079
C. chago2QPT0.3300.9930.0130.0029
Table 3. The percentage contributions of the environmental factors of A. yangbiense.
The Percentage Contributions of the Environmental Factors of A. yangbiense
EnvironmentDescriptionContribution
VariablesRate/%
bio3Isothermality (bio2/bio7) (×100)12.4
bio4Temperature seasonality (standard deviation ×100)22.2
bio13Precipitation of the wettest month3.9
bio15Precipitation seasonality (Coefficient of variation)2.7
bio17Precipitation of the driest quarter24.3
altAltitude17.2
aspectAspect0.6
slopeSlope0.3
uvb1Annual mean UV-B3.8
T_sandTopsoil sand fraction3.4
T_siltTopsoil silt fraction9.2
Table 4. The percentage contributions of the environmental factors of C. chago.
The Percentage Contributions of the Environmental Factors of C. chago
EnvironmentDescriptionContribution
VariablesRate/%
bio3Isothermality (bio2/bio7) (×100)13.7
bio4Temperature seasonality (standard deviation ×100)5.6
Bio6Min temperature of the coldest month34.8
bio13Precipitation of the wettest month5.2
bio15Precipitation seasonality (Coefficient of variation)2.1
bio17Precipitation of the driest quarter7.2
altAltitude15.4
uvb2UV-B seasonality14
uvb6Sum of monthly mean UV-B during lowest quarter 0.3
T_sandTopsoil sand fraction0.5
T_siltTopsoil silt fraction1
T_phTopsoil pH (H2O)0.2
Disclaimer/Publisher’s Note: The statements, opinions and data contained in all publications are solely those of the individual author(s) and contributor(s) and not of MDPI and/or the editor(s). MDPI and/or the editor(s) disclaim responsibility for any injury to people or property resulting from any ideas, methods, instructions or products referred to in the content.

