Article

Annual Tree Biomass Increment Is Positively Related to Nonstructural Carbohydrate Pool Size and Depletion: Evidence for Carbon Limitation?

1
School of Ecology, Northeast Forestry University, Harbin 150040, China
2
Key Laboratory of Sustainable Forest Ecosystem Management—Ministry of Education, Northeast Forestry University, Harbin 150040, China
3
College of Forestry, Northeast Forestry University, Harbin 150040, China
4
College of Exercise Human Science, Harbin Sport University, Harbin 150096, China
5
Warnell School of Forestry and Natural Resources, University of Georgia, Athens, GA 30602, USA
*
Author to whom correspondence should be addressed.
Forests 2025, 16(4), 619; https://doi.org/10.3390/f16040619
Submission received: 17 February 2025 / Revised: 21 March 2025 / Accepted: 26 March 2025 / Published: 1 April 2025

Abstract

:
Nonstructural carbohydrates (NSCs) are key storage molecules that can be used for tree growth and metabolism. The trade-off between NSC storage and biomass production has been long reported on. However, the carbon source limitation (indicated by NSC storage) to biomass production remains poorly quantitively assessed. The seasonal whole-tree NSC pool dynamics of 12 temperate tree species were quantitatively evaluated across seven seasonal sampling points. The ratio of seasonal variation in whole-tree NSC pool to annual biomass increment (the ΔNSC/ABI ratio) and the linear relationship of annual biomass increment to NSC storage were used to assess the coupling of NSC storage to annual biomass production. Whole-tree NSC pools were consumed in early summer when structural growth peaked and recovered in the nongrowing season, indicating a short-term trade-off between storage and growth. The ΔNSC/ABI ratio was on average 0.59, with a large interspecific variation. Notably, there was a significant positive correlation between the storage of NSC and the 10 yr mean annual biomass increment, indicating a storage–growth coupling and the source limitation of growth in the long term. However, the storage cost of biomass production decreased along the slow-growth-to-fast-growth species continuum, mirroring the spectrum from conservative to acquisitive NSC use strategies. These findings highlight the critical role of time scale in understanding the relationship between storage and growth, which should be considered in the framework of simulation and conceptual models.

1. Introduction

Plant photosynthates are used for respiration, growth, defense, or storage for future use. Because trees are long-lived plants with large biomass and complex carbon allocation [1,2], and are likely to encounter many stressful events throughout their lifetimes [3,4], the storage of nonstructural carbohydrates (NSCs) is especially crucial for survival and growth [5].
The storage of NSCs occurs during periods of carbon surplus between source and sink seasonally, or biotic and abiotic stresses such as drought [5,6,7]. When photosynthesis exceeds the carbon demand, the NSC pool is supplemented (accumulation and reserve formation). Conversely, if there are not enough photosynthates available under non-stressful conditions, the whole-tree NSC pool is depleted (reused) [6,8,9]. Most photosynthetic products are not immediately or directly used for plant structural construction and metabolism, but rather are temporarily stored in the form of NSCs [10]. However, the NSC pool is an inherently labile and recyclable carbon sink [5,11], rather than a structural and irreversible carbon sink like structural growth and respiration [12]. Some of the temporarily stored NSC pool can be recycled for growth, respiration, or defense by trees [5,13], and current growth may be partly supplied by NSCs stored years before [5,10,14,15]. Therefore, NSC storage plays a central role in tree growth strategies and carbon economics [5,16,17].
Whether tree growth is controlled by source limitation (the availability of carbon for plant growth) or sink limitation (the tree’s ability to use the available carbon) has become a hot topic recently [7,18,19,20,21,22]. Understanding the prioritization of carbon allocation to NSC reserve pools relative to structural growth, respiration, and defense is crucial for assessing sink vs. source limitations. Regarding the priority of carbon allocation [20], there are two opposite hypotheses about NSC storage, i.e., passive accumulation and active storage [5,23,24,25]. Passive accumulation is common during the late stage of the growing season as growth declines [6,26]. Active storage, often characterized by increased NSC storage and decreased growth, may be a plastic or adaptive response to reduce the risk of carbon limitation under stresses such as drought, low temperatures, and biotic attack [4,8,12,20]. Under non-stressful environmental conditions, however, exploring the coupling/decoupling between whole-tree NSC storage and structural growth across species based on observation [9,27] helps identify the source or sink limitation of tree growth [17,28].
The relationship between NSC storage and structural growth has long been discussed and debated within the framework of tree carbon allocation [5,7,17,23]. The time scale of observation is critical for understanding the relationship between NSC storage and growth in relation to tree carbon economics [12,13,17,25]. Theoretically, the carbon allocation to NSC storage and its reallocation must maximize the total growth or gross performance of a tree in the long term [12,17,20], suggesting a coupling of storage and growth. We still lack a quantitative understanding of the importance of NSC storage to annual biomass production across plant functional types [5,28], and inter-specific variation in the contribution of NSC stores to growth remains poorly understood (c.f., [9]), which together substantially limits the modeling of carbon allocation in trees and forests [25,29].
Our poor understanding of the relationship between NSC storage and growth, as well as the variation in whole-tree NSC storage among species, is partly due to the difficulty of measuring whole-tree NSC pool dynamics [1,4]. NSC concentrations vary with season differently across biomes [16,26] and among species [9,30], but only a very few studies have concurrently measured NSC seasonal dynamics in all tree organs [4] for whole-plant carbon budgeting. And most studies rely on NSC concentration to indicate NSC pool for simplicity, whereas NSC pools and fluxes are only rarely considered [5,8,29,31]. A simple and robust measure of NSC storage capacity (or available NSC) for a tree in a year under normal environmental conditions is the absolute seasonal variation in NSC pool, i.e., the difference between the maximum and minimum values [9,30]. To accurately estimate the whole-tree NSC pool, both concentration and biomass for each organ are required [9,32]. Within-organ variation should be considered when estimating the NSC pool and allocation [4]. For example, NSC concentrations generally decline from bark to pith across the tree stem [30], thus measuring NSC from a wood core that does not represent the entire radial profile would underestimate the stem NSC pool due to an underestimated biomass proportion from bark to pith [33]. The lack of specificity in NSC and biomass for each organ makes it difficult to scale organ-level measurements to the whole-tree level, and to compare the seasonal dynamics of whole-tree NSC pools among different tree species. These methodological defects limit the accurate determination and understanding of seasonal variation in NSC pools among tree species.
In this study, four coniferous and eight broadleaved tree species in a typical temperate forest of Northeastern China were selected to investigate the seasonal dynamics of whole-tree NSC pools, via eight sampling points throughout 12 months. The continental monsoon region of Northeast Asia has a warm humid summer and a cold dry winter. Due to this distinct seasonality of climate, significant fluctuations in NSC storage and growth were expected in these forests [16]. However, rare data on the seasonality of NSCs for multiple organs of trees are available in this region compared with its North American and European counterparts [16,26]. The contribution of seasonal NSC storage to annual biomass production was quantified for these trees. This study is focused on the seasonal storage of NSCs to better understand the relationship between NSC storage and structural growth under non-stressful environmental conditions. We address the following questions: (1) What are the magnitudes of whole-tree NSC pools and how do they fluctuate seasonally? (2) Do the ratios of seasonal variation in whole-tree NSC pool to annual biomass increment differ significantly among leaf form or habit, shade tolerance, and wood porosity types? (3) Is there a coordination or trade-off between storage (the seasonal fluctuation or the maximum of NSC pools) and growth (the annual biomass increment)?

2. Materials and Methods

2.1. Experimental Design and Field Sampling

To quantify the importance of the seasonal storage of NSC to annual biomass increment, we conducted a comprehensive site-scale study in a typical temperate forest at the Maoershan Forest Ecosystem Research Station (45°24′ N, 127°40′ E), Heilongjiang Province, northeastern China. The forests were mainly secondary forests and plantations. The climate is continental monsoonal, with warm and humid summers and cold and dry winters. The mean annual temperature was 2.0 °C, and the mean annual precipitation was 676 mm between 2008 and 2018. The climate for the study period was normal (Figure S1), which greatly excluded the impacts of environmental stress on NSC storage and growth. Twelve common tree species (coniferous and broadleaved) and leaf phenology types (evergreen and deciduous) were sampled at eight time points across different seasons, of which the seasonal mean concentrations and pools of stem NSC [33] and the NSC concentration dynamics of leaf and branch [34] were previously reported. The total NSC content and its components (starch and sugar) in each organ of the trees were obtained by the product of its biomass and NSC concentrations (biomass × concentration) [9,32,33], and summed to generate whole tree NSC pools [35]. We determined the mean annual biomass increment (ABI) based on diameter at breast height (DBH), mean ring width, and species-specific biomass allometric equations [36], and then explored the relationship between NSC storage and annual biomass increment.

2.1.1. Tree Species Selection and Organ Separation

We selected 12 tree species, including 3 planted evergreen conifers and 1 planted deciduous conifer from plantations with an age of about 50 years, and 8 deciduous angiosperms from secondary forests with ages from 50 to 80 years. To reduce the influences of light and tree age, three dominant individuals of each species were randomly selected. The basic characteristics of the sampled trees for the 12 species are listed in Table 1. Foliage, branch, stem (bark, sapwood, and heartwood, if formed), stump, and root (coarse, intermediate, and fine roots were defined with root diameter ranges of 5 mm to 30 mm, 2 mm to 5 mm, and <2 mm) of all tree species were sampled, respectively. Tree height (H) and DBH were measured for each tree.

2.1.2. Sampling Date

The 8 sampling points ranged from April to October in 2010 and 2011, based on the leaf phenology [37,38]. They were mid-April (before bud-break), mid-May (early-leafing species began to expand leaves), late May (late-leafing species began to expand leaves), late June (leaves nearly fully expanded), mid-August (peak leaf area and late wood formation), mid-September (before leaf senescence), and late October (complete defoliation for the deciduous species). One additional sampling was conducted in mid-April of the next year for a check of interannual variation, but it was not used in the analyses of seasonality and the storage of NSCs. Each sampling was completed within three days to keep seasonal patterns among species comparable.

2.1.3. Sampling of Foliage and Branch

Previous studies at this site demonstrated that the vertical variations in the NSC of foliage and small branches within the crown were considerably low, but the variations in NSC concentration with branch diameter were very high [39,40]. One small branch in the middle of the crown was excised with an averruncator and foliage was randomly sampled and mixed to represent the mean of the whole crown. To minimize the influence of canopy position on NSC concentration, we selected the branches in the middle layer and outer part of the canopy to represent the entire canopy for all sample trees. The branch sample was mixed with branch sections with a cut-off diameter of 3 cm (excluding current-year twigs).

2.1.4. Sampling of Stem Tissues

We carefully considered axial and radial variations in NSC concentrations to obtain accurate estimates of the stem NSC pool [33]. Three stem cores deep to the pith were drilled except for the north direction at each of the four height levels (the stump, the breast height, the crown base, and the mid-crown). The cores were drilled using an increment borer with an inner diameter of 5.15 mm (Haglof Sweden AB, Långsele, Sweden). Briefly, the bark from the four height levels was combined into one sample, and wood cores were separated into sapwood and heartwood for each height level according to their color and transparency, except for white birch and Amur linden. For white birch and Amur linden, two sapwood species, the wood cores were cut into 2 cm length segments from the outermost wood to the pith to arrive at a more accurate estimation of NSC for the whole stem wood [38]. The NSC pool for each stem tissue sample (i.e., bark, sapwood, and heartwood) was computed as the product of its biomass and the corresponding concentration of NSCs, and the NSC pool of the whole stem was the sum of that in each tissue. In particular, the NSC pool of the sapwood and heartwood was the sum of four round table or cone wood segments. The detailed methods can be found in [33]. Note that we updated the biomass equations for a few species (Tables S1 and S2).

2.1.5. Sampling of Belowground Tissues

The stump was sampled with an increment borer as described above. Root samples were excavated from a soil depth of 5–30 cm with a shovel. After washing, the excavated roots were divided into the categories coarse (>5 mm), intermediate (2–5 mm), and fine root (<2 mm) according to their diameter.

2.1.6. Sample Processing

All samples were immediately placed in a refrigerated box at 0~4 °C in the field after acquisition, and returned to the laboratory on the same day, where metabolism was deactivated in a microwave oven [30]. Then, they were dried to constant weight in a 75 °C incubator. After crushing and sieving, they were used for NSC analysis.

2.1.7. NSC Concentrations

As we were interested in total storage [23], NSC was defined as the sum of soluble sugars (glucose, sucrose, fructose, etc.) and starch [9]. The concentration of soluble sugars and starch was determined by a modified phenol–sulfuric acid method [33] to avoid the overestimation of starch [41]. Briefly, soluble sugars were extracted with 80% ethanol, and starch was digested into soluble sugars and dextrin using alpha-amylase, and then the concentrations were read after adding a phenol–sulfuric acid solution with a colorimetric method (Method A1). All concentration values were calculated on a mass basis (dry matter percentage, %DM).

2.2. Data Analysis

2.2.1. Tree Organ Biomass

The biomass of foliage, branch, stem (bark, sapwood, and heartwood) and total roots were calculated by the biomass allometric equations against the diameter at breast height (DBH) or DBH and tree height of the 12 tree species [42,43,44,45,46], which are listed in Table S1. The proportion of bark biomass to total stem biomass was based on the average value obtained from the measured data or from the existing literature and direct measurements in Northeast China (refer to Table S3 for details). The NSC pool in the bark on average accounted for 34% of that in the whole stem for these trees [33]. The biomass of the stump and coarse roots was partitioned from the allometric-based belowground biomass by the measured biomass proportion of the stump for each species (Table S4). The proportion of intermediate and fine root biomass to total biomass could not be estimated from the biomass equations. Instead, we estimated the biomass of intermediate and fine roots using species-specific ratios of root biomass to foliage biomass (Table S5) using stand-level data either from direct measurements or from the literature. The biomass was normalized to an identical tree size (i.e., a DBH of 30 cm) to minimize the large effects of tree size on NSC pool and biomass allocation. This is particularly important when analyzing the relationship between NSC storage and annual biomass increment, because both NSC pool and biomass increase with tree size.

2.2.2. Diameter or Age Effects on Organ NSC Estimation

We corrected for the overestimation of NSC pool size due to the use of small-diameter branches. The correction factor for estimating the total branch NSC pool using 3 cm diameter branches was 0.689 for Manchurian walnut and 0.716 for Japanese elm [39]. The mean correction factor (0.703) was used for other broadleaved tree species. It was unnecessary to correct the diameter effect on the branch NSC pools of conifer species because of their thin first-order branch diameters. For roots, we estimated the NSC pools by separating the three root diameter classes and the stump, because NSCs also decrease as root diameter increases [47].

2.2.3. Proxy of NSC Storage

We used the absolute variation in the NSC pool [9] and the maximum NSC pool during one growing season (7 sampling points) as two proxies of NSC storage. The sampling of the next spring was not used to calculate the NSC storage because of some unknown processes (such as winter photosynthesis) during the winter. The total NSC (the sum of soluble sugars and starch) pool and its fluctuation were used in this study because we were interested in total storage [23]. The total NSC in all organs for each sampling was summed up as a measure of the whole-tree NSC pool. This method avoided the overestimation of the seasonal fluctuation of the NSC pool by potential recounting due to the remobilization of NSCs among tree organs [1,48,49] and conversion between soluble sugars and starch [11,16,50]. The absolute seasonal variation in NSCs [30], calculated as the difference between the maximum and minimum of the NSC pool in a year [9], provides a robust measure of the amount of a tree to store or recycle NSCs in a whole climatic cycle. However, starch as the most important long-term storage form was also tested as a simple storage form [51]. NSC storage is a reasonable measure of the sum of fast and slow pools of NSC reserves due to the rapid mixing of old and new NSC pools [5,14]. The maximum NSC pool in a year was also adopted as a simple measure of NSC storage [16], although there was a lower limit of NSC as a safety threshold below which the tree would die.

2.2.4. Annual Biomass Increment

The mean annual biomass increment is the difference in the sum of the total biomass for all organs between the current year and the previous year. The wood cores were sampled using a borer in 2013. Then, the cores were polished to measure the annual ring width for the 10 years preceding the year of NSC sampling. The mean ring width for years 1, 3, 5, and 10 were used to calculate the mean annual DBH growth. We found the 10 yr mean ring width yielded the strongest correlations between annual biomass increment and NSC storage (Table S9) and conducted our analyses using that value. The 10 yr mean annual biomass increment largely eliminated the interannual fluctuation

2.2.5. Difference Among Organs, Species, and Plant Groups

The differences in the NSC concentration and pool between organs and species were tested using a nested analysis of variance (ANOVA) and the Tukey HSD post hoc test. The three sampling trees for each species were nested into the 7 sampling dates as a random effect, and tree species, date, and their interactions were treated as fixed effects. The mean NSC pool was directly compared between coniferous and broadleaved species with the independent-samples t-test.

2.2.6. Significance of NSC Storage to Growth

Integrated across all organs, we defined the whole-tree biomass-weighted NSC concentration as the NSC pool of the whole tree divided by the whole-tree biomass. This mass-weighted concentration enables an interspecific comparison at the whole-plant level. We used two methods to quantify the importance of NSC storage to biomass production. First, the ratio of absolute variation in NSC pool to annual biomass increment (ΔNSC/ABI) was used to measure the importance of seasonal NSC storage to structural growth. A higher ΔNSC/ABI value indicates a greater reliance of the tree’s structural growth on NSC reserves. Second, the slope of the standardized major axis (SMA) regression was used to test the relationship between storage and growth. A positive relationship indicates a coupling of storage and growth or a carbon limitation of these trees. Mathematically, a scaling exponent significantly below unity indicates a negative allometric relationship between NSC accumulation and growth rate augmentation, demonstrating decelerating storage dynamics concomitant with increasing growth demands. Note this expression of NSC storage considered the mixture and reallocation of carbon from both new and old stored NSC [10] in a long-term view of tree carbon economics [17,52].

3. Results

3.1. Whole-Tree NSC Pool and Its Allocation Among Organs

On an annual average basis, the NSC pools had significant variations among the 12 species when the DBH was normalized to 30 cm (Table S6, p < 0.001; Figure 1a). For conifers, the NSC pool of Mongolian pine (25 kg) was the highest, while the NSC pool of Korean pine was the lowest (13 kg). For broadleaved trees, the highest NSC pool was in Manchurian walnut (31 kg) while the lowest was in white birch (18 kg). There were no significant differences in NSC pool between leaf forms or habits, shade tolerance classes, or wood types (all p > 0.05, Table S8). The rank of species-specific mean NSC pool (Figure 1a) was quite different to that of biomass (Figure S2a). Notably, the pools of soluble sugars were comparable to or even higher than the starch pools (Figure S3). The whole-tree biomass-weighted NSC concentration averaged 4.9% DM, ranging from 3.3% DM (white birch) to 6.3% DM (Manchurian walnut) (Figure S4), and there were no significant differences between plant functional groups (Table S8).
The percentages of NSC pools in the foliage, branches, stems, and roots significantly differed among the 12 tree species (Figure 1b, p < 0.001). The stem NSC pools accounted for 26.2% (Japanese elm) to 66.5% (Korean spruce) of the whole-tree pool, and the root contributed from 11.9% (Korean spruce) to 42.8% (Japanese elm) to the whole-tree NSC pool. For two species, Manchurian ash and Japanese elm, the NSC pool of the root was higher than that of the stem. The branch NSCs accounted for 12.8% (Korean spruce) to 28.7% (Ussuri poplar) of the whole-tree pool, and the leaf NSC pool shared a percentage from 1.7% (Manchurian ash) to 8.8% (Korean spruce). On average, the allocation coefficients of NSC pool to foliage, branch, stem, and root were 3.9%, 22.5%, 45.2%, and 28.4%, respectively. The allocation of the NSC pool to the stem was much lower than that of the biomass allocation to the stem (45.2% vs. 60.3%; Figure 1b).

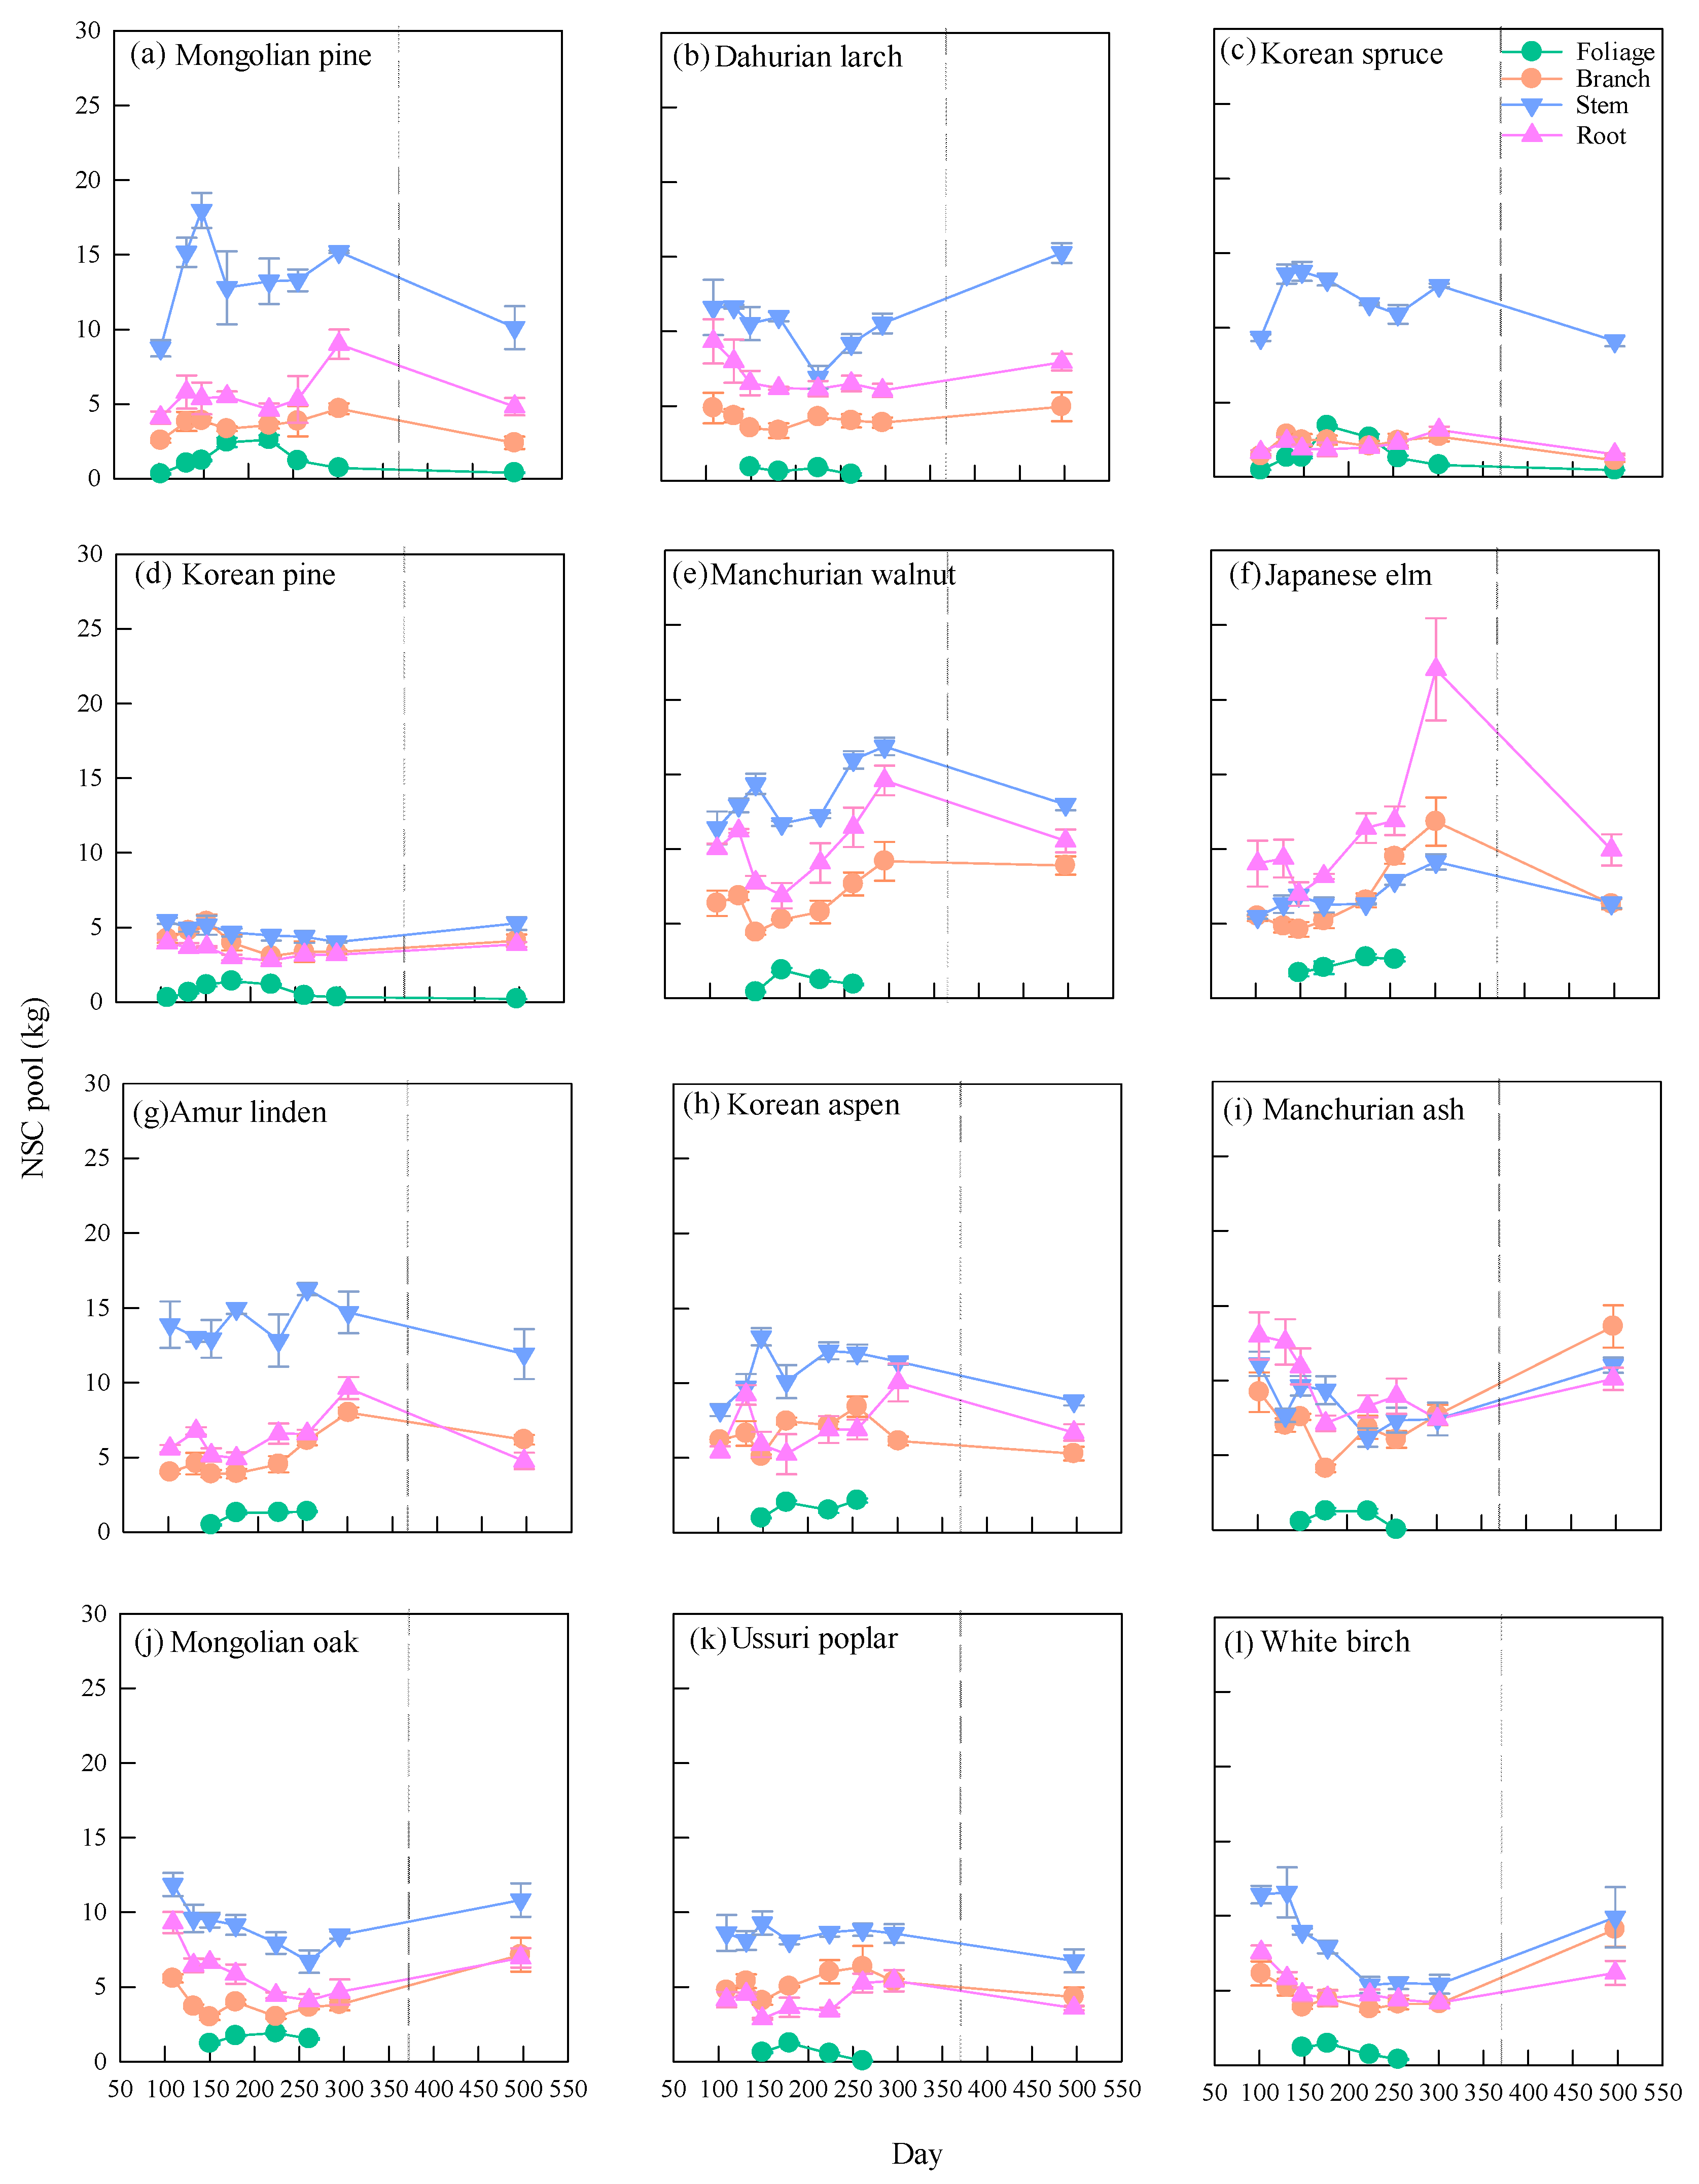
3.2. Seasonal Dynamics of NSC Pool

There were distinct seasonal variations in the NSC pools of all 12 tree species (Table S6, p < 0.001). The NSC pools of most tree species were depleted in the early summer and recovered in the autumn or in the next spring (Figure 2). The NSC pools peaked in October for most deciduous tree species, in August for Korean aspen and Ussuri poplar, and in late spring or autumn for the evergreen tree species. The seasonal patterns of whole-tree pools of sugar and starch diverged from each other (Figure S5). In general, the absolute variation in the whole-tree NSC pool ranged from 3.7 kg (Ussuri poplar) to 23.0 kg (Japanese elm), and the sum of absolute variations in soluble sugars and starch was generally higher than that of the NSC pool (Figure S6). There were also no significant differences among the functional types (all p > 0.05).
The seasonal fluctuation of the NSC pool was organ-dependent (Figure 3; Table S7, p < 0.001). The absolute variation in the foliar NSC pool was the lowest (1.3 kg), with a range of 0.5 kg (Dahurian larch)~3.0 kg (Korean spruce). The absolute variations in the branch (3.3 kg) and stem (4.6 kg) NSC pools were intermediate, being between 1.4 kg (Korean spruce) and 7.2 kg (Japanese elm) and between 1.2 kg (Ussuri poplar) and 9.2 kg (Mongolian pine). Notably, the absolute variation in the root NSC pool was the largest (5.0 kg), ranging from 1.2 kg (Korean pine) to 15.1 kg (Japanese elm) (Figure S7). The seasonality of the NSC pools was roughly consistent among the three non-photosynthetic organs (branch, stem, and root), while the seasonality of the foliar NSC pool was usually unimodal. The soluble sugar pools generally reached their lowest points in summer and their highest points in the dormant season for non-photosynthetic organs (Figure S8), while the maxima and minima of the starch pools were highly species- and organ-dependent (Figure S9).

3.3. Relating Whole-Tree NSC Storage to Annual Biomass Increment

The absolute variation in whole-tree NSC pool differed dramatically among the 12 species (Figure 4). When tree size was normalized to a DBH of 30 cm, however, the absolute variation in whole-tree NSC pool for the broadleaves was only 1.4 times that for conifers (p = 0.308). The Japanese elm had a larger intraspecific variation in absolute NSC pool size than other species, but was still lower than the interspecific variation. Notably, the proportion of absolute variation in whole-tree NSC pool to annual biomass increment (normalized to a DBH of 30 cm) was on average 0.59, varying from 0.22 (Ussuri poplar) to 1.38 (Mongolian pine). There were no significant differences between broadleaves and conifers (p = 0.078).
There were significantly positive correlations between NSC storage and annual biomass increment (p < 0.01, Figure 5a). For the two measures of NSC storage, the maximum of the NSC pool was better than the absolute variation in the NSC pool related to the annual biomass increment (R2: 0.43 vs. 0.22). The SMA slope of 0.50 [0.354, 0.707] (95% CI) for the maximum NSC pool was significantly lower than 1, while that (0.89 [0.596, 1.329]) for absolute variation in NSC pool differed insignificantly from 1. However, using the storage of starch instead of the total NSC pool led to much lower R2 values (0.11), but similar magnitudes of scaling exponents (Figure S10). Notably, the storage cost of biomass production decreased as ABI increased (Figure 5b).

4. Discussion

Using the comprehensive dataset on annual NSC storage and biomass production, we assessed the importance of the seasonal capacity of NSC storage to tree growth. As anticipated, the NSC pools exhibited depletion in early summer (when structural growth peaked) and subsequent recovery in autumn or the following spring (when growth ceased) for most of the tree species studied, indicating a trade-off between storage and growth at short time scales [16,26]. Among the four organs, the stem typically had the largest proportion of the whole-tree NSC pool, while the root often held the highest mean absolute variation in the NSC pool. Perhaps most importantly, our research revealed diminishing returns associated with biomass production as seasonal NSC storage or maximum NSC pools increased, suggesting a source limitation [7] of temperate tree growth in the long run across these species. These novel findings underscore the critical role of NSC storage in biomass production and provide robust data to enhance the understanding of tree carbon allocation.

4.1. The Size of the Whole-Tree NSC Pool

Overall, when the tree size was standardized to a DBH of 30 cm, the whole-tree NSC pool was between 13 kg and 31 kg (Figure 1a). Our estimates of whole-tree NSC pool may be more accurate than most previous estimates because we used organ- and species-specific biomass equations and considered the radial and vertical variation in stem NSCs and the diameter effect on branch and belowground NSCs. These detailed biomass equations and parameters (Tables S1–S5) are critical for up-scaling, particularly for comprehensive field sampling from various organs or sub-organs. Nevertheless, we did not detect any significant difference in the whole-tree mean NSC pool between leaf forms or habits, shade tolerance classes, or wood types (Table S8). These results challenged previous assumptions regarding the significant effects of plant functional groups on the NSC concentrations of particular tissues (e.g., sapwood, [53]).
The biomass-weighted NSC concentration of the whole tree (i.e., the NSC pool relative to the biomass) is very useful for comparison between species and studies, because the size of the NSC pool was determined by the tree size and NSC concentration. Our whole-tree biomass-weighted mean NSC concentrations were between 3.3% DM and 6.3% DM, while they were between 5.4% DM and 10.0% DM for a subtropical evergreen broadleaved species (Castanopsis hystrix) and for evergreen coniferous species (Pinus massoniana), respectively [35], and even as high as 10.1% DM and 15.4% DM for two boreal evergreen coniferous species, Pinus contorta and Picea glauca [54]. These results suggest a substantial difference in NSC concentration among tree species, when ignoring the potential errors due to NSC extraction and determination [41] and field sampling and up-scaling [9]. However, other studies with multi-sampling times did not directly report biomass-weighted mean NSC concentrations. We recommend scaling the NSC concentrations from organs to the whole-tree and even the ecosystem level to better assess the role of NSC storage in biomass production and carbon cycling.
Among the four organs, the stem was always the largest biomass component and often the largest component of the NSC pool (Figure 1; Figure S2) [9,32]. Roots and branches also provided a considerable proportion of NSC pool (Figure S2) [55]. The leaf NSC pool was much smaller, but cannot be ignored for evergreen coniferous trees, as reported in boreal trees [54]. The proportions of organ NSCs can serve as a valuable reference for future sampling designs aimed at assessing the whole-tree NSC pool. However, the root NSCs were often more dynamic in accumulation and depletion (Figure S7), and thus might be potentially more active in whole-tree storage [4,9,27]. Any simple quantification of the activity of NSC storage organs based on pool change should be somewhat questionable because of the considerable remobilization of NSCs among tree organs [1,49].

4.2. The Seasonality of Whole-Tree NSC Pools: Storage–Growth Trade-Offs in the Short Term

The seasonal patterns of NSC pools (reaching a minimum in summer and a maximum in the dormant season or before sprouting) for our temperate trees suggested a clear seasonal trade-off between storage and growth (Figure 2 and Figure S5). This was generally consistent with previous studies [6,16,26,27,30,56]. In northern latitudes, the whole-tree NSC pool often reaches its lowest point when the biomass growth peaks. The highest xylem growth rates usually peaked in June to August [57,58] and this was often accompanied by a decrease in the NSC pools of temperate and boreal trees [27,54,59]. Although we did not measure stem radial growth synchronously with NSC measurements, the peak of stem growth for six species [60] and the stem respiration for 14 species [61] occurring in early summer was prior to the peak of air temperature, and indeed confirmed the maximum growth in this period. This general seasonal storage–growth trade-off is due to NSC storage being a transient carbon sink [5,12] that can compete for a limited carbon source (i.e., gross primary production) with other carbon sink terms such as secondary xylem growth [18,19,23,25].
We also noted that there were significant interspecific differences in the seasonal variation in NSC pool (Table S6, [9,35]), reflecting contrasting NSC use strategies among plant species [5,17,30]. Overall, the absolute variation in the NSC pools of deciduous broad-leaved trees was slightly higher than that of evergreen coniferous trees (Figure S6). In the spring, deciduous trees need more stored NSCs for new leaf growth and xylem formation than evergreens [6,30]. Therefore, it has been argued that the whole-tree NSC pools of deciduous trees exhibited greater seasonal variation than did those of evergreen trees. But this difference may not remain statistically significant when the tree size is normalized to a DBH of 30 cm.
We unexpectedly found that NSC pools increased during the leaf-off season for a few deciduous tree species, such as Dahurian larch, Manchurian ash, white birch, and Mongolian oak (Figure 3). The increase in NSC pool size during the leaf-off season might be partly interpreted as being due to bark photosynthesis by twigs [62,63], and is also found in stem sapwood [10]. The breakdown of hemicellulose and lipids would also play a supplementary role in NSC pool formation [30,64,65]. Nevertheless, these factors may be insufficient to fully interpret the large increase in the whole-tree NSC pools, thus the off-season uptrend of NSCs is still an outstanding question in NSC storage.
Seasonal interchanges of soluble sugars and starch were also demonstrated in our data (Figure S5). The components of NSCs can be converted to each other to adapt to phenological and temperature changes. During the period from April to June, the sugar pools in the branches, stems, and roots of most tree species continued to decline, while the starch pools increased slightly (Figures S8 and S9), reflecting a shift from soluble sugars (that are easy to transport and metabolize) to starches (that are metabolically inert) [10,17]. The spring decrease in soluble sugars was due to two main reasons—a reduction, as temperatures rise, in the maintenance of a high osmotic potential (with soluble sugars) for resistance to low temperatures and the consumption of NSCs, including soluble sugars, by new structural tissues and increasing respiration [6,8,10]. In this study, the starch storage of Amur linden and Ussuri poplar trees in the spring of the second year was lower than that in the previous spring (Figure S5), which may be due to the hydrolysis of starch in the stems of individual trees in spring [66] or interannual fluctuation (see, for example, [10]). The higher concentration and large pool size of soluble sugars under cold-temperature conditions were involved in the osmotic regulation of cells and are also signal substances for adaptation to environmental changes [5,8,16,26]. The conversion between soluble sugars and starch also suggested that using the sum of the two components is better in terms of assessing the dynamics of storage [23].

4.3. Coordination Between NSC Storage and Biomass Production: Carbon Limitation

Our results demonstrate that seasonal NSC storage accounted for an average of 0.59 of the annual biomass increment (ranging from 0.22 to 1.38; Figure 4). This range aligns with values reported for subtropical, temperate, and boreal trees (0.42–1.32, recalculated from seasonal NSC fluctuations and biomass increment data [32,35,54,67]), despite minor methodological differences in sampling and up-scaling approaches. At the ecosystem scale, ΔNSC/ABI ranged from 0.32 to 0.72, with an average of 0.59 [30,68,69]. NSC storage exhibits substantial interannual variability, primarily driven by the fluctuation of environmental factors [10,70], while also demonstrating a pronounced legacy effect that persists for a few years [71,72]. The climate was normal for the year in which we sampled NSCs and the year before (Figure S1), which promised a reasonably steady state and the representativeness of mean NSC storage.
The storage–growth relationship is ideally to be tested across years, because the benefit of storage needs to be evaluated in the long run. However, the legacy effect of climate on tree growth in natural climate conditions [15,19] may confuse the NSC storage–growth relationship. Interestingly, the correlation between total NSC storage and the annual average biomass increment was the highest for the 10-year time scale of biomass production (Table S9), indicating that the role of NSC storage in biomass growth persisted across multiple years. Matching the seasonal maximum pool and net storage of NSCs with the decadal mean annual biomass increment was reasonable, because the mean age of NSCs was estimated to be around 10 years for Acer rubrum [10] and the four species (Pinus strobus, Populus tremuloides, Quercus gambelii, and Quercus rubra) with a shortest longevity similar to our species [73]. However, using the starch pool as a measure of NSC storage resulted in similar results but lower correlations (Figure S10), indicating the importance of removing the conversion between soluble sugars and starch (Figure S5) from NSC storage studies.
We quantified the relationship of NSC storage with long-term biomass production. The significant positive correlation between biomass production and NSC storage (Figure 5) suggests the coordination of storage and growth, and a source limitation of tree growth [7,18,19,20]. Growth does not necessarily rely solely on new photosynthetic assimilates a substrate, but rather a mixture of old reserves and new assimilates [5,10,14]. Therefore, the time scale is critical to understanding the relationship between storage and growth. Note that the trade-off in the short term is not contradicted by coordination in the long term because the costs (decreasing current growth) and benefits (promoting future growth) of storage must be evaluated in the long term [17].
The storage cost of biomass production can be evaluated by the relationship between annual storage and growth when no mortality occurs. An SMA slope lower than the one for NSC storage (particularly the maximum NSC pool) against ABI (scaling the power of NSC storage against ABI) (Figure 5a) indicates that biomass production was maintained by a smaller increment of NSC storage in trees with higher production than trees with lower production. In other words, slow-growth species exhibited a conservative NSC use strategy, whereas fast-growth species demonstrated an acquisitive NSC use strategy. Indeed, the storage cost of biomass production was higher for slow-growth species (Figure 5b). That is to say, fast growing species rely on more current photosynthates than slow-growth species. The NSC storage cost of 10 kg of annual biomass increment was 2.3 kg as the NSC pool maximum was reached, while the NSC storage cost of 40 kg of annual biomass increment was only 0.5 kg as the NSC pool maximum was reached. The corresponding NSC storage costs for the absolute variation in NSC pool were 0.8 and 0.2 kg, respectively. This might be the first cross-species estimate of the NSC-based cost of biomass production after Chapin III, Schulze and Mooney [17] elucidated the framework of ecology and the economics of storage in plants about 35 years ago.
Despite the innovative aspects of this study, several limitations should be acknowledged in interpreting the results. First, the timing of NSC sampling may compromise the estimation of the absolute variation in whole-tree NSC pools [9,16]. We used data from seven sampling points across an annual cycle, with the sampling in the spring of the second year being excluded when calculating seasonal NSC storage. We assumed that these sampling points, at a steady state (ignoring the interannual trend in NSC pool variation), captured the peaks of NSC concentrations and thus pools for all species. Assuming a steady state meant that the interannual variation in NSC concentrations and pools was neglected in this study. Note that our evidence supporting source limitation to tree growth is across species, rather than within species across years. Therefore, multi-year measurements with manipulation experiments or natural climate gradients [71] are critical to test our results on the proportion and scaling exponent of NSC storage to the biomass increment. Second, we did not measure the seasonal structural growth synchronously with NSCs, which may need the frequent sampling of microcores [59,74]. Measuring whole-tree structural growth is a particular challenge for mature trees. Third, we could not quantify internal mobilization using the NSC concentrations and pools for each organ. It is necessary to use isotopes to track the flux within NSC pools to better understand the extent to which NSCs participate in seasonal growth [5].

5. Conclusions

We conducted a comprehensive assessment of NSC storage in 36 trees from 12 temperate tree species with different leaf forms or habits, shade tolerance classes, or wood types in northeast China. Our results provide evidence of both trade-offs and the coordination of NSC storage and growth. The summer minimum seasonal patterns of the NSC pools indicate a trade-off between storage and growth at the seasonal scale, but the positive correlation between annual NSC storage and biomass increment suggest the source limitation of growth. Although whole-tree NSCs only accounted for 4.6% of the biomass on average when the trees were normalized to the same diameter size, the ΔNSC/ABI ratio ranged from 0.22 to 1.38 (with a mean of 0.59). Notably, the significant positive association between biomass production and NSC storage suggests the coordination of storage and growth and/or a source limitation in tree growth, though the storage cost of biomass production declined from slow-growth to fast-growth species. Our results highlight that time scale is critical to understanding the relationship between storage and growth.

Supplementary Materials

The following supporting information can be downloaded at: https://www.mdpi.com/article/10.3390/f16040619/s1, Method S1. NSC chemical analysis; Table S1. Aboveground biomass allometric equations for 12 tree species; Table S2. Belowground biomass allometric equations for 12 tree species; Table S3. Ratios of bark to stem biomass; Table S4. Ratios of stump biomass to belowground biomass for 12 tree species; Table S5. Ratios of intermediate and fine root biomass to peak foliage biomass; Table S6. The effects of species, sampling date, and their interaction on the whole-tree nonstructural carbohydrate (NSC), sugar, and starch pools for the 12 temperate tree species via nested ANOVA.; Table S7. The effects of species, sampling date and their interaction on the NSC, sugar, and starch pools of each organ for the 12 temperate tree species via nested ANOVA.; Table S8. Comparison of NSC pool and biomass weighted mean NSC concentration between plant functional groups; Table S9. The Pearson correlation coefficient between the absolute amplitude of a whole-tree NSC pool and the mean annual biomass increment calculated for various time scales; Figure S1. Variations in environmental factors from 2008 to 2011; Figure S2. Biomass and allocation of foliage, branch, stem, and root for 12 temperate tree species; Figure S3. The size of whole-tree sugar (a) and starch (b) pools for 12 temperate tree species; Figure S4. The whole-tree biomass-weighted NSC concentrations of 12 temperate tree species; Figure S5. The seasonal dynamics of whole-tree sugar and starch pools for 12 temperate tree species; Figure S6. Absolute variations in whole-tree pools of total nonstructural carbohydrates (NSCs), sugar, and starch for 12 temperate tree species; Figure S7. Absolute variations in total nonstructural carbohydrate (NSC) pools of each organ for 12 temperate tree species; Figure S8. Seasonal dynamics of sugar pools of each organ for 12 temperate tree species; Figure S9. Seasonal dynamics of starch pools of each organ for 12 temperate tree species; Figure S10. The relationship between the annual biomass increment and the storage of starch across the 36 sample trees. References [42,43,44,45,46,75,76,77,78,79] are cited in Supplementary Materials file.

Author Contributions

X.W., H.Z., and C.W. designed the study; H.Z. and X.W. conducted the sample collection and NSC measurements; G.H. analyzed the data under the guidance of X.W.; X.W. and G.H. drafted the manuscript. All authors (including Q.Z., X.Q., D.P.A.) contributed to the revision of the manuscript. All authors have read and agreed to the published version of the manuscript.

Funding

This research was funded by the National Natural Science Foundation of China (32171765).

Data Availability Statement

The raw data supporting the conclusions of this article will be made available by the corresponding authors.

Acknowledgments

We thank many students for their help with processing the samples. The Maoershan Forest Ecosystem Research Station provided field logistics support.

Conflicts of Interest

The authors declare no conflicts of interest.

Abbreviations

The following abbreviations are used in this manuscript:
NSCsNonstructural carbohydrates
ΔNSC/ABIThe ratio of the seasonal variation in the whole-tree NSC pool to the annual biomass increment

References

  1. Hartmann, H.; Bahn, M.; Carbone, M.; Richardson, A.D. Plant carbon allocation in a changing world–Challenges and progress: Introduction to a Virtual Issue on carbon allocation. New Phytol. 2020, 227, 981–988. [Google Scholar] [CrossRef] [PubMed]
  2. Litton, C.M.; Raich, J.W.; Ryan, M.G. Carbon allocation in forest ecosystems. Glob. Change Biol. 2007, 13, 2089–2109. [Google Scholar] [CrossRef]
  3. Niinemets, Ü. Responses of forest trees to single and multiple environmental stresses from seedlings to mature plants: Past stress history, stress interactions, tolerance and acclimation. For. Ecol. Manag. 2010, 260, 1623–1639. [Google Scholar] [CrossRef]
  4. Landhäusser, S.; Adams, H. Getting to the root of carbon reserve dynamics in woody plants: Progress, challenges, and goals. Tree Physiol. 2024, 44, 1–10. [Google Scholar] [CrossRef]
  5. Hartmann, H.; Trumbore, S. Understanding the roles of nonstructural carbohydrates in forest trees–from what we can measure to what we want to know. New Phytol. 2016, 211, 386–403. [Google Scholar] [CrossRef]
  6. Kozlowski, T.T. Carbohydrate sources and sinks in woody plants. Bot. Rev. 1992, 58, 107–222. [Google Scholar] [CrossRef]
  7. Trugman, A.T.; Anderegg, L.D.L. Source vs sink limitations on tree growth: From physiological mechanisms to evolutionary constraints and terrestrial carbon cycle implications. New Phytol. 2025, 245, 966–981. [Google Scholar] [CrossRef]
  8. Dietze, M.C.; Sala, A.; Carbone, M.S.; Czimczik, C.I.; Mantooth, J.A.; Richardson, A.D.; Vargas, R. Nonstructural carbon in woody plants. Annu. Rev. Plant Biol. 2014, 65, 667–687. [Google Scholar] [CrossRef]
  9. Furze, M.E.; Huggett, B.M.; Stolz, C.D.; Carbone, M.S.; Richardson, A.D. Whole-tree nonstructural carbohydrate storage and seasonal dynamics in five temperate species. New Phytol. 2019, 221, 1466–1477. [Google Scholar] [CrossRef]
  10. Richardson, A.D.; Carbone, M.S.; Keenan, T.F.; Czimczik, C.I.; Hollinger, D.Y.; Murakami, P.; Schaberg, P.G.; Xu, X. Seasonal dynamics and age of stemwood nonstructural carbohydrates in temperate forest trees. New Phytol. 2013, 197, 850–861. [Google Scholar]
  11. MacNeill, G.J.; Mehrpouyan, S.; Minow, M.A.A.; Patterson, J.A.; Tetlow, I.J.; Emes, M.J. Starch as a source, starch as a sink: The bifunctional role of starch in carbon allocation. J. Exp. Bot. 2017, 68, 4433–4453. [Google Scholar] [CrossRef] [PubMed]
  12. Gessler, A.; Zweifel, R. Beyond source and sink control–toward an integrated approach to understand the carbon balance in plants. New Phytol. 2024, 242, 858–869. [Google Scholar] [CrossRef] [PubMed]
  13. Cho, N.; Agossou, C.; Kim, E.; Lim, J.H.; Hwang, T.; Kang, S. Recent field findings and modeling on non-structural carbohydrates (NSCs). Ecol. Inform. 2022, 70, 101695. [Google Scholar] [CrossRef]
  14. Richardson, A.D.; Carbone, M.S.; Huggett, B.A.; Furze, M.E.; Czimczik, C.I.; Walker, J.C.; Xu, X.; Schaberg, P.G.; Murakami, P. Distribution and mixing of old and new nonstructural carbon in two temperate trees. New Phytol. 2015, 206, 590–597. [Google Scholar] [CrossRef]
  15. Peltier, D.M.P.; Carbone, M.S.; Enright, M.; Marshall, M.C.; Trowbridge, A.M.; LeMoine, J.; Koch, G.; Richardson, A.D. Old reserves and ancient buds fuel regrowth of coast redwood after catastrophic fire. Nat. Plants 2023, 9, 1978–1985. [Google Scholar] [CrossRef] [PubMed]
  16. Blumstein, M.; Gersony, J.; Martínez-Vilalta, J.; Sala, A. Global variation in nonstructural carbohydrate stores in response to climate. Glob. Change Biol. 2023, 29, 1854–1869. [Google Scholar] [CrossRef]
  17. Chapin, F.S., III; Schulze, E.D.; Mooney, H.A. The Ecology and Economics of Storage in Plants. Annu. Rev. Ecol. Syst. 1990, 21, 423–447. [Google Scholar] [CrossRef]
  18. Cabon, A.; Kannenberg, S.A.; Arain, A.; Babst, F.; Baldocchi, D.; Belmecheri, S.; Delpierre, N.; Guerrieri, R.; Maxwell, J.T.; McKenzie, S.; et al. Cross-biome synthesis of source versus sink limits to tree growth. Science 2022, 376, 758–761. [Google Scholar] [CrossRef]
  19. Green, J.K.; Keenan, T.F. The limits of forest carbon sequestration. Science 2022, 376, 692–693. [Google Scholar] [CrossRef]
  20. Wiley, E.; Helliker, B. A re-evaluation of carbon storage in trees lends greater support for carbon limitation to growth. New Phytol. 2012, 195, 285–289. [Google Scholar] [CrossRef]
  21. Palacio, S.; Hoch, G.; Sala, A.; Körner, C.; Millard, P. Does carbon storage limit tree growth? New Phytol. 2014, 201, 1096–1100. [Google Scholar] [CrossRef]
  22. Körner, C. Carbon limitation in trees. J. Ecol. 2003, 91, 4–17. [Google Scholar] [CrossRef]
  23. Blumstein, M.; Sala, A.; Weston, D.J.; Holbrook, N.M.; Hopkins, R. Plant carbohydrate storage: Intra- and inter-specific trade-offs reveal a major life history trait. New Phytol. 2022, 235, 2211–2222. [Google Scholar] [CrossRef] [PubMed]
  24. Sala, A.; Woodruff, D.R.; Meinzer, F.C. Carbon dynamics in trees: Feast or famine? Tree Physiol. 2012, 32, 764–775. [Google Scholar] [PubMed]
  25. Thompson, R.A. A neutral theory of plant carbon allocation. Tree Physiol. 2024, 44, tpad151. [Google Scholar] [CrossRef]
  26. Martínez-Vilalta, J.; Sala, A.; Asensio, D.; Galiano, L.; Hoch, G.; Palacio, S.; Piper, F.I.; Lloret, F. Dynamics of non-structural carbohydrates in terrestrial plants: A global synthesis. Ecol. Monogr. 2016, 86, 495–516. [Google Scholar] [CrossRef]
  27. Fermaniuk, C.; Fleurial, K.G.; Wiley, E.; Landhäusser, S.M. Large seasonal fluctuations in whole-tree carbohydrate reserves: Is storage more dynamic in boreal ecosystems. Ann. Bot. 2021, 128, 943–957. [Google Scholar] [CrossRef]
  28. Piper, F.I. Decoupling between growth rate and storage remobilization in broadleaf temperate tree species. Funct. Ecol. 2020, 34, 1180–1192. [Google Scholar] [CrossRef]
  29. Piper, F.I.; Paula, S. The role of nonstructural carbohydrates storage in forest resilience under climate change. Curr. For. Rep. 2020, 6, 1–13. [Google Scholar] [CrossRef]
  30. Hoch, G.; Richter, A.; Körner, C. Non-structural carbon compounds in temperate forest trees. Plant Cell Environ. 2003, 26, 1067–1081. [Google Scholar] [CrossRef]
  31. Ryan, M.G. Tree responses to drought. Tree Physiol. 2011, 31, 237–239. [Google Scholar] [CrossRef] [PubMed]
  32. Barbaroux, C.; Bréda, N.; Dufrêne, E. Distribution of above-ground and below-ground carbohydrate reserves in adult trees of two contrasting broad-leaved species (Quercus petraea and Fagus sylvatica). New Phytol. 2003, 157, 605–615. [Google Scholar]
  33. Zhang, H.; Wang, C.; Wang, X. Spatial variations in non-structural carbohydrates in stems of twelve temperate tree species. Trees-Struct. Funct. 2014, 28, 77–89. [Google Scholar] [CrossRef]
  34. Zhang, H.Y.; Wang, C.K.; Wang, X.C. Comparison of concentrations of non-structural carbohydrates new twigs and old branches for 12 temperate species. Acta Ecol. Sin. 2013, 33, 5675–5685. [Google Scholar]
  35. Guo, X.; Liu, S.; Wang, H.; Chen, Z.; Zhang, J.; Chen, L.; Nie, X.; Zheng, L.; Cai, D.; Jia, H.; et al. Divergent allocations of nonstructural carbohydrates shape growth response to rainfall reduction in two subtropical plantations. Forest Ecosyst. 2022, 9, 100021. [Google Scholar] [CrossRef]
  36. Zhang, Q.; Wang, C.; Zhou, Z. Does the net primary production converge across six temperate forest types under the same climate? For. Ecol. Manag. 2019, 448, 535–542. [Google Scholar] [CrossRef]
  37. Dong, L.H.; Liu, Y.S.; Zhang, L.Z.; Xie, L.F.; Li, F.R. Variation in carbon concentration and allometric equations for estimating tree carbon contents of 10 broadleaf species in natural forests in northeast China. Forests 2019, 10, 928. [Google Scholar] [CrossRef]
  38. Zhang, H.Y.; Wang, C.K.; Wang, X.C.; Cheng, F.Y. Spatial variation of non-structural carbohydrates in Betula platyphylla and Tilia amurensis stems. Chin. J. Appl. Ecol. 2013, 24, 3050–3056. [Google Scholar]
  39. Cheng, F.; Wang, C. Estimating nonstructural carbon content of tree crown considering its spatial variability: A case study on Juglans mandshurica and Ulmus japonica. Chin. J. Appl. Ecol. 2015, 26, 2253–2264. [Google Scholar]
  40. Zhang, H.Y.; Wang, C.K.; Wang, X.C. Within-crown variation in concentrations of non-structural carbohydrates of five temperate tree species. Acta Ecol. Sin. 2015, 35, 6496–6506. [Google Scholar]
  41. Landhäusser, S.M.; Chow, P.S.; Dickman, L.T.; Furze, M.E.; Kuhlman, I.; Schmid, S.; Wiesenbauer, J.; Wild, B.; Gleixner, G.; Hartmann, H.; et al. Standardized protocols and procedures can precisely and accurately quantify non-structural carbohydrates. Tree Physiol. 2018, 38, 1764–1778. [Google Scholar] [CrossRef]
  42. Dong, L.H.; Zhang, L.J.; Li, F.R. Developing two additive biomass equations for three coniferous plantation species in northeast China. Forests 2016, 7, 136. [Google Scholar] [CrossRef]
  43. Dong, L.H.; Zhang, L.J.; Li, F.R. A compatible system of biomass equations for three conifer species in Northeast, China. For. Ecol. Manag. 2014, 329, 306–317. [Google Scholar] [CrossRef]
  44. He, H.; Zhang, C.; Zhao, X.; Fousseni, F.; Wang, J.; Dai, H.; Yang, S.; Zuo, Q. Allometric biomass equations for 12 tree species in coniferous and broadleaved mixed forests, Northeastern China. PLoS ONE 2018, 13, e0186226. [Google Scholar] [CrossRef]
  45. Sun, X.; Wang, X.C.; Wang, C.K.; Zhang, Q.Z.; Guo, Q.X. Filling the “vertical gap” between canopy tree species and understory shrub species: Biomass allometric equations for subcanopy tree species. J. For. Res. 2022, 34, 903–913. [Google Scholar] [CrossRef]
  46. Wang, C.K. Biomass allometric equations for 10 co-occurring tree species in Chinese temperate forests. For. Ecol. Manag. 2006, 222, 9–16. [Google Scholar] [CrossRef]
  47. Mei, L.; Xiong, Y.; Gu, J.; Wang, Z.; Guo, D. Whole-tree dynamics of non-structural carbohydrate and nitrogen pools across different seasons and in response to girdling in two temperate trees. Oecologia 2015, 177, 333–344. [Google Scholar] [CrossRef] [PubMed]
  48. Furze, M.E.; Huggett, B.A.; Aubrecht, D.M.; Stolz, C.D.; Carbone, M.S.; Richardson, A.D. Harvard Forest 2014. Harvard Forest Data Archive: HF308. 2018. Available online: https://harvardforest1.fas.harvard.edu/exist/apps/datasets/showData.html?id=hf308 (accessed on 2 July 2018).
  49. Ramirez, J.A.; Craven, D.; Herrera, D.; Posada, J.M.; Reu, B.; Sierra, C.A.; Hoch, G.; Handa, I.T.; Messier, C. Non-structural carbohydrate concentrations in tree organs vary across biomes and leaf habits, but are independent of the fast-slow plant economic spectrum. Front. Plant Sci. 2024, 15, 1375958. [Google Scholar] [CrossRef]
  50. Smith, A.M.; Zeeman, S.C. Starch: A flexible, adaptable carbon store coupled to plant growth. Annu. Rev. Plant Biol. 2020, 71, 217–245. [Google Scholar] [CrossRef]
  51. Oswald, S.W.; Aubrey, D.P. Modeling starch dynamics from seasonal variations of photosynthesis, growth and respiration. Tree Physiol. 2024, 44, 11–27. [Google Scholar] [CrossRef]
  52. Ei Ombri, B. Accumulation versus storage of total non-structural carbohydrates in woody plants. Trees 2022, 36, 869–881. [Google Scholar] [CrossRef]
  53. Barbaroux, C.; Bréda, N. Contrasting distribution and seasonal dynamics of carbohydrate reserves in stem wood of adult ring-porous sessile oak and diffuse-porous beech trees. Tree Physiol. 2002, 22, 1201–1210. [Google Scholar] [CrossRef] [PubMed]
  54. Schoonmaker, A.L.; Hillabrand, R.M.; Lieffers, V.J.; Chow, P.S.; Landhäusser, S.M. Seasonal dynamics of non-structural carbon pools and their relationship to growth in two boreal conifer tree species. Tree Physiol. 2021, 41, 1563–1582. [Google Scholar] [CrossRef] [PubMed]
  55. Lu, L.-L.; Liu, H.; Zhao, K.-P.; Wang, J.; Miao, Y.; Lin, H.-C.; Hao, G.-Y.; Han, S.-J. Seasonal patterns of nonstructural carbohydrate storage and mobilization in two tree species with distinct life-history traits. Tree Physiol. 2024, 44, tpae042. [Google Scholar] [CrossRef]
  56. Long, R.W.; Dudley, T.L.; D’Antonio, C.M.; Grady, K.C.; Bush, S.E.; Hultine, K.R. Spenders versus savers: Climate-induced carbon allocation trade-offs in a recently introduced woody plant. Funct. Ecol. 2021, 35, 1640–1654. [Google Scholar] [CrossRef]
  57. D’Orangeville, L.; Itter, M.; Kneeshaw, D.; Munger, J.W.; Richardson, A.D.; Dyer, J.M.; Orwig, D.A.; Pan, Y.; Pederson, N. Peak radial growth of diffuse-porous species occurs during periods of lower water availability than for ring-porous and coniferous trees. Tree Physiol. 2022, 42, 304–316. [Google Scholar] [CrossRef]
  58. Rossi, S.; Anfodillo, T.; Cufar, K.; Cuny, H.E.; Deslauriers, A.; Fonti, P.; Frank, D.; Gricar, J.; Gruber, A.; Huang, J.-G.; et al. Pattern of xylem phenology in conifers of cold ecosystems at the Northern Hemisphere. Glob. Change Biol. 2016, 22, 3804–3813. [Google Scholar] [CrossRef]
  59. Chen, Y.; Rademacher, T.; Fonti, P.; Eckes-Shephard, A.H.; LeMoine, J.M.; Fonti, M.V.; Richardson, A.D.; Friend, A.D. Inter-annual and inter-species tree growth explained by phenology of xylogenesis. New Phytol. 2022, 235, 939–952. [Google Scholar] [CrossRef]
  60. Wang, X.; Zhang, Q. Interspecific differences of stem diameter variations in response to water conditions for six tree species in Northeast China. Forests 2023, 14, 805. [Google Scholar] [CrossRef]
  61. Xu, F.; Wang, C.K.; Wang, X.C. Intra- and inter-specific variations in stem respiration for 14 temperate tree species in northeastern China. Acta Ecol. Sin. 2011, 31, 3581–3589. [Google Scholar]
  62. Avila, E.; Herrera, A.; Tezara, W. Contribution of stem CO2 fixation to whole-plant carbon balance in nonsucculent species. Photosynthetica 2014, 52, 3–15. [Google Scholar] [CrossRef]
  63. Vandegehuchte, M.W.; Bloemen, J.; Vergeynst, L.L.; Steppe, K. Woody tissue photosynthesis in trees: Salve on the wounds of drought? New Phytol. 2015, 208, 998–1002. [Google Scholar] [CrossRef] [PubMed]
  64. Hoch, G. Cell wall hemicelluloses as mobile carbon stores in non-reproductive plant tissues. Funct. Ecol. 2007, 21, 823–834. [Google Scholar] [CrossRef]
  65. Schädel, C.; Blöchl, A.; Richter, A.; Hoch, G. Short-term dynamics of nonstructural carbohydrates and hemicelluloses in young branches of temperate forest trees during bud break. Tree Physiol. 2009, 29, 901–911. [Google Scholar] [CrossRef] [PubMed]
  66. D’Andrea, E.; Scartazza, A.; Battistelli, A.; Collalti, A.; Proietti, S.; Rezaie, N.; Matteucci, G.; Moscatello, S. Unravelling resilience mechanisms in forests: Role of non-structural carbohydrates in responding to extreme weather events. Tree Physiol. 2021, 41, 1808–1818. [Google Scholar] [CrossRef]
  67. Zhang, P.P.; Zhou, X.H.; Fu, Y.L.; Shao, J.J.; Zhou, L.Y.; Li, S.S.; Zhou, G.Y.; Hu, Z.H.; Hu, J.Q.; Bai, S.H.; et al. Differential effects of drought on nonstructural carbohydrate storage in seedlings and mature trees of four species in a subtropical forest. For. Ecol. Manag. 2020, 469, 118159. [Google Scholar] [CrossRef]
  68. Gough, C.M.; Flower, C.E.; Vogel, C.S.; Dragoni, D.; Curtis, P.S. Whole-ecosystem labile carbon production in a north temperate deciduous forest. Agric. For. Meteorol. 2009, 149, 1531–1540. [Google Scholar] [CrossRef]
  69. Gholz, H.L.; Cropper, W.P. Carbohydrate dynamics in mature Pinus elliottii var. elliottii trees. Can. J. For. Res. 1991, 21, 1742–1747. [Google Scholar]
  70. Igarashi, S.; Shibata, M.; Masaki, T.; Tayasu, I.; Ichie, T. Mass flowering of Fagus crenata does not depend on the amount of stored carbohydrates in trees. Trees 2019, 33, 1399–1408. [Google Scholar] [CrossRef]
  71. Blumstein, M.J.; Furze, M.E. Interannual dynamics of stemwood nonstructural carbohydrates in temperate forest trees surrounding drought. J. For. Res. 2023, 34, 77–86. [Google Scholar] [CrossRef]
  72. Wang, Z.; Wang, C. Dynamics of nonstructural carbohydrates during drought and subsequent recovery: A global meta-analysis. Agric. For. Meteorol. 2025, 363, 110429. [Google Scholar] [CrossRef]
  73. Peltier, D.M.P.; Carbone, M.S.; Ogle, K.; Koch, G.W.; Richardson, A.D. Decades-old carbon reserves are widespread among tree species, constrained only by sapwood longevity. New Phytol. 2025, 245, 1468–1480. [Google Scholar] [CrossRef]
  74. Cuny, H.E.; Rathgeber, C.B.K.; Frank, D.; Fonti, P.; Mäkinen, H.; Prislan, P.; Rossi, S.; del Castillo, E.M.; Campelo, F.; Vavrčík, H.; et al. Woody biomass production lags stem-girth increase by over one month in coniferous forests. Nat. Plants 2015, 1, 15160. [Google Scholar] [CrossRef]
  75. Yin, S.D. Compare Study on Nutrient Ecology of Pinus koraiensis and Larix oigensis Plantation Ecosystems; Northeast Forestry University: Harbin, China, 2004. [Google Scholar]
  76. Zhan, H.Z.; Liu, C.Z.; Liu, J.C. Study on biomass and nutrient content of broad-leaved red pine forest. Sci. Sil. Sin. 1990, 26, 1994–2023. [Google Scholar]
  77. Hu, H.Q.; Guo, F.T. Estimation of total carbon emissions from major tree species during forest fires in the Greater Khingan Mountains. Chin. J. Appl. Ecol. 2008, 19, 1884–1890. [Google Scholar] [CrossRef]
  78. Zhang, Q.Z.; Wang, C.K. Carbon density and distribution of six Chinese temperate forests. Sci. China Life Sci. 2010, 53, 831–840. [Google Scholar] [CrossRef]
  79. Cai, H.Y.; Di, X.Y.; Chang, S.X.; Wang, C.K.; Shi, B.K.; Geng, P.F.; Jin, G.G. Carbon storage, net primary production, and net ecosystem production in four major temperate forest types in northeastern China. Can. J. Forest. Res. 2016, 46, 143–151. [Google Scholar] [CrossRef]
Figure 1. The annual mean whole-tree total nonstructural carbohydrate (NSC) pools and their allocation among organs for 12 temperate tree species. (a) Total NSC pool in the tree, (b) Proportional allocation of NSC pool among tree organs. Tree species were ranked according to leaf form first and then the size of NSC pools. The green, orange, and baby blue in (a) are non-porous, diffuse-porous, and ring-porous wood, respectively. Different lowercase letters indicate significant differences between tree species. Tree size was standardized to a DBH of 30 cm for a better interspecific comparison. The error bars are standard errors (n = 3).
Forests 16 00619 g001
Figure 2. The seasonal dynamics of whole-tree pools of total nonstructural carbohydrates (NSCs) for 12 temperate tree species. Non-porous wood (a), diffuse-porous wood (b), and ring-porous wood (c). Tree size is standardized to a DBH of 30 cm. The error bars are standard errors (n = 3).
Forests 16 00619 g002
Figure 3. The seasonal dynamics of the total nonstructural carbohydrate (NSC) pools of each organ for 12 temperate tree species. Tree size is standardized to a DBH of 30 cm. The error bars are standard errors (n = 3).
Forests 16 00619 g003
Figure 4. Absolute variation in whole-tree total nonstructural carbohydrate (NSC) pools (a) and the proportion of absolute variation in whole-tree NSC pool to annual biomass increment (b) for 12 temperate tree species. The green, orange, and baby blue are non-porous, diffuse-porous, and ring-porous wood, respectively. Tree species were ranked according to leaf form first and then the size of their NSC pools. Tree size is standardized to a DBH of 30 cm. The error bars are standard errors (n = 3).
Forests 16 00619 g004
Figure 5. The relationship between NSC storage and annual biomass increment (a) and between the storage cost of biomass production and the annual biomass increment (b) across the 36 sample trees. The absolute variation and the maximum of nonstructural carbohydrate pools are used as two measures of NSC storage. The storage cost of biomass production is a ratio of NSC storage to annual biomass increment. Tree size is standardized to a DBH of 30 cm.
Forests 16 00619 g005
Table 1. The basic characteristics of the sampled trees. H and DBH stand for tree height and diameter at breast height, respectively. The numbers outside parentheses are means with sample size n = 3, and those in parentheses are standard deviations. Amur linden and white birch are regarded as sapwood-only species.
Scientific NameCommon NameLeaf Form and HabitWood TypeH (m)DBH (cm)
Pinus sylvestris var. mongolica Litv.Mongolian pineEvergreen coniferNon-porous23.2 (0.5)27.3 (1.0)
Larix gmelinii (Ruprecht) KuzenevaDahurian larchDeciduous coniferNon-porous26.5 (0.4)31.6 (1.1)
Picea koraiensis NakaiKorean spruceEvergreen coniferNon-porous18.9 (0.2)29.9 (1.3)
Pinus koraiensis Siebold et ZuccariniKorean pineEvergreen coniferNon-porous20.4 (0.9)23.3 (0.4)
Juglans mandshurica Maxim.Manchurian walnutDeciduous broadleafSemi-ring-porous21.3 (1.0)33.5 (1.5)
Ulmus davidiana var. japonica (Rehd.) NakaiJapanese elmDeciduous broadleafRing-porous24.1 (1.2)40.3 (1.9)
Tilia amurensis Rupr.Amur lindenDeciduous broadleafDiffuse-porous20.8 (2.0)46.1 (3.6)
Populus davidiana DodeKorean aspenDeciduous broadleafDiffuse-porous25.4 (0.6)42.3 (0.9)
Fraxinus mandshurica Rupr.Manchurian ashDeciduous broadleafRing-porous24.7 (2.0)33.6 (1.2)
Quercus mongolica Fisch. Ex Ledeb.Mongolian oakDeciduous broadleafRing-porous19.1 (0.3)32.5 (0.6)
Populus ussuriensis Kom.Ussuri poplarDeciduous broadleafDiffuse-porous23.4 (0.9)41.5 (1.5)
Betula platyphylla Suk.White birchDeciduous broadleafDiffuse-porous23.0 (1.0)33.4 (1.7)
Disclaimer/Publisher’s Note: The statements, opinions and data contained in all publications are solely those of the individual author(s) and contributor(s) and not of MDPI and/or the editor(s). MDPI and/or the editor(s) disclaim responsibility for any injury to people or property resulting from any ideas, methods, instructions or products referred to in the content.

