Abstract
As an important component of the global carbon cycle, the variation patterns and driving mechanisms of the productivity and carbon sink capacity of subtropical forest ecosystems urgently need in-depth research. In this study, taking the forest ecosystem in the Ganjiang River Basin as the research object, the Biome-BGC model was used to simulate the forest productivity at different time scales (annual, seasonal, and monthly) from 1970 to 2021, and its spatio-temporal distribution characteristics and responses to climate change were analyzed. The results showed that the interannual net primary productivity (NPP) of evergreen broad-leaved forests was 771.4 g C m−2 year−1, that of evergreen coniferous forests was 631.6 g C m−2 year−1, that of deciduous coniferous forests was 610.5 g C m−2 year−1, and that of shrub forests was 262.8 g C m−2 year−1. Evergreen broad-leaved forests have greater carbon sink potential under the background of climate change. The forest productivity in the Ganjiang River Basin generally showed an upward trend, but there were obvious differences in spatial distribution, characterized by being higher in the surrounding mountainous areas and lower in the central and northern plains. The methodological framework proposed in this study is beneficial for productivity evaluation and spatio-temporal analysis of carbon balance in subtropical forest ecosystems and provides a scientific reference for model simulation and the application of forest productivity at the regional scale.
1. Introduction
Terrestrial ecosystems have numerous functions such as fixing CO2, purifying the air, conserving water sources, maintaining soil and water, preventing wind erosion and fixing sand, and maintaining biodiversity [1,2]. From 2010 to 2019, the global terrestrial ecosystems absorbed approximately 31% of the CO2 emitted by human activities on average each year [3,4]. Forest ecosystems are the primary producers in the entire terrestrial ecosystems and the largest carbon pool in terrestrial ecosystems, fixing nearly 70% of the carbon in terrestrial ecosystems and playing a significant role in the global carbon cycle [5].
Gross primary productivity (GPP) refers to the amount of CO2 fixed as organic matter by vegetation through photosynthesis [6]. It is the basis of the carbon cycle in ecosystems and also the largest component of the global terrestrial carbon flux [7]. The remaining part after subtracting autotrophic respiration from GPP is called net primary productivity (NPP), which represents the total amount of organic matter accumulated by vegetation per unit area and time and reflects the efficiency of plants in fixing and transforming photosynthetic products [8]. As an important part of the global carbon cycle, the variation patterns and driving mechanisms of the productivity and carbon sink capacity of subtropical forest ecosystems urgently need in-depth research [9].
Currently, scholars at home and abroad have conducted numerous studies on the spatio-temporal changes in forest productivity [10], mainly focusing on the following aspects: (1) Dynamic changes in forest productivity: Studies have shown that forest productivity is affected by factors such as climatic factors, soil conditions, and vegetation types, and exhibits obvious spatio-temporal variation patterns [11]. For example, the productivity of evergreen broad-leaved forests and coniferous forests is relatively high, while that of shrub forests is relatively low; forest productivity is higher in summer and lower in winter [12]. (2) The impact of climate change on forest productivity: Studies have demonstrated that the impact of climate change on forest productivity varies by region [13]. For instance, an increase in temperature and precipitation is conducive to the improvement in forest productivity, but extreme climate events (such as droughts, floods, etc.) will have a negative impact on forest productivity. (3) Simulating and predicting forest productivity: Many scholars have established forest productivity simulation models by using remote sensing data, meteorological data, and vegetation physiological parameters and have applied them to the assessment and prediction of forest productivity at the regional scale. For example, the Biome-BGC model, the CASA model, the inversion of MODIS remote sensing data, etc. [14]. Further studies have used climate ecological niche modeling to predict the site productivity of forest tree species [15].
The Biome-BGC model is a typical carbon cycle model for terrestrial ecosystems, which can simulate vegetation physiological processes such as photosynthesis, respiration, organic matter allocation, plant tissue withering, decomposition, and nutrient cycling and transport of carbon, nitrogen, and water in different types of forest ecosystems, etc. [16]. The Biome-BGC model can fully take into account the differences in ecosystem characteristics and vegetation physiological parameters and can be used to quantitatively describe all the relevant processes of carbon, nitrogen, and water cycles and energy flows in different vegetation types, with high reliability of the results [17]. Moreover, the BGC model can also take into account the differences in different ecosystem characteristics and vegetation physiological parameters and can be used to quantitatively describe all the relevant processes of carbon, nitrogen, water cycle, and energy flow in different vegetation types, and the simulation results are highly reliable in subtropical forests [18].
Although previous studies have achieved certain progress, there are still some deficiencies. The current study mainly focuses on temperate and boreal forests, while the study on NPP simulation in subtropical forest ecosystems is biased toward short-term spatio-temporal simulation of a single forest species (e.g., bamboo forests, evergreen broad-leaved forests), and there is a lack of comprehensive and in-depth long time-series spatio-temporal dynamics simulation of the productivity of different forest types in subtropical regions [19,20]. The research methods mainly rely on remote sensing data and statistical models, and relatively few simulations and mechanism studies on the internal carbon cycle processes of forest ecosystems have been carried out [21]. The research scales are mainly at the regional level, lacking a systematic analysis and explanation of the spatio-temporal variation patterns of forest productivity [22].
Ganjiang River Basin is located in the subtropical typical monsoon climate zone, with a basin area of up to 170,000 km2, and significant differences in the natural environment within the region: the topography from south to north shows a trend of decreasing gradient, which generates a zonal change in the characteristics of the land surface features of the temperature, precipitation, soil, etc. Within this environment, the ecosystems of the Ganjiang River Basin are complex and diverse, with abundant resources of different types of vegetation. In addition, since the 1980s, the Ganjiang River Basin has implemented ecological projects such as the “Mountain-River-Lake” Project, Comprehensive Soil and Water Erosion Control, Returning Cultivated Land to Forestry, Basin Ecological Compensation Mechanism, and National Ecological Civilization Pilot Area. Therefore, the spatio-temporal heterogeneity of forest productivity in the Ganjiang River Basin in the background of long time series is more obvious, but the spatial distribution and temporal evolution characteristics of GPP and NPP in different typical forest types have not yet been precisely revealed. Therefore, conducting research on the spatio-temporal changes in vegetation productivity in the forests of the Ganjiang River Basin is quite representative and typical.
Based on the Biome-BGC model with localized parameters, this study simulated the dynamic changes in GPP and NPP of the forests in the Ganjiang River Basin at the regional scale from 1970 to 2021 and explored the productivity of different forest vegetations and their spatio-temporal distribution characteristics at different time scales (annual, seasonal, and monthly). The research results can clarify the forest vegetation productivity in the Ganjiang River Basin, provide references for the study of the spatio-temporal distribution pattern of carbon sources in subtropical forests, and offer a scientific basis for the protection and management of subtropical forest ecosystems, which will contribute to the formulation of policies for enhancing the carbon sink of subtropical forests. In addition, it can provide a scientific basis and research foundation for the simulation and application of models at the regional scale, which will help to promote the regional application of this model.
2. Material and Methods
2.1. Overview of the Study Area
The Ganjiang River Basin is located in Jiangxi Province of China (113°58′–116°63′ E, 24°52′–28°75′ N; Figure 1). It is an important part of the Yangtze River Basin, boasting rich ecological resources and a unique geographical environment. The Ganjiang River is approximately 600 km long, with a drainage area of 170,000 km2, covering multiple cities and counties. The terrain of this basin is diverse, including high mountains, hills, plains, and lakes, thus forming a rich variety of ecosystems [23]. The climate in the Ganjiang River Basin belongs to the subtropical monsoon climate [24], with four distinct seasons and abundant annual precipitation, which is suitable for plant growth. The vegetation coverage rate within the basin is high, mainly consisting of multiple ecological types such as evergreen broad-leaved forests (EBFs), evergreen coniferous forests (ECFs), evergreen conifer-broadleaf mixed forests (MIXs), and bamboo forests (BFs) [25], and it is rich in biodiversity, serving as the habitat for many rare animals and plants. In conclusion, as an ecological research area, the Ganjiang River Basin has important research value and practical significance, providing a broad space for achieving a win–win situation between ecological protection and economic development [26].

Figure 1.
Geographical location of the Ganjiang River Basin and sampling points. (a) represent the relative location and land use type of the Ganjiang River Basin in Jiangxi Province; (b) represent the spatial distribution of forest sampling sites. Note: MIX, evergreen conifer-broadleaf mixed forest; ECF, evergreen coniferous forest; EBF, evergreen broad-leaved forests; BF, bamboo forest.
2.2. Data Sources and Preprocessing
2.2.1. Measured Data
We sampled typical forest sample plots in the Gan River Basin during the 2022 vegetation growing season (July–September). Before carrying out the field survey work, we initially selected different types of forest communities (i.e., EBF, ECF, MIX, and BF) based on the 1:1,000,000 vegetation type map of China. On this basis, 22 representative and typical forest sample plots were finally identified through field surveys and screening (Figure 1b).
These sample plots are distributed in the major mountain ranges of the Ganjiang River Basin; the size of each forest sample plot is 10 m × 10 m, and the spatial distribution is relatively uniform. In addition, the forests in the area where the sample plots are located are concentrated and continuous, and the intensity of anthropogenic disturbance is weak.
The Biome-BGC model has 35 physiological parameters that need to be set specifically (Table S1). Combined with existing related studies, we conducted field measurements of physiological parameters that significantly affect NPP (i.e., C: N of leaves; C: N of fine roots, live wood, and dead wood; canopy-specific leaf area; [18]). There are measured data from 22 forest sample plots for parameter localization in the Biome-BGC model.
Therefore, the data measured in the sample plots mainly included the following: vegetation data (i.e., tree height, diameter at breast height, and carbon to nitrogen ratio of tree cores), geographic data (i.e., longitude, latitude, elevation, slope, and slope direction), and soil data (i.e., effective soil depth and soil texture).
Carbon and nitrogen content in plant leaves, fine roots, and tree cores collected in the field were determined using a SmartChem 2000 automated chemical analyzer. Specific leaf area was calculated from the ratio of scanned leaf area to dry weight of dried leaves [27]. Soil texture was determined by a laser particle size analyzer [28].
2.2.2. Vegetation Physiological Parameter Data
There are 43 physiological parameters input into the Biome-BGC model, including carbon–nitrogen ratios of fine roots, leaves, and litter, canopy interception coefficient, specific leaf area, stomatal conductance, etc. [17]. Due to the large number of parameters required by the model, in this study, the parameters that have a significant impact on vegetation productivity were measured locally, such as carbon–nitrogen ratios of leaves, roots, and tree cores, specific leaf area, etc., and the average values of the measured parameters of multiple sample plots evenly distributed within the basin were taken [29]. The settings of the remaining parameters were determined by referring to the relevant literature and adopting the default ecophysiological parameters provided by the model (Table S1). Given that the Biome-BGC model does not provide the physiological parameters of mixed broadleaf-coniferous forests, thus referring to the method of Ji et al. (2020) first [30], the physiological parameters of evergreen broadleaf forests and evergreen coniferous forests were simulated separately to obtain their respective NPPs, and then the NPP of evergreen mixed broadleaf-coniferous forests was calculated by conversion according to the proportion of the two.
2.2.3. Meteorological Data
The daily meteorological data for driving the model included daily average air temperature, daily precipitation, day length, etc. The air temperature and precipitation data were sourced from the fifth-generation land reanalysis dataset (ERA5-Land) of the European Centre for Medium-Range Weather Forecasts (https://cds.climate.copernicus.eu/; accessed on 2 May 2023). This data product has been widely used in Biome-BGC modeling [20,31]. According to the longitude and latitude of each sample point, the corresponding daily maximum air temperature, daily minimum air temperature, and daily precipitation were extracted, and four meteorological factors, namely daily average air temperature, daily saturation vapor pressure difference, daily solar radiation, and day length, were calculated using the Mountain Microclimate Simulation Model (MTCLIM 4.3) [32]. The historical CO2 concentration data were sourced from the observational dataset of the Mauna Loa Observatory (MLO) in Hawaii, the United States (https://gml.noaa.gov/obop/mlo/; accessed on 2 May 2023).
2.2.4. Land Cover, Soil Texture, and DEM Data
Land cover data were obtained from the National Tibetan Plateau Data Center (https://data.tpdc.ac.cn/; accessed on 2 May 2023), which was used to extract the forest types in the study area; sand, silt, and clay percentages of soils, as well as DEM data, were obtained from Resource and Environmental Science Data Platform (https://www.resdc.cn/; accessed on 2 May 2023). Where the DEM data were further calculated to obtain the slope, slope direction, and elevation of the study area, the spatial resolution of all the above rasters was 1 km, which was used as input data for the site conditions of the Biome-BGC model.
2.3. Methods
Biome-BGC is a biogeochemical model that can be used to estimate the storage and fluxes of carbon, nitrogen, and water in terrestrial ecosystems. The operation of this model requires three input files: initialization data, meteorological data, and ecophysiological parameter files [17]. The Biome-BGC model itself is an ecological process model at the point scale. By dividing the Ganjiang River Basin according to latitude and using gridded multi-source spatio-temporal data as the model input data, it is possible to automatically generate the three input files for each Biome-BGC model simulation point at the regional scale, namely the initialization file, the meteorological file, and the ecophysiological file, through Python 3.12 programming. By using the Biome-BGC model, the simulation results of each flux for each grid are obtained, and then through Python integration, the results of the forest productivity in the Ganjiang River Basin at different time scales in the region can be obtained [10].
The process of running the Biome-BGC model consists of two stages. The first step was to obtain the initial state of the study object through the Spin-up mode, i.e., the carbon and nitrogen stocks were very low values (the system was set to have a leaf carbon stock of 0.001 kgC/m2, and all other libraries had a carbon and nitrogen stock of 0). The simulation was repeated over a long period of time until the difference in soil carbon content was less than 0.0005 kgC/m2 for 2 consecutive years, and the default system reached a steady state. The second step is to obtain the normal simulation state through the Normal mode, i.e., the system performs normal simulation based on the steady state and outputs the model results [33]. By adjusting and presetting the Spin-up and Normal modes, the Biome-BGC model can simulate the dynamic changes in ecosystem carbon, nitrogen, and water from the time the ecosystem reaches equilibrium to the target year according to the site data, meteorological data, and physiological data of the vegetation and then find out the dynamic changes in the productivity of the vegetation, which is shown in the specific modeling principle in White [34]. By adjusting the runtime file, we can set the change amplitude of temperature and precipitation, so as to obtain the response amplitude of vegetation productivity to temperature and precipitation.
We used the empirical regression model of biomass for biomass calculation of arborvitae and bamboo forests separately based on the field measurement survey data with the following equations:
where Ba and Bb are the aboveground biomass of a tree and bamboo, respectively; DBH is the diameter of the main trunk of the tree at 1.3 m; H is the height of the tree; a and b are the parameters of different tree species in the model; and DBHB is the diameter at breast height (DBHB) of the bamboo.
Ba = a(DBH2H)b
Bb = 0.6429DBHB1.5373
Forest carbon stock is the biomass of each type of tree species multiplied by its carbon content coefficient, and the average annual NPP of the forest is the carbon stock divided by its average tree age [35]. The carbon content coefficients of different forest types are shown in Table 1. The relationship between the simulated NPP and the measured NPP was analyzed using linear regression analysis. All statistical analyses were implemented through SPSS 23 [36].

Table 1.
Carbon content coefficient of different forest types.
3. Results and Analysis
3.1. Model Validation
The comparison results between the simulated NPP and the measured NPP showed that the simulated NPP by the model and the measured NPP in the sample plots had a relatively high linear goodness of fit (r = 0.817, p < 0.01; Figure 2), indicating that this model can well simulate the NPP of subtropical forest vegetation.
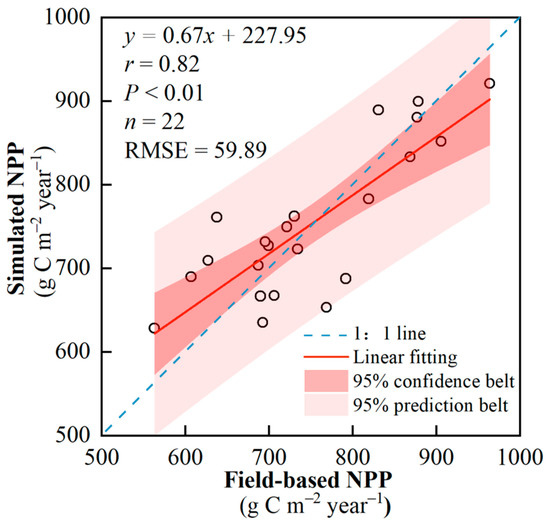
Figure 2.
Verification of the accuracy of NPP.
We compared the estimation NPP of different types of forests in this study with the results of previous studies (Table 2), which showed that the range of the highest and lowest values of simulation NPP for ECF was slightly larger than the study of Ma et al. (2008) [37], which was also located in the Ganjiang River Basin; and that the average multi-year NPP (681.3 g·m−2a−1) was close to that of Li et al. (2014) [38], which was 657 g·m−2a−1. The range of NPP for EBF was similar to the range of Feng et al. (2007) [39], which was also located in the Poyang Lake Basin; the multi-year average NPP (862.4 g·m−2a−1) was between the simulation results of Dai et al. (2015) and Chen et al. (2017) [40,41]. The NPP for MIX ranged from 579.3 to 849.1 g·m−2a−1; the multi-year average NPP (721.1 g·m−2a−1) was similar to the simulation by Zhang et al. (2008) [42] in neighboring provinces, which was 784.5 g·m−2a−1. The range of NPP for BF was slightly lower than that of Chen et al. (2018) [41]; the multi-year average NPP (739.2 g·m−2a−1) was consistent with the simulation of Li et al. (2008) and Chen et al. (2017) in neighboring provinces [43,44]. Conclusively, the simulation results of this study are credible.
Table 2.
Comparison of the annual NPP of four forest types.
3.2. Temporal Productivity Changes in Forests
3.2.1. Interannual Variation
The interannual GPP changes in the four types of forests from 1970 to 2021 are shown in Figure 3. The annual GPP of the evergreen needle-leaved forest and the evergreen broad-leaved forest fluctuated greatly, ranging from 2134.0 to 2558.3 g C m−2 year−1 and from 2022.9 to 2419.0 g C m−2 year−1, respectively. The annual GPP of the deciduous needle-leaved forest fluctuated slightly, with a range of 1102.5 to 1375.0 g C m−2 year−1; the shrub forest had the smallest fluctuation, with a range of 2262.0 to 2532.6 g C m−2 year−1. Overall, the highest annual GPP values of the evergreen needle-leaved forest, the evergreen broad-leaved forest, and the shrub forest all occurred in 2016, while the highest value of the deciduous needle-leaved forest occurred in 2002. The lowest values occurred in 1970 and 2019, respectively. The order of the average annual GPP of the four typical forests is shrub forest (2408.2 g C m−2 year−1) > evergreen needle-leaved forest (2352.4 g C m−2 year−1) > evergreen broad-leaved forest (2229.3 g C m−2 year−1) > deciduous needle-leaved forest (1230.3 g C m−2 year−1).

Figure 3.
Interannual changes in GPP and NPP of each vegetation type. Note: evergreen needle-leaved forest = ENF; evergreen broad-leaved forest = EBF; shrub forest = Shrub; deciduous needle-leaved forest = DNF. The same is below.
The interannual NPP changes in the four types of forests from 1970 to 2021 are shown in Figure 3. The annual NPP change trends of the evergreen needle-leaved forest and the evergreen broad-leaved forest are similar and rather obvious, with the fluctuation ranges being 390.8–765.5 g C m−2 year−1 and 549.5–881.5 g C m−2 year−1, respectively. The annual NPP of the shrub forest fluctuates greatly, with a range of 53.7–382.0 g C m−2 year−1; the annual NPP of the deciduous needle-leaved forest fluctuates relatively slightly, with a range of 467.4–737.5 g C m−2 year−1. The NPPs of the evergreen needle-leaved forest and the evergreen broad-leaved forest both reached their peaks in 1973, which were 765.5 g C m−2 year−1 and 881.5 g C m−2 year−1, respectively; the shrub forest reached its peak value of 382.0 g C m−2 year−1 in 2020, and the deciduous needle-leaved forest reached 737.5 g C m−2 year−1 in 1999. The lowest annual NPP values of the four types of forests all occurred in 2019. The order of the average annual NPP is evergreen broad-leaved forest (771.4 g C m−2 year−1) > evergreen needle-leaved forest (631.6 g C m−2 year−1) > deciduous needle-leaved forest (610.5 g C m−2 year−1) > shrub forest (262.8 g C m−2 year−1).
3.2.2. Seasonal and Monthly Variations
The average seasonal and monthly variations in the GPP of the four types of forests in 52 years are shown in Figure 4. The GPP characteristics of different forests vary. In spring (March–May), due to the increase in temperature and precipitation, the GPP of the four types of forests increased significantly, and the increasing trend of the deciduous needle-leaved forest was the most significant with the largest fluctuation range. In summer (June–August), with the increase in temperature and the decrease in precipitation, the GPP of the four types of forests showed an upward trend, reaching the highest value in July and then decreasing. The GPPs of the evergreen needle-leaved forest, the evergreen broad-leaved forest, the shrub forest, and the deciduous needle-leaved forest were all above 210.0 C m−2 month−1. In autumn (September–November) and winter (December–February of the following year), with the decrease in temperature and precipitation, the productivities of the four types of forest vegetation all decreased, reaching the lowest value within the year in winter. Among them, the GPPs of the evergreen needle-leaved forest, the evergreen broad-leaved forest, and the shrub forest remained at 100 C m−2 month−1.
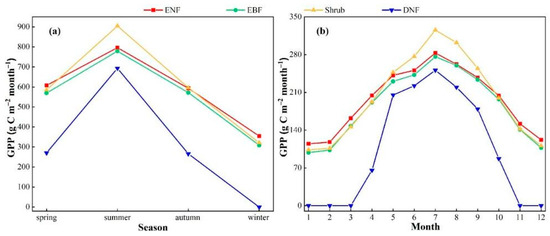
Figure 4.
Multi-year average seasonal changes and multi-year average monthly variations in GPP for different vegetation types. (a) represents the variation of GPP with season; (b) represents the variation of GPP with month.
The multi-year average monthly variations in the GPP of the four forest ecosystems are as follows. The GPP of the evergreen needle-leaved forest fluctuates between 114.8 and 283.1 g C m−2 month−1, the GPP of the evergreen broad-leaved forest ranges from 98.4 to 276.2 g C m−2 month−1, the GPP of the shrub forest is within the range of 103.7 to 325.7 g C m−2 month−1, and the GPP of the deciduous needle-leaved forest varies from 0 to 251.2 g C m−2 month−1. The ranges of the GPP of these ecosystems are 168.3, 177.8, 222.0, and 251.2 g C m−2 month−1, respectively. The monthly GPP of these four forests gradually increases starting from March, reaches its peak in July, and then gradually decreases, showing an inverted “V” shaped variation trend. It is worth noting that the GPP variation curves of the evergreen needle-leaved forest and the evergreen broad-leaved forest show significant similarity. According to the ranking of the average monthly GPP, the shrub forest ranks first with 200.7 g C m−2 month−1, followed by the evergreen needle-leaved forest (196.0 g C m−2 month−1) and then the evergreen broad-leaved forest (185.8 g C m−2 month−1). The deciduous needle-leaved forest has the lowest average monthly GPP, which is 102.5 g C m−2 month−1.
The average seasonal and monthly variations in NPP of the four forest types over the past 52 years are shown in Figure 5. The NPPs of these forests exhibit their own unique seasonal characteristics. In spring (from March to May), with the increase in temperature and precipitation, the NPPs of all four forests start to increase significantly. In particular, the NPPs of the evergreen needle-leaved forest, the evergreen broad-leaved forest, and the shrub forest reach their seasonal peaks in May. Entering summer (from June to August), although the temperature continues to rise, the decrease in precipitation leads to a significant decline in the NPPs of the evergreen needle-leaved forest and the shrub forest, reaching the annual lowest points in August. Meanwhile, the NPP of the evergreen broad-leaved forest shows a fluctuating trend, while the NPP of the deciduous needle-leaved forest shows an upward trend until it reaches its peak in July and then gradually decreases. During autumn (from September to November), the NPPs of the evergreen needle-leaved forest and the shrub forest start to rebound, while the NPPs of the evergreen broad-leaved forest and the deciduous needle-leaved forest show a downward trend. With the arrival of winter (from December to February of the following year), the decrease in temperature and precipitation has an impact on the forest NPP. The NPP of the evergreen needle-leaved forest shows a downward trend, while the NPP of the shrub forest rises against the trend. Meanwhile, the monthly NPPs of the evergreen broad-leaved forest and the deciduous needle-leaved forest both show a downward trend, reaching the annual lowest values. It is worth noting that only the monthly NPP of the deciduous needle-leaved forest turns negative in winter, indicating that it acts as a carbon source in this season.

Figure 5.
Multi-year average seasonal changes and multi-year average monthly variations in NPP for different vegetation types. (a) represents the variation of NPP with season; (b) represents the variation of NPP with month.
The monthly NPP ranges of the evergreen needle-leaved forest, the evergreen broad-leaved forest, the shrub forest, and the deciduous needle-leaved forest are 40.8–69.8 g C m−2 month−1, 39.2–84.7 g C m−2 month−1, 7.1–32.7 g C m−2 month−1, and −4.0–124.3 g C m−2 month−1, respectively, and their ranges are 29.0 g C m−2 month−1, 45.5 g C m−2 month−1, 25.6 g C m−2 month−1, and 128.3 g C m−2 month−1, respectively. The high values of the NPP of the evergreen needle-leaved forest and the shrub forest are concentrated in March–May, with the monthly NPP ranges being 50–70 g C m−2 month−1 and 20–40 g C m−2 month−1, respectively, and the variation curves of their monthly NPPs are relatively consistent. The high values of the NPP of the evergreen broad-leaved forest and the deciduous needle-leaved forest are concentrated in April–October, with the monthly NPP range being 60–90 g C m−2 month−1. The high values of the NPP of the deciduous needle-leaved forest are concentrated in May–October, with the monthly NPP range being 30–130 g C m−2 month−1. In addition, the monthly NPP of the deciduous needle-leaved forest is negative from November to March. The ranking of the average monthly NPP of the four forests is evergreen broad-leaved forest (64.3 g C m−2 month−1) > evergreen needle-leaved forest (52.6 g C m−2 month−1) > deciduous needle-leaved forest (50.9 g C m−2 month−1) > shrub forest (21.9 g C m−2 month−1).
3.2.3. Inter-Monthly Forest-Type Spatial Distribution
From 1970 to 2021, for the evergreen needle-leaved forest, the evergreen broad-leaved forest, the deciduous needle-leaved forest, and the shrub forest, the maximum monthly values of the basin GPP were 311.4, 290.7, 255.6, and 343.0 g C m−2 month−1, respectively, and the ranking was shrub forest > evergreen needle-leaved forest > evergreen broad-leaved forest > deciduous needle-leaved forest. The minimum monthly values were 100.2, 77.8, 0, and 91.4 g C m−2 month−1, respectively, and the ranking was evergreen needle-leaved forest > shrub forest > evergreen broad-leaved forest > deciduous needle-leaved forest. The average maximum values were 283.1, 276.2, 251.2, and 325.7 g C m−2 month−1, respectively, and the ranking was shrub forest > evergreen needle-leaved forest > evergreen broad-leaved forest > deciduous needle-leaved forest. The average minimum values were 114.8, 98.4, 0, and 103.7 g C m−2 month−1, respectively, and the ranking was evergreen needle-leaved forest > shrub forest > evergreen broad-leaved forest > deciduous needle-leaved forest. The average monthly GPP values were 196.0, 185.8, 102.5, and 200.7 g C m−2 month−1, respectively, and the ranking was shrub forest > evergreen needle-leaved forest > evergreen broad-leaved forest > deciduous needle-leaved forest. For the basin NPP, the maximum values were 90.7, 93.7, 130.4, and 42.3 g C m−2 month−1, respectively, and the ranking was deciduous needle-leaved forest > evergreen broad-leaved forest > evergreen needle-leaved forest > shrub forest. The minimum values were 30.3, 31.1, –4.1, and –9.2 g C m−2 month−1, respectively, and the ranking was evergreen broad-leaved forest > evergreen needle-leaved forest > deciduous needle-leaved forest > shrub forest. The average maximum values were 69.8, 84.7, 124.3, and 32.7 g C m−2 month−1, respectively, and the ranking was deciduous needle-leaved forest > evergreen broad-leaved forest > evergreen needle-leaved forest > shrub forest. The average minimum values were 40.8, 39.2, –4.0, and 7.1 g C m−2 month−1, respectively, and the ranking was evergreen needle-leaved forest > evergreen broad-leaved forest > shrub forest > deciduous needle-leaved forest. The average monthly NPP values were 52.6, 64.3, 50.9, and 21.9 g C m−2 month−1, respectively, and the ranking was evergreen broad-leaved forest > evergreen needle-leaved forest > deciduous needle-leaved forest > shrub forest.
3.3. Spatial Productivity Changes in Forests
3.3.1. Interannual Spatial Variations
From 1970 to 2021, the interannual spatial distributions of the forest GPP and NPP in the Ganjiang River Basin are shown in Figure 6. During this period, the forest GPP showed an overall upward trend. It increased significantly from 1970 to 2000, with the areas with remarkable growth being in the upper reaches of the Ganjiang River. From 2000 to 2020, it showed a fluctuating trend, and the high-value areas in the upper reaches shifted to the middle and lower reaches. It decreased from 2000 to 2010 and then increased from 2010 to 2020, with the growing areas being in the middle reaches. The forest NPP also showed an overall upward trend. It increased significantly in the upper and middle reaches of the Ganjiang River from 1970 to 2000. From 2000 to 2020 it fluctuated, and the high-value areas shifted to the middle and lower reaches. It decreased from 2000 to 2010 and then increased from 2010 to 2020, with the growing areas being in the middle reaches.
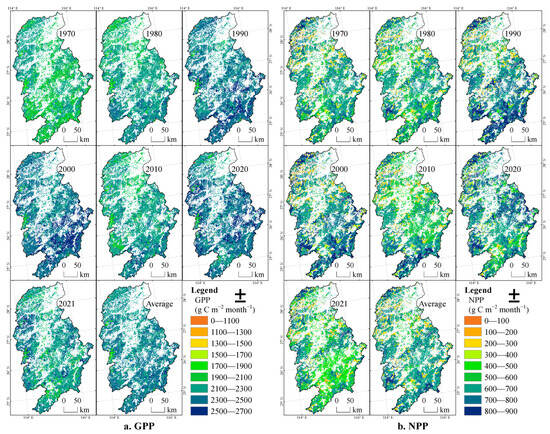
Figure 6.
Spatio-temporal distributions of GPP and NPP of forests in the Ganjiang River Basin on the interannual scale.
There are obvious differences in the spatial distributions of the annual average values of the forest GPP and NPP in the Ganjiang River Basin. They are high in the surrounding mountainous areas and low in the central and northern plains and generally show a distribution pattern of being higher in the south and lower in the north, which conforms to the zonal differentiation law of hydrothermal conditions and vegetation types. The vegetation productivity in the mountainous areas around the provincial boundaries is high, and the GPP and NPP are generally higher than 2000 and 600 g C m−2 year−1, respectively.
From 1970 to 2021, the basin GPP and NPP of the evergreen needle-leaved forest, the evergreen broad-leaved forest, the deciduous needle-leaved forest, and the shrub forest in the Ganjiang River Basin had different performances. The rankings of the maximum value, the average maximum value, and the average minimum value of GPP were mostly in the order of shrub forest > evergreen needle-leaved forest > evergreen broad-leaved forest > deciduous needle-leaved forest; the maximum value and the average maximum value of NPP were mostly in the order of evergreen broad-leaved forest > evergreen needle-leaved forest > deciduous needle-leaved forest > shrub forest, and the rankings of the minimum values were different. There were similar patterns for the annual average basin GPP and NPP. Both the maximum value and the average value of the annual average basin NPP of forest types were in the order of evergreen broad-leaved forest > evergreen needle-leaved forest > deciduous needle-leaved forest > shrub forest.
3.3.2. Intra-Annual Spatial Variations
- Seasonal Spatial Variations
The seasonal spatial distributions of the forest GPP and NPP in the Ganjiang River Basin from 1970 to 2021 are shown in Figure 7. During the 52 years, the spatial distributions of the GPP in the four seasons presented significant seasonal differences. The differences between spring and autumn were relatively small, while the differences between summer and winter were relatively large. The average GPP values in spring, summer, autumn, and winter were 593.8, 806.8, 587.6, and 336.4 g C m−2 season−1, respectively. In spring, the GPP values in most areas were between 500 and 600 g C m−2 season−1, and in some areas of the upper reaches, they exceeded 600 g C m−2 season−1. In summer, with the vigorous growth of vegetation, the GPP values in most areas were between 700 and 800 g C m−2 season−1, and in some areas, they were even as high as 900 g C m−2 season−1. In autumn, as the vegetation began to wither, the GPP values in most areas dropped back to the range of 500 to 600 g C m−2 season−1, and in some areas, they still reached 600 g C m−2 season−1. In winter, most of the vegetation stopped growing and the GPP dropped to the lowest level. In most areas, it was between 300 and 400 g C m−2 season−1, in a few areas it was between 200 and 300 g C m−2 season−1, and in very few areas of the upper reaches, it exceeded 400 g C m−2 season−1. From spring to summer, the GPP increased significantly, especially in some areas of the upper, middle, and lower reaches, which were mostly distributed near mountain ranges. The average value increased from 593.8 g C m−2 season−1 to 806.8 g C m−2 season−1. From summer to winter, the GPP decreased obviously, dropping from 806.8 g C m−2 season−1 to 336.4 g C m−2 season−1. The difference between autumn and spring was not significant, while the spatial difference between summer and winter was particularly obvious.
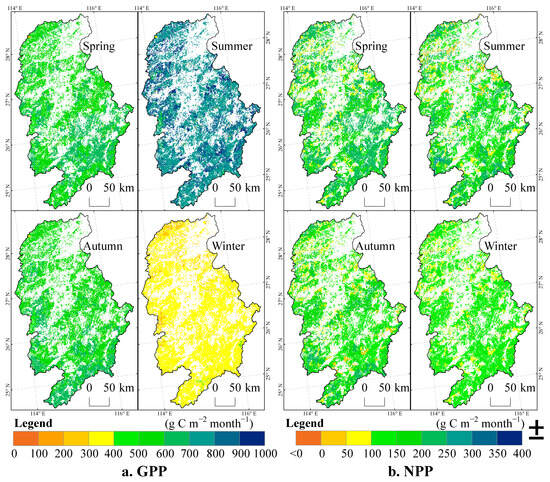
Figure 7.
Spatio-temporal distributions of GPP and NPP of forests in the Ganjiang River Basin on the seasonal scale.
The spatial distributions of NPP in the four seasons during the 52 years also demonstrated significant differences. The average NPP values in spring, summer, autumn, and winter were 191.0, 159.8, 150.9, and 117.3 g C m−2 season−1, respectively. In spring, the NPP values in most areas of the downstream were between 50 and 100 g C m−2 season−1; those in most areas of the upstream and a small part of the downstream were between 200 and 250 g C m−2 season−1, and those in most areas of the upstream and the middle reaches were between 150 and 200 g C m−2 season−1. In summer, there were relatively large spatial differences in NPP. With the vigorous growth of vegetation, the NPP values in some areas of the middle and lower reaches were between 0 and 50 g C m−2 season−1, those in most areas were between 100 and 200 g C m−2 season−1, those in the upstream and a small part of the downstream were between 200 and 250 g C m−2 season−1, and in some areas, they exceeded 250 g C m−2 season−1. In autumn, as the vegetation withered, the spatial distribution differences in NPP were significant. The NPP values in some areas of the middle and lower reaches were between 0 and 100 g C m−2 season−1, those in most areas were between 100 and 200 g C m−2 season−1, and those in the upstream and some areas of the downstream exceeded 200 g C m−2 season−1. In winter, most of the vegetation stopped growing and the NPP dropped to the lowest level. In some areas, the NPP was less than 0 g C m−2 season−1, in most areas it was between 100 and 150 g C m−2 season−1, in a small part it was between 50 and 100 g C m−2 season−1, and in very few areas of the upstream, it exceeded 150 g C m−2 season−1. From spring to summer, the NPP decreased significantly, and there were areas with significant decreases in the upper, middle, and lower reaches. The average value dropped from 191.0 g C m−2 season−1 to 159.8 g C m−2 season−1. From summer to autumn, the NPP showed a fluctuating trend. The overall difference between autumn and summer was not significant, and there were increases in some areas of the middle and lower reaches. However, the spatial difference between summer and winter was obvious, with the value dropping from 159.8 g C m−2 season−1 to 117.3 g C m−2 season−1.
- 2.
- Seasonal Forest-type Spatial Distribution
In spring, the average values of the basin GPP of the evergreen needle-leaved forest, the evergreen broad-leaved forest, the deciduous needle-leaved forest, and the shrub forest were 608.3, 569.7, 270.7, and 585.9 g C m−2 season−1, respectively, and the ranking was evergreen needle-leaved forest > shrub forest > evergreen broad-leaved forest > deciduous needle-leaved forest. The average values of NPP were 199.0, 224.6, 162.9, and 91.8 g C m−2 season−1, respectively, and the ranking was deciduous needle-leaved forest > evergreen broad-leaved forest > evergreen needle-leaved forest > shrub forest.
In summer, the maximum values of the basin GPP of the evergreen needle-leaved forest, the evergreen broad-leaved forest, the deciduous needle-leaved forest, and the shrub forest were 875.9, 822.4, 712.3, and 956.2 g C m−2 season−1, respectively, and the ranking was shrub forest > evergreen needle-leaved forest > evergreen broad-leaved forest > deciduous needle-leaved forest. The minimum values of GPP were 722.3, 636.2, 664.9, and 715.2 g C m−2 season−1, respectively, and the ranking was evergreen needle-leaved forest > shrub forest > deciduous needle-leaved forest > evergreen broad-leaved forest. The average values of GPP were 796.3, 778.7, 693.2, and 904.6 g C m−2 season−1, respectively, and the ranking was shrub forest > evergreen needle-leaved forest > evergreen broad-leaved forest > deciduous needle-leaved forest. The maximum values of NPP were 200.4, 261.9, 364.6, and 81.8 g C m−2 season−1, respectively, and the ranking was deciduous needle-leaved forest > evergreen broad-leaved forest > evergreen needle-leaved forest > shrub forest. The minimum values of NPP were 104.9, 191.8, 324.7, and 24.6 g C m−2 season−1, respectively. The average values of NPP were 151.5, 228.8, 343.0, and 53.3 g C m−2 season−1, respectively.
In autumn, the maximum values of the basin GPP of the evergreen needle-leaved forest, the evergreen broad-leaved forest, the deciduous needle-leaved forest, and the shrub forest were 728.9, 648.4, 283.5, and 687.1 g C m−2 season−1, respectively, and the ranking was evergreen needle-leaved forest > shrub forest > evergreen broad-leaved forest > deciduous needle-leaved forest. The minimum values of GPP were 511.6, 473.7, 246.5, and 504.1 g C m−2 season−1, respectively. The average values of GPP were 593.4, 572.0, 266.4, and 596.5 g C m−2 season−1, respectively, and the ranking was shrub forest > evergreen needle-leaved forest > evergreen broad-leaved forest > deciduous needle-leaved forest. The maximum values of NPP were 212.3, 234.6, 125.3, and 80.1 g C m−2 season−1, respectively, and the ranking was evergreen broad-leaved forest > evergreen needle-leaved forest > deciduous needle-leaved forest > shrub forest. The minimum values of NPP were 102.1, 143.1, 99.3, and 4.7 g C m−2 season−1, respectively. The average values of NPP were 152.6, 195.7, 111.5, and 53.9 g C m−2 season−1, respectively.
In winter, the maximum values of the basin GPP of the evergreen needle-leaved forest, the evergreen broad-leaved forest, the deciduous needle-leaved forest, and the shrub forest were 449.2, 359.5, 0, and 386.9 g C m−2 season−1, respectively, and the ranking was evergreen needle-leaved forest > shrub forest > evergreen broad-leaved forest > deciduous needle-leaved forest. The minimum values of GPP were 310.8, 248.5, 0, and 284.3 g C m−2 season−1, respectively, with the same ranking. The ranking of the average values of GPP was also evergreen needle-leaved forest > shrub forest > evergreen broad-leaved forest > deciduous needle-leaved forest. The maximum values of NPP were 162.3, 144.1, −6.5, and 81.6 g C m−2 season−1, respectively, and the ranking was evergreen needle-leaved forest > evergreen broad-leaved forest > shrub forest > deciduous needle-leaved forest. The average values of NPP were 128.5, 122.3, –6.9, and 63.9 g C m−2 season−1, respectively.
- 3.
- Inter-monthly Spatial Variations
The spatial distribution differences in the 52-year average monthly GPP of forests in the Ganjiang River Basin are obvious (Figure 8). The seasonal changes in GPP and NPP are closely related to the seasonal patterns of temperature and precipitation. During the year, the change trends of GPP and NPP show similar patterns. From winter to spring, with the increase in temperature and precipitation, both GPP and NPP show an upward trend. GPP reaches its peak in July, while NPP reaches its peak in May. Subsequently, with the continuous increase in temperature and the decrease in precipitation, both GPP and NPP begin to decline. In summer and autumn, the values of GPP and NPP are generally high, but they drop to the lowest in winter. Specifically, in December, January, and February, the average GPP values of forests in the Ganjiang River Basin are 108.4, 111.9, and 116.1 g C m−2 month−1, respectively, while the average NPP values are 38.7, 40.1, and 38.6 g C m−2 month−1, respectively. During these three months, most of the forests in the basin are in a dormant state, and the vegetation productivity is relatively low. Starting from March, with the rise in temperature and the increase in precipitation, the vegetation grows faster, and productivity increases significantly. In March, April, and May, the average GPP values of forests in the basin are 155.7, 198.8, and 239.3 g C m−2 month−1, respectively, while the average NPP values are 56.0, 66.2, and 68.8 g C m−2 month−1, respectively. During this period, the high-value areas of GPP and NPP are mainly distributed in the upper and middle reaches of the basin. In June, July, and August, with the continuous increase in temperature and the decrease in precipitation, the change trends of GPP and NPP diverge. GPP continues to increase in June and July but begins to decline in August, while NPP shows a downward trend throughout the summer. During these three months, the average GPP values are 252.2, 287.2, and 267.4 g C m−2 month−1, respectively, while the average NPP values are 59.1, 56.1, and 44.6 g C m−2 month−1, respectively. Entering autumn, in September, October, and November, the values of both GPP and NPP show a downward trend. The average GPP values are 238.8, 201.4, and 147.4 g C m−2 month−1, respectively, while the average NPP values are 53.9, 52.9, and 44.1 g C m−2 month−1, respectively. During these three months, the high-value areas of GPP and NPP are mainly distributed in the middle and upper reaches of the basin, while the low-value areas are mainly distributed in the middle and lower reaches of the basin.
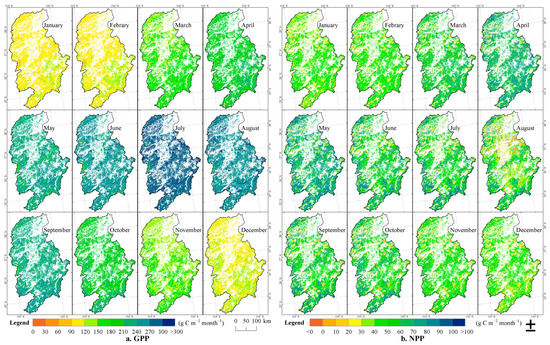
Figure 8.
Spatio-temporal distributions of GPP and NPP of Forests in the Ganjiang River Basin on the inter-monthly scale.
4. Discussion
4.1. Uncertainties in NPP Simulation
This research used the Biome-BGC model to simulate the forest productivity in the Ganjiang River Basin. The model-simulated NPP and the measured NPP had a high linear goodness of fit, indicating that the model could well simulate the NPP of subtropical forest vegetation. However, there was still a certain deviation between the simulated NPP and the measured NPP, which mainly stemmed from the following aspects.
4.1.1. Uncertainties of Model Parameters
The Biome-BGC model requires a large number of physiological and ecological parameters, and some of these parameters are difficult to obtain or have relatively large variability. For example, in this study, some parameters adopted the default values or reference values from the literature, which might deviate from the actual situation in the Ganjiang River Basin. For instance, the study by Sun et al. (2017) showed that there were deviations between the NPP simulated by the Biome-BGC model and the measured NPP, mainly because the model parameters did not match the regional characteristics [48].
In addition, the mathematical methods used to calibrate model vegetation physiological parameters are generally based on mathematical optimization criteria and have not yet taken into account the physiological process module within the model; therefore, the calibrated vegetation physiological parameters may not be the true physiological parameter values of the vegetation [49,50]. Some studies have suggested the use of measured vegetation physiological parameters for parameter localization [51]. However, ecosystem process models are very complex and contain a large number of adjustable parameters, which makes it difficult to obtain all the vegetation physiological parameters from field measurements, and there are difficulties in direct observation of individual parameters and the interaction between parameters [52]. Moreover, real natural ecosystems are much more complex than models; therefore, it is difficult to calibrate models accurately by simply measuring vegetation physiological parameters in the field.
4.1.2. Simplification of the Model Process
The Biome-BGC model simplifies the simulation of ecosystem processes, such as the processes of soil moisture and nutrient cycling, which may lead to differences between the simulation results and the actual situation [53]. For example, the study by Fang et al. (2024) demonstrated that there were deviations between the soil moisture content simulated by the Biome-BGC model and the measured values, mainly because the model’s simulation of the dynamic changes in soil moisture was not precise enough [54].
4.1.3. Uncertainties of Data
The raster input data used for modeling such as land cover, DEM, and soils have limited resolution, and the reanalysis dataset for meteorological data has some uncertainty. All these factors have an impact on the accuracy of the models. For example, Tian et al. (2017) showed that the spatial and temporal resolution of the raster data input to the Biome-BGC model affects the simulation accuracy of vegetation biomass. Moreover, the ERA5-Land meteorological dataset we used was not cross-validated with the measured meteorological observations in the Ganjiang River Basin, which may increase the uncertainty of this study regarding the forest productivity simulation [55].
4.1.4. Regional Specificity
As a typical representative of the subtropical forest ecosystem, the Ganjiang River Basin has unique characteristics in its ecological environment and vegetation types. The Biome-BGC model may not be able to fully reflect these regional specificities. For example, the study by Feng et al. (2024) demonstrated that there were deviations between the NPP of the subtropical forest simulated by the Biome-BGC model and the measured values. The main reason is that the model lacks information on the interaction among climate, vegetation, and soil that is unique to subtropical forests [56].
4.2. Factors Affecting the Spatio-Temporal Distribution of Forest Productivity
The forest productivity in the Ganjiang River Basin shows an overall upward trend but has an uneven spatial distribution. The productivity is relatively high in mountainous areas and relatively low in the plains in the central and northern regions, presenting a distribution characteristic of being higher in the south and lower in the north. This may be related to the zonal differentiation laws of hydrothermal conditions and vegetation types [57]. There are obvious seasonal differences in forest productivity. Both GPP and NPP show an upward trend in spring, reach their peaks in summer, and then gradually decline. This may be affected by temperature and precipitation [58]. The spatial distribution of forest productivity is also influenced by seasons. The differences in the spatial distributions of GPP and NPP are relatively small in spring and autumn but relatively large in summer and winter. This may be related to the growth cycle of vegetation and seasonal changes [59].
The NPP of the DNF modeled in this study was close to 0 from November of the current year to March of the following year (Figure 5b), which may be attributed to the fact that the region to which the model climatic module was originally applied was a temperate region, and the DNF in the subtropics differed from that of the temperate region to a certain extent [60].
It should be noted that the vegetation cover data used in this study for the spatio-temporal simulation of NPP in forest ecosystems under the long time series of 1970–2021 were not updated according to different years. The watershed experienced deforestation from the 1960s to 1970s, resulting in some changes in the forest area [61]. However, owing to the late application of remote sensing data, no corresponding land cover data appeared in earlier years, which may lead to some inaccuracy in the spatial distribution of its NPP. In addition, the region has implemented the policy of forest closure in recent years, and the spatial changes in forest distribution are very small, with the forest cover basically stabilized at about 60% [62]. For these reasons, many studies in this area have used vegetation cover data that do not vary with year [63,64], which also proves that it is feasible to use this approach in this study.
The Ganjiang River Basin has implemented soil erosion control, returning farmland to forests, and ecological restoration projects during our study period; on the other hand, deforestation, pest and disease events, seasonal and regional droughts, and waterlogging disasters have occurred in some areas with strong human activities or more fragile ecology [65]. However, we have not considered the effects of land-use change, ecological engineering (e.g., afforestation), anthropogenic disturbances, pest and disease outbreaks, and extreme weather and climate events on forest productivity.
4.3. Research Prospects
This study has provided a basis for further research on the spatio-temporal changes in the productivity of subtropical forest ecosystems. Future research can be expanded in the following aspects: (1) Improving model parameters: Based on more measured data and regional characteristics, improve the parameters of the Biome-BGC model to enhance the simulation accuracy of the model. (2) Studying the forest carbon cycling process: Conduct in-depth research on the carbon cycling process of subtropical forests and their responses to climate change, so as to provide a more scientific basis for regional carbon sink management [66]. (3) Carrying out long-term monitoring: Set up long-term monitoring stations to conduct long-term monitoring of subtropical forest ecosystems and reveal the long-term trends and driving mechanisms of the spatio-temporal changes in forest productivity [67,68]. (4) Studying the ecosystem service functions of forest ecosystems: Research on the ecosystem service functions provided by subtropical forest ecosystems [69], such as water conservation, soil conservation, and biodiversity protection, so as to provide a scientific basis for regional sustainable development [70,71].
5. Conclusions
This study simulated the spatio-temporal changes in forest productivity in the Ganjiang River Basin based on the Biome-BGC model. The main conclusions are as follows:
- (1)
- The interannual NPP of the evergreen broad-leaved forest is 771.4 g C m−2 year−1, that of the evergreen needle-leaved forest is 631.6 g C m−2 year−1, that of the deciduous needle-leaved forest is 610.5 g C m−2 year−1, and that of the shrub forest is 262.8 g C m−2 year−1. The evergreen broad-leaved forest has greater carbon sink potential under the background of climate change;
- (2)
- The forest productivity in the Ganjiang River Basin shows an overall upward trend but has an uneven spatial distribution. The productivity is relatively high in mountainous areas and relatively low in the plains in the central and northern regions, presenting a distribution characteristic of being higher in the south and lower in the north;
- (3)
- There are differences in the productivity of different forest types, and these differences change with the time scale. The annual average GPP of the shrub forest is the highest while its annual average NPP is the lowest. However, in different seasons and months, the productivity rankings of various forest types are different;
- (4)
- There are obvious seasonal differences in forest productivity. Both GPP and NPP show an upward trend in spring, reach their peaks in summer, and then gradually decline;
- (5)
- The spatial distribution of forest productivity is also affected by seasons. The differences in the spatial distributions of GPP and NPP are relatively small in spring and autumn but relatively large in summer and winter.
Supplementary Materials
The following supporting information can be downloaded at https://www.mdpi.com/article/10.3390/f16040603/s1, Table S1: Eco-physiological parameters of different forest types [34,72,73,74,75].
Author Contributions
Z.W., Z.Z. and W.W. conceived the research. Z.W. and Z.Z. wrote the manuscript. Z.W., Z.Z., L.X., D.X., X.W. and W.W. edited the manuscript. Z.W., D.X., L.X. and X.W. contributed to the data collection. All authors have read and agreed to the published version of the manuscript.
Funding
This research was funded by the Think Tank Project of Jiangxi Province Research on the Path and Countermeasures of the Coordinated Development of Ecosystem Services and Social Economy in Poyang Lake Basin (grant numbers 0204072501).
Data Availability Statement
The data presented in this study are available on request from the corresponding author.
Conflicts of Interest
The authors declare that they have no known competing financial interests or personal relationships that could have appeared to influence the work reported in this paper.
Abbreviations
| BF | bamboo forest |
| EBF | evergreen broad-leaved forests |
| ECF | evergreen coniferous forest |
| GPP | Gross primary productivity |
| MIX | evergreen conifer-broadleaf mixed forest |
| MLO | Mauna Loa Observatory |
| MTCLIM | Mountain Microclimate Simulation Model |
| NPP | net primary productivity |
References
- Piao, S.L.; Yue, C.; Ding, J.Z.; Guo, Z.T. Perspectives on the role of terrestrial ecosystems in the ’carbon neutrality’ strategy. Sci. China—Earth Sci. 2022, 65, 1178–1186. [Google Scholar]
- Zhou, G.Y.; Eisenhauer, N.; Terrer, C.; Eldridge, D.J.; Duan, H.M.; Guirado, E.; Berdugo, M.; Zhou, L.Y.; Liu, S.G.; Zhou, X.H.; et al. Resistance of ecosystem services to global change weakened by increasing number of environmental stressors. Nat. Geosci. 2024, 17, 882–888. [Google Scholar]
- Muñoz, E.; Chanca, I.; Sierra, C.A. Increased atmospheric CO2 and the transit time of carbon in terrestrial ecosystems. Glob. Change Biol. 2023, 29, 6441–6452. [Google Scholar]
- Gao, Y.; Zhang, N.; Ma, Q.; Li, J. How Is Human Well-Being Related to Ecosystem Services at Town and Village Scales? A Case Study from the Yangtze River Delta, China. Landsc. Ecol. 2024, 39, 126. [Google Scholar]
- Tang, X.L.; Zhao, X.; Bai, Y.F.; Tang, Z.Y.; Wang, W.T.; Zhao, Y.C.; Wan, H.W.; Xie, Z.Q.; Shi, X.Z.; Wu, B.F.; et al. Carbon pools in China’s terrestrial ecosystems: New estimates based on an intensive field survey. Proc. Natl. Acad. Sci. USA 2018, 115, 4021–4026. [Google Scholar]
- Zheng, Y.; Shen, R.Q.; Wang, Y.W.; Li, X.Q.; Liu, S.G.; Liang, S.L.; Chen, J.M.; Ju, W.M.; Zhang, L.; Yuan, W.P. Improved estimate of global gross primary production for reproducing its long—Term variation, 1982–2017. Earth Syst. Sci. Data 2020, 12, 2725–2746. [Google Scholar]
- Wang, S.H.; Zhang, Y.G.; Ju, W.M.; Qiu, B.; Zhang, Z.Y. Tracking the seasonal and inter—Annual variations of global gross primary production during last four decades using satellite near—Infrared reflectance data. Sci. Total Environ. 2021, 755, 142569. [Google Scholar]
- Ma, R.; Xia, C.L.; Liu, Y.W.; Wang, Y.J.; Zhang, J.Q.; Shen, X.J.; Lu, X.G.; Jiang, M. Spatiotemporal Change of Net Primary Productivity and Its Response to Climate Change in Temperate Grasslands of China. Front. Plant Sci. 2022, 13, 899800. [Google Scholar]
- Fan, L.; Wang, X.; Chen, Z.; Chen, R.; Liu, X.; He, Y.; Wang, S. Analysis of Spatial and Temporal Evolution of Ecosystem Services and Driving Factors in the Yellow River Basin of Henan Province, China. Forests 2024, 15, 1547. [Google Scholar] [CrossRef]
- Yang, H.F.; Zhong, X.N.; Deng, S.Q.; Xu, H. Assessment of the impact of LUCC on NPP and its influencing factors in the Yangtze River basin, China. Catena 2021, 206, 105542. [Google Scholar]
- Hu, Z.M.; Piao, S.L.; Knapp, A.K.; Wang, X.H.; Peng, S.S.; Yuan, W.P.; Running, S.; Mao, J.F.; Shi, X.Y.; Ciais, P.; et al. Decoupling of greenness and gross primary productivity as aridity decreases. Remote Sens. Environ. 2022, 279, 113120. [Google Scholar] [CrossRef]
- Jactel, H.; Gritti, E.S.; Drössler, L.; Forrester, D.I.; Mason, W.L.; Morin, X.; Pretzsch, H.; Castagneyrol, B. Positive biodiversity—Productivity relationships in forests: Climate matters. Biol. Lett. 2018, 14, 20170747. [Google Scholar] [CrossRef] [PubMed]
- Forzieri, G.; Dakos, V.; McDowell, N.G.; Ramdane, A.; Cescatti, A. Emerging signals of declining forest resilience under climate change. Nature 2022, 608, 534–539. [Google Scholar] [CrossRef]
- Fang, M.Z.; Liu, W.; Zhang, J.Y.; Ma, J.; Liang, Z.S.; Yu, Q. Quantitative Evaluation of the Applicability of Classical Forest Ecosystem Carbon Cycle Models in China: A Case Study of the Biome—BGC Model. Forests 2024, 15, 1609. [Google Scholar] [CrossRef]
- Zhao, Y.R.; O’Neill, G.A.; Coops, N.C.; Wang, T.L. Predicting the site productivity of forest tree species using climate niche models. For. Ecol. Manag. 2024, 562, 121936. [Google Scholar] [CrossRef]
- Yu, P.; Zhang, Y.; Liu, P.; Zhang, J.; Xing, W.; Tong, X.; Zhang, J.; Meng, P. Regulation of biophysical drivers on carbon and water fluxes over a warm-temperate plantation in northern China. Sci. Total Environ. 2024, 907, 167408. [Google Scholar] [CrossRef]
- Du, L.T.; Zeng, Y.J.; Ma, L.L.; Qiao, C.L.; Wu, H.Y.; Su, Z.B.; Bao, G. Effects of anthropogenic revegetation on the water and carbon cycles of a desert steppe ecosystem. Agric. For. Meteorol. 2021, 300, 108339. [Google Scholar] [CrossRef]
- Song, X.; Zheng, B.; Hu, F.; Xu, L.; Wu, H.; Liu, Z.; Wan, W. Divergent responses of NPP to climate factors among forest types at interannual and inter-monthly scales: An empirical study on four typical forest types in subtropical China. Forests 2023, 14, 1474. [Google Scholar] [CrossRef]
- Zhao, J.F.; Yan, X.D.; Guo, J.P.; Jia, G.S. Evaluating spatial-temporal dynamics of Net Primary Productivity of different forest types in northeastern China based on improved FORCCHN. PLoS ONE 2012, 7, e48131. [Google Scholar] [CrossRef]
- Wang, Y.G.; Luo, G.P.; Li, C.F.; Zhang, Y.; Zhang, C.L.; Yu, X.T.; Fan, B.B.; Zhang, W.Q.; Xie, M.J.; Liu, Y.J. Grazing weakens the carbon sequestration capacity of dry temperate grassland ecosystems in Central Asia. Catena 2025, 248, 108608. [Google Scholar] [CrossRef]
- Zeng, X.; Hu, Z.M.; Chen, A.P.; Yuan, W.P.; Hou, G.L.; Han, D.R.; Liang, M.Q.; Di, K.; Cao, R.C.; Luo, D.N. The global decline in the sensitivity of vegetation productivity to precipitation from 2001 to 2018. Glob. Change Biol. 2022, 28, 6823–6833. [Google Scholar] [CrossRef] [PubMed]
- Shah, W.U.; Hao, G.; Yan, H.; Shen, J.T.; Yasmeen, R. Forestry Resource Efficiency, Total Factor Productivity Change, and Regional Technological Heterogeneity in China. Forests 2024, 15, 152. [Google Scholar] [CrossRef]
- Han, X.; Yuan, H. Impacts of precipitation uncertainty on hydrological ensemble simulations over the Ganjiang River basin. J. Hydrol. Reg. Stud. 2024, 51, 101617. [Google Scholar] [CrossRef]
- Deng, C.; Yin, X.; Zou, J.; Wang, M.i.; Hou, Y. Assessment of the impact of climate change on streamflow of Ganjiang River catchment via LSTM—Based models. J. Hydrol. Reg. Stud. 2024, 52, 101716. [Google Scholar] [CrossRef]
- Badora, K.; Wróbel, R. Changes in the Spatial Structure of the Landscape of Isolated Forest Complexes in the 19th and 20th Centuries and Their Potential Effects on Supporting Ecosystem Services Related to the Protection of Biodiversity Using the Example of the Niemodlin Forests (SW Poland). Sustainability 2020, 12, 4237. [Google Scholar] [CrossRef]
- He, X.; Miao, Z.M.; Wang, Y.M.; Yang, L.; Zhang, Z.X. Response of soil erosion to climate change and vegetation restoration in the Ganjiang River Basin, China. Ecol. Indic. 2024, 158, 111429. [Google Scholar] [CrossRef]
- Fini, A.; Vigevani, I.; Corsini, D.; Wezyk, P.; Bajorek-Zydron, K.; Failla, O.; Cagnolati, E.; Mielczarek, L.; Comin, S.; Gibin, M.; et al. CO2—Assimilation, sequestration, and storage by urban woody species growing in parks and along streets in two climatic zones. Sci. Total Environ. 2023, 903, 166198. [Google Scholar] [CrossRef]
- Bai, X.; Li, F.J.; Ma, L.Y.; Li, C. Weathering of geotextiles under ultraviolet exposure: A neglected source of microfibers from coastal reclamation. Sci. Total Environ. 2022, 804, 150168. [Google Scholar] [CrossRef]
- Zhang, Y.C.; Piao, S.L.; Sun, Y.; Rogers, B.M.; Li, X.Y.; Lian, X.; Liu, Z.H.; Chen, A.P.; Peñuelas, J. Future reversal of warming—Enhanced vegetation productivity in the Northern Hemisphere. Nat. Clim. Change 2022, 12, 581–586. [Google Scholar] [CrossRef]
- Ji, Y.H.; Zhou, G.S.; Luo, T.X.; Dan, Y.; Zhou, L.; Lv, X.M. Variation of net primary productivity and its drivers in China’s forests during 2000–2018. For. Ecosyst. 2020, 7, 15. [Google Scholar] [CrossRef]
- Srinet, R.; Nandy, S.; Patel, N.R.; Padalia, H.; Watham, T.; Singh, S.K. Simulation of forest carbon fluxes by integrating remote sensing data into biome-BGC model. Ecol. Model. 2023, 475, 110185. [Google Scholar]
- Vandewiele, M.; Geres, L.; Lotz, A.; Mandl, L.; Richter, T.; Seibold, S.; Seidl, R.; Senf, C. Mapping spatial microclimate patterns in mountain forests from LiDAR. Agric. For. Meteorol. 2023, 341, 109662. [Google Scholar] [CrossRef]
- Running, S.; Hunt, E., Jr. Generalization of a forest ecosystem model for other biomes, BIOME-BGC, and an application for global-scale models. Scaling Physiol. Process. Leaf Globe 1993, 141, 158. [Google Scholar]
- White, M.A.; Thornton, P.E.; Running, S.W.; Nemani, R.R. Parameterization and sensitivity analysis of the BIOME-BGC terrestrial ecosystem model: Net primary production controls. Earth Interact. 2000, 4, 1–85. [Google Scholar]
- Wang, T.; Bao, A.M.; Xu, W.Q.; Zheng, G.X.; Nzabarinda, V.; Yu, T.; Huang, X.R.; Long, G.; Naibi, S. Dynamics of forest net primary productivity based on tree ring reconstruction in the Tianshan Mountains. Ecol. Indic. 2023, 146, 109713. [Google Scholar]
- Gao, Y.; Zhang, T.; Zhang, W.K.; Meng, H.; Zhang, Z. Research on visual behavior characteristics and cognitive evaluation of different types of forest landscape spaces. Urban For. Urban Green. 2020, 54, 126788. [Google Scholar] [CrossRef]
- Ma, Z.Q.; Liu, Q.J.; Wang, H.M.; Li, X.r.; Zeng, H.Q.; Xu, W.J. Observation and simulation of productivity of Pinus elliottii plantation in central subtropical region. Sci. Sin. 2008, 38, 1005–1015. [Google Scholar]
- Li, S.Y. Estimation of the Vegetation Net Primary Productivity Based on CASA Model in Gan River Basin. Mater’s Degree, Lanzhou Jiaotong University, Lanzhou, China, 2014. [Google Scholar]
- Feng, X.; Liu, G.; Chen, J.M.; Chen, M.; Liu, J.; Ju, W.M.; Sun, R.; Zhou, W. Net primary productivity of China’s terrestrial ecosystems from a process model driven by remote sensing. J. Environ. Manag. 2007, 85, 563–573. [Google Scholar]
- Dai, E.; Li, S.; Wu, Z.; Yan, H.W.; Zhao, D.S. Spatial pattern of net primary productivity and its relationship with climatic factors in Hilly Red Soil Region of southern China: A case study in Taihe County, Jiangxi Province. Geogr. Res. 2015, 34, 1222–1234. [Google Scholar]
- Chen, S.; Jiang, H.; Cai, Z.; Zhou, X.; Peng, C. The response of the net primary production of Moso bamboo forest to the On and Off-year management: A case study in Anji County, Zhejiang, China. For. Ecol. Manag. 2018, 409, 1–7. [Google Scholar] [CrossRef]
- Zhang, J.; Chu, Z.; Ge, Y.; Zhou, X.; Jiang, H.; Chang, J.; Peng, C.; Zheng, J.; Jiang, B.; Zhu, J.; et al. TRIPLEX model testing and application for predicting forest growth and biomass production in the subtropical forest zone of China’s Zhejiang Province. Ecol. Model. 2008, 219, 264–275. [Google Scholar]
- Li, H. On the Spation-Temporal Simulation of Forest Ecosystem Net Primary Productivity and Net Ecosystem Productivity in Fujian Province. Ph.D. Thesis, Fujian Normal University, Fuzhou, China, 2008. [Google Scholar]
- Chen, S.; Jiang, H.; Jin, J.; Wang, Y. Changes in net primary production in the Tianmu Mountain Nature Reserve, China, from 1984 to 2014. Int. J. Remote Sens. 2017, 38, 211–234. [Google Scholar] [CrossRef]
- Zeng, H.Q.; Liu, Q.J.; Feng, Z.W.; Wang, X.K.; Ma, Z.Q. GPP and NPP study of Pinus elliottii forest in red soil hilly region based on BIOME-BGC model. Acta Ecol. Sin. 2008, 28, 5314–5321. [Google Scholar]
- Chen, Y.M.; Zhang, W.Q.; Yang, T.X.; Zhao, G.; Wang, S.B. The Change characteristics of net primary production in different vegetation types in China. J. Fudan Univ. (Nat. Sci.) 2012, 51, 377–381. [Google Scholar]
- Cui, L.L.; Du, H.Q.; Shi, J.; Chen, Z.; Guo, W. Spatial and temporal pattern of vegetation NPP and its relationship with climate in the southeastern China. Sci. Geogr. Sin. 2016, 36, 787–793. [Google Scholar]
- Sun, Q.L.; Li, B.L.; Zhang, T.; Yuan, Y.C.; Gao, X.Z.; Ge, J.S.; Li, F.; Zhang, Z.J. An improved Biome—BGC model for estimating net primary productivity of alpine meadow on the Qinghai–Tibet Plateau. Ecol. Model. 2017, 350, 55–68. [Google Scholar]
- You, Y.; Wang, S.; Ma, Y.; Wang, X.; Liu, W. Improved modeling of Gross Primary Productivity of alpine grasslands on the Tibetan Plateau using the Biome-BGC model. Remote Sens. 2019, 11, 1287. [Google Scholar] [CrossRef]
- Hidy, D.; Barcza, Z.; Haszpra, L.; Churkina, G.; Pintér, K.; Nagy, Z. Development of the Biome-BGC model for simulation of managed herbaceous ecosystems. Ecol. Model. 2012, 226, 99–119. [Google Scholar]
- Mäkelä, A.; Valentine, H.T. The ratio of NPP to GPP: Evidence of change over the course of stand development. Tree Physiol. 2001, 21, 1015–1030. [Google Scholar]
- Li, C.; Sun, H.; Wu, X.; Han, H. An approach for improving soil water content for modeling net primary production on the Qinghai-Tibetan Plateau using Biome-BGC model. Catena 2020, 184, 104253. [Google Scholar]
- Geng, W.; Li, Y.; Zhang, P.; Yang, D.; Jing, W.; Rong, T. Analyzing Spatio-Temporal Changes and Trade-Offs/Synergies among Ecosystem Services in the Yellow River Basin, China. Ecol. Indic. 2022, 138, 108825. [Google Scholar] [CrossRef]
- Fang, M.Z.; Cheng, C.J.; He, N.P.; Si, G.X.; Sun, O.J. Implication of community—Level ecophysiological parameterization to modelling ecosystem productivity: A case study across nine contrasting forest sites in eastern China. J. For. Res. 2024, 35, 7. [Google Scholar] [CrossRef]
- Tian, X.; Yan, M.; van der Tol, C.; Li, Z.; Su, Z.B.; Chen, E.X.; Li, X.; Li, L.H.; Wang, X.F.; Pan, X.D.; et al. Modeling forest above-ground biomass dynamics using multi—Source data and incorporated models: A case study over the qilian mountains. Agric. For. Meteorol. 2017, 246, 1–14. [Google Scholar] [CrossRef]
- Feng, Z.Y.; Xing, W.Q.; Wang, W.G.; Yu, Z.B.; Shao, Q.X.; Chen, S.F. Assessing the spatiotemporal dynamics of water and carbon fluxes in subtropical forest of Xin’an River Basin using an improved Biome—BGC model. J. Hydrol. 2024, 635, 131201. [Google Scholar] [CrossRef]
- Liang, H.B.; Xue, Y.Y.; Li, Z.S.; Wang, S.; Wu, X.; Gao, G.Y.; Liu, G.H.; Fu, B.J. Soil moisture decline following the plantation of Robinia pseudoacacia forests: Evidence from the Loess Plateau. For. Ecol. Manag. 2018, 412, 62–69. [Google Scholar] [CrossRef]
- Zuidema, P.A.; Babst, F.; Groenendijk, P.; Trouet, V.; Abiyu, A.; Acuña–Soto, R.; Adenesky, E.; Alfaro-Sánchez, R.; Aragao, J.R.V.; Assis-Pereira, G.; et al. Tropical tree growth driven by dry—Season climate variability. Nat. Geosci. 2022, 15, 269–276. [Google Scholar] [CrossRef]
- Zani, D.; Crowther, T.W.; Mo, L.D.; Renner, S.S.; Zohner, C.M. Increased growing—Season productivity drives earlier autumn leaf senescence in temperate trees. Science 2020, 370, 1066–1071. [Google Scholar] [CrossRef]
- Zhao, W.; Mao, Q.; Liu, G.; Li, Y.; Xia, J.; Zhang, Y.J. Patterns of compound-leaf form and deciduous-leaf habit across forests in China: Their association and key climatic factors. Sci. Total Environ. 2022, 851, 158108. [Google Scholar] [CrossRef]
- Wang, Y.; Liu, Y.; Jin, J. Contrast Effects of Vegetation Cover Change on Evapotranspiration during a Revegetation Period in the Poyang Lake Basin, China. Forests 2018, 9, 217. [Google Scholar] [CrossRef]
- Fan, X.; Liu, Y.; Tao, J.; Wang, Y.; Zhou, H. MODIS detection of vegetation changes and investigation of causal factors in Poyang Lake basin, China for 2001–2015. Ecol. Indic. 2018, 91, 511–522. [Google Scholar] [CrossRef]
- You, Y.; Wang, S.; Pan, N.; Ma, Y.; Liu, W. Growth stage-dependent responses of carbon fixation process of alpine grasslands to climate change over the Tibetan Plateau, China. Agric. For. Meteorol. 2020, 291, 108085. [Google Scholar] [CrossRef]
- Mao, F.; Du, H.; Li, X.; Ge, H.; Cui, L.; Zhou, G. Spatiotemporal dynamics of bamboo forest net primary productivity with climate variations in Southeast China. Ecol. Indic. 2020, 116, 106505. [Google Scholar] [CrossRef]
- Lei, T.; Feng, J.; Lv, J.; Wang, J.; Song, H.; Song, W.; Gao, X. Net Primary Productivity Loss under different drought levels in different grassland ecosystems. J. Environ. Manag. 2020, 274, 111144. [Google Scholar] [CrossRef]
- Mao, Q.; Lu, X.; Wang, C.; Zhou, K.; Mo, J. Responses of understory plant physiological traits to a decade of nitrogen addition in a tropical reforested ecosystem. For. Ecol. Manag. 2017, 401, 65–74. [Google Scholar] [CrossRef]
- Tian, Y.; Wang, J.; Zhou, L.; Tao, L.; Lin, Y.; Hui, D.; Ren, H.; Lu, H. Nitrogen budgets of a lower subtropical forest as affected by 6 years of over—Canopy and understory nitrogen additions. Sci. Total Environ. 2022, 852, 158546. [Google Scholar] [CrossRef]
- Zhong, J.; Yao, H.; Liu, W.; Zhang, Y.; Lin, J.; Jiang, J.; Wang, C. Impact of Climate and Vegetation Dynamics on the Ecosystem Services of Subtropical Forests—A Case Study of Baishanzu National Park Area, China. Forests 2024, 15, 1850. [Google Scholar] [CrossRef]
- Tian, Y.; Zhou, P.; Zhou, L.; Zhang, L.; Lin, Y.; Wang, Y.; Wang, J.; Hui, D.; Ren, H.; Lu, H. Multi—Ecosystem services differently affected by over—Canopy and understory nitrogen additions in a typical subtropical forest. Glob. Change Biol. 2024, 30, e17192. [Google Scholar] [CrossRef]
- Huang, Z.; Du, H.; Mao, F.; Li, X.; Zhou, G.; Sun, J.; Xu, Y.; Xuan, J.; Lu, Y.; Huang, L.; et al. Assessing the impact of land use and cover change on above—Ground carbon storage in subtropical forests: A case study of Zhejiang Province, China. Geo-Spat. Inf. Sci. 2025, 1–27. [Google Scholar] [CrossRef]
- Wang, J.J.; Taylor, A.R.; D’Orangeville, L. Warming—Induced tree growth may help offset increasing disturbance across the Canadian boreal forest. Proc. Natl. Acad. Sci. USA 2023, 120, 2212780120. [Google Scholar] [CrossRef]
- Huang, Q.M.; Yang, D.D.; Shen, Y.G. Studies on the primary productivity of bamboo (Phyllostachys pubescens) grove. For. Res. 1993, 6, 536–540. [Google Scholar]
- Ichii, K.; Suzuki, T.; Kato, T.; Ito, A.; Hajima, T.; Ueyama, M.; Sasai, T.; Hirata, R.; Saigusa, N.; Ohtani, Y.; et al. Multi-model analysis of terrestrial carbon cycles in Japan: Limitations and implications of model calibration using eddy flux observations. Biogeosciences 2010, 7, 2061–2080. [Google Scholar]
- Kelliher, F.M.; Leuning, R.; Raupach, M.R.; Schulze, E.D. Maximum conductances for evaporation from global vegetation types. Agric. For. Meteorol. 1995, 73, 1–16. [Google Scholar]
- Mao, F.J.; Li, P.H.; Zhou, G.M.; Du, H.; Xu, X.; Shi, Y.; Mo, L.; Zhou, Y.; Tu, G. Development of the BIOME-BGC model for the simulation of managed Moso bamboo forest ecosystems. J. Environ. Manag. 2016, 172, 29–39. [Google Scholar]
Disclaimer/Publisher’s Note: The statements, opinions and data contained in all publications are solely those of the individual author(s) and contributor(s) and not of MDPI and/or the editor(s). MDPI and/or the editor(s) disclaim responsibility for any injury to people or property resulting from any ideas, methods, instructions or products referred to in the content. |
© 2025 by the authors. Licensee MDPI, Basel, Switzerland. This article is an open access article distributed under the terms and conditions of the Creative Commons Attribution (CC BY) license (https://creativecommons.org/licenses/by/4.0/).