1. Introduction
Forests, covering approximately 31% of the global land area and storing an estimated 296 billion tons of carbon, serve as vital habitats for terrestrial organisms worldwide [
1]. The ecological services provided by forests play a crucial role in human well-being [
2]. Despite forests’ crucial ecological significance, wood-based products remain the primary income source for the forestry sector. In 2022, global forest product exports amounted to
$576 billion, with paper and paper products, pulp and recovered paper, wood and wood products, and wooden furniture accounting for 95% of the total exports [
1]. The continuous expansion of the forestry industry has been pushing up the demand for wood, leading to significant increases in forest harvesting. Global timber production reached 4 billion cubic meters in 2022, a 13% increase from that in 1990. In addition, projections indicate that the harvest volume may increase by 6%–32% by 2050 [
3], making logging a significant contributor to forest area reduction. As forests are crucial for human livelihood, it is essential to deal with the relationship between the development of the forestry industry and forest resources. Therefore, the question of how to utilize forest resources in a manner that enhances both their quantity and quality becomes a pivotal challenge for realizing the coordinated development of forestry industry development and forest resources.
To address the issue, previous studies have proposed the “forest transition” theory to explain the relationship between economic development and forest resources [
4,
5]. The “forest transition” theory suggests that the observed gradual recovery of forests in certain regions following a decline reflects a Kuznets curve relationship between economic development and forest resources. Initially, the development of agriculture and wood processing industries induces damage to forest resources. Then, the on-going economic transformation and increasing demand for forest ecological products drive reforestation initiatives, contributing to the gradual restoration of forest resources. Rudel et al. (2005) [
6] explains the forming mechanism of the forest transition pathway from the perspectives of economic recovery and forest scarcity. The advancements in agricultural production efficiency and urbanization promote reforestation in agricultural land. Meanwhile, as economic development aggravates the scarcity of forest resources [
7], the emphasis on the economic values of forest land shifts towards the ecological values of forests. In addition, government-mediated forest transitions also play a significant role, with China as a notable success case [
8,
9]. Countries in North America, Europe, and Asia promote forest transition by replacing the production of timber and forest products with imports [
10]. Forest transition is a complex process, influenced by various factors such as conservation policies, human welfare, biophysical conditions, and climate drivers [
11]. Kull et al. (2024) [
12] explored the sustainability challenges of forest transitions in Southeast Asia, emphasizing the significant risks of simplistically equating increased forest area with sustainability, and identified key pitfalls that undermine the sustainability of forest transitions. Neglecting potential pitfalls in forest transition research can lead to unsustainable and unjust policies and programs for forest restoration or tree planting. Thus, the relationship between economic development and forest resources conforms to the Kuznets curve, where forest resources will gradually recover after the economic development level exceeds a specific threshold.
Economic complexity has been widely applied in research on sustainable development [
13,
14], and empirical results show that a significant positive correlation exists between economic complexity and the environment [
15]. The economic complexity approach uses network science and machine learning techniques to explain, predict, and suggest changes in economic structure [
16]. It can track the path of industrial upgrading and transformation in a dynamic manner, where the higher the density of products that are similar to the target products, the higher the likelihood of the formation of comparative advantage in the target products, and the higher the likelihood of industrial upgrading and transformation [
17]. Therefore, economic complexity can be applied to depict the ecological and environmental effects triggered by industrial transformation. Romero and Gramkow (2021) [
14] found that a 0.1 increase in economic complexity can lead to a 0.2% decrease in carbon emissions per
$100 million of output. Doğan et al. (2019) [
18] found that the relationship between economic complexity and the environment follows the Kuznets curve, exhibiting an inverted U-shaped pattern where pollution first increases and then decreases. Thus, economic complexity reflects the overall macro development status of a region or industry while also describing the dynamic changes in industrial transformation paths at the micro level.
The forest transition theory primarily elucidates the dynamic relationship between economic development and forest resources, but pays less attention to the impact of the forestry industry development, which relies heavily on wood as a raw material, on forest resources. Forest harvesting that is induced by forestry industry development is a significant contributor to the decline of forest resources [
1]. However, although the forest harvesting volumes and output values are high in the forestry industries of countries like the United States and Canada, the forest resources in these countries exhibit an increasing trend. This phenomenon indicates that the relationship between the development of the forestry industry and forest resources also aligns with the forest transition theory. Economic complexity offers a powerful means of clarifying the relationship between the development of the forestry industry and the sustainability of forest resources. It can be utilized to gauge the development status of the forestry industry and to elucidate its impact on forest resources. Furthermore, economic complexity captures the dynamic changes in industrial transformation pathways through complex networks, explaining the causes of the relationship between industrial development and forest resources from a micro perspective.
Therefore, this study examines whether the development of the forestry industry aligns with the sustainability of forest resources from the perspective of economic complexity, and utilizes the product space to elucidate the reasons underlying the relationship between forestry industry development and forest resource sustainability. The marginal contribution of this study lies in the following aspects. Unlike aggregate indicators such as output values, economic complexity can not only depict the state of industrial development at the macro level, but also reflect its characteristics at the micro levels. Thus, we employ economic complexity to investigate the relationship between forestry industry development and forest resource sustainability. We further elucidate how changes in product space characteristics influence this relationship from a micro perspective, providing empirical evidence for the formulation of a more feasible and effective transformation path to foster coordinated development between forestry industrial development and forest resources. The rest of this paper is structured as follows:
Section 2 demonstrates the research hypothesis based on product space.
Section 3 introduces the calculation method of economic complexity and the models examining the impact of forestry industry complexity on forest resource sustainability.
Section 4 describes the sources and processing methods of data.
Section 5 presents the empirical results and associated discussion. Finally,
Section 6 summarizes the conclusions of the study.
2. Hypothesis
Achieving sustainable development necessitates a comprehensive consideration of various economic, social, and environmental factors. However, the inherent multiplicity of these factors presents significant challenges in terms of quantification and comparison [
19]. Economic complexity offers a robust solution to this challenge. It does not attempt to identify the individual factors but utilizes data on the geographic distribution of economic activities to infer the overall productive capacities of economies, uncovering both abstract production factors and the way that these factors combine into outputs [
13]. In the framework of economic complexity, product is regarded as the carrier of productive capacities. The diversity and complexity of a country’s competitive product portfolio are interpreted as indicators of its economic complexity [
20]. The underlying rationale is that countries with limited productive knowledge tend to produce and export a narrow range of relatively unsophisticated products, thereby occupying lower levels of global competition [
21]. In contrast, more competitive economies leverage their expertise and resources to expand and diversify their export portfolios, thereby achieving higher levels of economic complexity and competitiveness. Thus, by investigating the country–product bipartite network, or, in other words, the product space, economic complexity can reflect the constellation of knowledge and capabilities possessed by an economy or region, as well as the characteristics of specialization in utilizing this knowledge and these capabilities [
22]. Unlike traditional approaches that either aggregate outputs or construct predefined production functions based on factors like capital, labor and knowledge, the economic complexity method uncovers the knowledge and capability traits of a country or industry through the distribution characteristics of comparative advantages in the product space, thereby inferring development trends [
23]. Consequently, economic complexity possesses accurate predictive power for GDP, mirroring the development level of an economy.
Within the forestry sector context, economic complexity analysis can provide dual analytical advantages, proving both macro-level assessment of industrial development status and micro-level characterization of comparative advantage distribution within the product space. The derived spatial patterns can reveal critical input–output interdependencies between forestry industry operations and natural resource bases, providing an insightful analytical framework for investigating sustainability dynamics in resource utilization. Given its capacity to capture both structural characteristics and developmental potentials, we adopt economic complexity metrics rather than conventional forestry output values to measure the development status of the forestry industry (hereinafter referred to as forestry industry complexity).
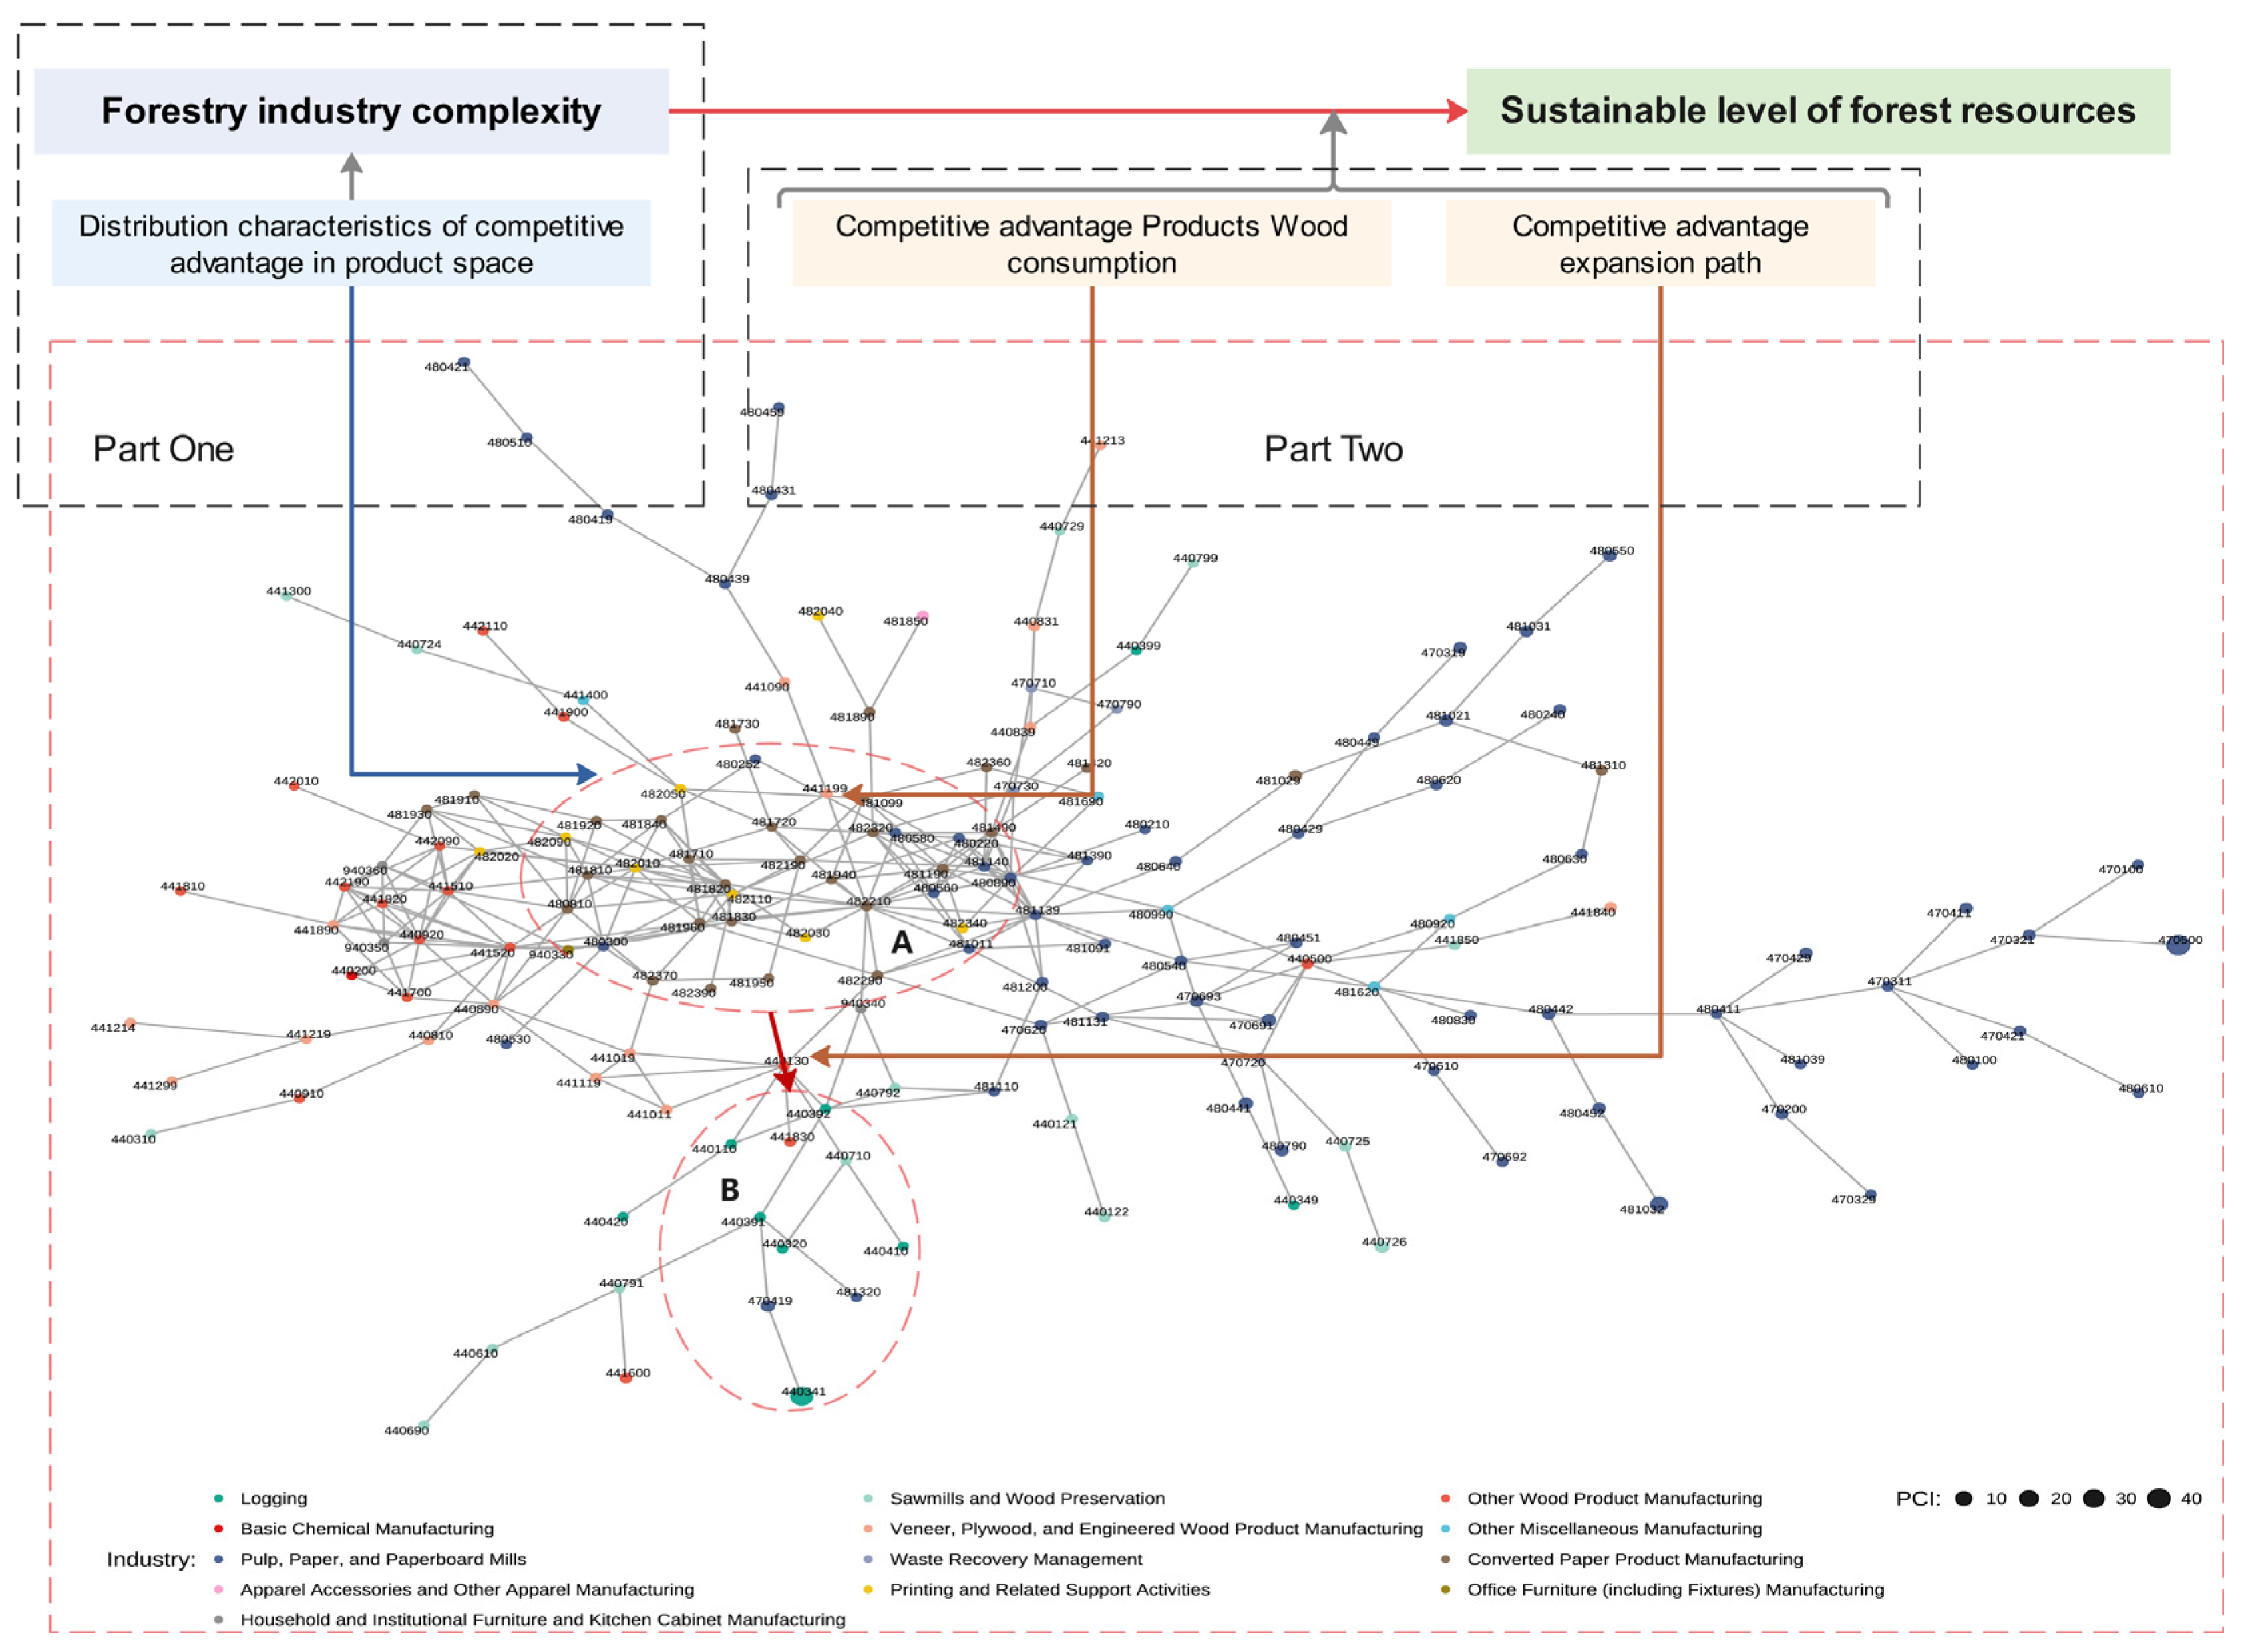
Figure 1 demonstrates how the product space framework reflects the dynamic coupling mechanisms between forestry industry complexity and forest resources sustainability, which elucidates the causal pathways through which forestry industry development impacts forest resources sustainability. The lower panel of
Figure 1 presents a bipartite product space network embedding 166 principal forest commodities, constructed based on a weighted network analysis framework [
24]. In the product space network, the size of the nodes reflects the complexity of the products, and the connections between nodes indicate the relatedness between products, which represents the similarity of the knowledge, technologies, and capabilities required for these products. In theory, the relatedness between products can arise from various factors, including labor intensity, capital and land requirements, technological sophistication, value chain inputs and outputs, or specific institutions. Traditional perspectives often presuppose that factors such as production inputs, technological advancement, or institutional quality exhibit minimal specificity. In contrast, Hidalgo et al. (2007) [
24] adopt an agnostic, outcomes-based approach to measuring product relatedness. The intuition behind the approach is that if two goods are related, they are likely to necessitate similar institutions, infrastructure, physical factors, technological capabilities, or a combination thereof. Thus, such goods are typically produced together, while goods that lack such relatedness are less likely to be produced simultaneously. Thus, a country’s capacity to produce a given product is contingent upon its ability to produce related products.
Suppose that area A in the product space network depicted in
Figure 1 represents the distribution of existing comparative advantages of the country’s forestry industry, while area B denotes the target products into which the forestry industry could potentially expand. The complexity level of products with comparative advantages in area A determines the overall complexity level of the forestry industry, while the input–output relationship between these products and timber determines the impact of forestry industry development on the sustainability of forest resources. If the comparative advantage of the forestry industry expands from area A to area B, it will induce a structural reconfiguration of the sector’s complexity level and affect the sustainability level of forest resources. Thus, the impact of forestry industry development on forest resource sustainability is reflected as the spatiotemporal transitions of forestry industrial complexity within the product space.
The characteristics of the expansion path of the forestry industry’s comparative advantage from area A to area B within the product space determine the relationship between forestry industry complexity and forest resources sustainability. If the comparative advantages of a country’s forestry industry concentrate on labor-intensive products that primarily use hardwood as raw materials, such as office furniture, household and institutional furniture, kitchen cabinets, and other fixtures, then development in its forestry industry will inevitably lead to significant consumption of forest resources. This situation has formed a negative correlation between forestry industry development and forest resource sustainability. Conversely, if the comparative advantages center on forest products with fast-growing trees as major raw materials, such as pulp, paper and paperboard, then the forestry industry can achieve coordinated development with forest resources by promoting the cultivation of fast-growing tree species. This situation has formed a positive correlation between forestry industry development and forest resource sustainability.
If a country’s forestry industry initially has a comparative advantage primarily in labor-intensive wood processing sectors, there will be an incentive to expand into forest resource cultivation, harvesting, and transportation to ensure a stable supply of raw materials and enhance industrial competitiveness. This expansion of comparative advantages gradually transforms the relationship between forestry industry development and forest resources from opposition to coordination. As a result, the forestry industry of a country, whose initial comparative advantage predominantly stems from labor-intensive wood processing sectors, tends to expand into upstream sectors such as forest resource cultivation, harvesting, and transportation, to ensure the stable supply of raw material and enhance industrial competitiveness, thereby forming an expansion pathway analogous to the transition from area A to area B in
Figure 1. This dynamic path consequently establishes an inverted U-shaped relationship between forestry industrial development and forest resource sustainability.
Therefore, formation of an inverted U-shaped relationship between the forestry industry and forest resources is influenced by both the distribution characteristics of comparative advantages and the cultivation cycle of forest resources, making it difficult to observe a complete Kuznets curve with limited samples. The expansion of industrial comparative advantages prompts the forestry industry to expand from labor-intensive wood processing to forest resource cultivation, harvesting, and transportation activities, which enhances the sustainability of forest resources, thereby forming an inverted U-shaped trend. The correlation between existing comparative advantages and the industries related to forest cultivation, harvesting, and transportation and the complexity of target products determine the expansion path of comparative advantages [
23]. When the correlation between the two is high and the complexity of target products is low, the transition of the forestry industry from area A to area B in
Figure 1 is more easily accessible. Because increasing investments in the forest cultivation related industries can facilitate sustainable forest resource utilization and reduce unordered destruction of resources. Conversely, when these conditions are not met, the transition from area A to area B is difficult for the forestry industry. As products with high correlation and low complexity are easier to gain comparative advantages [
25] and because the long cultivation cycle of forest resources increases business risks and costs, the forestry industry is more prone to falling into “traps” during expansion, hindering the formation of an inverted U-shaped trend in the relationship between forestry industry development and forest resource sustainability. Based on the above research perspectives, the following hypotheses are proposed: Firstly, the development of the forestry industry promotes the sustainability of forest resources, indicating a significant positive correlation between the two, and overall, this contributes to providing stable timber resources for the forestry industry and achieving sustainable forest resource use. Secondly, the relationship between the forestry industry and forest resource sustainability varies significantly among countries and is determined by the product space distribution characteristics of each country’s forestry industry.
5. Results and Discussion
This section estimates the relationship equation between ECI and RP using a panel data model (Equation (9)). It examines whether an increase in the complexity of the forestry industry contributes to the sustainability of forest resources. Taking Canada and China as examples, it explains the differences in the impact of different product space structures on forest resource sustainability.
5.1. Empirical Results on the Impact of Forestry Industry Complexity on Forest Resource Sustainability
This study estimates Equation (9) using a fixed-effects panel data model. Model 1 is a country-specific and time-fixed effects model without control variables. Model 2 includes all control variables and country-specific and time-fixed effects. Model 3 adds a dummy variable for country income levels to Model 2 to test the robustness of the ECI coefficient across countries with different income levels. Model 4 allows the ECI coefficient to vary over time in Model 2 in order to test its robustness over time. The regression results are generally consistent with the hypotheses, and the models have good significance levels, with little overall variability in the coefficients among the four models (
Table 1). In Models 1 and 2, the elasticity coefficient of ECI to RP is significantly positive at the 5% level, with a slight decrease in the ECI elasticity coefficient after adding control variables. Per capita GDP is not significantly different from 0 at the 5% level in Models 2–4. The elasticity coefficient of population to forest resource sustainability is negative in Models 2–4, but only significant at the 5% level in Models 2 and 3. The impact of agriculture’s share on forest resource sustainability has negative elasticity coefficients in Models 2–4, with little difference between them, but the coefficient in Model 3 is not significant at the 5% level. Urbanization has a significant positive impact on forest resource sustainability at the 1% significance level in Models 2–4. The dependence on imported timber has a negative impact on forest sustainability at the 1% significance level.
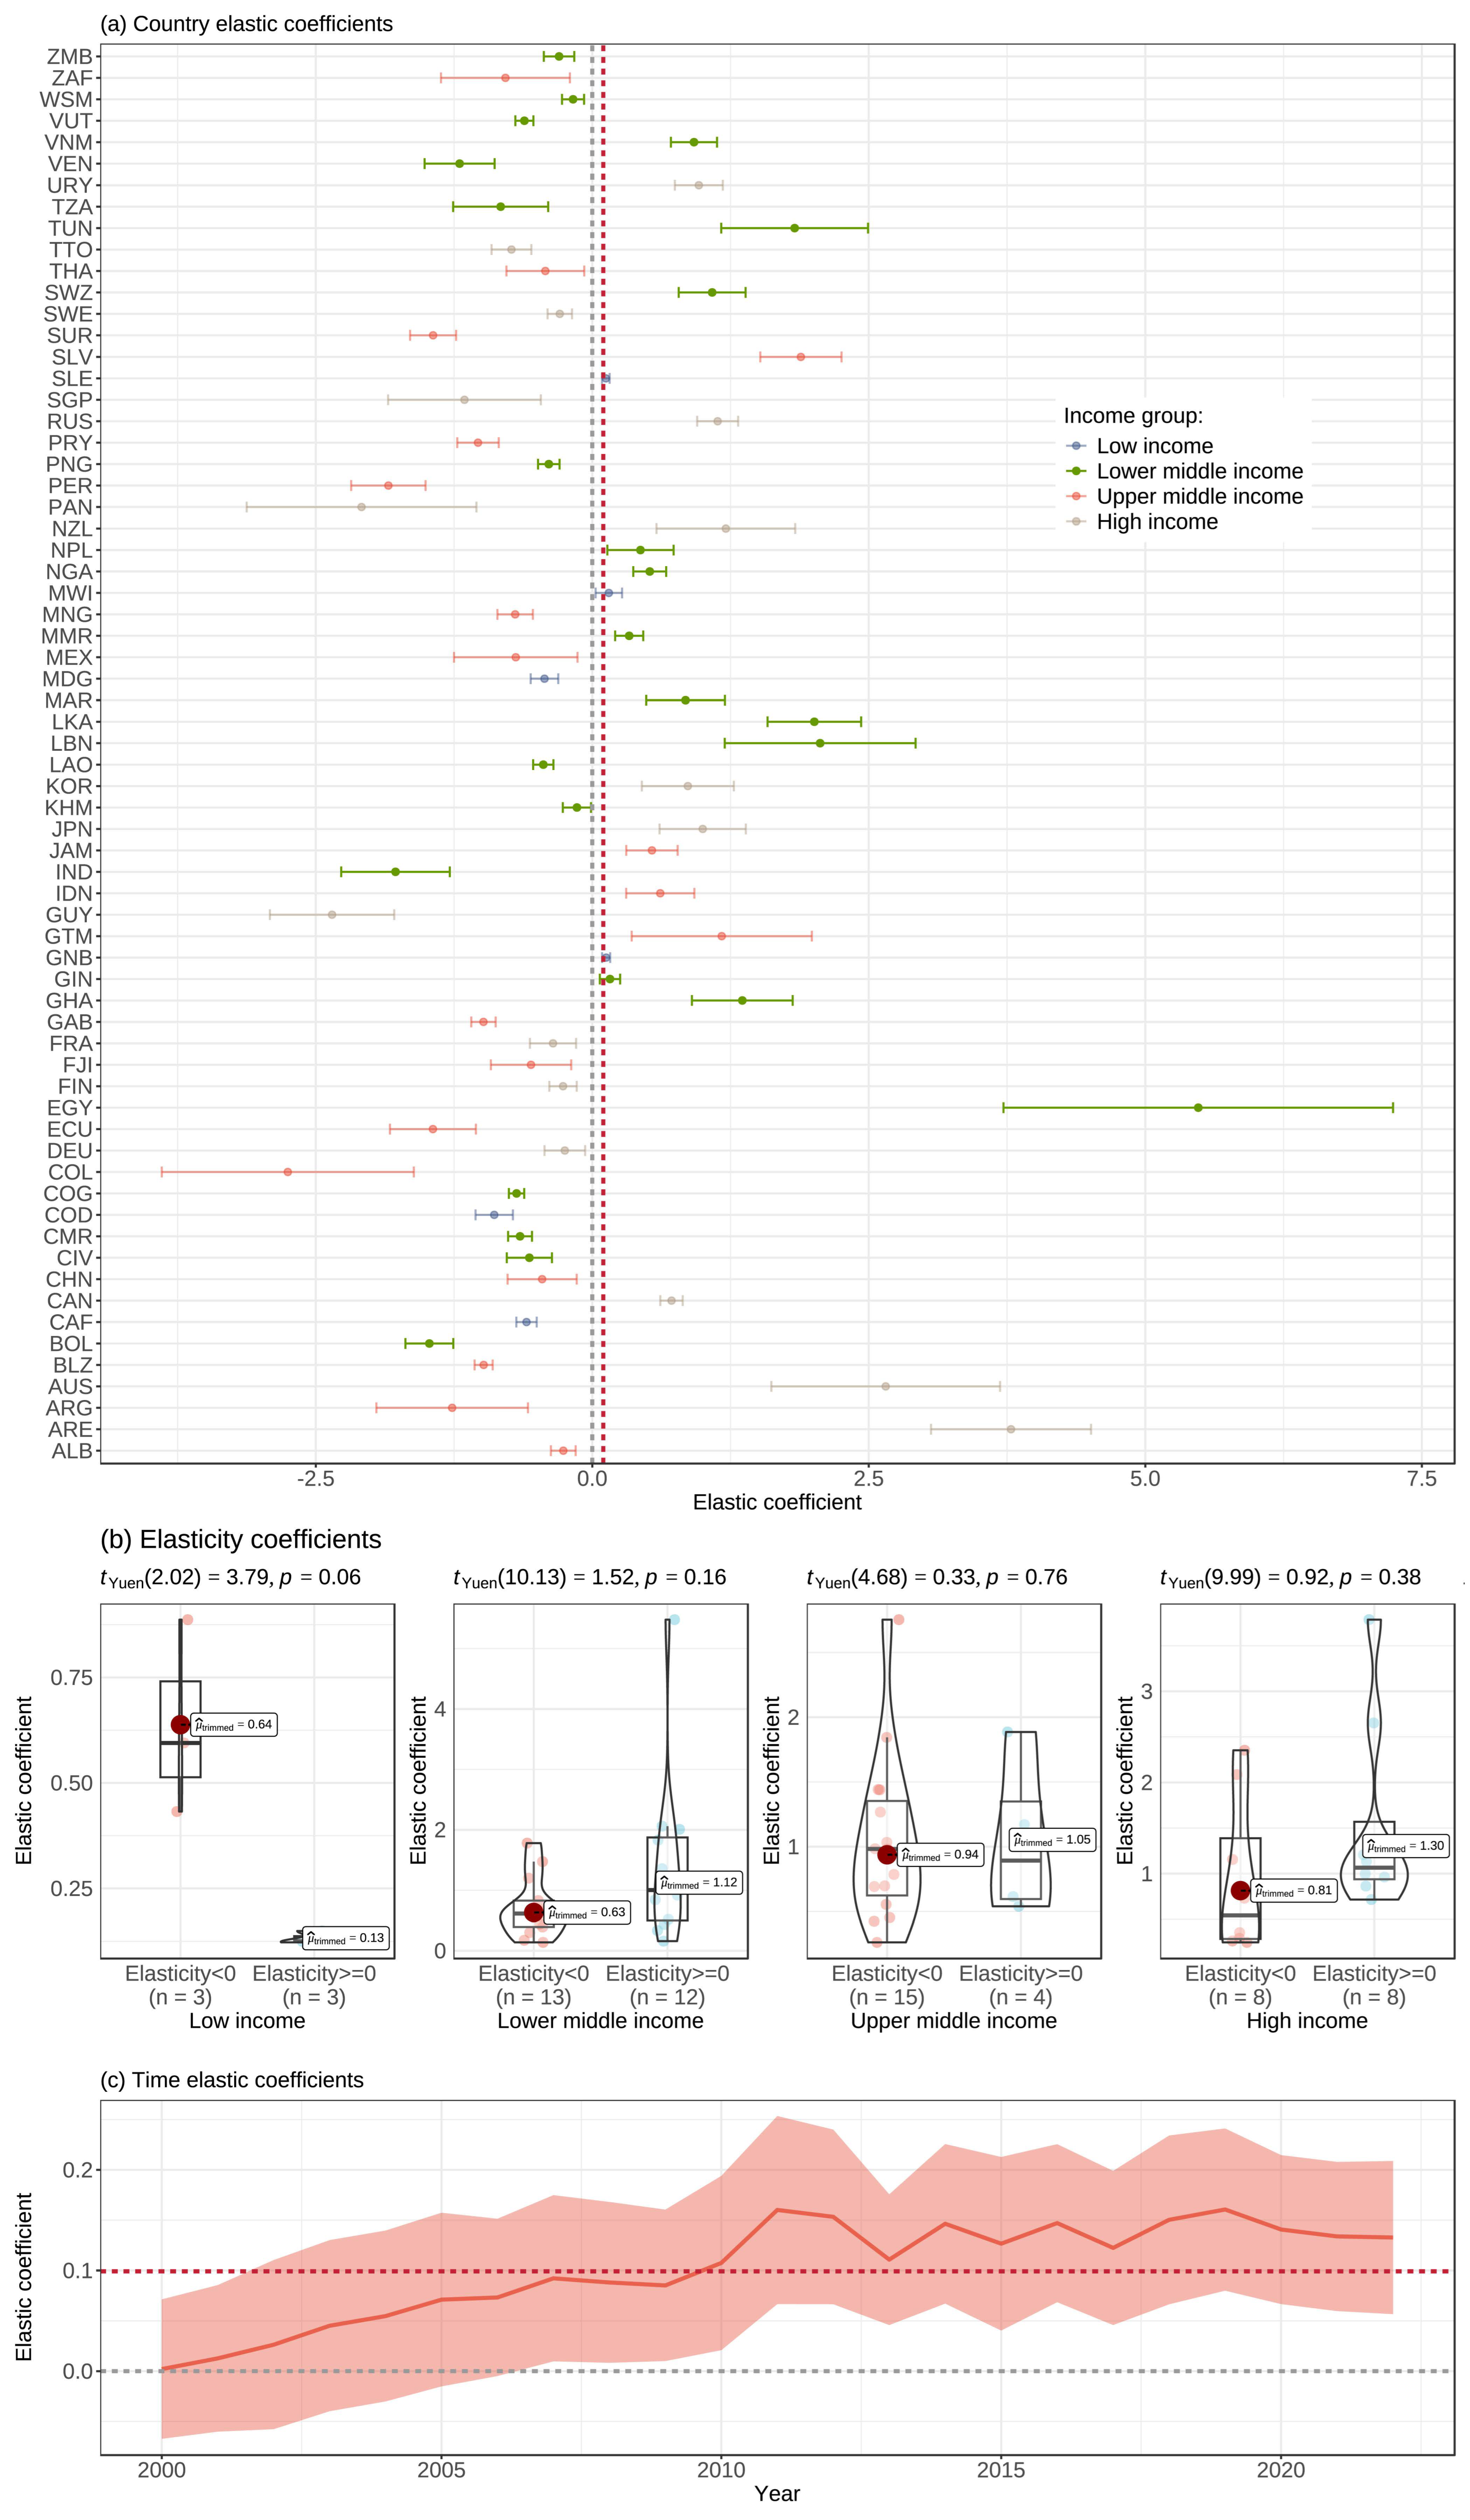
To test the robustness of the impact of ECI on RP, this study analyzes the variability of the ECI elasticity coefficient across different income levels. By adding interaction terms between ECI and dummy variables for country income levels to the model, this study examines the differences in the ECI elasticity coefficient for RP across countries with different income levels. Using low-income countries as the baseline, this study compares the ECI elasticity coefficients of other income groups. The Wald test results indicate significant differences in the ECI elasticity coefficients among the four income groups at the 1% level. The elasticity coefficient for low-income countries is −0.2012 and is significantly different from 0 at the 5% level. The cross-term coefficient for lower-middle-income countries is not significantly different from that of low-income countries, indicating that a 1% increase in ECI in both groups would result in a 0.2012% decrease in RP. The cross-term coefficient for upper-middle-income countries is −0.5417 and significantly different from that of low-income countries at the 1% level, indicating that a 1% increase in ECI in upper-middle-income countries would result in a 0.7429% decrease in RP. The cross-term coefficient for high-income countries is 0.2093 and significantly different from that of low-income countries at the 5% level, indicating that a 1% increase in ECI in high-income countries would result in a 0.0081% increase in RP. These results suggest that the elasticity coefficient of ECI’s impact on RP differs across countries with different income levels. The study constructs a variable coefficient model for the ECI elasticity coefficient across countries. The calculated ECI elasticity coefficients for each country are shown in
Figure 4, excluding countries with elasticity coefficients significant at less than the 5% level. A total of 66 countries have elasticity coefficients significantly different from 0 at the 5% level.
Figure 4a shows the confidence intervals for the elasticity coefficients of each country, revealing significant differences in the ECI elasticity coefficients across countries with different income levels. Furthermore, as illustrated by the dashed red line in
Figure 4a, the elasticity coefficients of each country in Model 2 are evenly distributed around the ECI elasticity coefficient (0.0992), suggesting that the ECI coefficient calculated in Model 2 aligns closely with the average of the country-specific coefficients.
Figure 4b compares the elasticity coefficients across different income levels. The results show that both positive and negative impacts of the ECI elasticity coefficient are significant across countries with different income levels. Among low-income countries, the negative elasticity coefficient is significantly greater than the positive one at the 10% level, while the difference is smaller among other income groups. These results suggest that there are significant differences in the forestry industry structures across countries, and even grouping by income levels may affect the robustness of the coefficients due to intra-group variability. Therefore, the variable coefficient model results better reflect the impact of forestry industry development on forest resource sustainability, and the ECI elasticity coefficient in Model 2 is close to the average of the country-specific elasticity coefficients.
To further test the robustness of the impact of ECI on RP, this study analyzes the variability of the ECI elasticity coefficient over time. A time-varying ECI elasticity coefficient model is constructed, and the regression results are shown in Model 4, which are generally consistent with Model 2.
Figure 4c describes the variability of the ECI elasticity coefficient. Without considering the cross-country differences in the ECI elasticity coefficient, the ECI elasticity coefficient shows a slow upward trend before 2010 and is not significant at the 5% level between 2000 and 2005. After 2005, the trend in the ECI elasticity coefficient stabilizes and is significantly different from 0 at the 5% level. The confidence interval of the time-varying ECI elasticity coefficient includes the elasticity coefficient from Model 2, and the mean of the time-varying ECI elasticity coefficient (0.1019) is very close to the result from Model 2. Therefore, the ECI elasticity coefficient calculated in Model 2 is robust over time.
The regression results concerning the relation between the complexity of the forestry industry and the sustainability of forest resources indicate that, based on the overall sample data, an increase in the complexity of the forestry industry contributes to enhancing the sustainability of forest resources, which aligns with Hypothesis 1. After accounting for income differences among countries, the relationship between the complexity of the forestry industry and the sustainability of forest resources conforms to Hypothesis 2, with significant differences observed among countries. An increase in complexity is manifested in the development of specialized capabilities in high-complexity products by countries or regions. Products with higher levels of forestry industry complexity are concentrated primarily in segments such as pulp, paper, and paperboard mills; other miscellaneous manufacturing; and logging. Pulp, paper, and paperboard mills, as well as various other manufacturing segments, primarily rely on fast-growing trees as their raw materials, while comparative advantages in the logging industry reflect capabilities in sustainable forest management. Therefore, countries with comparative advantages in these segments also exhibit higher levels of forestry industry complexity and forest resource sustainability, resulting in generally positive ECI elasticity coefficients. Conversely, if comparative advantages in the forestry industry are concentrated in wood processing segments, such as office furniture manufacturing, fixtures manufacturing, household and institutional furniture manufacturing, and kitchen cabinet manufacturing—which are predominantly labor-intensive and use hardwood as their raw materials—then the level of complexity in the forestry industry is generally lower. At the same time, the demand for forest resources is higher, which reduces the sustainability of forest resources, leading to negative ECI elasticity coefficients.
Meanwhile, under the pressure of insufficient resource supply and forest certification, the wood processing industry will increase investment in forest resources to achieve sustainable development and ensure stable resource supply for the industry, promoting the sustainable utilization of domestic forest resources. China’s forestry industry serves as a representative of this type. With the development of the wood processing industry, the level of industrial complexity has increased. To meet the industry’s demand for forest resources, timber reserve bases have been established, significantly increasing domestic forest resources and timber supply, and enhancing the sustainability of forest resources. Although China’s ECI elasticity coefficient is currently negative, with increased investment in forest resource cultivation, comparative advantages in high-complexity products involving resources will gradually form, and the elasticity coefficient may turn positive. Therefore, changes in comparative advantages within the forestry industry affect the relation between industrial complexity and the sustainability of forest resources.
5.2. Characteristics of Complexity Changes Based on the Product Space Structure
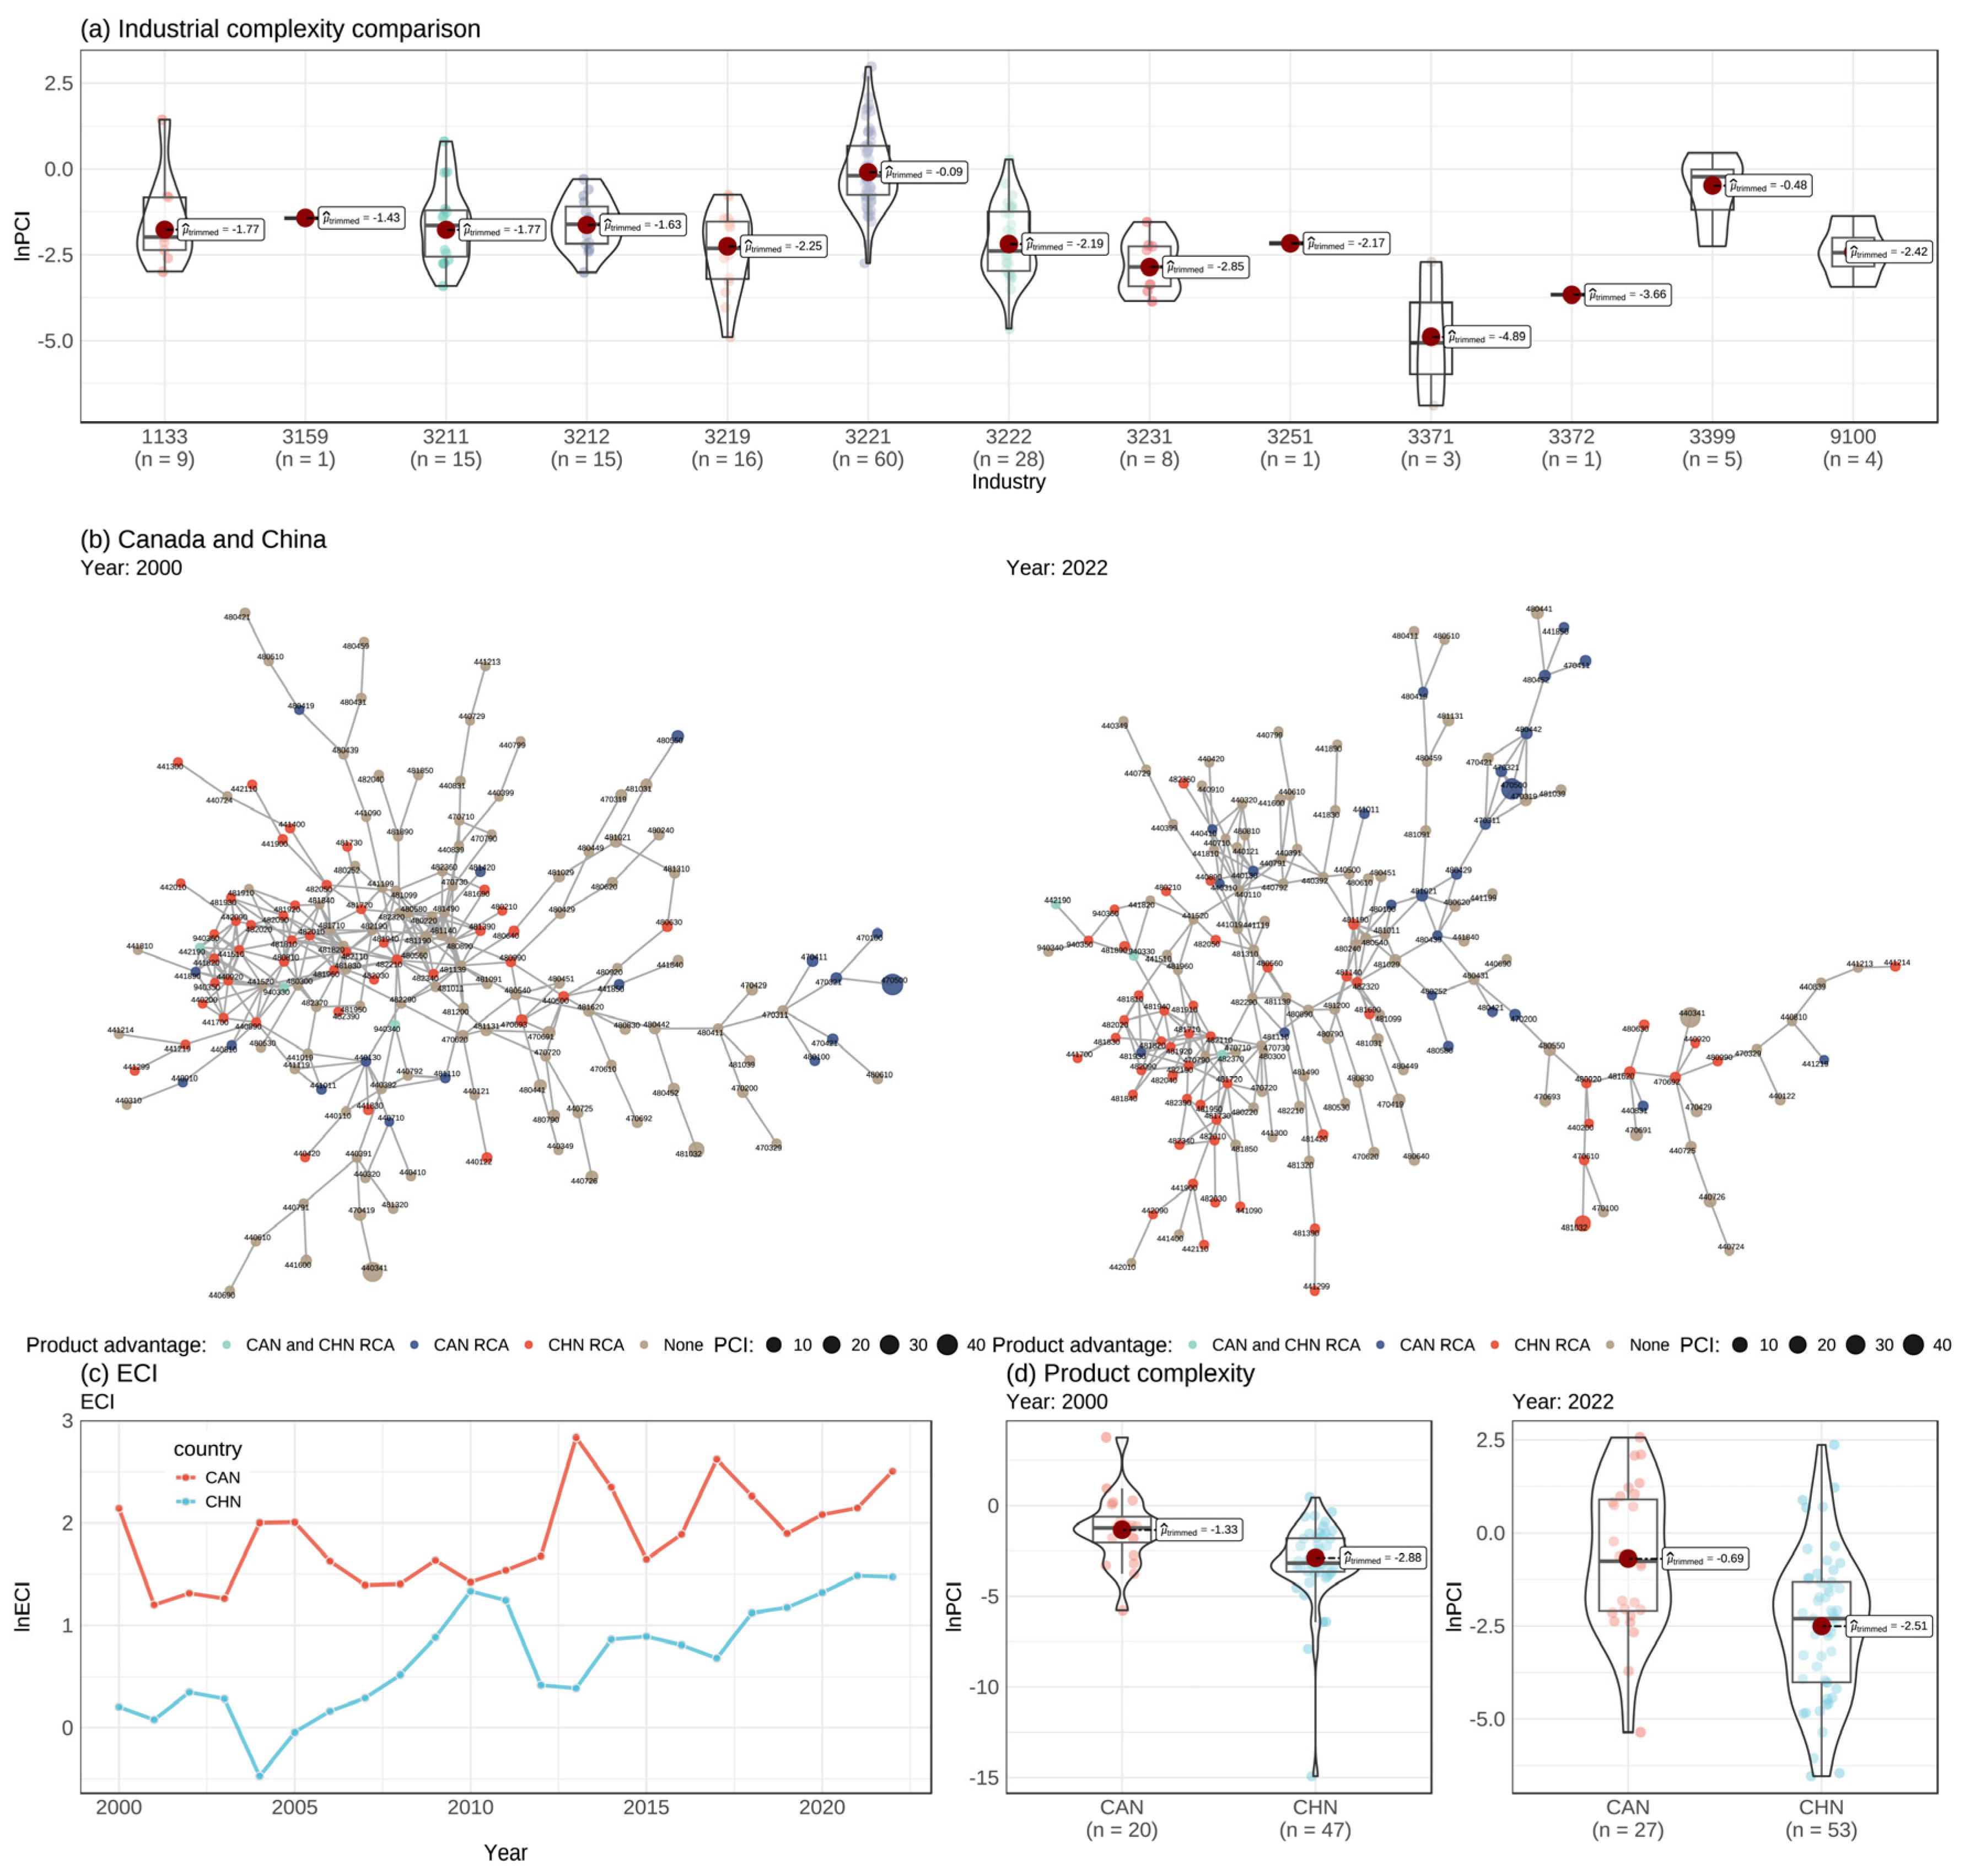
This study first compares the average product complexity of the forestry industry from 2000 to 2022 based on the North American Industry Classification System, as illustrated in
Figure 5a. Specifically, the average PCI for logging (1133) is 0.6394; for apparel accessories and other apparel manufacturing (3159) is 0.2401; for sawmills and wood preservation (3211) is 0.3954; for veneer, plywood, and engineered wood product manufacturing (3212) is 0.2596; for other wood product manufacturing (3219) is 0.1543; for pulp, paper, and paperboard mills (3221) is 2.0697; for converted paper product manufacturing (3222) is 0.2094; for printing and related support activities (3231) is 0.0801; for basic chemical manufacturing (3251) is 0.1147; for household and institutional furniture and kitchen cabinet manufacturing (3371) is 0.0257; for other miscellaneous manufacturing (3399) is 0.7574; and for waste recovery management (9100) is 0.1169.
Figure 5a illustrates that there are significant differences in the complexity levels among different segments within the forestry industry; the variations in comparative advantages among countries within these segments influence the level of complexity in the forestry industry. Furthermore, the varying degrees of wood consumption across different industries affect the sustainability of forest resources.
This study explains the reasons for the differences in ECI elasticity coefficients among countries by comparing the product space structures of countries with positive and negative ECI elasticity coefficients. The study selects two countries, Canada and China, with high levels of complexity and large scales in the forestry industry, as comparison objects. The confidence interval for Canada’s ECI elasticity coefficient is [0.6154, 0.8177], and the confidence interval for China’s ECI elasticity coefficient is [−0.7664, −0.1407].
Figure 5b depicts the distribution characteristics of comparative advantages in the product space for Canada and China. There are significant differences in the distribution characteristics of the product space between Canada and China. China’s comparative advantages in the forestry industry are mainly concentrated in the more central positions of the space (labor-intensive products such as man-made wood-based panels, furniture manufacturing, and other wood processing), while Canada’s comparative advantages are mainly distributed at the periphery of the product space (raw material-based products such as logging and pulp manufacturing). There are only a few products with common advantages between the two countries. In 2000, Canada and China only had three products with comparative advantages in common: HS442190, HS940330, and HS940340. In 2022, the three products with comparative advantages for both countries were HS442190, HS482370, and HS940330. The study also compares the complexity of products with comparative advantages for Canada and China in 2000 and 2022, as shown in
Figure 5d. Although China has more products with comparative advantages than Canada, the average complexity of these products is lower than that of Canada. This result indicates that Canada has more knowledge and capabilities in the areas of resource cultivation and management in the forestry industry, while China only has advantages in labor-intensive areas with relatively low knowledge and capability requirements.
The relationship between the development of the forestry industry and the sustainability level of forest resources is determined by the product space structure and the dynamic evolution of the product space. The comparison of the product space characteristics of the forestry industries in Canada and China shows that the distribution characteristics of products with comparative advantages in the product space determine the level of industrial complexity. Forming comparative advantages in regions where high-complexity products cluster in the product space helps to enhance the overall complexity level of the industry; meanwhile, the input–output relationship between products with comparative advantages and forest resources determines the sustainability level of forest resources. If a country has comparative advantages in high-complexity products that are also friendly to forest resources, then the ECI elasticity coefficient is more likely to be positive, and vice versa. As a country’s comparative advantages in the product space evolve dynamically, according to the law of high-relevance and high-complexity development paths (Hidalgo, 2023) [
23], in order to achieve sustainable development of the forestry industry and ensure stable supply of raw materials, the industry will develop high-complexity products that are friendly to forest resources and gradually enhance the ability to cultivate and utilize forest resources. This dynamic evolution of the path will make the elasticity coefficients of ECI and RP change from negative to positive, achieving a virtuous cycle of forestry industry development and sustainable utilization of forest resources.
6. Conclusions
This study analyzes the relationship between the development of the forestry industry and the sustainability of forest resources from the perspective of economic complexity, and explains how to achieve a positive interaction between industrial development and forest resource sustainability based on the product space structure. In order to assess the development level of the forestry industry in different countries, we calculate the forestry industry complexity of 99 countries based on their export data for 166 forest products. We then calculate the sustainability level of their forest resources based on the ratio of forest stock volume to forest harvesting. Finally, a panel data model is employed to test the relationship between the development of the forestry industry and the sustainability of forest resources, and the reasons for the formation of this relationship are explained from the perspective of product space structure. Overall, the development of the forestry industry significantly promotes the sustainability level of forest resources, but this relationship varies significantly among countries. If a country has comparative advantages in labor-intensive industries such as furniture manufacturing and man-made board processing, its industrial development is not conducive to the sustainable utilization of forest resources. Conversely, in countries that possess a comparative advantage in forest resource management, harvesting, and primary processing, a positive interaction forms between their forestry industry development and forest resource sustainability. The differences in knowledge and capabilities among countries in the product space lead to differences in comparative advantages, which in turn affects the relationship between forestry industry development and forest resources sustainability. Meanwhile, as the industrial development path evolves dynamically from low-complexity, non-resource-sustainable products to high-complexity, resource-sustainable products, the relationship between the development of the forestry industry and the sustainability of forest resources shifts from confrontation to coordination, forming a positive feedback loop of resource cultivation and industrial development. Therefore, countries should tailor their development strategies based on local conditions, selecting feasible pathways according to the distribution characteristics and relatedness of existing industrial comparative advantages. For instance, countries abundant in forest resources, such as Canada, can leverage their current advantages to diversify into high-complexity manufacturing products within the product space, thereby enhancing the overall complexity level of its forestry industries and facilitating a beneficial interaction with forest resources. In contrast, countries with limited forest resources, represented by China, should actively promote afforestation and forest management initiatives based on existing competitive strengths so as to enhance forest resource supply capacity, increase overall industrial complexity, and mitigate resource constraints. Due to data constraints, this study investigates the relationship between forestry industrial complexity and forest resource sustainability primarily from a macro perspective. The circular economy represents a crucial pathway for advancing forestry sustainable development, but methodological constraints persist due to insufficient data on the recycling sector, where only data on recovered paper products are currently available within the product space. To further discuss the promotion of forest resource sustainability in the context of the circular economy, future research should adopt a micro-level perspective within the product space framework to unpack the underlying mechanisms underlying the relationship.


 ,
, 

