
Assessing the Impact of Leasehold Forestry in Nepal: Enhancing Livelihoods and Preventing Degradation

 ,
,  , , , and
Abstract
1. Introduction
2. Materials and Methods
2.1. Research/Analytical Framework
Sustainable Livelihood Framework (SLF)
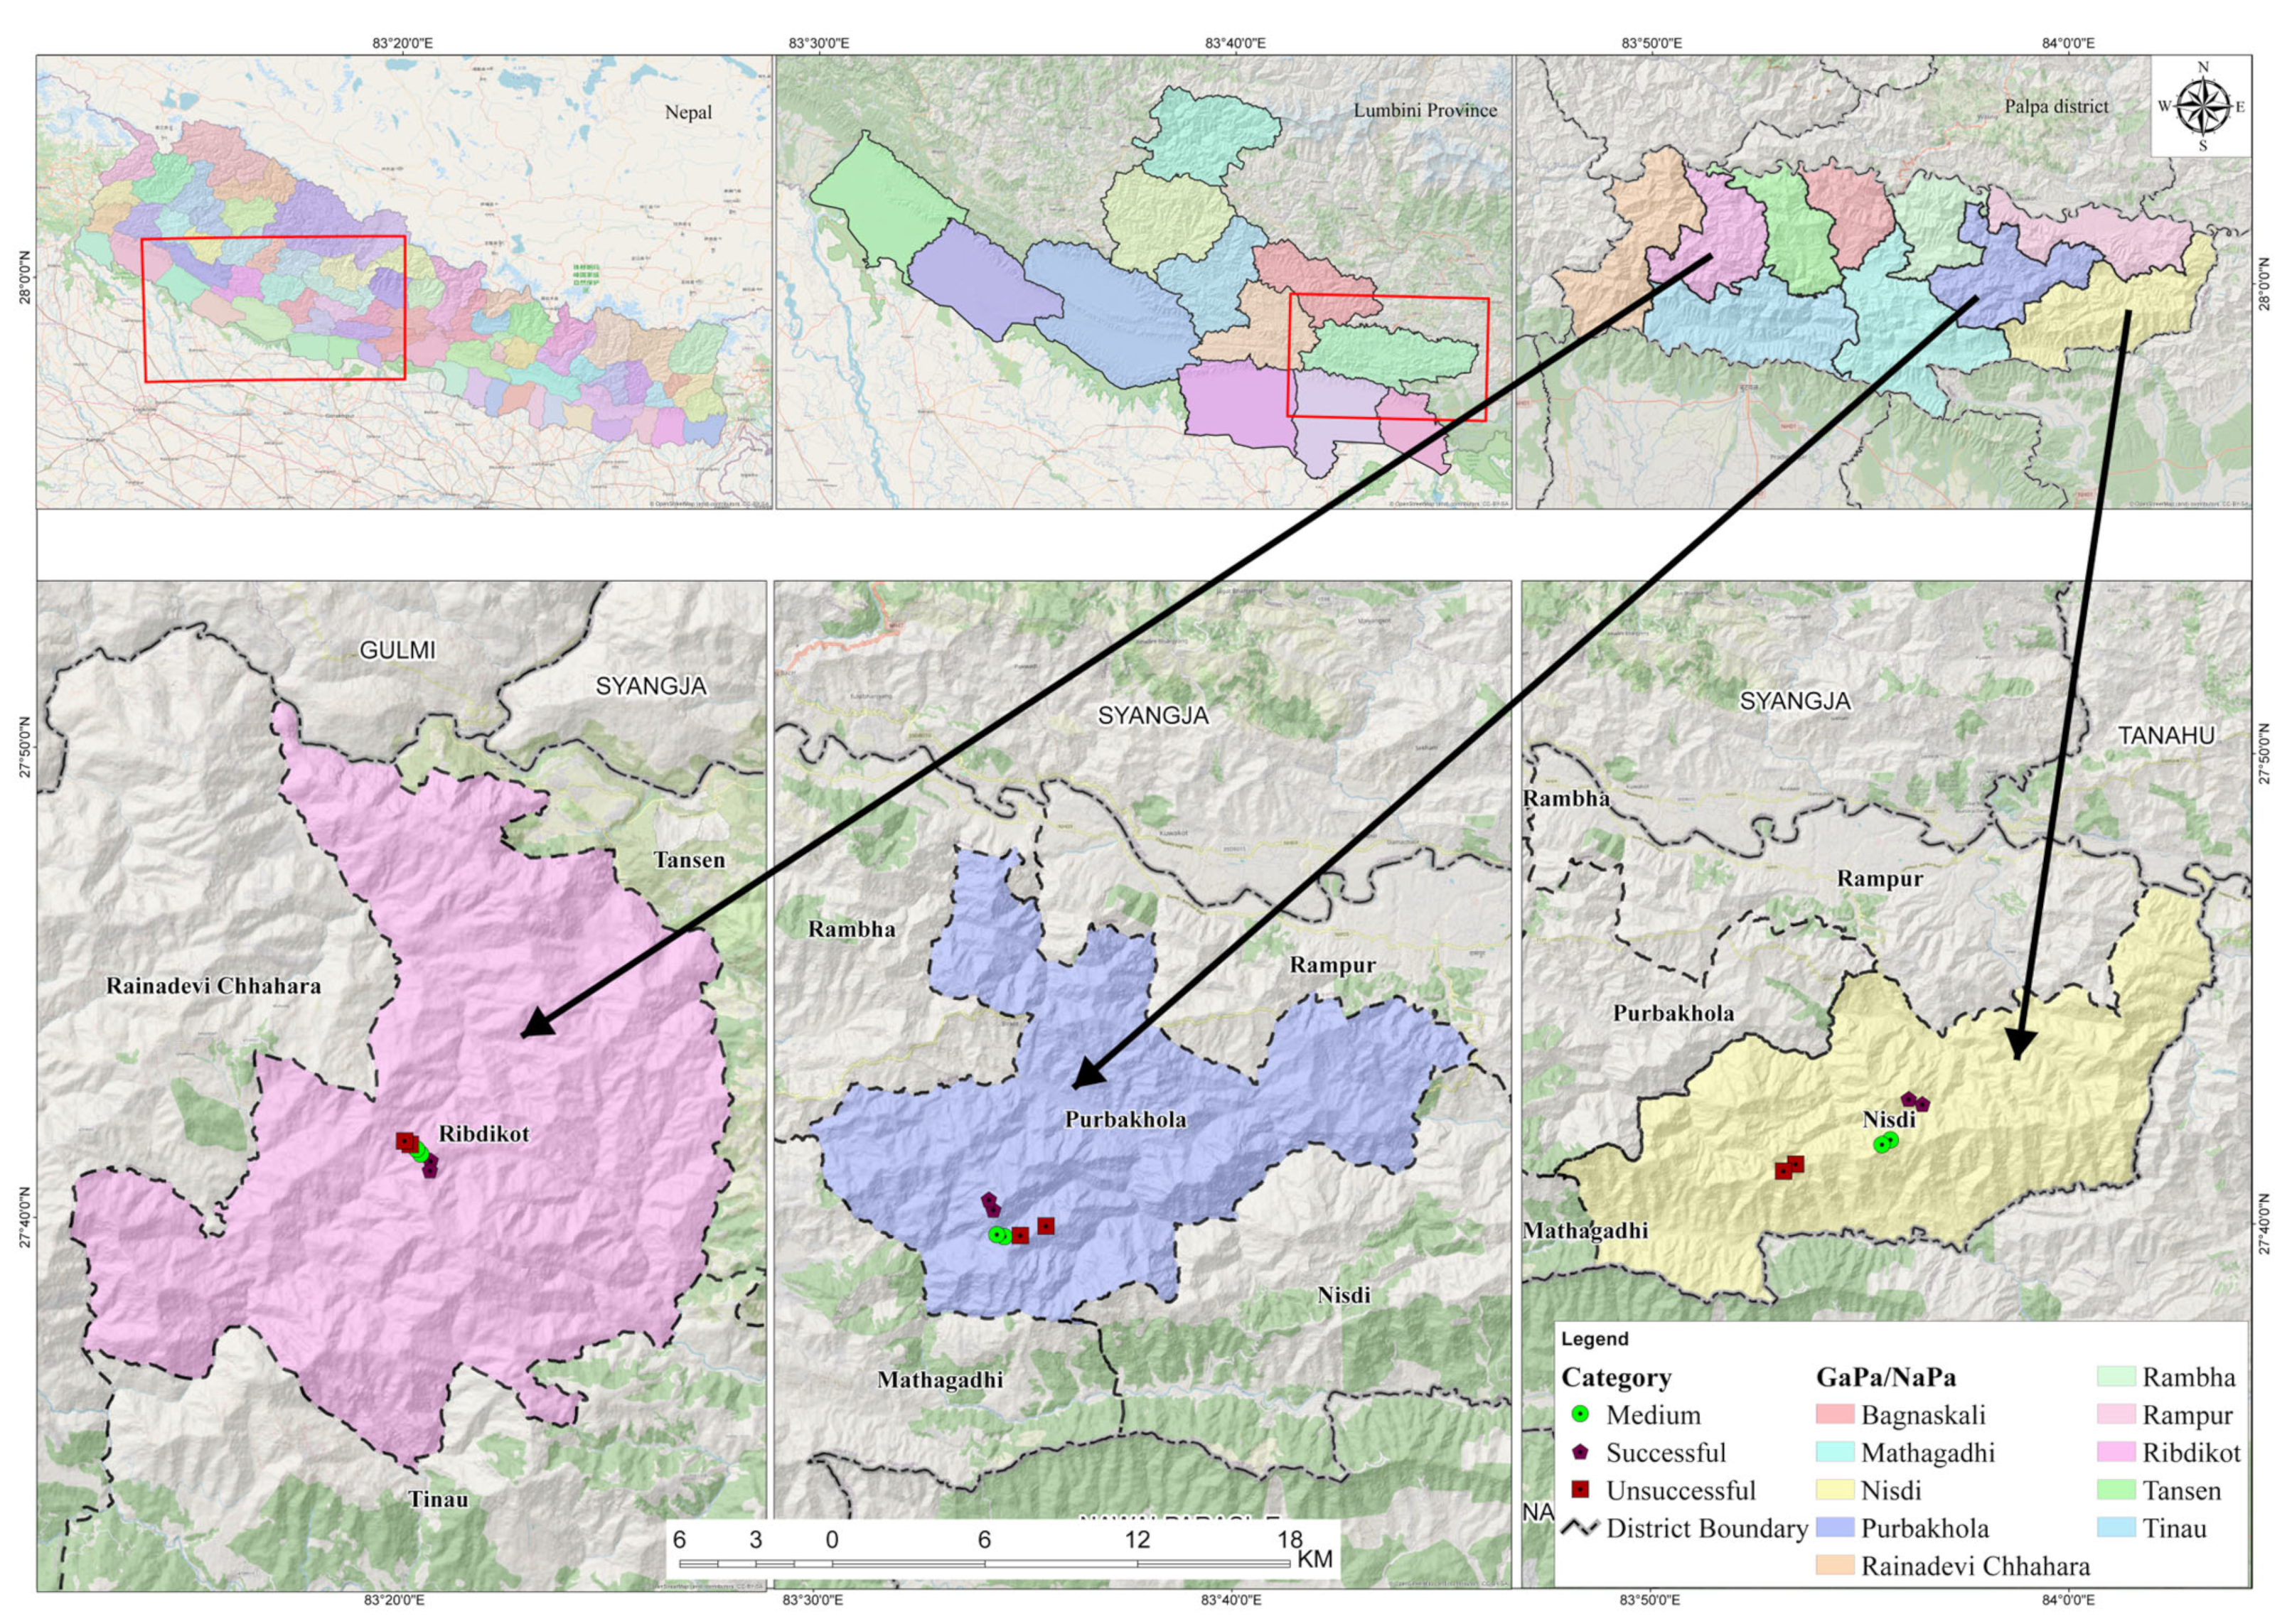
2.2. Study Area
2.3. Data Collection
2.4. Data Analysis
3. Results
3.1. Communities Involved in LFUG
3.2. Status of Leasehold Forest Management
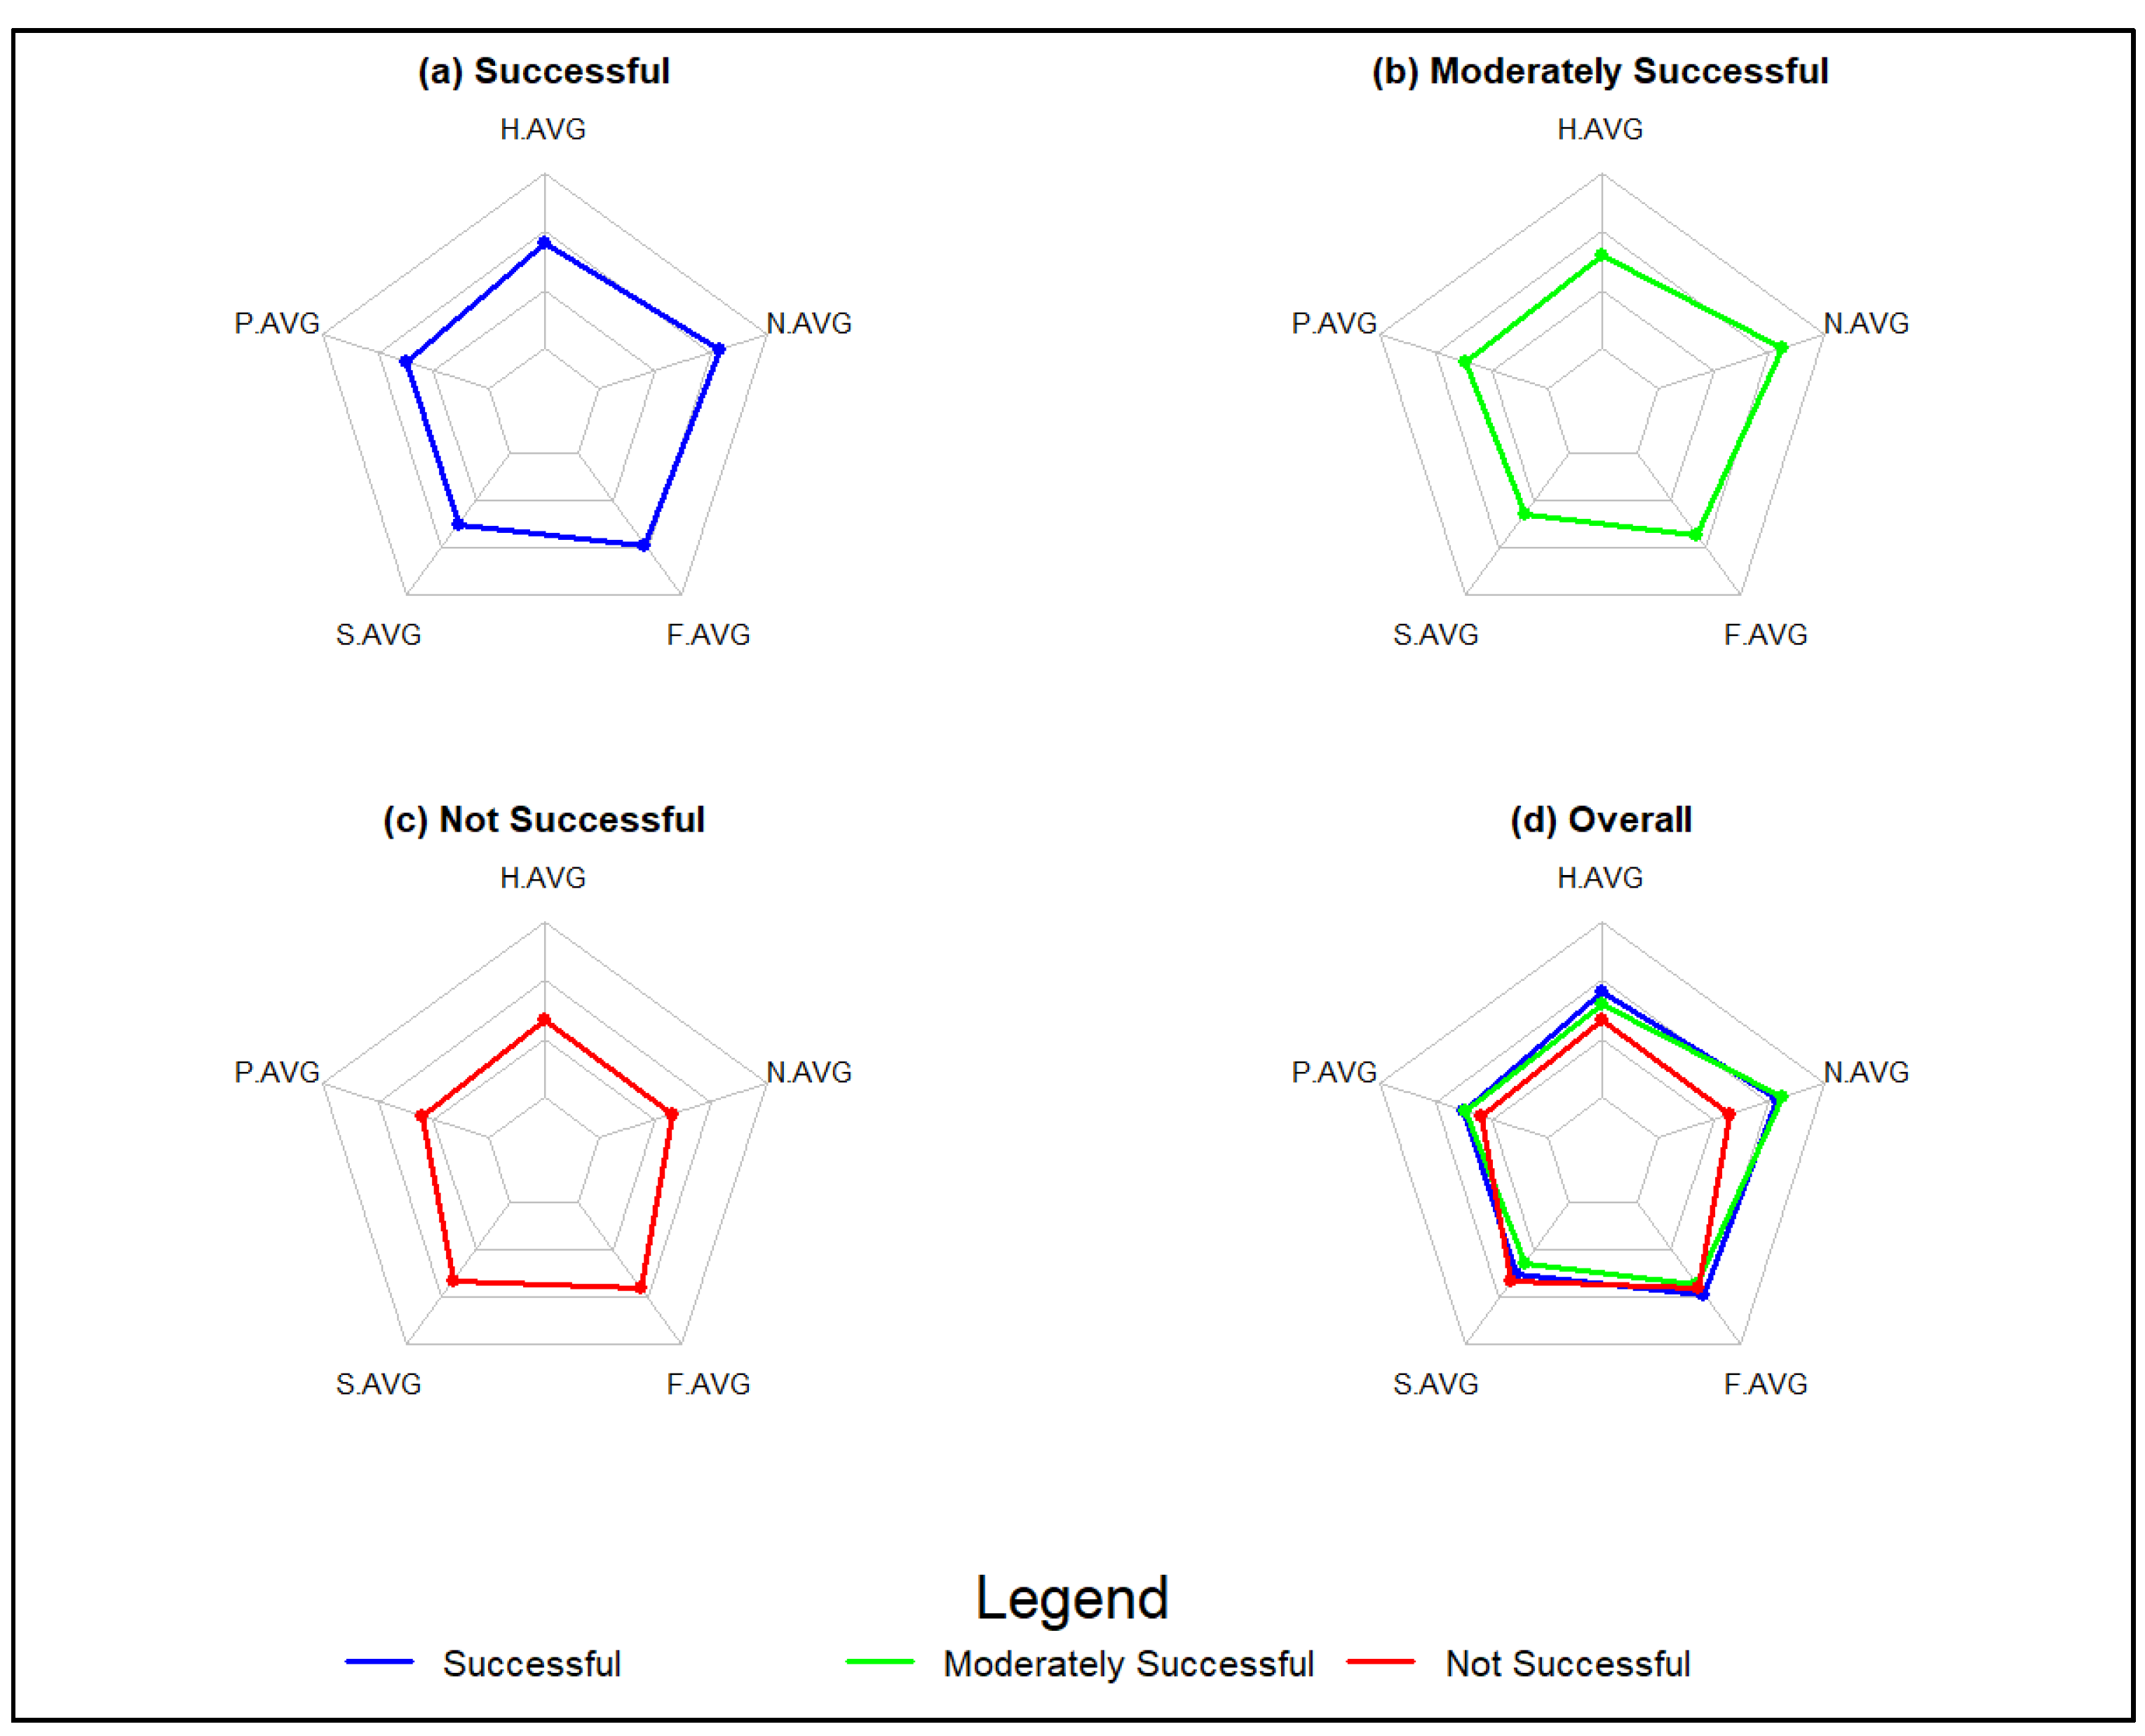
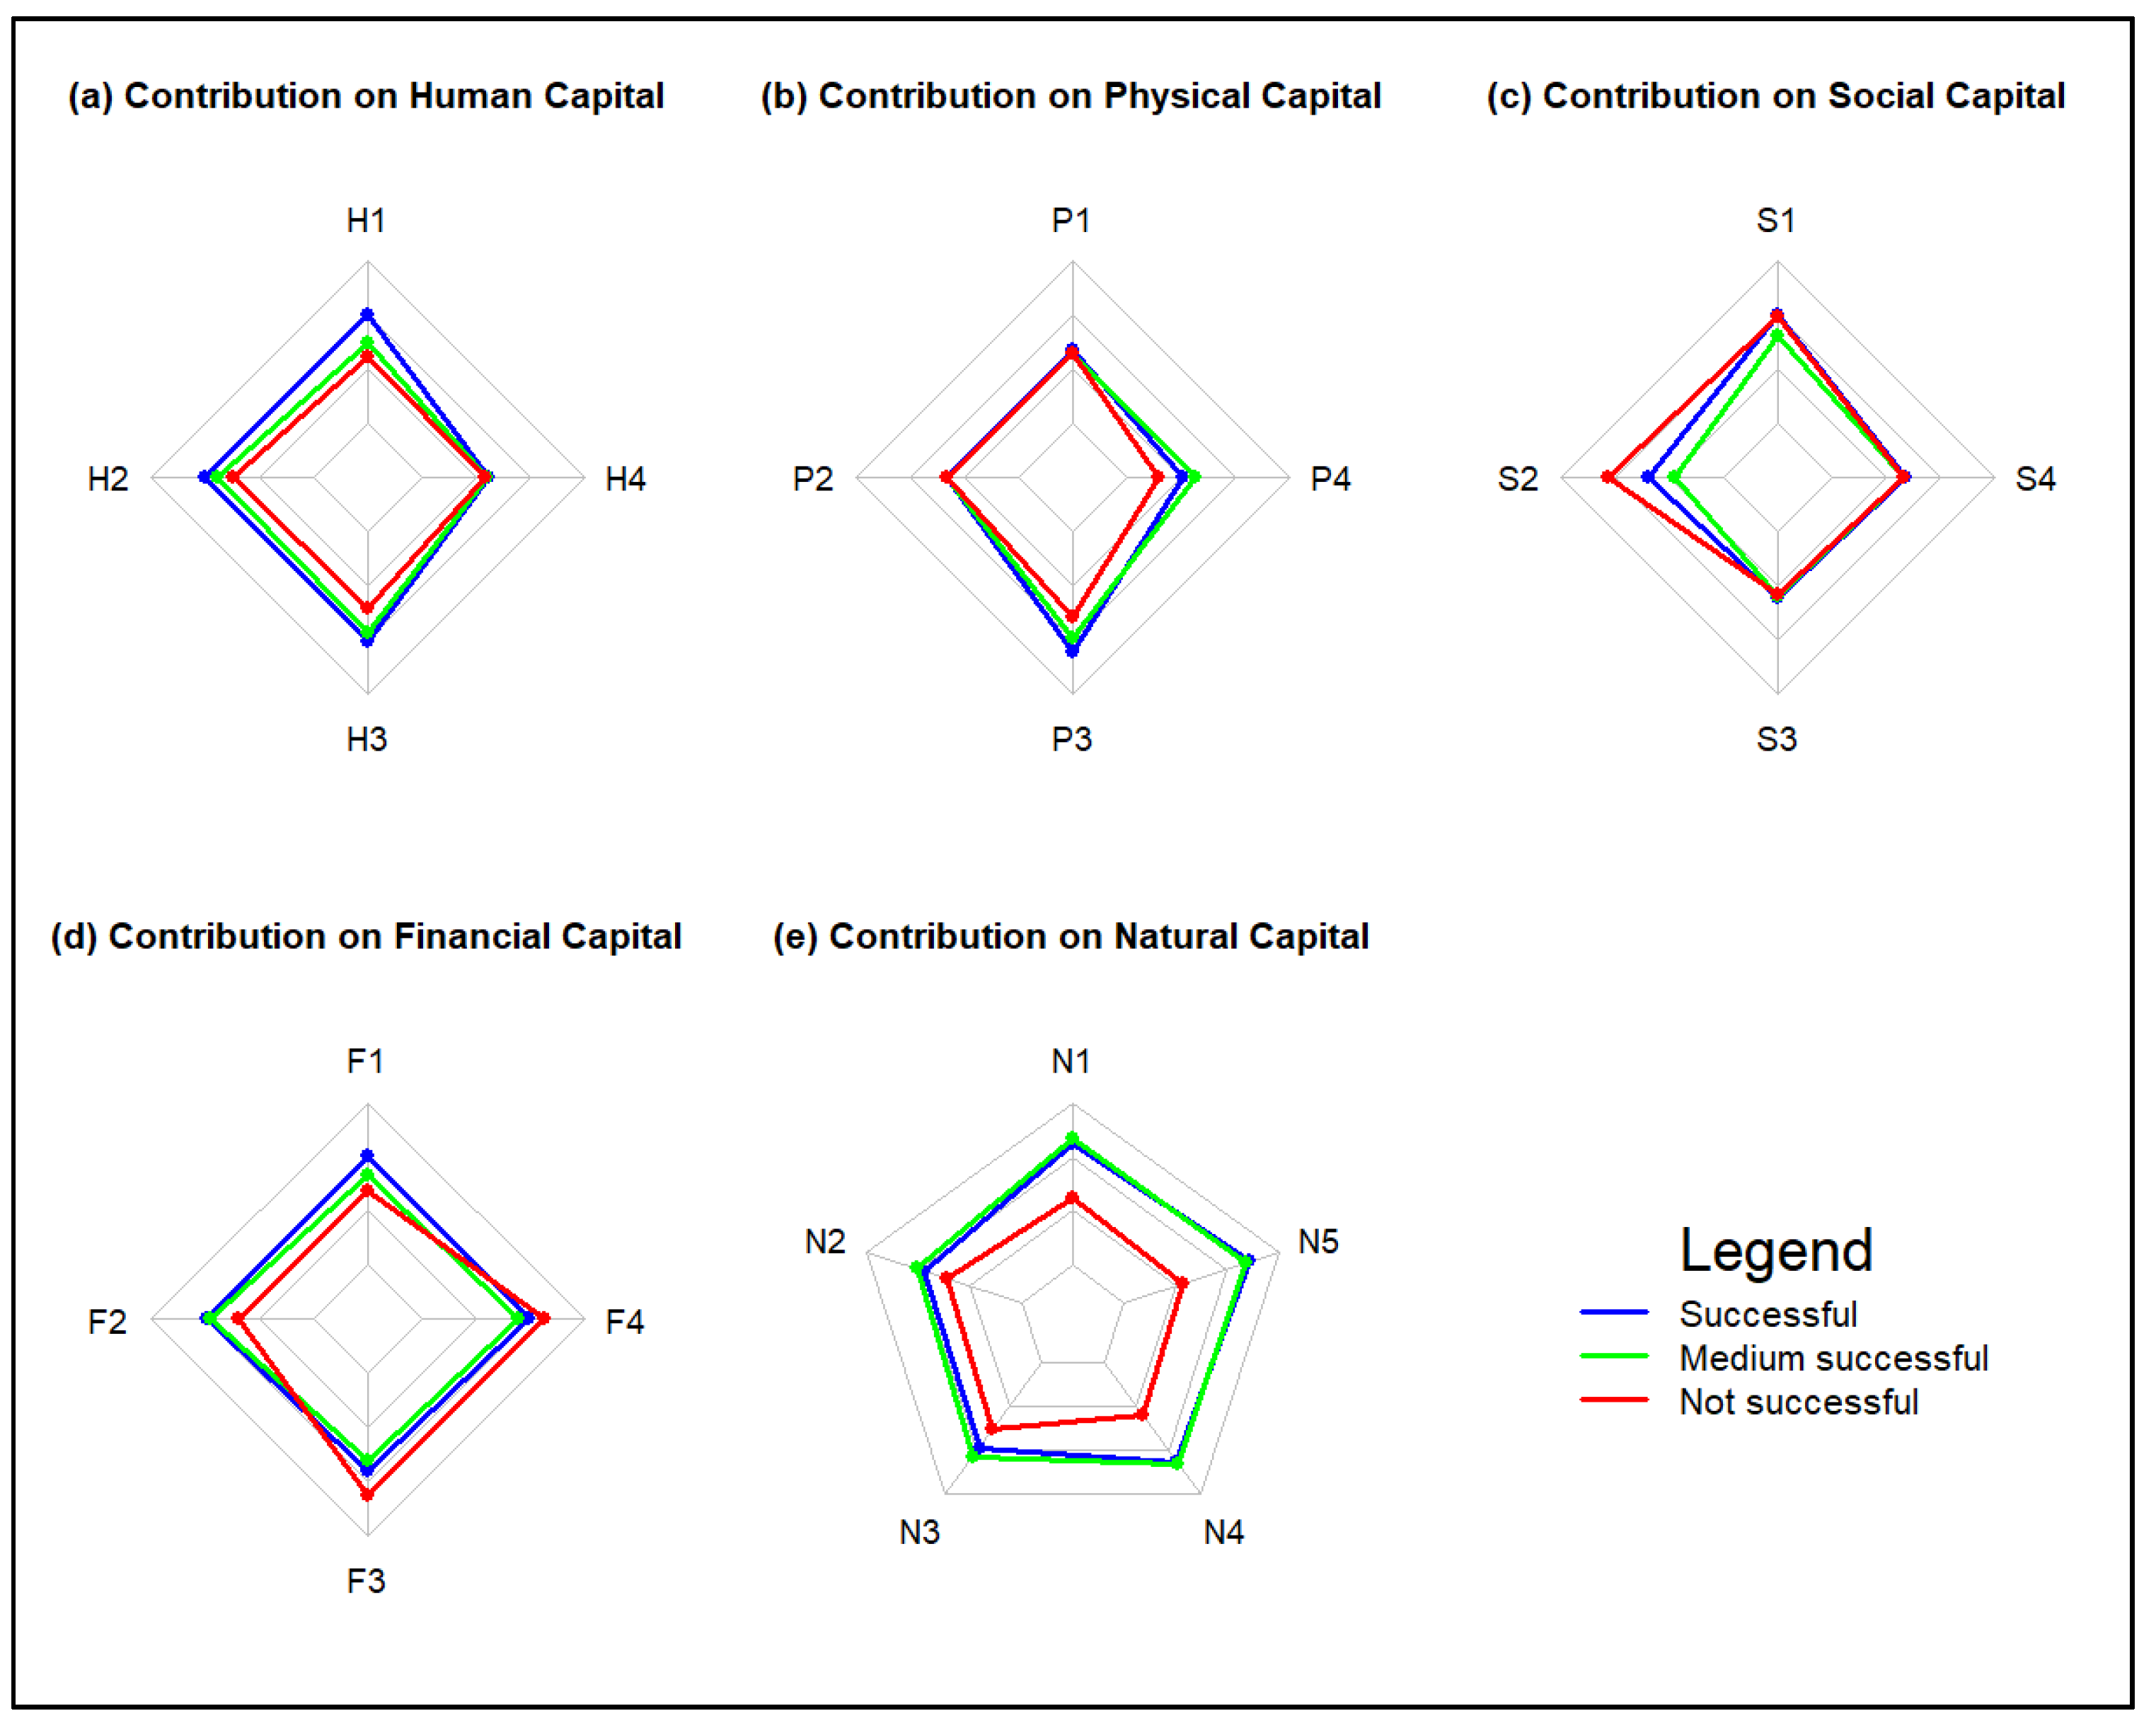
3.3. Contribution of LF to Five Different Livelihood Capitals
3.3.1. Contribution to Human Capital
3.3.2. Contribution on Physical Capital
3.3.3. Contribution on Social Capital
3.3.4. Contribution on Financial Capital
3.3.5. Contribution on Natural Capital
3.4. Dependency of LF on Different Livelihood Indicators
4. Discussion
4.1. Contribution of Leasehold Forest on Human Capital Indicators
4.2. Contribution of Leasehold Forest on Physical Capital Indicators
4.3. Contribution of Leasehold Forest on Social Capital Indicators
4.4. Contribution of Leasehold Forest on Financial Capital Indicators
4.5. Contribution of Leasehold Forest on Natural Capital Indicators
5. Conclusions
Author Contributions
Funding
Data Availability Statement
Acknowledgments
Conflicts of Interest
Appendix A. Questionnaire (Household Survey)

| Types | Number of Persons Involved | |
|---|---|---|
| Male | Female | |
| Land Type | Area (Ropani/Kathha/Dhur) | Production | Supports for (Months) | |||
|---|---|---|---|---|---|---|
| 1–4 | 5–8 | 9–12 | >12 | |||
| Khet | ||||||
| Bari | ||||||
| Kharbari | ||||||
| Others | ||||||
| Cow/Oxen | Bullock/Buffalo | Goat/Sheep | Poultry | Others |
|---|---|---|---|---|
| S.N. | Types of Users | Duration | Response (Yes/No) |
|---|---|---|---|
| 1 | Regular forest users | 1–3 times per week | |
| 2 | Occasional forest users | 1–3 times per month | |
| 3 | Future forest users | Member but not used yet |
| S.N. | Questions | Answers | Scores | Obtained Scores |
|---|---|---|---|---|
| 1 | Human Capitals | |||
| 1.1 | State of skill development on LF management | Highly decreased decreased Neutral Increased Highly increased | 1 2 3 4 5 | |
| 1.2 | Leadership capacity enhancement | Highly decreased decreased Neutral Increased Highly increased | 1 2 3 4 5 | |
| 1.3 | Responsibility bearing among users | Highly decreased decreased Neutral Increased Highly increased | 1 2 3 4 5 | |
| 1.4 | Gender equality in LF management | Highly decreased decreased Neutral Increased Highly increased | 1 2 3 4 5 | |
| 2 | Physical Capitals | |||
| 2.1 | Construction and access to physical infrastructure and facilities (nurseries, seed banks, equipment, water, roads, schools, temples) | Highly decreased decreased Neutral Increased Highly increased | 1 2 3 4 5 | |
| 2.2 | Effectiveness of construction of physical | Highly decreased decreased Neutral Increased Highly increased | 1 2 3 4 5 | |
| Capitals | ||||
| 2.3 | Enhancement of knowledge on community development | Highly decreased Decreased Neutral Increased Highly increased | 1 2 3 4 5 | |
| 2.4 | Equipment and tools availability | Highly decreased Decreased Neutral Increased Highly increased | 1 2 3 4 5 | |
| 3 | Social Capitals | |||
| 3.1 | Relation among UG members after hand | Highly worsened worsened Neutral improved Highly improved | 1 2 3 4 5 | |
| 3.2 | Improvement in decision-making capacity about resources management and use | Highly worsened worsened Neutral improved Highly improved | 1 2 3 4 5 | |
| 3.3 | Outward migration control | Highly decreased Decreased Neutral Increased Highly increased | 1 2 3 4 5 | |
| 3.4 | Food security improvement | Highly decreased Decreased Neutral Improved Highly improved | 1 2 3 4 5 | |
| 4 | Financial Capitals | |||
| 4.1 | Increment in employment opportunities | Highly decreased decreased Neutral Increased Highly increased | 1 2 3 4 5 | |
| 4.2 | Time and cost required for forest products | Highly decreased decreased Neutral Increased Highly increased | 1 2 3 4 5 | |
| Collection | ||||
| 4.3 | Provision of loan for IGAs | Highly decreased decreased Neutral Increased Highly increased | 1 2 3 4 5 | |
| 4.4 | Provision of saving and investment | Highly decreased decreased Neutral Increased Highly increased | 1 2 3 4 5 | |
| 5 | Natural Capitals | |||
| 5.1 | Amount of forest products collection after | Highly decreased decreased Neutral Increased Highly increased | 1 2 3 4 5 | |
| handover of forest | ||||
| 5.2 | Increase in water sources | Highly decreased decreased Neutral Increased Highly increased | 1 2 3 4 5 | |
| 5.3 | Improvement in greenery and landscape beauty | Highly decreased decreased Neutral Increased Highly increased | 1 2 3 4 5 | |
| 5.4 | Biodiversity conservation enhancement | Highly decreased decreased Neutral Increased Highly increased | 1 2 3 4 5 | |
| 5.5 | Plantation success | Highly decreased decreased Neutral Increased Highly increased | 1 2 3 4 5 | |
References
- Bijaya, G.C.; Cheng, S.; Xu, Z.; Bhandari, J.; Wang, L.; Liu, X. Community forestry and livelihood in Nepal: A review. JAPS: J. Anim. Plant Sci. 2016, 26, 1–12. [Google Scholar]
- Ray, B.; Mukherjee, P. Forest income and rural livelihoods in West Bengal, India. Stud. Microecon. 2023, 11, 10–35. [Google Scholar] [CrossRef]
- Agarwal, B. Participatory exclusions, community forestry, and gender: An analysis for South Asia and a conceptual framework. World Dev. 2001, 29, 1623–1648. [Google Scholar] [CrossRef]
- Guariguata, M.R.; Balvanera, P. Tropical forest service flows: Improving our understanding of the biophysical dimension of ecosystem services. Elsevier 2009, 258, 1825–1829. [Google Scholar] [CrossRef]
- Cheng, S.H.; MacLeod, K.; Ahlroth, S.; Onder, S.; Perge, E.; Shyamsundar, P.; Rana, P.; Garside, R.; Kristjanson, P.; McKinnon, M.C.; et al. A systematic map of evidence on the contribution of forests to poverty alleviation. Environ. Evid. 2019, 8, 1–22. [Google Scholar] [CrossRef]
- FAO. Bioenergy and Food Security Wood Processing Residues—Manual; FAO: Rome, Italy, 2014; 32p. [Google Scholar]
- Rasmussen, L.; Watkins, C.; Agrawal, A. Forest contributions to livelihoods in changing agriculture-forest landscapes. Policy Econ. 2017, 84, 1–8. [Google Scholar] [CrossRef]
- Tadesse, S.; Woldetsadik, M.; Senbeta, F. Effects of participatory forest management on livelihood assets in Gebradima Forest, southwest Ethiopia. For. Trees Livelihoods 2017, 26, 229–244. [Google Scholar] [CrossRef]
- Zuidema, M.Z.A.; de Jong, W.; Boot, R.G.A. Livelihood strategies and forest dependence: New insights from Bolivian forest communities. Policy Econ. 2013, 26, 12–21. [Google Scholar]
- Jha, S.; Kafle, A.; Puri, G.; Huettmann, F. Forestry management in Nepal: An example and a review of growth & yield. In Hindu Kush-Himalaya Watersheds Downhill: Landscape Ecology and Conservation Perspectives; Springer: Berlin, Germany, 2020; pp. 213–225. [Google Scholar]
- Gurung, A.; Bista, R.; Karki, R.; Shrestha, S.; Uprety, D.; Oh, S.-E. Community-based forest management and its role in improving forest conditions in Nepal. Small-Scale For. 2013, 12, 377–388. [Google Scholar] [CrossRef]
- Gautam; Roberts, E.H.; Singh, B.K. Community based leasehold approach and agroforestry technology for restoring degraded hill forests and improving rural livelihoods in Nepal. In Proceedings of the International Conference on Rural Livelihoods, Forests and Biodiversity, Bonn, Germany, 19–23 May 2003. [Google Scholar]
- MoFE. 25 Years of Achievements on Biodiversity Conservation in Nepal. BIBECHANA 2018, 6, 31–36. [Google Scholar] [CrossRef]
- Kafley, G.P.; Pokharel, K. Pro-poor leasehold forestry: A community-based tenure regime in Nepal. J. For. Livelihood 2017, 15, 43–56. [Google Scholar] [CrossRef]
- MoFE. Forest Act 2019. Ministry of Forest and Environment. 2019. Available online: https://dmgnepal.gov.np/uploads/documents/the-forests-act-2019-2076pdf-3933-223-1686833362.pdf (accessed on 12 October 2024).
- Yadav, K.K.; Kafley, G.P.; Hancock, J.K. ShoResults and impacts of Leasehold Forestry for enhancing livelihoods of poor farmers in mid-hills of Nepal. In Proceedings of the Pro-poor Leasehold Forestry, Kathmandu, Nepal, 11–13 June 2014; pp. 209–220. [Google Scholar]
- DoF. Annual Report of Fiscal Year 2016–2017, Department of Forest. Kathmandu, Nepal. 2017. Available online: https://forestaction.org/wp-content/uploads/2021/09/Final-Annual-Report-2017.pdf (accessed on 28 October 2024).
- Pandey, B.; Paudel, G.; Timilsina, B.; Bastola, A.P. Assessment of the Role of Leasehold Forest in Livelihood Improvement in Gorkha District, Nepal. Int. J. Agric. Appl. Sci. 2023, 4, 120–126. [Google Scholar] [CrossRef]
- Newton, P.; Oldekop, J.; Agrawal, A.; Cronkleton, P.; Etue, E.; Russell, A.J.; Tjajadi, J.S.; Zhou, W. What are The Biophysical, Institutional, and Socioeconomic Contextual Factors Associated with Improvements in Livelihood and Environmental Outcomes in Forests Managed by Communities? A Systematic Review Protocol; CIFOR: Bogor, Indonesia, 2015. [Google Scholar]
- Hickey, G.M.; Pouliot, M.; Smith-Hall, C.; Wunder, S.; Nielsen, M.R. Quantifying the economic contribution of wild food harvests to rural livelihoods: A global-comparative analysis. Food Policy 2016, 62, 122–132. [Google Scholar] [CrossRef]
- Kusters, K.; Achdiawan, R.; Belcher, B.; Pérez, M.R. Balancing development and conservation? An assessment of livelihood and environmental outcomes of nontimber forest product trade in Asia, Africa, and Latin America. Ecol. Soc. 2006, 11, 20. [Google Scholar] [CrossRef]
- Dhungana, N.; Lee, C.-H.; Khadka, C.; Adhikari, S.; Pudasaini, N.; Ghimire, P. Evaluating community forest user groups (CFUGs)’performance in managing community forests: A case study in Central Nepal. Sustainability 2024, 16, 4471. [Google Scholar] [CrossRef]
- Adhikari, S.; Dhamala, M.K. Community forestry and livelihood linkages: A case of Kamalamai community forest, Dolakha, Nepal. Nepal J. Environ. Sci. 2016, 4, 31–37. [Google Scholar] [CrossRef]
- Dev, O.P.; Yadav, N.P.; Springate-Baginski, O. Soussan Impacts of community forestry on livelihoods in the middle hills of Nepal. J. For. Livelihood 2003, 3, 64–77. [Google Scholar]
- Poudyal; Maraseni, T.; Cockfield, G. Scientific forest management practice in Nepal: Critical reflections from stakeholders’ perspectives. Forests 2020, 11, 27. [Google Scholar] [CrossRef]
- Biland, M.; Zeb, A.; Ullah, A.; Kaechele, H. Why do households depend on the forest for income? Analysis of factors influencing households’ decision-making behaviors. Sustainability 2021, 13, 9419. [Google Scholar] [CrossRef]
- Chama, E.; Shibru, S.; Gebre, T.; Demissew, S.; Woldu, Z. Forest products monetary contribution to households’ income: A means to improve the livelihood of a low-income rural community in South Ethiopia. Heliyon 2023, 9, e21553. [Google Scholar] [CrossRef]
- Nerfa, L.; Rhemtulla, J.M.; Zerriffi, H. Forest dependence is more than forest income: Development of a new index of forest product collection and livelihood resources. World Dev 2020, 125, 104689. [Google Scholar] [CrossRef]
- Wiebe, P.C.; Zhunusova, E.; Lippe, M.; Velasco, R.F.; Günter, S. What is the contribution of forest-related income to rural livelihood strategies in the Philippines’ remaining forested landscapes? Policy Econ 2022, 135, 102658. [Google Scholar] [CrossRef]
- Chand, N.; Kerr, G.N.; Bigsby, H. Production efficiency of community forest management in Nepal. Policy Econ. 2015, 50, 172–179. [Google Scholar] [CrossRef]
- Yadav; Kafley, G.P.; Yadav, K.P. Linking silvicultural aspects of pro-poor leasehold forestry for socio-economic benefits to the poor and. BanKo Jankari 2018, 4, 113–119. [Google Scholar] [CrossRef]
- Karmacharya, M.; Karna, B.; Ostrom, E. Rules, incentives and enforcement: Livelihood strategies of community forestry and leasehold forestry users in Nepal. In Proceedings of the International Conference on Rural Livelihoods, Forest and Biodiversity, Bonn, Germany, 19–23 May 2003. [Google Scholar]
- Angelsen, A.; Jagger, P.; Babigumira, R.; Belcher, B.; Hogarth, N.J.; Bauch, S.; Börner, J.; Smith-Hall, C.; Wunder, S. Environmental income and rural livelihoods: A global-comparative analysis. World Dev. 2014, 64, S12–S28. [Google Scholar] [CrossRef]
- Pouliot, M.; Treue, T. Rural people’s reliance on forests and the non-forest environment in West Africa: Evidence from Ghana and Burkina Faso. World Dev. 2013, 43, 180–193. [Google Scholar] [CrossRef]
- Shrestha, S.; Shrestha, J.; Shah, K.K. Non-timber forest products and their role in the livelihoods of people of Nepal: A critical review. Grassroots J. Nat. Resour. 2020, 3, 42–56. [Google Scholar] [CrossRef]
- Acharya, R.P.; Maraseni, T.N.; Cockfield, G. Local users and other stakeholders’ perceptions of the identification and prioritization of ecosystem services in fragile mountains: A case study of Chure Region of Nepal. Forests 2019, 10, 421. [Google Scholar] [CrossRef]
- Farrington, J.; Carney, D.; Ashley, C.; Turton, C. Sustainable Livelihhods in Practice: Early Applications of Concepts in Rural Areas 42; ODI: London, UK, 1999. [Google Scholar]
- Jackson, E.A. Sustainable Livelihood Framework for Equitable Living in Crisis of Global Pandemic; Springer: Cham, Switzerland, 2021. [Google Scholar]
- Sati, V.P.; Vangchhia, L. A Sustainable Livelihood Approach to Poverty Reduction: An Empirical Analysis of Mizoram, the Eastern Extension of the Himalaya; Springer: Cham, Switzerland, 2016. [Google Scholar]
- Chatterjee, S.; Bhandari, G. Study on development of sustainable livelihood framework approach at Indian part of Sundarbans by geospatial and geo-statistical analysis. J. Environ. Sci. Econ. 2023, 2, 18–37. [Google Scholar] [CrossRef]
- Bajwa, S.K. A Study of the Status of Livelihood Assets at Household Level: Evidence from Saidpur Village. Pakistan Institute for Development Economics. Discussion Paper 3. 2015. Available online: https://file.pide.org.pk/pdf/DevStudies/discussionpaper/DiscussionPaper3.pdf (accessed on 29 October 2024).
- DFID. Sustainable Livelihoods Guidance Sheets; Department of International Development 445: London, UK, 1999. [Google Scholar]
- Barrett, C.; Swallow, B.M. Dynamic poverty traps and rural livelihoods. In Rural Livelihoods and Poverty Reduction Policies; Routledge: London, UK, 2004; pp. 14–24. [Google Scholar]
- Ellis, F. Rural Livelihoods and Diversity in Developing Countries; Oxford University Press: Oxford, UK, 2000. [Google Scholar]
- Xu, Z.; Qayum, M.; Afzal, J.; Aslam, M. Availability and access to Livelihood capital assets for development of sustainable Livelihood strategies of fishermen: A case study of Manchar Lake Pakistan. Heliyon 2023, 9, e22549. [Google Scholar] [CrossRef]
- Ibrahim, A.Z.; Hassan, K.; Kamaruddin, R.; Anuar, A.R. Examining the Livelihood Assets and Sustainable Livelihoods among the Vulnerability Groups in Malaysia. Indian-Pac. J. Account. Financ. 2017, 1, 52–63. [Google Scholar] [CrossRef]
- Lax, J.; Krug, J. Livelihood Assessment: A Participatory Tool for Natural Resource Dependent Communities. Thünen Working Paper. 2013. Available online: https://hdl.handle.net/10419/87578 (accessed on 5 November 2024).
- Blokland, T. The public life of social capital. In The Sage Handbook of the 21st Century City; Sage Publications: London, UK, 2017; pp. 552–566. [Google Scholar]
- Wassie, S.B. Natural resource degradation tendencies in Ethiopia: A review. Environ. Syst. Res. 2020, 9, 1–29. [Google Scholar] [CrossRef]
- Khatiwada, S.; Subedi, P.D.P.K. Livelihood Assets and Their Implications in Livelihood Strategy: A Case of Bote Community in Tanahun. 2023. Available online: https://www.academia.edu/105994897/Livelihood_Assets_and_thier_Implication_on_Livelihood_Strategies_A_case_of_Bote_Community_in_Tanahun_Nepal (accessed on 7 November 2024).
- Haji, L.; Valizadeh, N.; Hayati, D. The role of local communities in sustainable land and forest management. In Spatial Modeling in Forest Resources Management: Rural Livelihood and Sustainable Development; Springer: Berlin, Germany, 2020; pp. 473–503. [Google Scholar]
- Savari, M.; Khaleghi, B. The role of social capital in forest conservation: An approach to deal with deforestation. Sci. Total Environ. 2023, 896, 165216. [Google Scholar] [CrossRef]
- Pandit, B.H.; Thapa, G.B.; Zoebisch, M. Promoting Marketing of Cinnamon Tree Products in Palpa District of Nepal. Available online: https://www.academia.edu/87639650/Promoting_Marketing_of_Cinnamon_Tree_Products_in_Palpa_District_of_Nepal (accessed on 10 November 2024).
- Aybek, E.C.; Toraman, Ç. How many response categories are sufficient for Likert type scales? An empirical study based on the Item Response Theory. Int. J. Assess. Tools Educ. 2022, 9, 534–547. [Google Scholar] [CrossRef]
- Singh, R.B.; Jha, S. Agriculture and forestry based livelihood capital assessment. In Livelihood Security in Northwestern Himalaya: Case Studies from Changing Socio-Economic Environments in Himachal Pradesh, India; Springer: Berlin, Germany, 2014; pp. 95–106. [Google Scholar]
- Noguchi, K.; Konietschke, F.; Marmolejo-Ramos, F.; Pauly, M. Permutation tests are robust and powerful at 0.5% and 5% significance levels. Behav. Res. Methods 2021, 53, 2712–2724. [Google Scholar] [CrossRef]
- Acharya, K.P.; Adhikari, J.; Khanal, D.R. Forest tenure regimes and their impact on livelihoods in Nepal. J. For. Livelihood 2008, 7, 6–18. [Google Scholar]
- Edmunds, E.; Wollenberg, K. Local Forest Management: The Impacts of Devolution Policies; Routledge: London, UK, 2013. [Google Scholar]
- Pokharel; Neupane, P.R.; Tiwari, K.R.; Köhl, M. Assessing the sustainability in community based forestry: A case from Nepal. Policy Econ. 2015, 58, 75–84. [Google Scholar] [CrossRef]
- Agrawal, A.; Chhatre, A. Explaining success on the commons: Community forest governance in the Indian Himalaya. World Dev 2006, 34, 149–166. [Google Scholar] [CrossRef]
- Sikor, T.; Tan, N.Q. Realizing Forest Rights in Vietnam: Addressing Issues in Community Forest Management. 2011. Available online: https://www.recoftc.org/publications/0000182 (accessed on 1 November 2024).
- Gurung, L.; Shrestha, B.; Rajbanshi, R. Learners’ Perspectives on Gender Inclusive Practices in Teacher Education: A case study from a Nepali University. Int. J. Multidiscip. Perspect. High. Educ. 2022, 7, 202–228. [Google Scholar]
- Colfer, C.J.P.; Minarchek, R.D. Women, Men and Forest Research. A Review of Approaches, Resources and Methods for Addressing Gender. 2013. Available online: https://cgspace.cgiar.org/server/api/core/bitstreams/cf8ece31-15a3-4735-ba9f-e1dbc97ceba6/content (accessed on 3 November 2024).
- Rocheleau, D.; Thomas-Slayter, B.; Wangari, E. Feminist Political Ecology: Global Issues and Local Experience; Routledge: London, England, 2013. [Google Scholar]
- Arora-Jonsson, S.; Agarwal, S.; Colfer, C.J.P.; Keene, S.; Kurian, P.; Larson, A.M. SDG 5: Gender equality–A precondition for sustainable forestry. In Sustainable Development Goals: Their Impacts on Forests and People; Cambridge University Press: Cambridge, UK, 2019; pp. 146–177. [Google Scholar]
- Ghimire, P.; Lamichhane, U. Community based forest management in Nepal: Current status, successes and challenges. Grassroots J. Nat. Resour 2020, 3, 16–29. [Google Scholar] [CrossRef]
- Khanal, D.; Gautam, D.; Bhandari, J.; Bhattarai, S.; Gahatraj, G.; Jandug, C.M.; Baral, K. Contribution of Leasehold Forestry to Users Household Income in Sahidlakkhan Rural Municipality, Gorkha, Nepal. North Am. Acad. Res. 2019, 2, 142–152. Available online: https://twasp.info/public/paper/sept%202019%20issue%20(1).pdf (accessed on 8 November 2024).
- Ohler, F.M.J. The impact of leasehold forestry on livelihoods in Nepal. In Proceedings of the 12th World Congress of Forestry, Quebec, QC, Canada, 21–28 September 2003. [Google Scholar]
- Gobeze, T.; Bekele, M.; Lemenih, M.; Kassa, H. Participatory forest management and its impacts on livelihoods and forest status: The case of Bonga forest in Ethiopia. Int. For. Rev. 2009, 11, 346–358. [Google Scholar] [CrossRef]
- Moelio, M.; Wollenberg, E.; Limberg, G. The Decentralization of Forest Governance: Politics, Economics and The Fight for Control of Forests in Indonesian Borneo; Routledge: London, UK, 2012. [Google Scholar]
- Xu, J.; Ribot, J.C. Decentralisation and accountability in forest management: A case from Yunnan, Southwest China. Eur. J. Dev. Res. 2004, 16, 153–173. [Google Scholar] [CrossRef]
- Banana, A.Y.; Bukenya, M.; Arinaitwe, E.; Birabwa, B.; Ssekindi, S. Gender, Tenure and Community Forests in Uganda. 2013. Available online: https://www.cifor-icraf.org/publications/pdf_files/WPapers/WP87CIFOR.pdf (accessed on 5 December 2024).
- Pagdee, A.; Kim, Y.; Daugherty, P.J. What makes community forest management successful: A meta-study from community forests throughout the world. Soc. Nat. Resour. 2006, 19, 33–52. [Google Scholar] [CrossRef]
- Poudyal; Adhikari, B.; Lovett, J. Community-based leasehold forestry in Nepal: A genuine tenure reform in progress? In Forest Tenure Reform in Asia and Africa; Routledge: London, UK, 2014; pp. 216–232. [Google Scholar]
- Seeport, F. Impacts of Leasehold Forestry on Livelihoods and Forest Management. 2014. Available online: https://www.cabidigitallibrary.org/doi/abs/10.1079/9781780646312.0116 (accessed on 21 June 2023).
- Bista; Graybill, S.; Zhang, Q.; Bilsborrow, R.E.; Song, C. Influence of rural out-migration on household participation in community forest management? Evidence from the Middle Hills of Nepal. Sustainability 2023, 15, 2185. [Google Scholar] [CrossRef]
- KC, B.; Race, D.; Fisher, R.; Jackson, W. Changing rural livelihoods and forest use transition in the middle hills of Nepal. Small-Scale For. 2021, 20, 479–501. [Google Scholar]
- Agarwal, B. Gender and forest conservation: The impact of women’s participation in community forest governance. Ecol. Econ. 2009, 68, 2785–2799. [Google Scholar] [CrossRef]
- Hein, L.; De Ridder, N. Desertification in the Sahel: A reinterpretation. Glob. Change Biol. 2006, 12, 751–758. [Google Scholar] [CrossRef]
- Fox, J.; Castella, J.-C. Expansion of rubber (Hevea brasiliensis) in Mainland Southeast Asia: What are the prospects for smallholders? J. Peasant. Stud. 2013, 40, 155–170. [Google Scholar] [CrossRef]
- Reddy, V.R.; Bandi, M.G.R.M.; Saravanan, V.; Bandi, M.; Springate-Baginski, O. Participatory forest management in Andhra Pradesh: A review of its working. J. Soc. Econ. Dev. 2005, 7, 175–199. [Google Scholar]
- Molden, D.; Breu, T.; von Dach, S.W.; Zimmermann, A.B.; Mathez-Stiefel, S.-L. Focus issue: Implications of out-and in-migration for sustainable development in mountains. Mt. Res. Dev. 2017, 37, 387. [Google Scholar] [CrossRef]
- Pandit, B.H.; AlbaImproving, A. Forest Benefits for the Poor. Center for International Forestry Research. 2008. Available online: https://www.cifor-icraf.org/publications/pdf_files/Books/BAlbano0801.pdf (accessed on 13 June 2024).
- Luni; Lal, M.K.; Joshi, N.P. Forest and food security of indigenous people: A case of Chepangs in Nepal. J. Int. Dev. Coop. 2011, 1, 113–135. [Google Scholar]
- Dhakal, A.; Maraseni, T.N.; Timsina, J. Assessing the potential of agroforestry in Nepal: Socio-economic and environmental perspectives. In Agriculture, Natural Resources and Food Security: Lessons from Nepal; Springer: Berlin, Germany, 2022; pp. 375–394. [Google Scholar]
- Laudari, H.K.; Aryal, K.; Maraseni, T.; Pariyar, S.; Pant, B.; Bhattarai, S.; Kaini, T.R.; Karki, G.; Marahattha, A. Sixty-five years of forest restoration in Nepal: Lessons learned and way forward. Land Use Policy 2022, 115, 106033. [Google Scholar] [CrossRef]
- Baral, K.; Poudyal, B.K. Contribution of leasehold forestry to generate financial asset in three western hill districts of Nepal. Banko Janakari 2012, 22, 21–27. [Google Scholar]
- Mbuvi, M.T.E.; Ndalilo, L.; Matiku, P.; Munguti, S.; Odera, G. Yearning for an Apple: The Changing Lifestyle of the Tana River Delta Communities in Kenya and Implications on Livelihoods and Conservation of Natural Resources. Nat. Resour. 2020, 11, 446–472. [Google Scholar] [CrossRef]
- Mokhirev; Olegovna, P.M.; Medvedev, O.S.; Mammatov, O.V. Assessment of availability of wood resources using geographic information and analytical systems (the Krasnoyarsk territory as a case study). J. Appl. Eng. Sci. 2018, 16, 313–319. [Google Scholar] [CrossRef]
- Nepal, M.; Nepal, A.K.; Berrens, R.P. Where gathering firewood matters: Proximity and forest management effects in hedonic pricing models for rural Nepal. J. Econ. 2017, 27, 28–37. [Google Scholar] [CrossRef]
- Sunderlin, W.D.; Dewi, S.; Puntodewo, A. Poverty and Forests. Multi-Country Analysis of Spatial Association. 2007. Available online: https://www.cifor-icraf.org/knowledge/publication/2294/ (accessed on 7 July 2024).
- Poffenberger, M. People in the forest: Community forestry experiences from Southeast Asia. Int. J. Environ. Sustain. Dev. 2006, 5, 57–69. [Google Scholar] [CrossRef]
- Baynes, J.; Herbohn, J.; Smith, C.; Fisher, R.; Bray, D. Key Factors Which Influence the Success of Community Forestry in Developing Countries. Glob. Environ. Change 2015, 35, 226–238. [Google Scholar] [CrossRef]
- Puri, L. Evaluating Spatial and Social Factors to Effectively Implement Community Forest Management Operational Plans in Nepal. Ph.D. Thesis, University of Adelaide, Adelaide, Australia, 2020. Available online: https://core.ac.uk/download/pdf/482265916.pdf (accessed on 24 July 2024).
- Bray, D.B.; Merino-Pérez, L. The Rise of Community Forestry in Mexico: History, Concepts, and Lessons Learned from Twenty-Five Years of Community Timber Production; A Report in Partial Fulfillment of Grant, no. 1010–0595; The Ford Foundation: New York, NY, USA, 2002. [Google Scholar]
- Pattanayak, S.K.; Kramer, R.A. Worth of watersheds: A producer surplus approach for valuing drought mitigation in Eastern Indonesia. Env. Dev. Econ. 2001, 6, 123–146. [Google Scholar] [CrossRef]
- Neupane, P.R. Viability Assessment of Jurisdictional Reduced Emissions from Deforestation and Forest Degradation (REDD+) implementation in Vietnam. Ph.D. Thesis, Staats-und Universitätsbibliothek Hamburg Carl von Ossietzky, Hamburg, Germany, 2015. [Google Scholar]
- Dutta, S.; Guchhait-Barddhaman, S.K. Measurement of livelihood assets in sustainable forest governance: A study in Burdwan forest division, West Bengal. Transactions 2018, 40, 203. [Google Scholar]
- Rai, A. Contribution of Community Forestry on Local Livelihood. Ph.D. Thesis, Central Department of Rural Development Tribhuvan University, Kathmandu, Nepal, 2017. Available online: https://www.academia.edu/89873128/Contribution_of_Community_Forestry_on_Local_Livelihood (accessed on 14 June 2024).
- Schirmer, J.; Pirard, R.; Kanowski, P. Promises and perils of plantation forestry. In Forests, Business and Sustainability; Routledge: London, UK, 2015; pp. 153–178. [Google Scholar]
- Poudyal, B.H.; Paudel, D.; Marquardt, K.; Khatri, S. Examining forest transition and collective action in Nepal’s community forestry. Land Use Policy 2023, 134, 106872. [Google Scholar] [CrossRef]
- Baidhya, S.; Rajbhandari, B.P.; Poudel, P. Biodiversity Conservation and Livelihood Improvement through Community-Based Forest Management in Nepal. 2021. Available online: https://www.nepjas.com/uploads/journal/documents/1735133038_document.pdf#page=131 (accessed on 21 September 2024).
- Pratiwi; Narendra, B.H.; Siregar, C.A.; Turjaman, M.; Hidayat, A.; Rachmat, H.H.; Mulyanto, B.; Suwardi; Iskandar; Maharani, R.; et al. Managing and reforesting degraded post-mining landscape in Indonesia: A Review. Land 2021, 10, 658. [Google Scholar] [CrossRef]
- Sahoo, K.P.; Ghosh, S.; Allarakha, S.; Siddique, G. Socio-ecological impact of forest legislations on forest and forest-people of Jhargram District, West Bengal. Land Use Policy 2023, 135, 106940. [Google Scholar] [CrossRef]
- Moges, M.B. Towards a Land Administration Approach to Water Resource Management in Ethiopia with Particular Focus on Lake Tana Watershed. Mizan Law Rev. 2023, 17, 415–456. [Google Scholar] [CrossRef]
- Ojha, H.; Paudel, N.S.; Timsina, J.; Chaudhary, S.; Baral, H. Ecosystems services from community forestry: Prospects and challenges for improving local livelihoods in Nepal. In Agriculture, Natural Resources and Food Security: Lessons from Nepal; Springer: Berlin, Germany, 2022; pp. 337–356. [Google Scholar]
- Clements, T.; John, A.; Nielsen, K.; An, D.; Tan, S.; Milner-Gulland, E.J. Payments for biodiversity conservation in the context of weak institutions: Comparison of three programs from Cambodia. Ecol. Econ. 2010, 69, 1283–1291. [Google Scholar] [CrossRef]
- Laudari, H.K.; Kaini, T. Nepal’s Pro-poor Leasehold Forestry Program: Processes, Policies, Problems and Ways Forward. Initiation 2014, 5, 84–95. [Google Scholar] [CrossRef]


| Criteria/Category | Successful (S) | Medium Successful (M) | Not Successful (NS) |
|---|---|---|---|
| Annual income | >USD 750 | USD 350 to USD 750 | <USD 350 |
| Plantation success status | >90% | 50% to 90% | <50% |
| Users’ participation | >90% | 50% to 90% | <50% |
| Category | Rural Municipality | LF Name | Area (ha.) | Household (No.) | Estd. Year (A.D.) | Annual Income (USD) | Plantation Success (%) | Participation in Mgmt (%) |
|---|---|---|---|---|---|---|---|---|
| Successful | Nisdi | Bhorma | 10.0 | 12 | 2012 | 1015 | 100 | 100 |
| Nisdi | Ripkhoriya | 8.0 | 11 | 2013 | 898 | 100 | 100 | |
| Purbakhola | Bendada | 15.0 | 12 | 2012 | 846 | 100 | 100 | |
| Purbakhola | Dholimara | 15.3 | 15 | 2012 | 918 | 100 | 100 | |
| Ribdikot | Ghungradada | 8.2 | 20 | 2017 | 1335 | 100 | 100 | |
| Ribdikot | Thulochaur | 6.6 | 14 | 2017 | 1050 | 100 | 100 | |
| Medium successful | Nisdi | Maulathar | 12.0 | 11 | 2012 | 682 | 60 | 72 |
| Nisdi | Kafalkharka | 5.5 | 9 | 2015 | 432 | 65 | 68 | |
| Purbakhola | Golkhadal | 10.8 | 14 | 2017 | 456 | 72 | 79 | |
| Purbakhola | Bisdada | 12.3 | 11 | 2016 | 378 | 60 | 77 | |
| Ribdikot | Kalopahara | 4.7 | 20 | 2015 | 419 | 68 | 69 | |
| Ribdikot | Pakhapani | 1.3 | 14 | 2015 | 500 | 71 | 62 | |
| Not successful | Nisdi | Phapardada | 9.1 | 10 | 2013 | 267 | 15 | 18 |
| Nisdi | Katusghari | 7.8 | 11 | 2015 | 82 | 13 | 24 | |
| Purbakhola | Digaira | 8.5 | 11 | 2012 | 0 | 0 | 0 | |
| Purbakhola | Khiluwa Bhanghang | 7.9 | 9 | 2013 | 0 | 0 | 0 | |
| Ribdikot | Basdada | 5.8 | 16 | 2015 | 53 | 18 | 33 | |
| Ribdikot | Saibangaira | 4.2 | 8 | 2013 | 163 | 12 | 31 |
| Capital Assets | Indicators |
|---|---|
| Human capital | State of skill development on LF management (H1) Leadership capacity enhancement (H2) Responsibility bearing among users (H3) Gender equality in LF management * (H4) |
| Physical capital | Infrastructure construction (P1) Infrastructure construction effectiveness (P2) Enhancement of knowledge on community development (P3) Equipment and tools availability * (P4) |
| Social capital | Relation among user groups after LF handover (S1) Decision-making ability enhancement (S2) Outward migration control * (S3) Food security improvement * (S4) |
| Financial capital | Employment opportunities (F1) Time and cost of product collection (F2) Loan provision for IGAs (F3) Saving and investment * (F4) |
| Natural capital | Forest resource availability (N1) Water sources increment (N2) Greenery and landscape beauty improvement (N3) Biodiversity conservation enhancement * (N4) Plantation success * (N5) |
| Particulars | Category Wise | ||
|---|---|---|---|
| Successful | Medium Successful | Not Successful | |
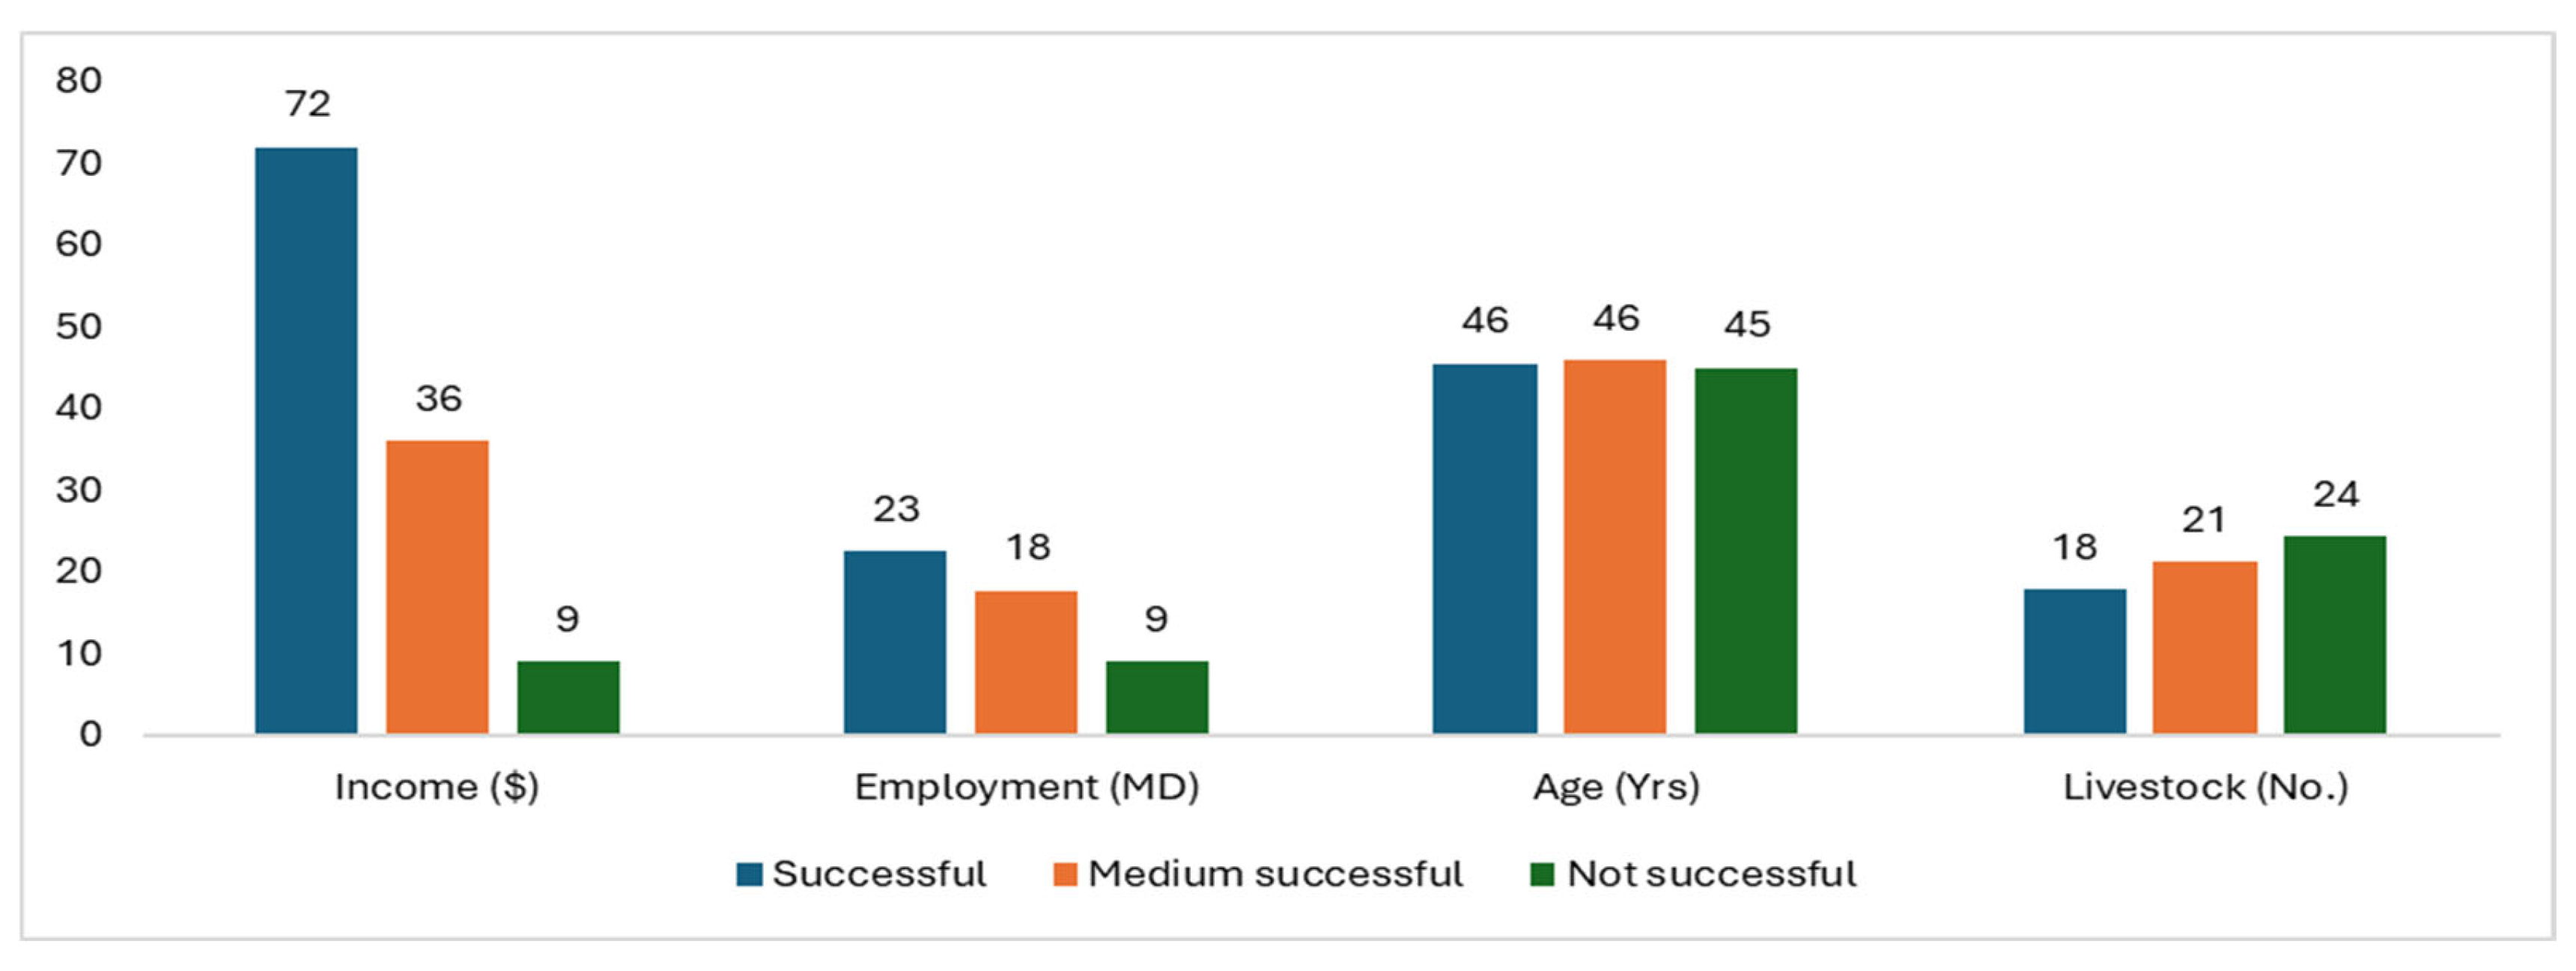
| Average user’s age | 46 | 46 | 45 |
| Average family members | |||
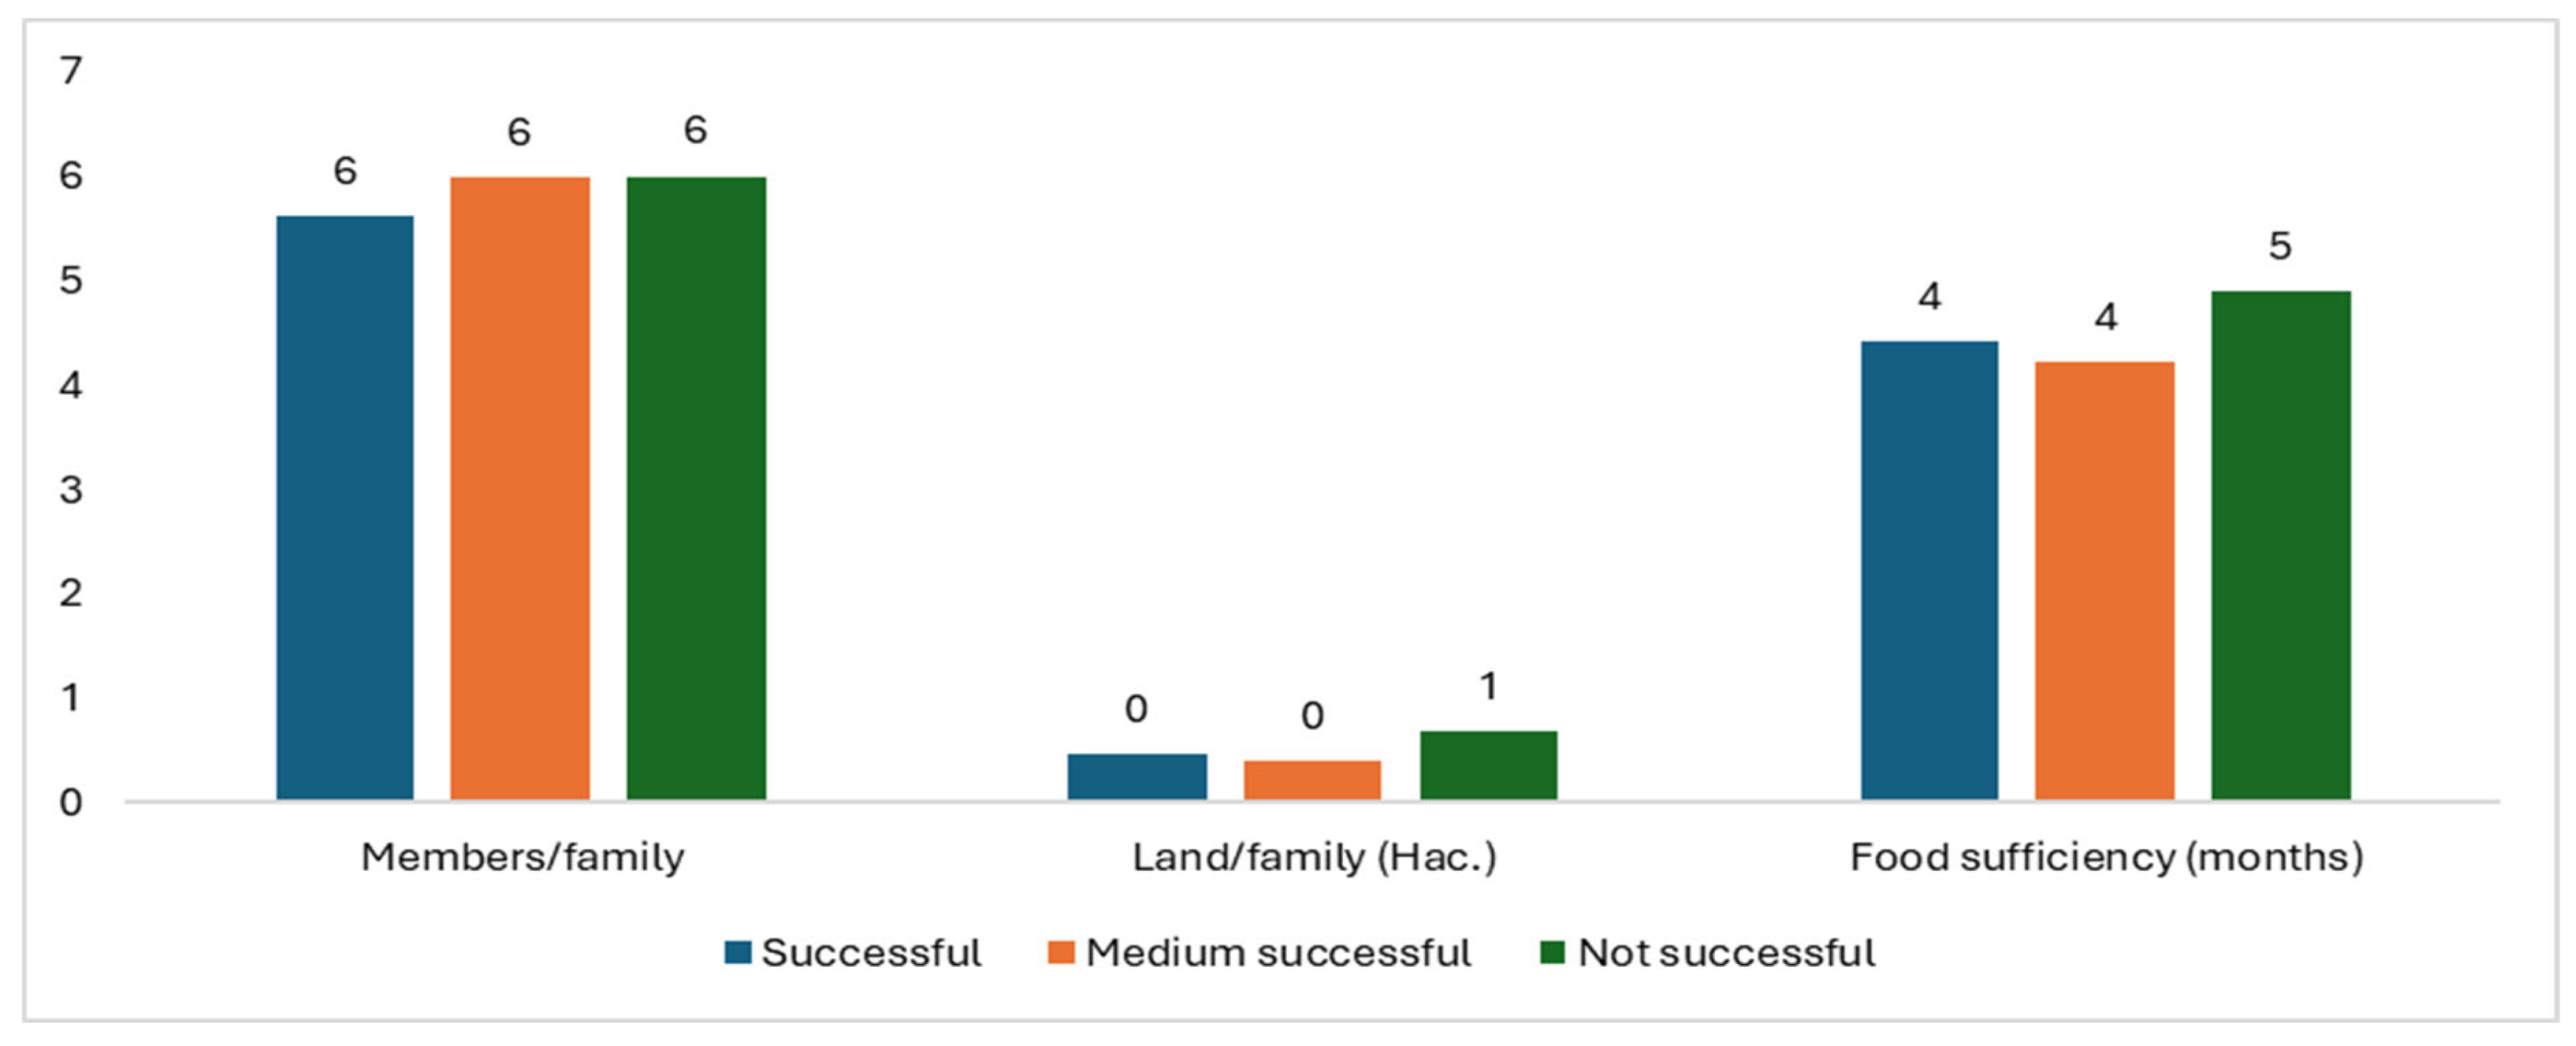
| Total | 7 | 6 | 6 |
| Male | 3 | 3 | 3 |
| Female | 3 | 3 | 3 |
| LF users | |||
| Female | 47 | 25 | 45 |
| Male | 37 | 54 | 20 |
| Education | |||
| Illiterate | 20 | 22 | 12 |
| School | 58 | 49 | 51 |
| College | 5 | 5 | 6 |
| Occupation | |||
| Agriculture | 64 | 75 | 44 |
| Animal husbandry | 3 | 2 | 1 |
| Foreign employment | 16 | 3 | 20 |
| Land holding | 9 | 7 | 14 |
| Food sufficiency | 4 | 5 | 8 |
| Livestock population | |||
| Buffalo | 2 | 2 | 2 |
| Cow | 2 | 3 | 2 |
| Goat | 9 | 10 | 10 |
| Chicken | 7 | 9 | 13 |
| Pig | 1 | 1 | 2 |
| Annual income per HH (USD) | 1081.3 | 541.5 | 130.2 |
| Annual employment (MD) | 23 | 17 | 9 |
| Capitals | Indicators | LF Category/Response Values | |||
|---|---|---|---|---|---|
| Successful | Medium Successful | Not Successful | Average | ||
| Human capital | H1 | 3.99 | 2.99 | 2.43 | 3.14 |
| H2 | 4.01 | 3.53 | 2.97 | 3.50 | |
| H3 | 4.06 | 3.78 | 2.83 | 3.56 | |
| H4 | 2.44 | 2.41 | 2.32 | 2.39 | |
| H average | 3.63 | 3.18 | 2.64 | 3.15 | |
| Physical capital | P1 | 2.70 | 2.61 | 2.58 | 2.63 |
| P2 | 2.64 | 2.64 | 2.63 | 2.64 | |
| P3 | 4.50 | 3.97 | 3.20 | 3.89 | |
| P4 | 2.08 | 2.50 | 1.15 | 1.91 | |
| P average | 2.98 | 2.93 | 2.39 | 2.77 | |
| Social capital | S1 | 3.98 | 3.23 | 3.94 | 3.72 |
| S2 | 2.77 | 1.82 | 4.29 | 2.96 | |
| S3 | 2.50 | 2.43 | 2.37 | 2.43 | |
| S4 | 2.69 | 2.63 | 2.66 | 2.66 | |
| S average | 2.99 | 2.53 | 3.32 | 2.94 | |
| Financial capital | F1 | 4.07 | 3.34 | 2.72 | 3.38 |
| F2 | 3.98 | 3.79 | 2.75 | 3.51 | |
| F3 | 3.62 | 3.24 | 4.51 | 3.79 | |
| F4 | 3.93 | 3.53 | 4.54 | 4.00 | |
| F average | 3.90 | 3.48 | 3.63 | 3.67 | |
| Natural capital | N1 | 4.48 | 4.67 | 2.49 | 3.88 |
| N2 | 3.79 | 4.07 | 2.92 | 3.59 | |
| N3 | 3.86 | 4.32 | 3.02 | 3.73 | |
| N4 | 4.50 | 4.59 | 2.37 | 3.82 | |
| N5 | 4.89 | 4.71 | 2.29 | 3.96 | |
| N average | 4.26 | 4.42 | 2.65 | 3.78 | |
| S.N. | Capitals | Indicators | X2 Statistics | p-Value | Result |
|---|---|---|---|---|---|
| 1 | Human | H1 | 155.07 | 1.711 × 10⁻²⁹ ** | Dependent |
| 2 | H2 | 118.97 | 5.412 × 10⁻²² ** | Dependent | |
| 3 | H3 | 129.40 | 1.719 × 10⁻²⁵ ** | Dependent | |
| 4 | H4 | 2.33 | 0.6761 | Independent | |
| 5 | Physical | P1 | 2.88 | 0.2367 | Independent |
| 6 | P2 | 0.09 | 0.9561 | Independent | |
| 7 | P3 | 134.99 | 1.145 × 10⁻²⁶ ** | Dependent | |
| 8 | P4 | 134.54 | 4.167 × 10⁻²⁸ ** | Dependent | |
| 9 | Social | S1 | 115.04 | 1.791 × 10⁻²² ** | Dependent |
| 10 | S2 | 183.02 | 2.389 × 10⁻³⁵ ** | Dependent | |
| 11 | S3 | 2.81 | 0.5903 | Independent | |
| 12 | S4 | 0.90 | 0.6384 | Independent | |
| 13 | Financial | F1 | 193.93 | 3.72 × 10−39 ** | Dependent |
| 14 | F2 | 139.31 | 1.399 × 10⁻²⁷ ** | Dependent | |
| 15 | F3 | 133.23 | 6.052 × 10⁻²⁵ ** | Dependent | |
| 16 | F4 | 97.83 | 7.112 × 10⁻¹⁹ ** | Dependent | |
| 17 | Natural | N1 | 214.69 | 1.41 × 10−43 ** | Dependent |
| 18 | N2 | 117.48 | 5.508 × 10⁻²³ ** | Dependent | |
| 19 | N3 | 224.50 | 4.303 × 10−44 ** | Dependent | |
| 20 | N4 | 213.06 | 3.137 × 10−43 ** | Dependent | |
| 21 | N5 | 225.12 | 8.42 × 10−46 ** | Dependent |
Disclaimer/Publisher’s Note: The statements, opinions and data contained in all publications are solely those of the individual author(s) and contributor(s) and not of MDPI and/or the editor(s). MDPI and/or the editor(s) disclaim responsibility for any injury to people or property resulting from any ideas, methods, instructions or products referred to in the content. |
© 2025 by the authors. Licensee MDPI, Basel, Switzerland. This article is an open access article distributed under the terms and conditions of the Creative Commons Attribution (CC BY) license (https://creativecommons.org/licenses/by/4.0/).
Share and Cite
Aryal, U.; Neupane, P.R.; Rijal, B.; Lamichanne, P.; Parajuli, A.; Maraseni, T.N. Assessing the Impact of Leasehold Forestry in Nepal: Enhancing Livelihoods and Preventing Degradation. Forests 2025, 16, 531. https://doi.org/10.3390/f16030531
Aryal U, Neupane PR, Rijal B, Lamichanne P, Parajuli A, Maraseni TN. Assessing the Impact of Leasehold Forestry in Nepal: Enhancing Livelihoods and Preventing Degradation. Forests. 2025; 16(3):531. https://doi.org/10.3390/f16030531
Chicago/Turabian StyleAryal, Upendra, Prem Raj Neupane, Bhawana Rijal, Prakash Lamichanne, Ashok Parajuli, and Tek Narayan Maraseni. 2025. "Assessing the Impact of Leasehold Forestry in Nepal: Enhancing Livelihoods and Preventing Degradation" Forests 16, no. 3: 531. https://doi.org/10.3390/f16030531
APA StyleAryal, U., Neupane, P. R., Rijal, B., Lamichanne, P., Parajuli, A., & Maraseni, T. N. (2025). Assessing the Impact of Leasehold Forestry in Nepal: Enhancing Livelihoods and Preventing Degradation. Forests, 16(3), 531. https://doi.org/10.3390/f16030531