Article

Impact of Backpack LiDAR Scan Routes on Diameter at Breast Height Estimation in Forests

1
School of Geographic Information and Tourism, Chuzhou University, Chuzhou 239000, China
2
School of Resources and Environmental Engineering, Anhui University, Hefei 230601, China
3
Anhui Province Key Laboratory of Physical Geographic Environment, Chuzhou 239000, China
*
Author to whom correspondence should be addressed.
These authors contributed equally to this work.
Forests 2025, 16(3), 527; https://doi.org/10.3390/f16030527
Submission received: 13 February 2025 / Revised: 12 March 2025 / Accepted: 14 March 2025 / Published: 16 March 2025

Abstract

:
Forest resource surveys are of vital importance for grasping the current status of forest resources, formulating management strategies, and evaluating ecosystem functions. Traditional manual measurement methods have numerous limitations in complex forest environments. The emergence of LiDAR technology has provided a new approach. Backpack LiDAR has been increasingly applied due to its portability and flexibility. However, there is a lack of comprehensive research on the influence of different scanning routes on data quality and analysis results. In this study, forest plots of four tree species, namely Carya cathayensis, Cinnamomum camphora, Koelreuteria bipinnata, and Quercus acutissima in Chuzhou City, Anhui Province, were selected as the research objects. Six scanning routes were designed to collect point cloud data using backpack LiDAR. After preprocessing, including denoising and ground point classification, diameter at breast height (DBH) fitting and accuracy evaluation were carried out. The results indicated that the individual tree recognition rates of C. cathayensis, C. camphora, and K. bipinnata reached 100%, while that of Q. acutissima was between 64.71% and 78.07% and was significantly affected by the scanning route. The DBH fitting accuracy of each tree species varied among different routes. For example, C. cathayensis had high accuracy in routes 1 and 6, and C. camphora had high accuracy in routes 1 and 3. Tree species characteristics, scanning routes, and data processing methods jointly affected the DBH fitting accuracy. This study provides a basis for the application of backpack LiDAR in forest resource surveys. Although backpack LiDAR has advantages, it is still necessary to optimize data acquisition schemes targeting tree species characteristics and improve point cloud data processing algorithms to promote its in-depth application in the forestry field.

1. Introduction

Forest resource inventory is of great significance for understanding the current status of forest resources, formulating reasonable forest management strategies, and evaluating the functions of forest ecosystems [1,2]. Traditional forest resource inventory methods mainly rely on manual field measurements. This approach not only requires a large amount of labor, material resources, and time costs but also has a relatively low work efficiency. In complex forest environments, such as those with rugged terrains and dense vegetation, the survey accuracy is highly vulnerable to various factors, such as terrain conditions, tree obstruction, and operational errors of surveyors, making it difficult to ensure the accuracy and integrity of the data [3,4,5].
Light detection and ranging (LiDAR) technology has emerged as a powerful tool in forestry research, enabling the efficient acquisition of crucial information regarding forest vegetation. It can precisely capture details such as the vertical structure of forest vegetation, tree height, and crown width. This not only streamlines the process of forest resource surveys but also substantially enhances the accuracy of the data collected [6,7,8,9]. Moreover, LiDAR technology offers innovative technical approaches for studies on species classification, forest biomass quantification, and carbon storage assessment [10,11].
Backpack LiDAR, a lightweight and flexible LiDAR device, can rapidly acquire high-resolution point cloud data in forests. This provides a new approach for forest resource surveys [12]. Ruhan et al. (2023) utilized backpack LiDAR to extract tree structural parameters, and a quantitative structural model was employed to reconstruct 3D tree models and estimate above-ground biomass (AGB) [13]. Su et al. (2024) estimated the above-ground carbon storage in larch and birch forests based on backpack LiDAR and UAV-based multispectral data. The study found that the incorporation of LiDAR data could improve the estimation accuracy [14]. The research of Chen et al. (2023) demonstrated that backpack LiDAR can effectively compensate for the deficiencies of UAV-LiDAR in data collection at the lower part of forest stands [15]. It provides more comprehensive and accurate tree parameter information for forest resource monitoring. Su et al. (2020) developed a backpack LiDAR system integrating an improved simultaneous localization and mapping (SLAM) algorithm with dynamic calibration, which achieved high-precision measurements of forest parameters, such as DBH [16]. Yang et al. (2024) proposed a multi-sensor fusion SLAM algorithm and a backpack-mounted dual-LiDAR device, which improved the accuracy of extracting forest vertical structure parameters and solved the problem of GNSS signals under the forest [17].
Backpack LiDAR has shown unique advantages in acquiring tree DBH parameters through high-density point clouds that effectively capture understory structures. However, existing studies lack systematic optimization of scanning routes. Xie et al. (2022) revealed that scanning routes influence DBH estimation errors by affecting point cloud density, highlighting the critical role of path planning in data collection [12]. A central unresolved question remains: how do tree species characteristics and scanning route configurations interact to impact DBH estimation accuracy?
To address this scientific gap, we systematically designed six typical scanning routes for comparative experiments in four representative forest stands (Carya cathayensis, Cinnamomum camphora, Koelreuteria bipinnata, and Quercus acutissima) in Chuzhou City. By establishing a complete technical chain of “route design-data acquisition-accuracy evaluation,” we analyzed the differential effects of routes on individual tree recognition rates and DBH estimation precision. The innovation lies in our novel approach of coupling tree species morphological traits with scanning route parameters, uncovering the adaptability patterns between route types and tree structures. This study provides theoretical foundations for developing dynamic route optimization models based on species characteristics, offering critical insights to enhance the application efficiency of backpack LiDAR in complex forest stands.

2. Materials and Methods

2.1. Overview of the Study Area

This study selected four forest plots with different tree species located in Chuzhou City, Anhui Province, China (Figure 1). They are situated in the eastern part of Anhui Province, with geographical coordinates ranging from 30°51′ to 33°13′ north latitude and 117°10′ to 119°13′ east longitude. It belongs to the subtropical humid monsoon climate zone. This region has four distinct seasons and is mild and humid, with an average annual temperature of about 15.5 °C. The average annual precipitation can reach 1000—1100 mm, and the average annual evaporation is 1200—1300 mm. There is abundant sunlight, and the annual sunshine duration is approximately 2000 h.

2.2. Data Acquisition

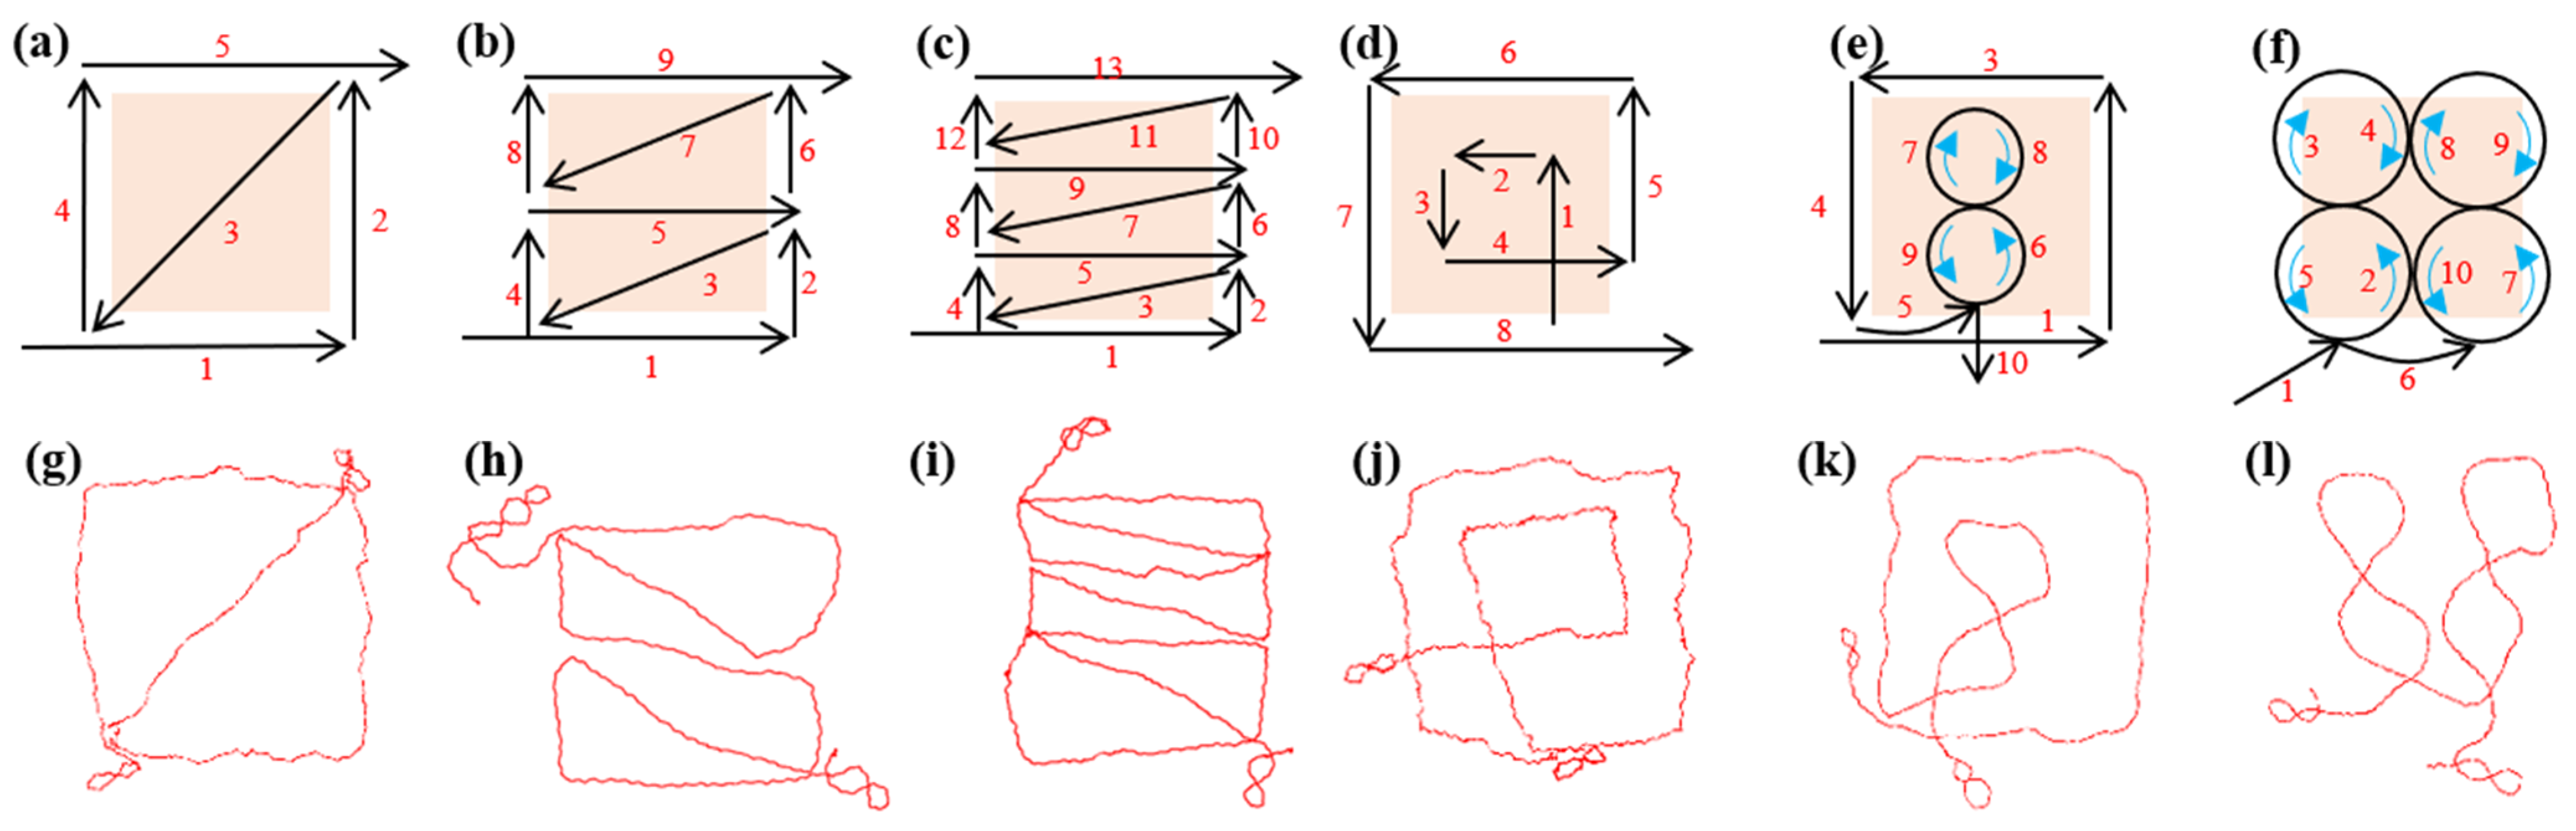
2.2.1. Backpack LiDAR Data Acquisition

In this study, the Li-Backpack DGC 50 backpack laser scanner (Beijing Digital Green Soil Technology Co., Ltd., Beijing, China) was used to collect the point cloud data of the sample sites. This device is an indoor–outdoor integrated backpack-type 3D laser scanning system capable of collecting point clouds and panoramic images with high-precision geographic coordinate information. By leveraging GPS positioning information and combining LiDAR with Simultaneous Localization and Mapping (SLAM) technology, it can acquire laser point clouds and panoramic image data with high-precision geographic coordinates. Even in areas with a partial lack of GNSS signals, it can still obtain laser point cloud data with high-precision geographic information. The instrument parameters are shown in Table 1. Scanning frequency is positively correlated with point cloud density and storage capacity; scanning distance determines the effective detection distance and edge accuracy; and angular resolution is directly proportional to detail capture capability. To mitigate environmental noise interference, scanning operations were conducted under meteorological conditions with wind velocity < 0.5 m/s during data acquisition. Additionally, a standardized operational protocol was enforced to maintain uniform linear movement (velocity variation ≤ 0.1 m/s), ensuring motion stability during scanning.
When using a backpack LiDAR to scan forest plots, it is essential to ensure that the entire plot is covered to avoid any missed areas [18]. By setting a reasonable scanning point spacing and scanning route, it is possible to maximize the likelihood that every area within the plot will be scanned by the laser. In this study, six different routes were designed based on the size of the forest plot and the scanning range of the laser, as shown in Figure 2.
Specifically, route 1 employed a standard Z-shaped trajectory, route 2 featured a double-Z configuration, and route 3 utilized a triple-Z pattern. These Z-shaped paths are widely adopted in forestry surveys due to their geometric simplicity and edge coverage efficiency. Routes 4–6 incorporated circumferential scanning elements to enhance point cloud density and minimize occlusions. Routes 5 and 6 further integrated figure-eight loops, which enabled SLAM algorithms to mitigate positional drift through overlapping scan feature matching.
The raw point cloud data were stored in the LAS 1.4 format on the laboratory server. A hierarchical naming rule was adopted. For example, the data of route 1 for C. cathayensis were named C_cathayensis_Route1.las.

2.2.2. Sample Plot Survey Data

In this study, forest plots of four types were collected. The size of each plot was 20 m × 20 m. After collecting point cloud data for each plot, the DBH of each tree was measured at a height of 1.3 m, and the location information was recorded with a real-time kinematic (RTK) system. The results are shown in Table 2.

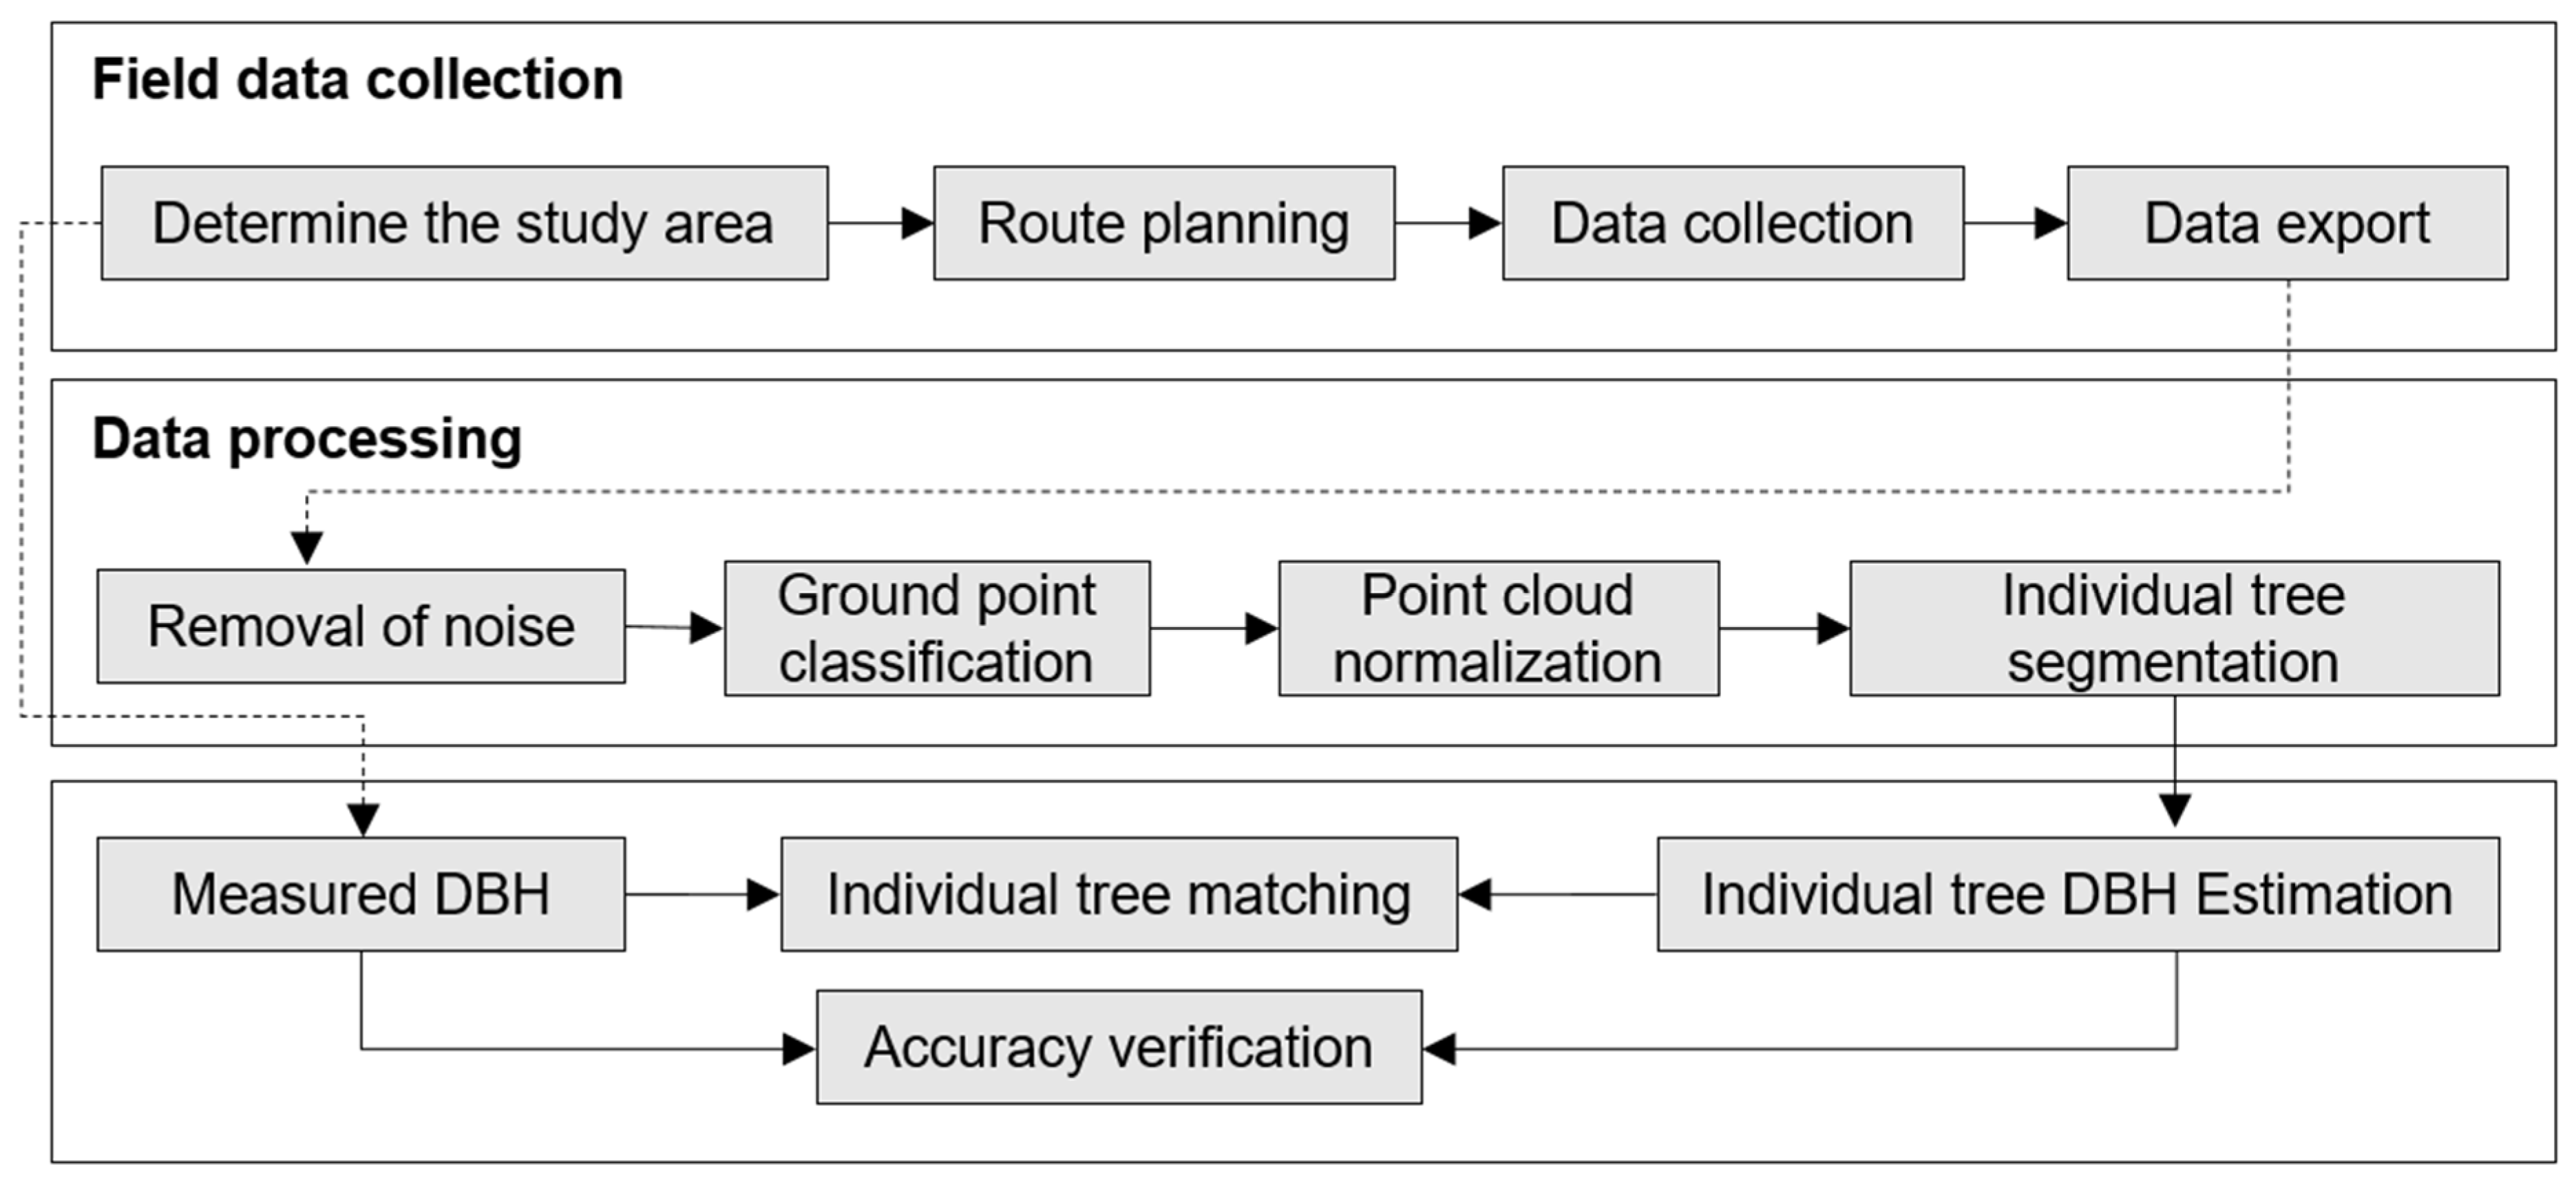
2.3. Research Methodology

As shown in the flowchart (Figure 3), the data workflow comprised three core stages. First, the study area and scanning routes were determined, followed by data collection. Next, point cloud data were processed, including noise removal, ground point classification, point cloud normalization, and individual tree segmentation. Finally, individual tree DBH fitting and accuracy validation were performed.

2.3.1. Point Cloud Data Preprocessing

The preprocessing of LiDAR point cloud data is a crucial step for subsequent data analysis and applications. Using Lidar360 v7.2 (Beijing Digital Green Soil Technology Co., Ltd., Beijing, China), this process includes denoising, ground point classification, normalization, and individual tree segmentation [19]. The quality and usability of the point cloud data are significantly improved after preprocessing. Denoising aims to remove the noise points introduced by factors such as measurement errors and environmental interference. After denoising, an improved progressive triangulated network densification filtering algorithm is used to separate the ground points. Based on the classified ground points, the point cloud data is normalized. Specifically, the elevation value Z of each point is subtracted by the elevation value of the nearest ground point found so that the point cloud data is at the same starting height within the coordinate system [20].
Individual tree segmentation is to distinguish individual trees from the normalized point cloud data [21]. In this study, a seed point-based individual tree segmentation method (without machine learning) was adopted. Seed points were manually added at the breast-height diameter of individual trees in the point cloud data. The algorithm searched for points within the breast-height diameter radius or the nearest points according to the three-dimensional coordinates of the seed points as the initial seed point clusters for subsequent segmentation [15]. Through individual tree segmentation, the vegetation in the plot was separated. During the segmentation process, attributes such as the x and y coordinates, tree height, crown diameter, crown area, and crown volume of individual trees were recorded simultaneously. The final segmentation results were counted and exported together in a CSV table.

2.3.2. DBH Fitting

In this paper, for individual trees, the least-squares circle fitting method was used to estimate DBH at the 1.3 m position of the identified tree trunk [22]. The formula is as follows:
f ( x a , y a , R ) = d i 2
r i = x i x a 2 + y i y a 2
where di is the distance from each point on DBH to the center of the fitted circle; xa and ya are the coordinates of the center of the determined fitted circle; xi and yi are the coordinates of the center of the iteratively fitted circle; ri is the radius of the circle fitted for different points; and R is the radius of the determined fitted circle.
When using the least-squares method for circle fitting to estimate DBH, to ensure the stability and efficiency of the algorithm, a slight change in the position of the center of the circle was used as the termination condition. To further ensure the accuracy of the fitting results, this paper combined an automatic algorithm with manual inspection. DBH estimated by the automatic algorithm was visually verified to determine whether the fitting result was too large or too small. If the result was incorrect, manual refitting was required. The point cloud image of DBH is shown in Figure 4.

2.3.3. Accuracy Assessment

The quality of point cloud data collected from different routes varied, which also affected the accuracy of subsequent individual tree segmentation. To compare the individual tree segmentation effects of data collected from different routes, the accuracy rate (P) was used to evaluate the precision of individual tree segmentation.
P = 1 1 n i = 1 n | W i w i | W i
R 2 = i = 1 n ( w i w i ¯ ) ( W i W i ¯ ) i = 1 n ( w i w i ¯ ) 2 ( W i W i ¯ ) 2
R M S E = 1 n i = 1 n ( W i W i ¯ ) 2
r R M S E = R M S E 1 n i = 1 n w i
where di is the distance of each point from the center of the fitted circle at 1.3 m ( d i = r i R ); xa and ya are the coordinates of the center of the determined fitted circle; xi and yi are the coordinates of the center of the iteratively fitted circle; ri is the radius of the circle fitted at different points; and R is the radius of the determined fitted circle.

3. Results

3.1. Recognition Results and Analysis of Individual Trees from Point Clouds of Different Routes

The individual tree recognition results of four tree species under different scanning paths are presented in Table 3. Among them, the recognition rates of C. cathayensis, C. camphora, and K. bipinnata reached 100% for all scanning routes. The recognition rate of Q. acutissima was relatively low, with the recognition rates of various scanning routes ranging from 64.71% to 78.07%. The scanning route with the highest recognition rate was route 1, with a recognition rate of 78.07%, and the route with the lowest recognition rate was route 3, with a recognition rate of 64.71%. The main reason for the overall low recognition rate of the Q. acutissima forest was its dense growth. Moreover, some young Q. acutissima plants had slender morphological structures and small growth intervals, and there were cases of cross-growth, which made it difficult to accurately identify each Q. acutissima tree during individual tree segmentation. The scanning route also had a significant impact on the recognition results. Route 3 had the lowest recognition rate, possibly because multiple scans were conducted in some areas, resulting in the overlap of point cloud data and making it difficult to identify individual Q. acutissima trees.

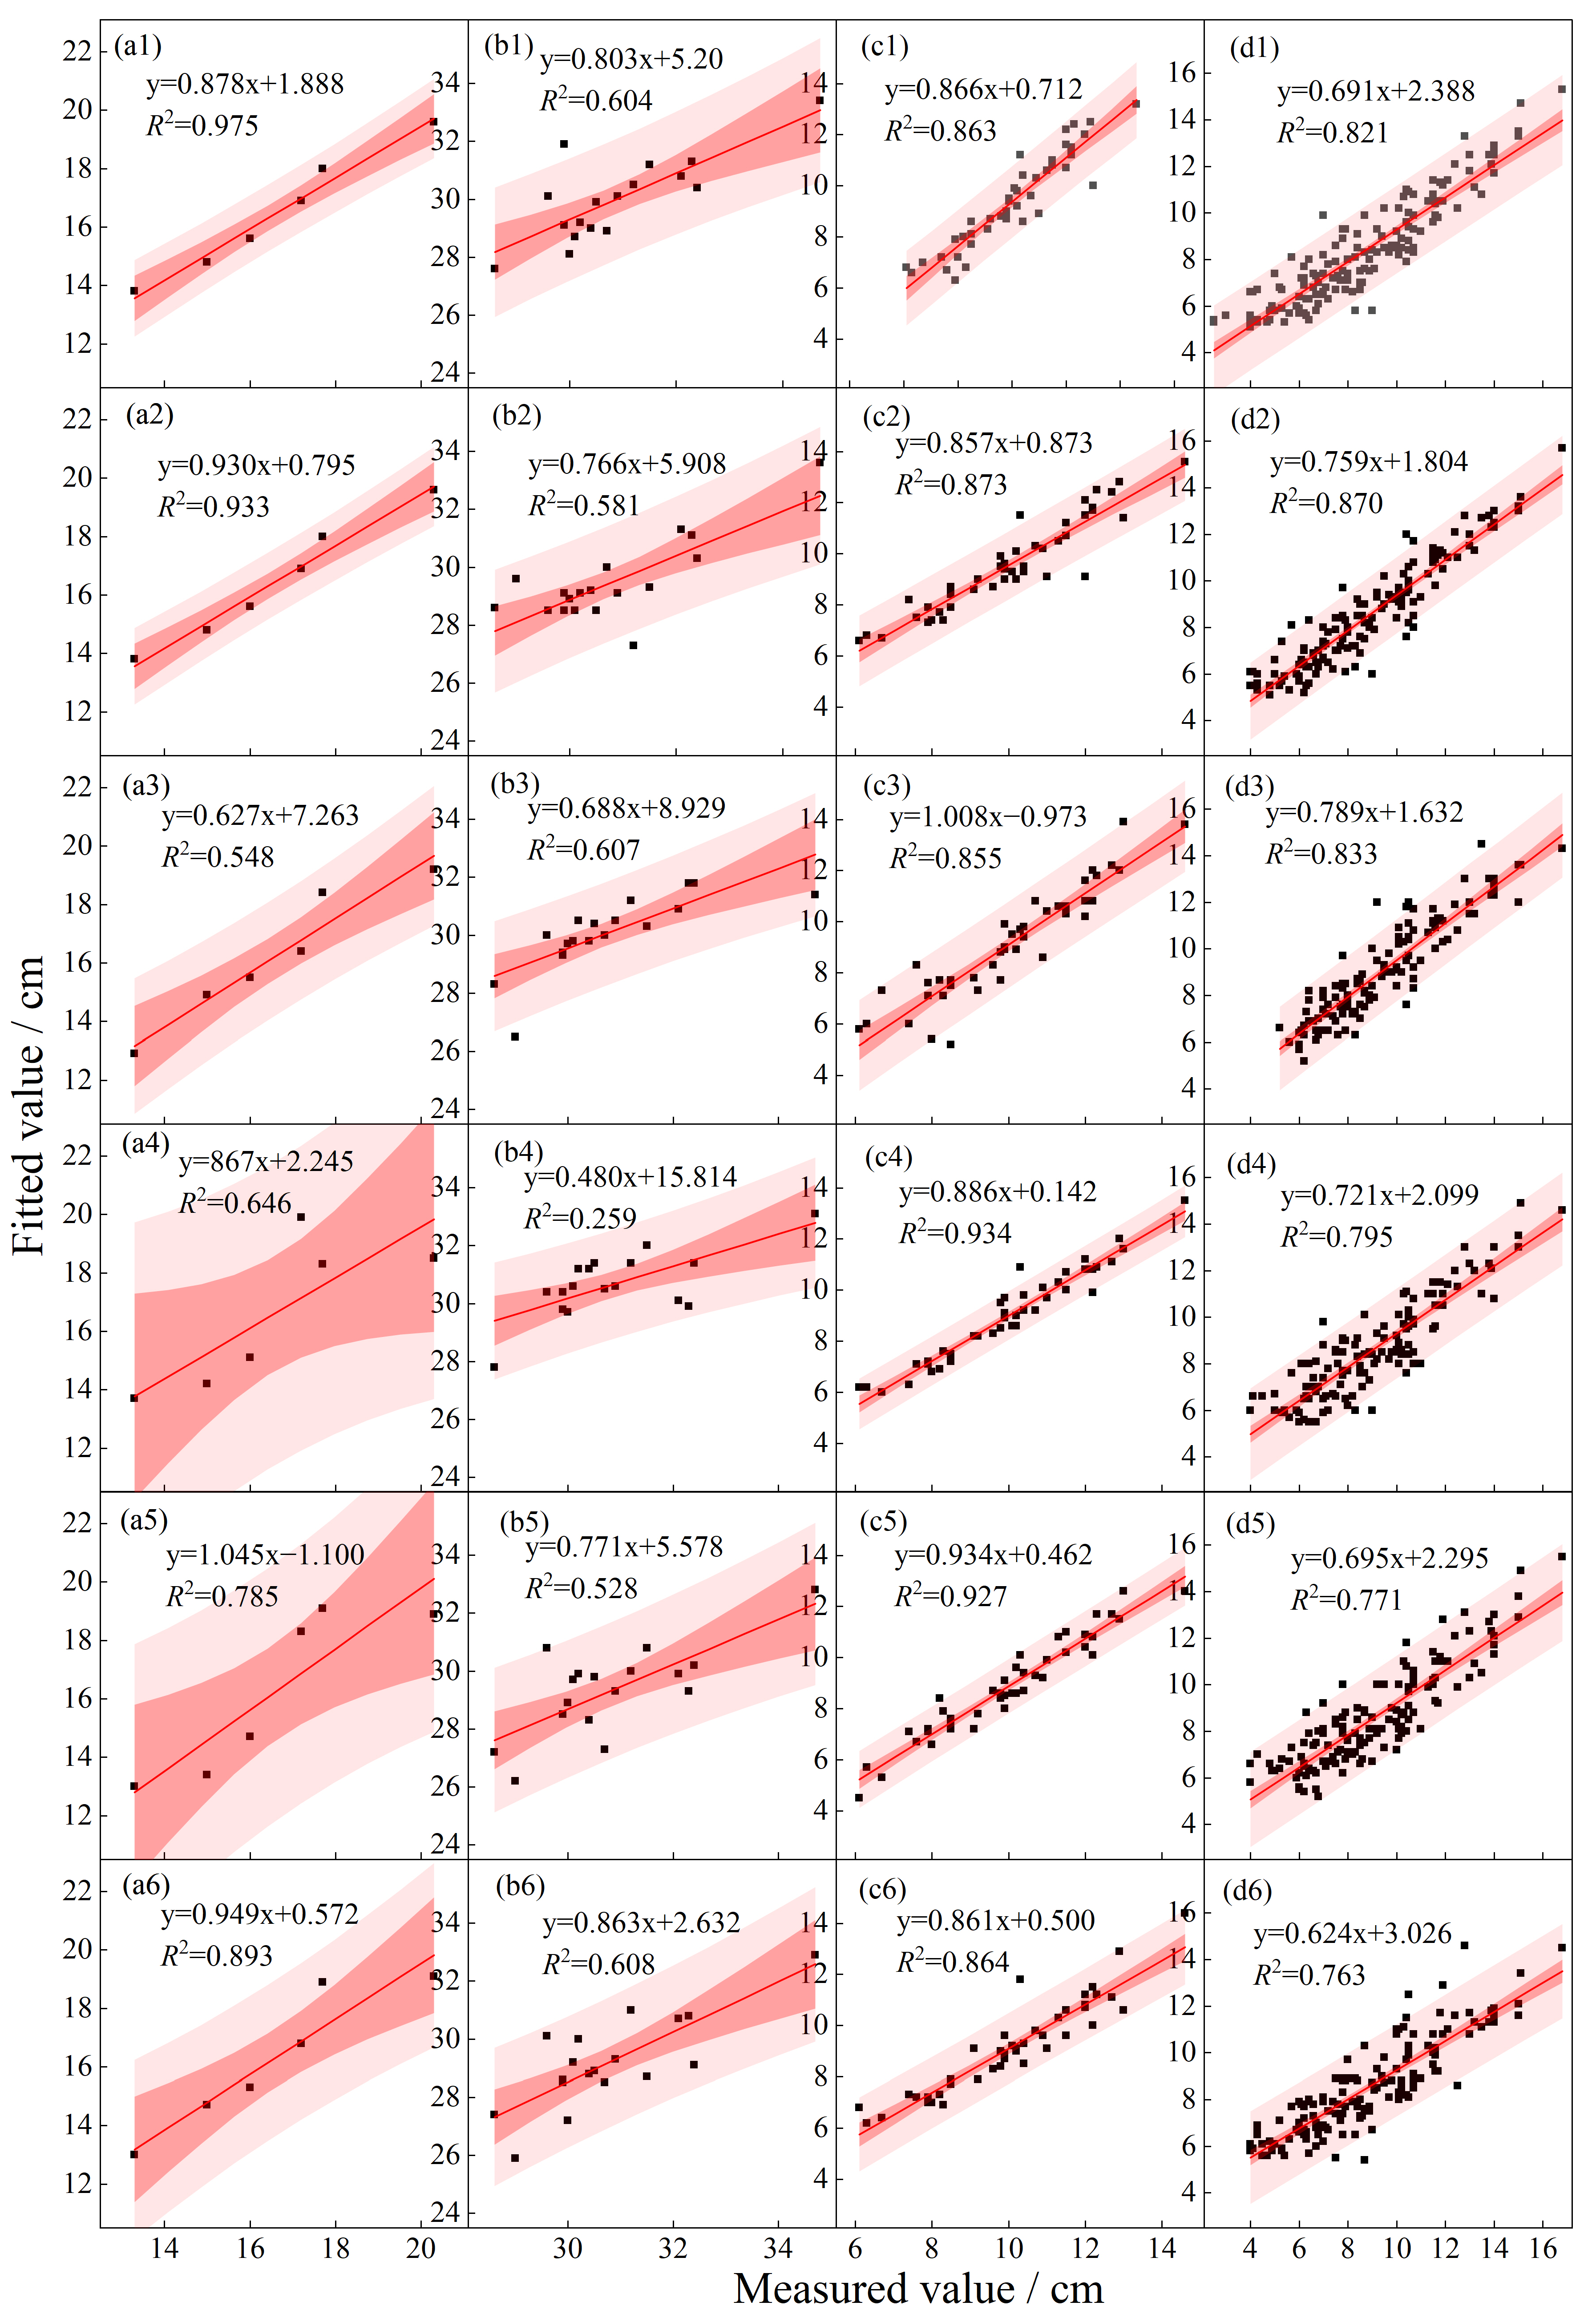
3.2. Analysis of the Estimation Precision of DBH for Different Routes

Overall, there were differences in the DBH estimation results of the four tree species under the six routes (Table 4). For C. cathayensis, route 1 and route 6 exhibited the highest precision, reaching 97.59% and 96.06%, respectively. The R2 value ranged from 0.548 to 0.975, indicating a relatively good DBH fitting. In particular, the R2 value of route 1 was as high as 0.975 (Figure 5(a1)). The RMSE and rRMSE were relatively low. The RMSE of route 1 was only 0.432, and the rRMSE was 2.61%, suggesting a small prediction error. This may be because the morphological characteristics of C. cathayensis were relatively regular, and the tree trunk could be easily and accurately identified and fitted in the point cloud data. Different routes could obtain the information of DBH part well during scanning.
For C. camphora, the DBH fitting precision was the highest in route 1 and route 3, which were 96.10% and 97.42%, respectively. The R2 value ranged from 0.259 to 0.607. Specifically, the R2 value of route 4 was the lowest at 0.259 (Figure 5(b4)), indicating a relatively poor linear relationship between the fitted DBH value and the measured value. The RMSE and rRMSE values were small. The RMSE of route 4 was relatively high at 0.985, and the rRMSE was 3.21%. The reason affecting the DBH fitting precision of C. camphora may be that the crown was dense, and some branches blocked the DBH part of the tree trunk, affecting the accuracy of the point cloud data. Moreover, the occlusion conditions were different when different routes scanned C. camphora, resulting in differences in data collection quality and thus affecting the fitting precision.
For K. bipinnata, DBH fitting precision was the highest in route 2 and route 4, which were 93.83% and 89.80%, respectively. The R2 value ranged from 0.855 to 0.935. The R2 value of route 4 was the highest at 0.934 (Figure 5(c4)). The RMSE and rRMSE values were small. The RMSE and rRMSE of route 4 were the smallest, which were 1.118 and 11.14%, respectively. Although the DBH fitting precision of K. bipinnata was relatively high, there was still a certain error.
For Q. acutissima, DBH fitting precision was the highest in route 3 and route 6, which were 90.79% and 84.53%, respectively. The R2 value ranged from 0.763 to 0.870. The R2 value of route 6 was the lowest at 0.763 (Figure 5(d6)). The RMSE of route 6 was the highest at 1.496, and the rRMSE was 17.06%. The reasons for the relatively low DBH fitting precision of Q. acutissima compared with the previous three tree species were not only its dense growth and difficult individual tree recognition but also the irregular trunk shape and complex bark texture, which increased the difficulty of DBH fitting.

3.3. Correlation Analysis of Factors Affecting the Fitting Precision of DBH

Through the study of DBH fitting precision of various tree species under different routes, it was found that there was a certain correlation between tree species characteristics and scanning routes. For C. cathayensis, its regular morphology enabled it to maintain a relatively high fitting precision under most scanning routes. However, the precision decreased in route 3. This may be because when this route passed through the C. cathayensis forest area, there was a certain deviation between the scanning angle and the growth direction or spatial distribution of C. cathayensis, resulting in insufficient information collection of some key parts. For C. camphora, its dense crown may cause occlusion problems during the point cloud scanning process of different routes. In route 4, due to the possible existence of more lateral scans, the influence of crown occlusion on DBH estimation was aggravated, and the R2 value dropped to 0.259. The DBH fitting precision of K. bipinnata was relatively high in route 2 and route 4. It is possible that when these two routes passed through its growth area, they can avoid the interference of branches and obtain relatively clear DBH point cloud data. Q. acutissima grows densely, which made it significantly affected by problems such as point cloud overlap and mutual occlusion of trees on different routes. For example, the low recognition rate in route 3 also indirectly affected DBH fitting precision.

4. Discussions

4.1. Influence of Tree Species Characteristics on the Results

Factors such as the morphological structure and growth density of tree species themselves have a significant impact on the processes of individual tree recognition and DBH fitting. C. cathayensis, C. camphora, and K. bipinnata may have relatively regular crown shapes and branch distributions, and their trunk morphologies are easy to distinguish. This leads to a high accuracy rate of individual tree recognition and relatively good DBH estimation precision. In contrast, Q. acutissima grows densely, its young plants have slender and cross-growing morphologies, and the trunk morphology is complex. As a result, it is difficult to recognize individual Q. acutissima trees, and DBH fitting precision is also low. Additionally, irregular trunk shapes (e.g., elliptical, leaning, or buttressed bases) in other species may further complicate DBH estimation, potentially leading to systematic biases in fitted values.
Therefore, when using backpack LiDAR for forest resource surveys, it is necessary to fully consider the characteristics of tree species and optimize the data collection and processing methods accordingly. For example, for tree species with complex morphologies, a multi-level adaptive individual tree segmentation algorithm [9] can be attempted to improve the recognition ability for trees with irregular morphologies. When fitting DBH, more suitable fitting methods should be selected according to the trunk characteristics of different tree species to improve the precision. Future research should explore species–specific correction models or integrate multi-angle LiDAR data to mitigate errors caused by non-circular trunk shapes.

4.2. Influence of Scanning Routes on the Results

Different scanning routes had a significant impact on the results. For example, route 1 performed well in the recognition rate of C. cathayensis and Q. acutissima and DBH estimation precision of C. cathayensis, but it was not the best for other tree species. This indicates that the scanning route needs to be selected according to the specific target tree species of the survey. For forest plots with a mixture of multiple tree species, a single scanning route may be difficult to meet the high-precision requirements of all tree species. Dynamic optimization of scanning routes based on real-time SLAM feedback could improve adaptability to complex forest structures, minimizing occlusion and maximizing data coverage.
In future research, methods for dynamically adjusting the scanning route can be explored. According to the distribution of tree species and the topographic and geomorphic characteristics in the plot, the scanning path can be optimized in real-time to improve the overall survey precision. Additionally, integrating machine learning algorithms to predict optimal routes based on species density and canopy structure would further enhance data quality. At the same time, the relationship between scanning route design, data collection density, and tree occlusion should be further studied. By reasonably planning the route, the impact of occlusion can be reduced, and the data collection quality can be improved, thereby enhancing individual tree recognition and DBH fitting precision.

4.3. Improvement of Data Processing Methods

Operations such as denoising, ground point classification, normalization, individual tree segmentation, and DBH fitting in the data processing stage are crucial to the results [23]. In this study, although some conventional data processing methods have been adopted, there is still room for improvement. Advanced denoising algorithms could further reduce noise while preserving fine structural details. For example, the current method’s reliance on manual seed-point placement and geometric thresholds highlights its limitations for complex forest structures. Automated seed-point generation based on point cloud density and trunk geometry features could enhance segmentation efficiency and robustness.
Future work could incorporate deep learning algorithms (e.g., PointNet [24]) to automate segmentation and improve robustness, particularly for species like Quercus acutissima with irregular morphologies. Hybrid approaches combining traditional geometric methods with deep learning features may offer a balance between computational efficiency and accuracy. When fitting DBH, in addition to the least-squares method, other more adaptable fitting methods can be explored, or multiple fitting methods can be combined to complement each other’s advantages so as to reduce errors and improve DBH fitting precision. Moreover, integrating multi-source data could provide contextual information to refine DBH estimates.

5. Conclusions

In this study, backpack LiDAR was used to collect data from forest plots of four tree species: C. cathayensis, C. camphora, K. bipinnata, and Q. acutissima. Point cloud data were obtained through different scanning routes, and then the individual tree recognition results and DBH fitting precision were analyzed. The research showed that the individual tree recognition rates of C. cathayensis, C. camphora, and K. bipinnata reached 100% under all scanning routes. In contrast, the recognition rate of Q. acutissima was relatively low, ranging from 64.71% to 78.07%, and different scanning routes had a significant impact on the recognition rate of Q. acutissima.
Regarding DBH fitting precision, C. cathayensis and C. camphora generally had relatively high precision, followed by K. bipinnata, while Q. acutissima had relatively low precision. The precision performance of each tree species varied under different routes, and no single route was optimal for all tree species. Factors such as tree species characteristics, scanning routes, and data processing methods jointly affected the results of individual tree recognition and DBH fitting. Different tree species have different adaptabilities to scanning routes, and optimization still needs to be carried out according to different tree species and actual situations.

Author Contributions

Conceptualization, L.L., L.W. and N.L.; methodology, L.L. and L.W.; software, L.W. and S.Z.; validation, L.W., S.Z. and N.L.; data curation, L.W., M.H. and J.M.; formal analysis, L.W., N.L. and M.H.; funding acquisition, L.L. and L.W.; investigation, L.L., L.W., N.L., S.Z., M.H. and J.M.; visualization, L.L., L.W. and N.L.; writing—original draft preparation, L.L., L.W. and N.L.; writing—review and editing, L.L., L.W., N.L., S.Z., M.H. and J.M.; supervision, N.L. All authors have read and agreed to the published version of the manuscript.

Funding

This research was funded by the Natural Science Research Project for Anhui Universities (Grant No. 2023AH030094, YQZD2024045, 2023AH051606, 2022AH051111, and KJ2020A00706), Anhui Province Key Laboratory of Physical Geographic Environment (grant no. 2022PGE004), and National College Student Innovation and Entrepreneurship Training Project (Grant No. 202410377014 and 202410377017).

Data Availability Statement

The data that support the findings of this study are available from the corresponding author upon reasonable request.

Conflicts of Interest

The authors declare no conflicts of interest.

References

  1. Xiang, B.; Wielgosz, M.; Kontogianni, T.; Peters, T.; Puliti, S.; Astrup, R.; Schindler, K. Automated Forest Inventory: Analysis of High-Density Airborne LiDAR Point Clouds with 3D Deep Learning. Remote Sens. Environ. 2024, 305, 114078. [Google Scholar] [CrossRef]
  2. Zhao, Y.; Im, J.; Zhen, Z.; Zhao, Y. Towards accurate individual tree parameters estimation in dense forest: Optimized coarse-to-fine algorithms for registering UAV and terrestrial LiDAR data. Giscience Remote Sens. 2023, 60, 26. [Google Scholar] [CrossRef]
  3. Shoot, C.; Andersen, H.; Moskal, L.; Babcock, C.; Cook, B.; Morton, D. Classifying Forest Type in the National Forest Inventory Context with Airborne Hyperspectral and Lidar Data. Remote Sens. 2021, 13, 1863. [Google Scholar] [CrossRef]
  4. Zhang, Z.; Cao, L.; She, G. Estimating Forest Structural Parameters Using Canopy Metrics Derived from Airborne LiDAR Data in Subtropical Forests. Remote Sens. 2017, 9, 940. [Google Scholar] [CrossRef]
  5. Wood, C.M.; Bunce, R.G.H. Ecological survey of the native pinewoods of Scotland 1971. Earth Syst. Sci. Data 2016, 8, 177–189. [Google Scholar] [CrossRef]
  6. Tao, S.; Wu, F.; Guo, Q.; Wang, Y.; Li, W.; Xue, B.; Hu, X.; Li, P.; Tian, D.; Li, C.; et al. Segmenting Tree Crowns from Terrestrial and Mobile LiDAR Data by Exploring Ecological Theories. ISPRS J. Photogramm. Remote Sens. 2015, 110, 66–76. [Google Scholar] [CrossRef]
  7. Zhang, Z.; Wang, T.; Skidmore, A.K.; Cao, F.; She, G.; Cao, L. An Improved Area-Based Approach for Estimating Plot-Level Tree DBH from Airborne LiDAR Data. For. Ecosyst. 2023, 10, 100089. [Google Scholar] [CrossRef]
  8. Xiong, J.; Zeng, H.; Cai, G.; Li, Y.; Chen, J.M.; Miao, G. Crown Information Extraction and Annual Growth Estimation of a Chinese Fir Plantation Based on Unmanned Aerial Vehicle–Light Detection and Ranging. Remote Sens. 2023, 15, 3869. [Google Scholar] [CrossRef]
  9. Lu, J.; Wang, H.; Qin, S.; Cao, L.; Pu, R.; Li, G.; Sun, J. Estimation of aboveground biomass of Robinia pseudoacacia forest in the Yellow River Delta based on UAV and Backpack LiDAR point clouds. Int. J. Appl. Earth Obs. Geoinf. 2020, 86, 102014. [Google Scholar] [CrossRef]
  10. Deng, L.; Fu, B.; Wu, Y.; He, H.; Sun, W.; Jia, M.; Deng, T.; Fan, D. Comparison of 2D and 3D Vegetation Species Mapping in Three Natural Scenarios Using UAV-LiDAR Point Clouds and Improved Deep Learning Methods. Int. J. Appl. Earth Obs. Geoinf. 2023, 125, 103588. [Google Scholar] [CrossRef]
  11. Balestra, M.; Marselis, S.; Sankey, T.T.; Cabo, C.; Liang, X.; Mokroš, M.; Peng, X.; Singh, A.; Stereńczak, K.; Vega, C.; et al. LiDAR Data Fusion to Improve Forest Attribute Estimates: A Review. Curr. For. Rep. 2024, 10, 281–297. [Google Scholar] [CrossRef]
  12. Xie, Y.; Yang, T.; Wang, X.; Chen, X.; Pang, S.; Hu, J.; Wang, A.; Chen, L.; Shen, Z. Applying a Portable Backpack Lidar to Measure and Locate Trees in a Nature Forest Plot: Accuracy and Error Analyses. Remote Sens. 2022, 14, 1806. [Google Scholar] [CrossRef]
  13. Ruhan, A.; Du, W.; Ying, H.; Wei, B.; Shan, Y.; Dai, H. Estimation of Aboveground Biomass of Individual Trees by Backpack LiDAR Based on Parameter-Optimized Quantitative Structural Models (AdQSM). Forests 2023, 14, 475. [Google Scholar] [CrossRef]
  14. Su, R.; Du, W.; Shan, Y.; Ying, H.; Rihan, W.; Li, R. Aboveground Carbon Stock Estimation Based on Backpack LiDAR and UAV Multispectral Imagery at the Forest Sample Plot Scale. Remote Sens. 2024, 16, 3927. [Google Scholar] [CrossRef]
  15. Chen, C.; Zhou, L.; Li, X.; Zhao, Y.; Yu, J.; Lv, L.; Du, H. Optimizing the Spatial Structure of Metasequoia Plantation Forest Based on UAV-LiDAR and Backpack-LiDAR. Remote Sens. 2023, 15, 4090. [Google Scholar] [CrossRef]
  16. Su, Y.; Guo, Q.; Jin, S.; Guan, H.; Li, Y. The Development and Evaluation of a Backpack LiDAR System for Accurate and Efficient Forest Inventory. IEEE Geosci. Remote Sens. Lett. 2020, 18, 9. [Google Scholar] [CrossRef]
  17. Yang, S.; Xing, Y.; Xing, T.; Deng, H.; Xi, Z. Multisensors Fusion SLAM-Aided Forest Plot Mapping with Backpack Dual-LiDAR System. IEEE J. Sel. Top. Appl. Earth Obs. Remote Sens. 2024, 17, 16051–16070. [Google Scholar] [CrossRef]
  18. Tanduo, B.; Martino, A.; Balletti, C.; Guerra, F. New Tools for Urban Analysis: A SLAM-Based Research in Venice. Remote Sens. 2022, 14, 4325. [Google Scholar] [CrossRef]
  19. Li, L.; Wei, L.; Li, N.; Zhang, S.; Wu, Z.; Dong, M.; Chen, Y. Extracting the DBH of Moso Bamboo Forests Using LiDAR: Parameter Optimization and Accuracy Evaluation. Forests 2024, 15, 804. [Google Scholar] [CrossRef]
  20. Hui, Z.; Cheng, P.; Yang, B.; Zhou, G. Multi-Level Self-Adaptive Individual Tree Detection for Coniferous Forest Using Airborne LiDAR. Int. J. Appl. Earth Obs. Geoinf. 2022, 114, 103028. [Google Scholar] [CrossRef]
  21. Jiang, T.; Liu, S.; Zhang, Q.; Xu, X.; Sun, J.; Wang, Y. Segmentation of individual trees in urban MLS point clouds using a deep learning framework based on cylindrical convolution network. Int. J. Appl. Earth Obs. Geoinf. 2023, 123, 103473. [Google Scholar] [CrossRef]
  22. Jiang, R.; Lin, J.; Li, T. Refined Aboveground Biomass Estimation of Moso Bamboo Forest Using Culm Lengths Extracted from TLS Point Cloud. Remote Sens. 2022, 14, 5537. [Google Scholar] [CrossRef]
  23. Wang, A.; Wang, J.; Li, H.; Hu, J.; Zhou, H.; Zhang, X.; Liu, X.; Wang, W.; Zhang, W.; Wu, S.; et al. Tree Parameter Extraction Method Based on New Remote Sensing Technology and Terrestrial Laser Scanning Technology. Big Data Res. 2024, 36, 100460. [Google Scholar] [CrossRef]
  24. Xia, K.; Li, C.; Yang, Y.; Deng, S.; Feng, H. Study on Single-Tree Extraction Method for Complex RGB Point Cloud Scenes. Remote Sens. 2023, 15, 2644. [Google Scholar] [CrossRef]
Figure 1. Distribution of sample plots in the study area. (a) Anhui Province, (b) Chuzhou City, (c1c4) C. cathayensis, C. camphora, K. bipinnata, and Q. acutissima.
Forests 16 00527 g001
Figure 2. Different scanning route maps. (af) represent schematics diagrams of routes 1–6, and (gl) are route trajectories during data acquisition, the black arrows represent the walking directions, the numbers indicate the sequence, and the blue arrows represent the directions of the circular paths.
Forests 16 00527 g002
Figure 3. Flowchart of the methodology in this study.
Forests 16 00527 g003
Figure 4. Sectional image of the point cloud of DBH; (ad) are C. cathayensis, C. camphora, K. bipinnata, and Q. acutissima, respectively.
Forests 16 00527 g004
Figure 5. Accuracy of DBH under different routes in different woods. (Among them, (ad) represent four types of trees, and (16) represent different scanning routes).
Forests 16 00527 g005
Table 1. Backpack LiDAR parameters.
Performance Indicators.Parametric
LasersVLP16
Radar Accuracy±3 cm
Relative Accuracy≤3 cm
Absolute Precision5 cm
SizesL270 mm × W210 mm × H120 mm
Laser Wavelength903 nm
Scanning Frequency300,000 pts/s
Horizontal Field of View280°~360°
Vertical Field of View−90°~90°
Scanning Distance100 m
Table 2. Summary of sample site information.
PlotDominant
Tree Species
Number of Trees
(n)
Trees per Hectare
(N/ha)
DBH Range
(cm)
Average DBH
(cm)
Standard
Deviation
Elevation
(m)
Slope
(°)
1C. cathayensis615013.3–20.316.62.4137.182
2C. camphora1845028.6–34.730.81.4419.323
3K. bipinnata4310756.1–14.610.01.9634.662
4Q. acutissima18746751.8–16.87.63.2976.023
Table 3. Results of single tree identification of different routes.
Tree SpeciesRouteNumber of Plants IdentifiedNumber of Undetected StrainsRecognition Rate
C. cathayensisRoute 160100%
Route 260100%
Route 360100%
Route 460100%
Route 560100%
Route 660100%
C. camphoraRoute 1160100%
Route 2160100%
Route 3160100%
Route 4160100%
Route 5160100%
Route 6160100%
K. bipinnataRoute 1430100%
Route 2430100%
Route 3430100%
Route 4430100%
Route 5430100%
Route 6430100%
Q. acutissimaRoute 11464178.07%
Route 21404777%
Route 31216664.71%
Route 41325570.59%
Route 51345371.66%
Route 61444377.01%
Table 4. DBH fitting results of different routes.
Tree SpeciesRouteAccuracyR2RMSErRMSE
C. cathayensisRoute 197.59%0.9750.4322.61%
Route 296.53%0.9330.6784.09%
Route 389.82%0.5481.8511.15%
Route 493.01%0.6461.4438.70%
Route 592.96%0.7851.2567.58%
Route 696.06%0.8930.7864.74%
C. camphoraRoute 196.10%0.6041.2754.13%
Route 295.29%0.5811.6005.20%
Route 397.42%0.6071.1253.66%
Route 497.47%0.2590.9853.21%
Route 594.43%0.5281.8245.93%
Route 694.31%0.6081.8626.05%
K. bipinnataRoute 192.52%0.8630.9559.52%
Route 293.83%0.8730.8308.27%
Route 389.62%0.8551.20412.00%
Route 489.80%0.9341.11811.14%
Route 588.48%0.9271.24012.35%
Route 690.16%0.8641.14711.43%
Q. acutissimaRoute 184.57%0.8210.91410.22%
Route 288.92%0.8700.94810.60%
Route 390.79%0.8331.08411.44%
Route 487.61%0.7951.29514.12%
Route 586.40%0.7711.40315.40%
Route 684.53%0.7631.49617.06%
Disclaimer/Publisher’s Note: The statements, opinions and data contained in all publications are solely those of the individual author(s) and contributor(s) and not of MDPI and/or the editor(s). MDPI and/or the editor(s) disclaim responsibility for any injury to people or property resulting from any ideas, methods, instructions or products referred to in the content.

