Article

Response of Growth and Non-Structural Carbohydrates’ Allocation in Pinus yunnanensis Seedlings to Simulated Sunflecks

1
The Key Laboratory of Forest Resources Conservation and Utilization in the Southwest Mountains of China, Ministry of Education, Southwest Forestry University, Kunming 650224, China
2
Key Laboratory of National Forestry and Grassland Administration on Biodiversity Conservation in Southwest China, Southwest Forestry University, Kunming 650224, China
3
Guangxi Zhuang Autonomous Region Baise City Forestry Research Institute, Baise 533000, China
*
Author to whom correspondence should be addressed.
These authors contributed equally to this work.
Forests 2025, 16(3), 522; https://doi.org/10.3390/f16030522
Submission received: 19 February 2025 / Revised: 10 March 2025 / Accepted: 13 March 2025 / Published: 16 March 2025
(This article belongs to the Section Forest Ecophysiology and Biology)

Abstract

:
In recent years, it has been found that the phenomenon of ‘only seedlings but no young trees’ is very serious in P. yunnanensis forest, which is very unfavourable to the natural regeneration and succession of seedlings in P. yunnanensis forest. Through research on the growth and non-structural carbohydrates (NSCs) content of various organs under different shading treatments, this study provides a theoretical basis for understanding the regeneration difficulties of P. yunnanensis and strengthening the scientific conservation of P. yunnanensis forests. In this study, we set up shade treatments for potted P. yunnanensis seedlings by constructing shade shelters and simulated sunflecks by opening the shade net at noon; we set up five treatments, namely the control (natural light), 80% shade with the net open at noon for 1 h (T80-1), 80% shade all the time (T80), 95% shade with the net open at noon for 1 h (T95-1), and 95% shade all the time (T95). The changes in seedling height and diameter and the NSCs content of various organs of P. yunnanensis seedlings were determined after shading. The results showed that 80% and 90% shading significantly inhibited the growth of P. yunnanensis seedlings and reduced the biomass of each organ. While the needle–biomass ratio of P. yunnanensis increased, the fine root–biomass ratio and root–crown ratio tended to decrease. The starch content and NSCs content of each organ decreased, and the soluble sugar–starch ratio of each organ tended to increase. Under the simulated sunfleckssunfleckstreatment, P. yunnanensis seedlings had increased aboveground biomass investment and also decreased storage of thick root starch, which was decomposed and invested into the aboveground part. This indicates that the transient high intensity of Sunfleckssunflecksmitigation alleviated the adverse effects of shading on seedling carbon reserves and increased the adaptability of P. yunnanensis seedlings to prolonged shading.

1. Introduction

Light is one of the most important ecological factors affecting plant growth and determining the renewal and succession of understorey tree species. When plants are exposed to different light environments, they respond to changes in the light environment through morphological and physiological changes. Therefore, plants perform a series of morphological and functional adaptations according to the intensity of light in their habitats in order to efficiently utilise light energy in the environment and enhance ecological resilience. When plants are exposed to low light, they usually increase plant height to improve light energy capture efficiency, resulting in thinner leaves and increased leaf area [1], whereas under high light, plants reduce leaf area to avoid photoinhibition caused by absorbing excessive light energy by decreasing inputs of leaf biomass [2]. Plants have been found to be ‘tall and thin’ in shade and ‘short and thick’ in full light [3]. This suggests that plants devote more biomass to longitudinal growth under low-light conditions. However, Walters et al. [4] revealed that under low-light conditions, shade-tolerant species sustain minimal positive growth through morphological plasticity and metabolic optimisation, thereby achieving long-term survival, while light-intolerant species rely on high-light-driven rapid growth strategies but face resource allocation mismatches and heightened mortality risks in shaded environments. In addition, light has an effect on the distribution of plant biomass, with reduced light restricting the growth of below-ground parts significantly more than above-ground parts, as evidenced by a greater reduction in root biomass, a smaller reduction in leaf biomass, and a decrease in the root-to-shoot ratio [5]. Therefore, when light is limited, more photosynthetic products are allocated to aboveground parts, especially leaves, to produce carbohydrates through leaf photosynthesis to sustain plant growth. Most plants show different changes in morphological as well as physiological characteristics under shading conditions. During tree growth, the seedling period is the most vulnerable stage of growth and the most sensitive to changes in the light environment. Under different light conditions, plant morphology and its physiological characteristics show obvious differences, and these differences are the adaptive changes made by plants themselves due to the light environment. Therefore, how to reasonably set light conditions is the key to cultivating strong tree seedlings. In addition, stand density and the degree of depression also affect the utilisation of light by plants, and the canopy in a forest results in a variable quantity and quality of light in the forest, thus affecting the growth and survival of saplings [6]. In general, the higher the stand density and the higher the stand closure are, the greater the biomass and carbon storage are, but in forests where there is intense competition for light among trees, the understorey is compressed, its leaves are shed, its photosynthetic area is reduced, and its growth gradually stagnates or even dies [2,3].
After forest closure, regeneration occurs mainly within the forest window, relying on rapid plant growth and thus favourable positions in the forest window canopy. In addition, sunflecks in the forest are important for understorey plant growth. Sunflecks are spots of light that pass through small- and medium-sized gaps in the canopy and move in response to changes in the angle of incoming sunlight [7]; in depressed forests, sunflecks can change the flux of photons impinging on forest understorey leaves tens of times over a period of several seconds. It has been suggested that light patches provide 20%–0% of the light energy for carbon fixation in forest understorey plants. As plants grow, they encounter low light in the understorey or high-light environments in forest windows and on bare ground, so in addition to temperature and moisture, light is an important limiting factor affecting the survival, growth, and regeneration of seedlings or young trees in the understorey. Seedling germination in pre-successional plants requires a better light environment, but in forests, the shading of the canopy often results in decreased light and therefore restricts the growth and survival of young trees, so increasing the intensity of light favours the occurrence of natural forest regeneration. Factors such as drought, shading, and damage by leaf-feeding pests may all contribute to plant carbon uptake barriers [8]. It has been shown in previous studies that carbon uptake limitation affects plant carbon balance and that prolonged carbon uptake limitation can lead to carbon starvation [9], which in turn may affect plant growth, carbon allocation, hydrodynamic structure, and resilience [10], and when carbon uptake restriction is lifted, plant carbon starvation will gradually recover. But, these studies did not show the recovery process after carbon restriction nor the time experienced by the plant in the process of recovery nor the effect of the recovery process on the allocation of carbon [9,10]. Studying the carbon starvation status of plants in this simulated sunfleck environment is beneficial to better understanding the growth, carbon allocation, and stress tolerance of plants during carbon starvation recovery. Therefore, studying the carbon starvation status of plants in simulated sunfleck environments, as well as their growth, carbon allocation, and stress tolerance during carbon starvation recovery, is conducive to a better understanding of the recovery process of plants after coping with carbon sequestration stress.
Non-structural carbohydrates (NSCs) are the main products of plant photosynthesis, in which all life activities are involved, and largely influence the growth and development of forest trees [11]. They are also a temporary store of tree carbohydrates accumulated during overproduction [12] and an important energy supply substance during tree growth and metabolism [13], and their concentration usually reflects the overall carbon supply of the plant [14], characterising the ability of trees to grow and survive [15,16] and their buffering capacity against external disturbances [17,18]. Therefore, exploring NSCs content in plants is an effective way to understand plants’ carbon supply and their growth and survival status. Liu et al. [19] studied the concentration, distribution, and seasonal dynamic characteristics of non-structural carbohydrates and their fractions in the canopy, sub-canopy, and understorey of a monsoon evergreen broadleaf forest in Pu’er, Yunnan. It was concluded that the concentrations of NSCs and their fractions varied among trees at different heights in Puer monsoon evergreen broadleaf forest, with higher concentrations of soluble sugars in the sub-canopy layer indicating that plants in the sub-canopy layer invested more carbon in plant growth, whereas lower concentrations of NSCs in the understorey layer were affected by lower yields of photosynthesis products, on one hand, and, on the other hand, were due to the carbon utilisation strategy of plants in this layer of investing more NSCs into the growth of leaves and roots. This study further illustrated the different carbon utilisation strategies of plants in different layers of the forest through the differences in the soluble sugar–starch ratios: the understorey used more carbon for long-term energy storage as a means of adapting to the long-term shade environment, whereas the canopy and sub-canopy layers used more carbon for growth.
P. yunnanensis is an endemic tree species in the southwest of China, and it is the pioneering species of forestation in the barren mountains of the Yunnan–Guizhou Plateau, as well as the main forest species in Yunnan Province, with an area of about 52% of the forest area in Yunnan Province [20]. P. yunnanensis has an irreplaceable role in Yunnan’s forestry economy and environmentally sustainable development. At present, the phenomenon of ‘only seeing seedlings but not young trees’ is quite common in P. yunnanensis forests. Since the 1980s, some scholars have started to carry out a large number of studies on impacts on P. yunnanensis, mainly including changes in the morphology and growth of P. yunnanensis seedlings in stressful environments [21], characteristics of community structure [22], characteristics of seed ecological adaptations [23], the insect pests and diseases of P. yunnanensis [24], shade nutrient changes in P. yunnanensis seedlings in shade environments [25], and its response to climate change [26].
Our previous study demonstrated that P. yunnanensis seedlings under shaded conditions allocated more non-structural carbohydrates (NSCs) to morphological growth and enhanced soluble sugar–starch conversion to adapt to light intensity variations. However, heavy shade levels significantly impaired plant growth by reducing photosynthetic capacity and disrupting carbon balance [25]. Additionally, research on the effects of light patches on understorey plant growth has declined in recent years [27,28]. Field surveys indicate a striking demographic bottleneck: although numerous P. yunnanensis seedlings emerge annually in both plantations and natural forests, young trees are rarely observed. We hypothesise that this phenomenon arises because the closed canopy of mature P. yunnanensis trees creates prolonged heavy shading in the understorey, leading to seedling mortality. Therefore, investigating the physiological and ecological responses of P. yunnanensis seedlings to different light environments is critical to elucidating the species’s regeneration barriers. Previous studies have established that sunflecks are key drivers of understorey carbon gain in tropical forests [7,9]; however, their role in the regeneration of temperate conifers, particularly P. yunnanensis, remains poorly understood. To address this gap, we conducted a shading and simulated sunfleck experiment to explore the adaptation mechanisms of P. yunnanensis seedlings under variable light conditions. We hypothesised that severe shading would limit photosynthesis and induce carbon starvation, whereas sunflecks would mitigate carbon deficits in seedlings. This study provides a theoretical foundation for the conservation of P. yunnanensis forests.

2. Materials and Methods

2.1. Study Site and Plant Material

The experimental site was located in the Tree Park of the Southwest Forestry University in Kunming (Kunming, China, E 102°46′, N 25°03′). The region has a low northern latitude with a subtropical–plateau mountain monsoon climate, with long sunshine and short frost periods due to the warm and humid airflow from the southwestern part of the Indian Ocean, with an average annual temperature of 15 °C, average annual sunshine of about 2200 h, a frost-free period of more than 240 days, and annual precipitation of 1450 mm. The soil used in the experiment was a mixture of local red loam soil and humus at a ratio of 3:2 by volume, with a 28.49% water holding capacity in the field measured by the ring knife method, a capacity of 1.00 g·cm−3, soil contents of whole carbon, nitrogen, and phosphorus of 3.26 g·kg−1, 5.98 g·kg−1, and 0.62 g·kg−1, and a pH = 6.65.
On 1 August 2021, the P. yunnanensis seed selected by the project team (seed number: Yun R-SS-PY-035-2020) was selected from the forest (Malonghe Forestry Farm, Shuangbai County, China), and the seed was cultivated in Malonghe Forestry Farm, Shuangbai County, for 8 months and then transported to the Tree Park of the Southwest Forestry University for transplanting and planting cultivation in April 2022. One hundred and fifty P. yunnanensis seedlings were selected and transplanted into plastic pots with a calibre of 20.5 cm, a height of 18.5 cm, and a ground diameter of 14.5 cm. Each pot was planted with vigorously growing seedlings (plant height: 4.12 ± 0.13 cm; stem diameter: 5.42 ± 0.15 mm). The transplanted seedlings were placed in the experimental plot, which was covered with mulch as a means of preventing the adverse effects of groundwater vapour on the potted plants. During the experiment, the relative soil moisture content was maintained at 80 ± 5% FC, i.e., the actual moisture content ranged from 36.77% to 41.67%. Actual soil water concentrations were measured with a soil moisture metre and controlled using the weighing method, where all pots were weighed daily at 17:00, the weight was noted, and water control or watering was performed according to the target weight.

2.2. Experimental Design

In late January 2021, the light intensity in the understorey of the middle-aged P. yunnanensis forest was measured by an auto-ranging illuminance metre (LI-250A, Li-Cor, Lincoln, NE, USA) at about 12:00 p.m. on a sunny day. According to the shading situation in the forest, a shade shelter (80% shade, light intensity of 3.06 × 10⁴ to 2.73 × 10⁴ Lx) was designed to have a light intensity in the net equal to 20% of that of the open field at noon on a sunny day, which means that 80% of the total light was blocked; another shade shelter (95% shade, light intensity of 1.11 × 10⁴ to 0.71 × 10⁴ Lx) was designed to have a light intensity equal to 5% of that of the open field at noon on a sunny day (light intensity of 14.06 × 10⁴ Lx to 14.42 × 10⁴ Lx), which means that 95% of the total light was blocked, which also corresponded to the light intensity of the understorey of P. yunnanensis. The light intensity in this experiment was also based on the results of our previous shade experiment: shade treatment of more than 70% was not suitable for the growth of P. yunnanensis seedlings [25]. Therefore, in this experiment, we used the potting method to simulate the forest sunfleck phenomenon, i.e., 80% shade all the time (T80), 80% shade with the shed open at noon for 1 h (T80-1), 95% shade all the time (T95), and 95% shade with the shed open at noon for 1 h (T95-1). When the simulation of forest light patches was performed by leaving the west side of the shade shed completely open for 1 h every day at around 1:00 after the start of shading, this part of the seedlings received sunlight to simulate light patches in the forest, and the rest of the seedlings were kept in shade all the time. The seedling height and ground diameter of all the surviving seedlings were also determined, weighed, and sampled as local values before they were unshaded. The heavy shade trial started in June 2022 and ended in October 2022; it lasted for a total of 120 days. During the shading period, an auto-ranging illuminance metre (LI-250A, Li-Cor, Lincoln, NE, USA) was used to measure the natural light intensity above the double-layer black shade net and the light intensity inside the same vertical shade net, and the ratio of the difference between the light intensity and the natural light intensity was the shading rate, and the average value was calculated to obtain the shading rate of the heavy-shading environment.

2.3. Indicator Measurement

In the simulated sunfleck test, the shading was set at 80% shade and 95% shade, and the control group was exposed to normal light; each treatment had 20 seedlings each, with a total of 100 seedlings, and the growth indicators were measured at the end of the 120-day test and destructive sampling was performed, with 5 plants taken from each treatment and 25 plants taken in total. In this case, the plant height was measured from the ground to the top of the P. yunnanensis seedlings using a straightedge (accuracy of 0.1 cm), and the ground diameter was measured with a vernier calliper (accuracy 0.01 mm). The samples were divided into four parts (needles, stems, thick roots (diameter greater than 2 mm), and fine roots (diameter less than 2 mm)), sorted into and labelled in envelopes, heated at 105 °C for 30 min for sanitisation, and then dried at 80 °C to a constant weight; then, the biomass of each organ was recorded, then crushed and sieved, and stored for the determination of the NSCs (soluble sugars and starch) content. We calculated the needle–biomass ratio (needle weight/total plant weight), stem–biomass ratio (stem weight/total plant weight), thick root–biomass ratio (thick root weight/total plant weight), fine root–biomass ratio (fine root weight/total plant weight), and root-to-shoot ratio ((thick root weight + fine root weight)/(needle weight + stem weight)). In this study, non-structural carbohydrates (NSCs) refer to the sum of soluble sugar and starch. Soluble sugar and starch contents were determined by the phenol colorimetric method [20,25,29]. The pattern of the investment (reserves) and distribution (percentage of total) of non-structural carbohydrates was extrapolated from the content and the biomass of the corresponding building blocks (needles, stems, thick roots, fine roots). That is, soluble sugar storage in each organ (needles, stems, thick roots, and fine roots) = soluble sugar content of (needles, stems, thick roots, and fine roots) × biomass of (needles, stems, thick roots, and fine roots), and the allocation of starch and NSCs storage was performed as such.

2.4. Statistical Analysis

The data were organised using Microsoft Excel 2016 (Microsoft Corp.) and SPSS 26.0 (IBM). One-way and two-way analyses of variance (ANOVA) were performed, and Duncan’s tests were used for post hoc comparisons between treatments. Before ANOVA, data normality tests and variance chi-square tests were performed. The data were presented as mean ± standard deviation (n = 5), and Origin 9.8. and graphpad prism8.0 were employed to plot the data.
Plasticity index: P = (Xmax − Xmin)/Xmax, where Xmax and Xmin denote the maximum and minimum values of each indicator.

3. Results

3.1. Effects of Different Shading and Simulated Sunfleck Treatments on Seedling Height and Ground Diameter of P. yunnanensis Seedlings

Both the seedling height and ground diameter growth of P. yunnanensis seedlings decreased with the increase in shading degree treatment and simulated sunfleck treatment (Table 1). The seedling height decreased by 29.59% and 23.29% in the two treatments (T80 and T80-1) with 80% shade compared to CK and decreased by 47.40% and 39.45% in the two treatments (T95 and T95-1) with 95% shade compared to CK. The shade rate of 80% in two treatments (T80, T80-1) decreased the ground diameter by 10.97 and 11.06% compared to CK; the shade rate of 95% in two treatments (both T95, T95-1) decreased the ground diameter by 14.41 and 10.81% compared to CK, respectively, and there was a significant difference between CK and all treatments. The simulated sunfleck treatments resulted in increased growth in P. yunnanensis seedlings compared to the shade groups. Among them, the seedling height and diameter growth of P. yunnanensis seedlings were significantly increased by 8.21% and 12.38% in the T80-1 treatment group compared with the T80 treatment group. The seedling height and stem growth of P. yunnanensis seedlings increased by 15.10% and 53.80% in the T95-1 treatment group compared with the T95 treatment.

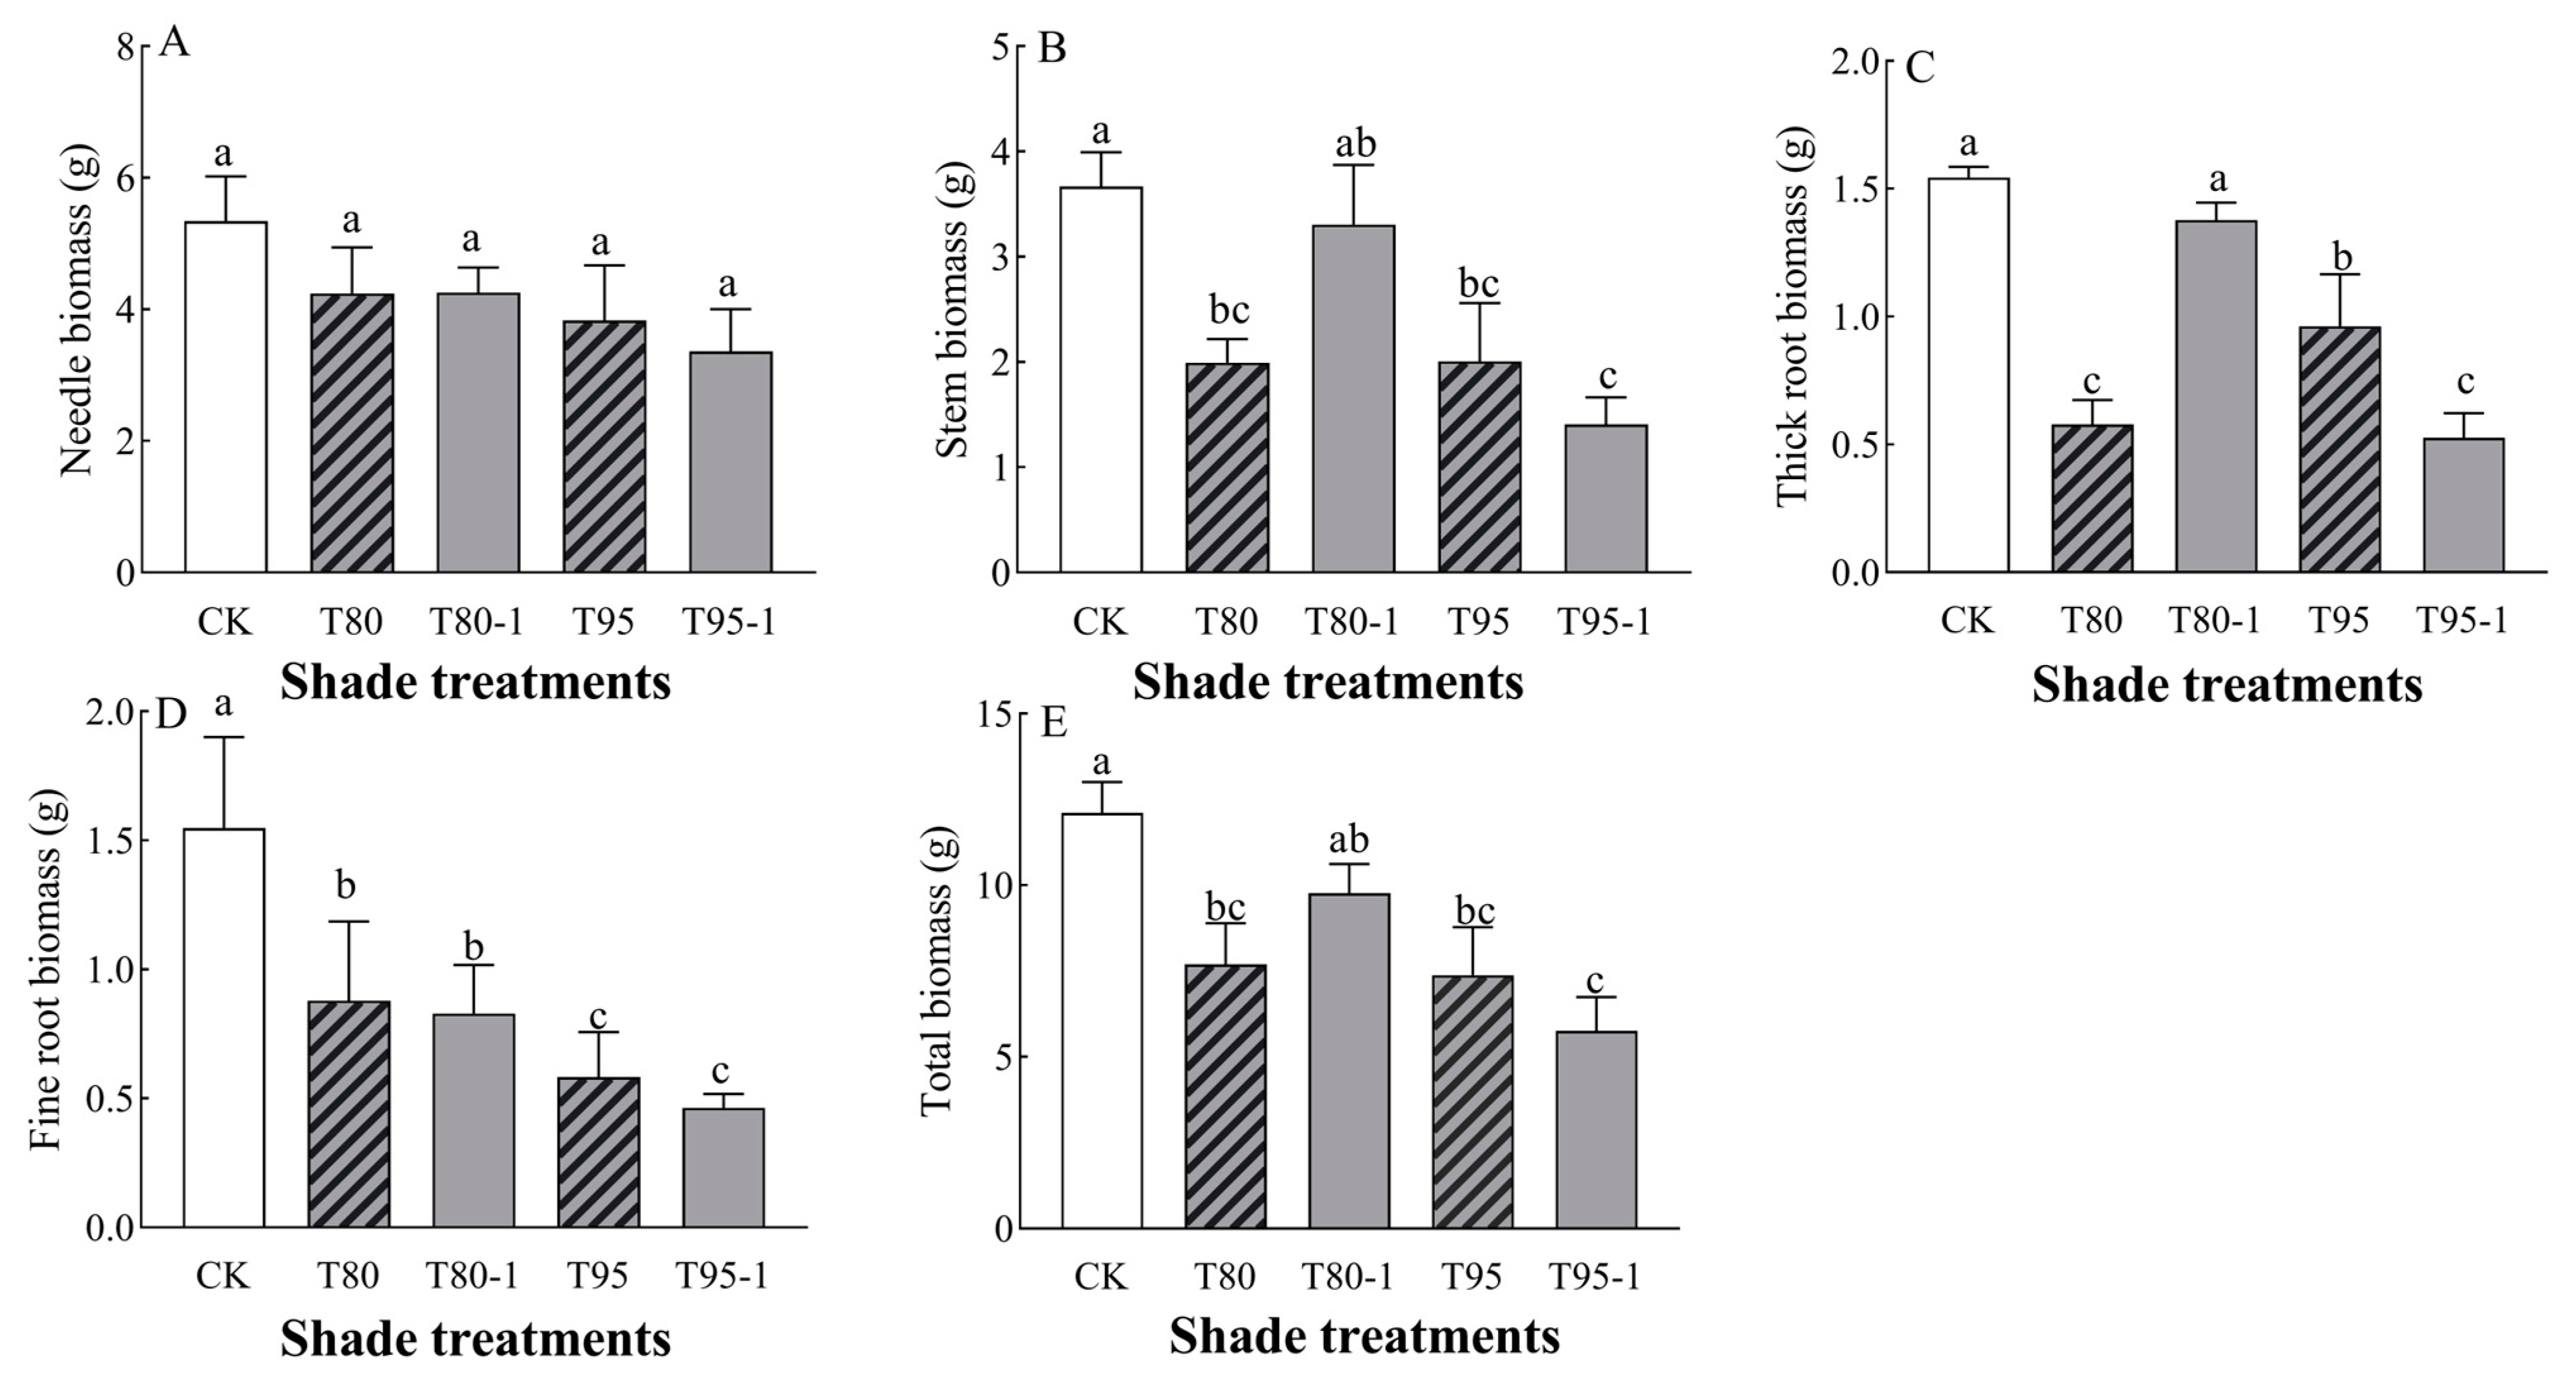
3.2. Effects of Different Shade and Simulated Sunfleck Treatments on Biomass of P. yunnanensis Seedlings

3.2.1. Biomass Changes

P. yunnanensis seedlings’ stem biomass, thick root biomass, and total biomass were significantly affected by light changes (Table 2). The biomass of each organ of the P. yunnanensis seedlings decreased with shade treatment and sunfleck treatment (Figure 1) and was significantly lower than that in CK under the T80, T95, and T95-1 treatments (p < 0.05). Needle biomass decreased with an increasing degree of sunfleck (p < 0.05) and was not significantly different (p < 0.05) under simulated sunfleck treatment compared to in the shade group. Stem biomass decreased under both shade and simulated sunfleck treatments, decreasing by 45.63, 45.37, and 61.61% (p < 0.05) under the T80, T95, and T95-1 treatments compared to CK and being elevated by 65.69% (p < 0.05) under the T80-1 treatment compared to the T80 treatment under the simulated sunfleck treatment. Thick root biomass was reduced under both shade and simulated sunfleck treatments compared to CK and decreased by 62.54%, 37.73%, and 66.02% (p < 0.05) under the T80. T95, and T95-1 treatments compared to CK; it was elevated by 137.90% (p < 0.05) under the T80-1 treatment compared to the T80 treatment and decreased by 45.43% (p < 0.05) under the T95-1 treatment compared to the T95 treatment. Fine root biomass was significantly (p < 0.05) reduced by 43.18%, 46.41%, 62.36%, and 70.00% (p < 0.05) under the shade and simulated sunfleck treatments compared to the CK treatment and there was no significant difference (p < 0.05) in the simulated sunfleck treatment (T80-1 and T95-1) compared to the shade group. Total biomass decreased by 36.43%, 19.28%, 39.02%, and 52.43% under the T80, T80-1, T95, and T95-1 treatments compared to CK; it increased by 137.90% under the simulated sunfleck treatment compared to T80, while it decreased by 26.99% under the T95-1 treatment compared to T95.

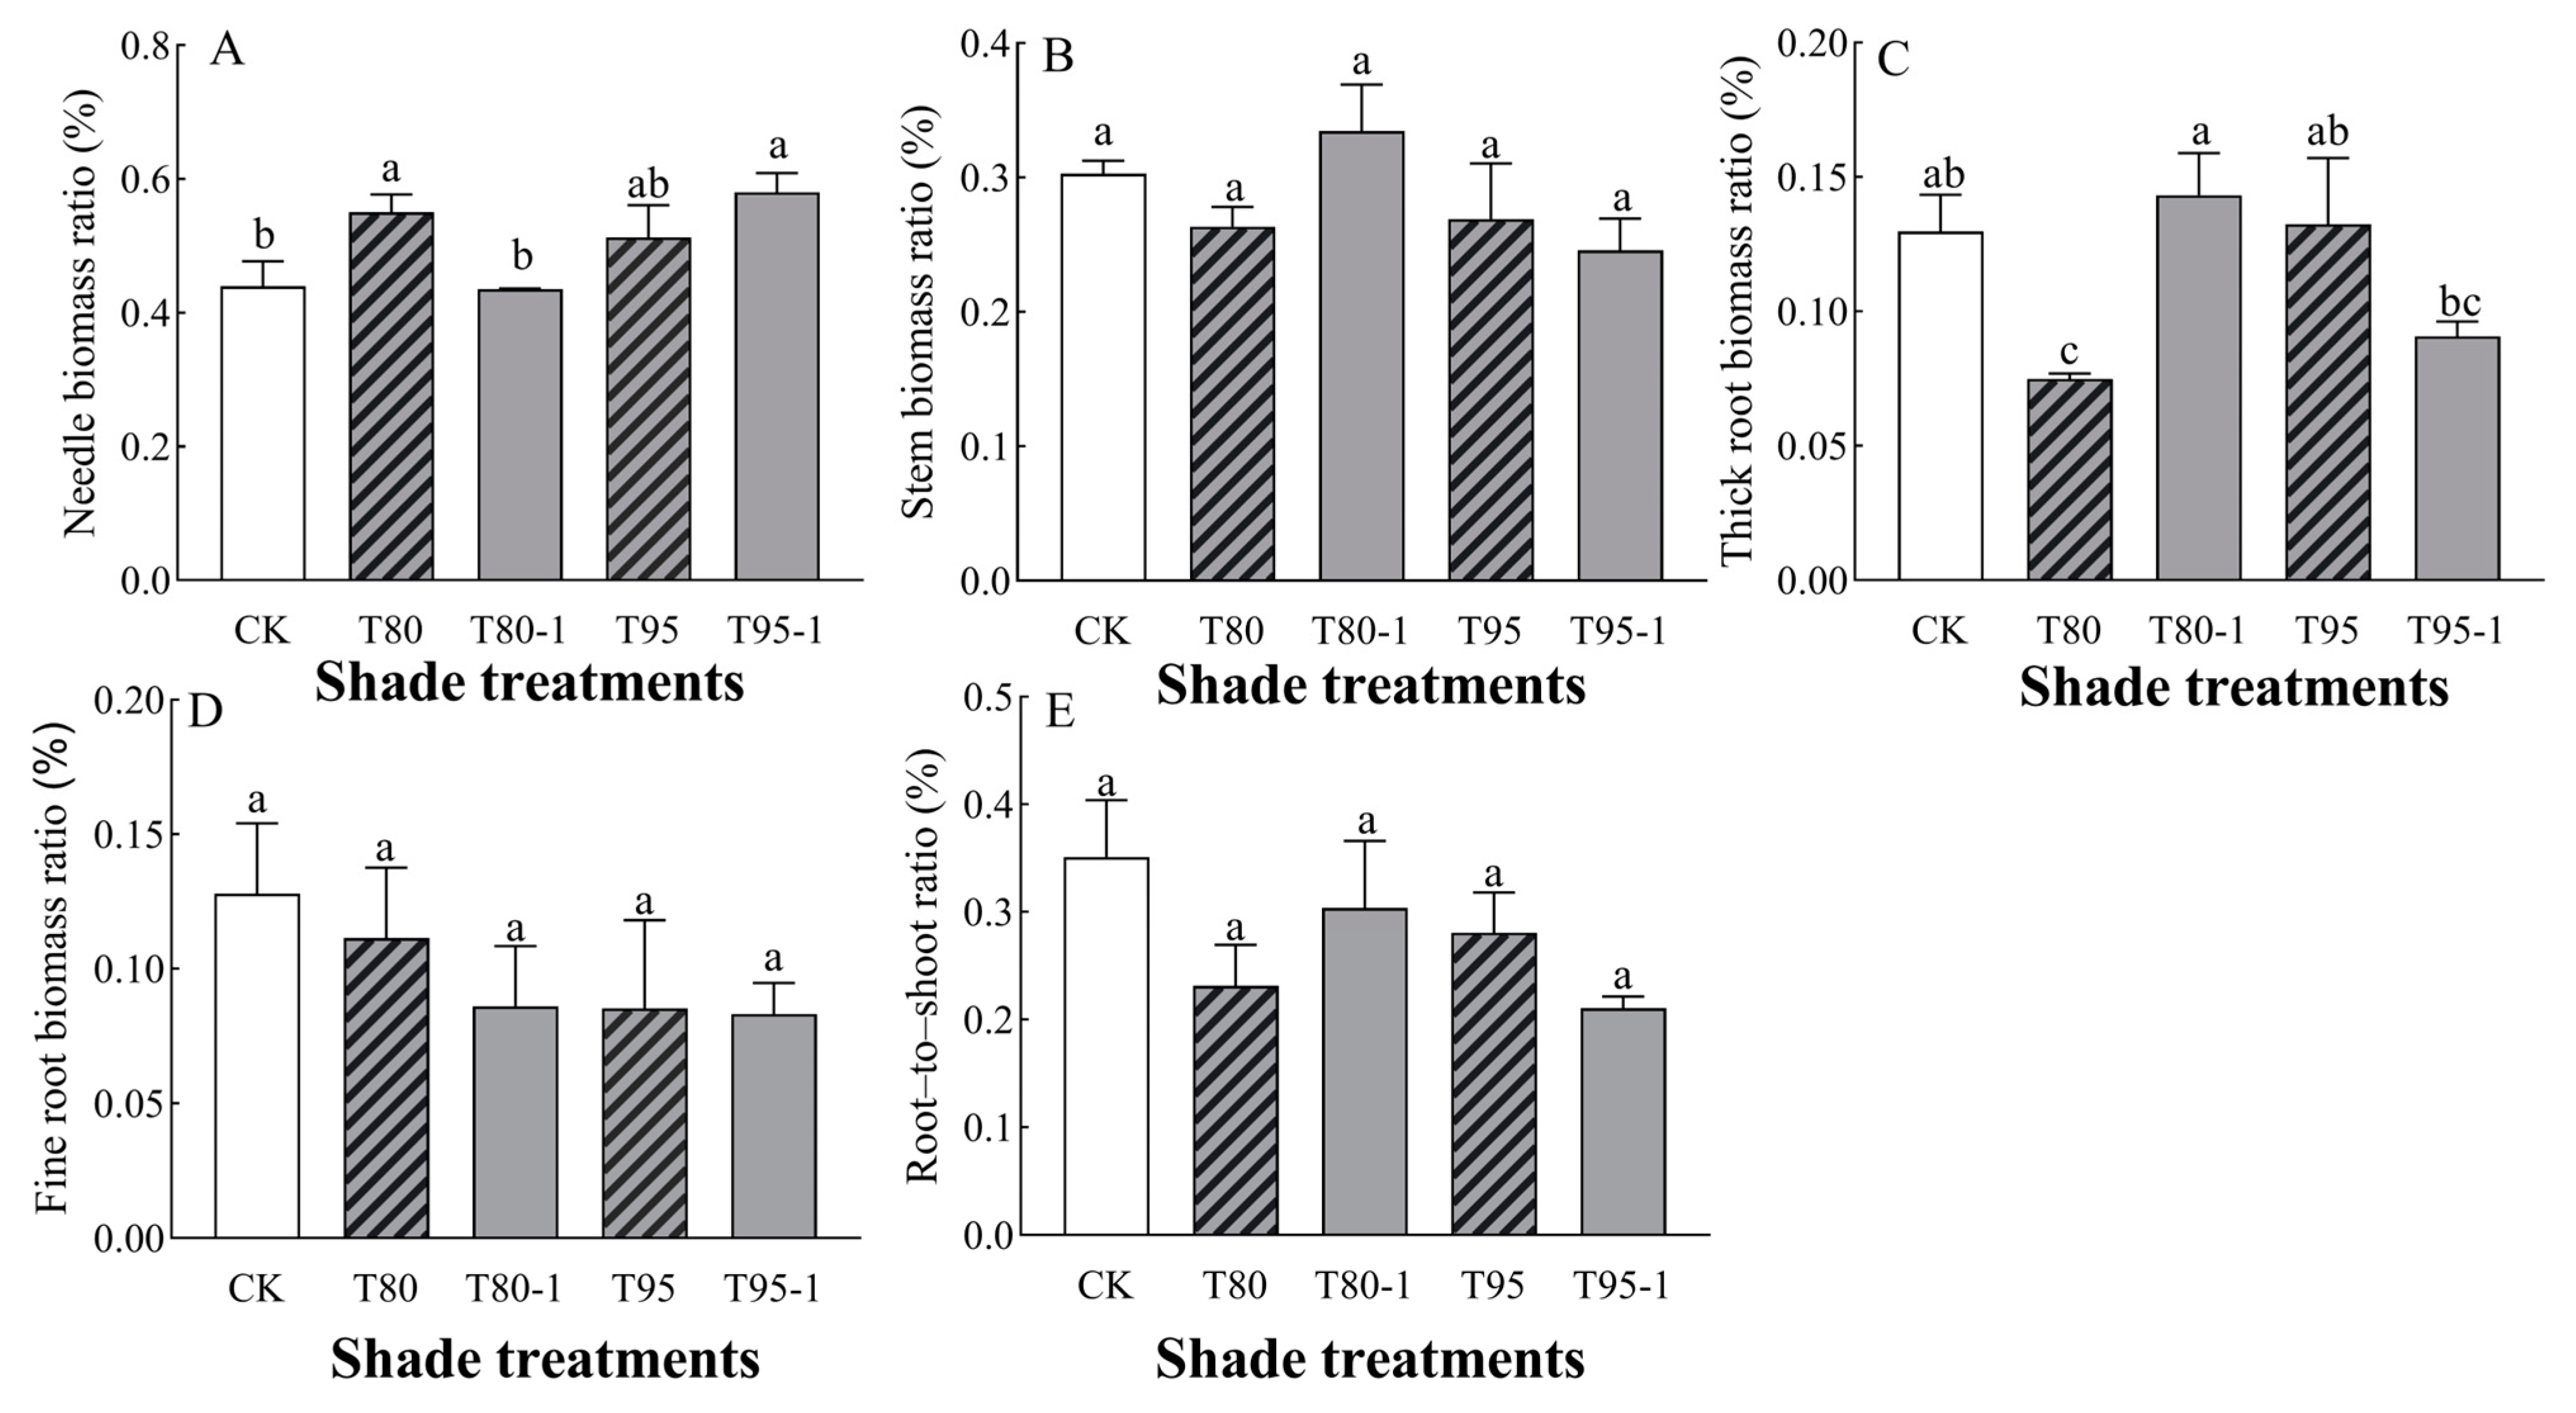
3.2.2. Changes in Biomass Allocation Ratio

The needle–biomass ratios and thick root–biomass ratios of P. yunnanensis seedlings were significantly affected by light changes (Table 2). The biomass allocation of each organ of P. yunnanensis seedlings increased and decreased with the shading treatments and sunfleck treatments (Figure 2). Among them, the needle–biomass ratio tended to increase with the shading and sunfleck treatments and was significantly higher by 20.07% and 24.22% (p < 0.05) under the T80 and T95-1 treatments compared with CK (Figure 2A); under the simulated sunfleck treatments, the ratio decreased by 20.75% (p < 0.05) under the T80-1 treatment compared with T80 and increased by 11.55% (p < 0.05) under the T95-1 treatment compared with the T95 treatment. Under the T80-1 treatment, the stem–biomass ratios of P. yunnanensis seedlings increased with increasing shade and shading treatments, but there were no significant differences between treatments (Figure 2B). The thick root–biomass ratio of P. yunnanensis seedlings increased under the T80-1 and T95 treatments, by 10.49% and 2.16%, respectively, while it decreased under the T80 and T95-1 treatments (Figure 2C). Under the simulated sunfleck treatment, thick root–biomass ratio was 91.32% higher (p < 0.05) than under the T80 treatment compared to the T80-1 treatment; the ratio was 31.47% lower under the T95-1 treatment compared to the T95 treatment. The ratio of fine root–biomass of P. yunnanensis seedlings decreased under both shade and shading treatments (Figure 2D), and the simulated sunfleck treatments had no significant effect on the shade treatments. The root–crown ratio of P. yunnanensis seedlings decreased with both shade and sunfleck treatments (Figure 2E), and there was no significant difference between treatments (p > 0.05); under the simulated sunfleck treatments, the ratio in the T80-1 treatment was higher than that in the T80 treatment, and that in the T95-1 treatment was lower than that in the T95 treatment.

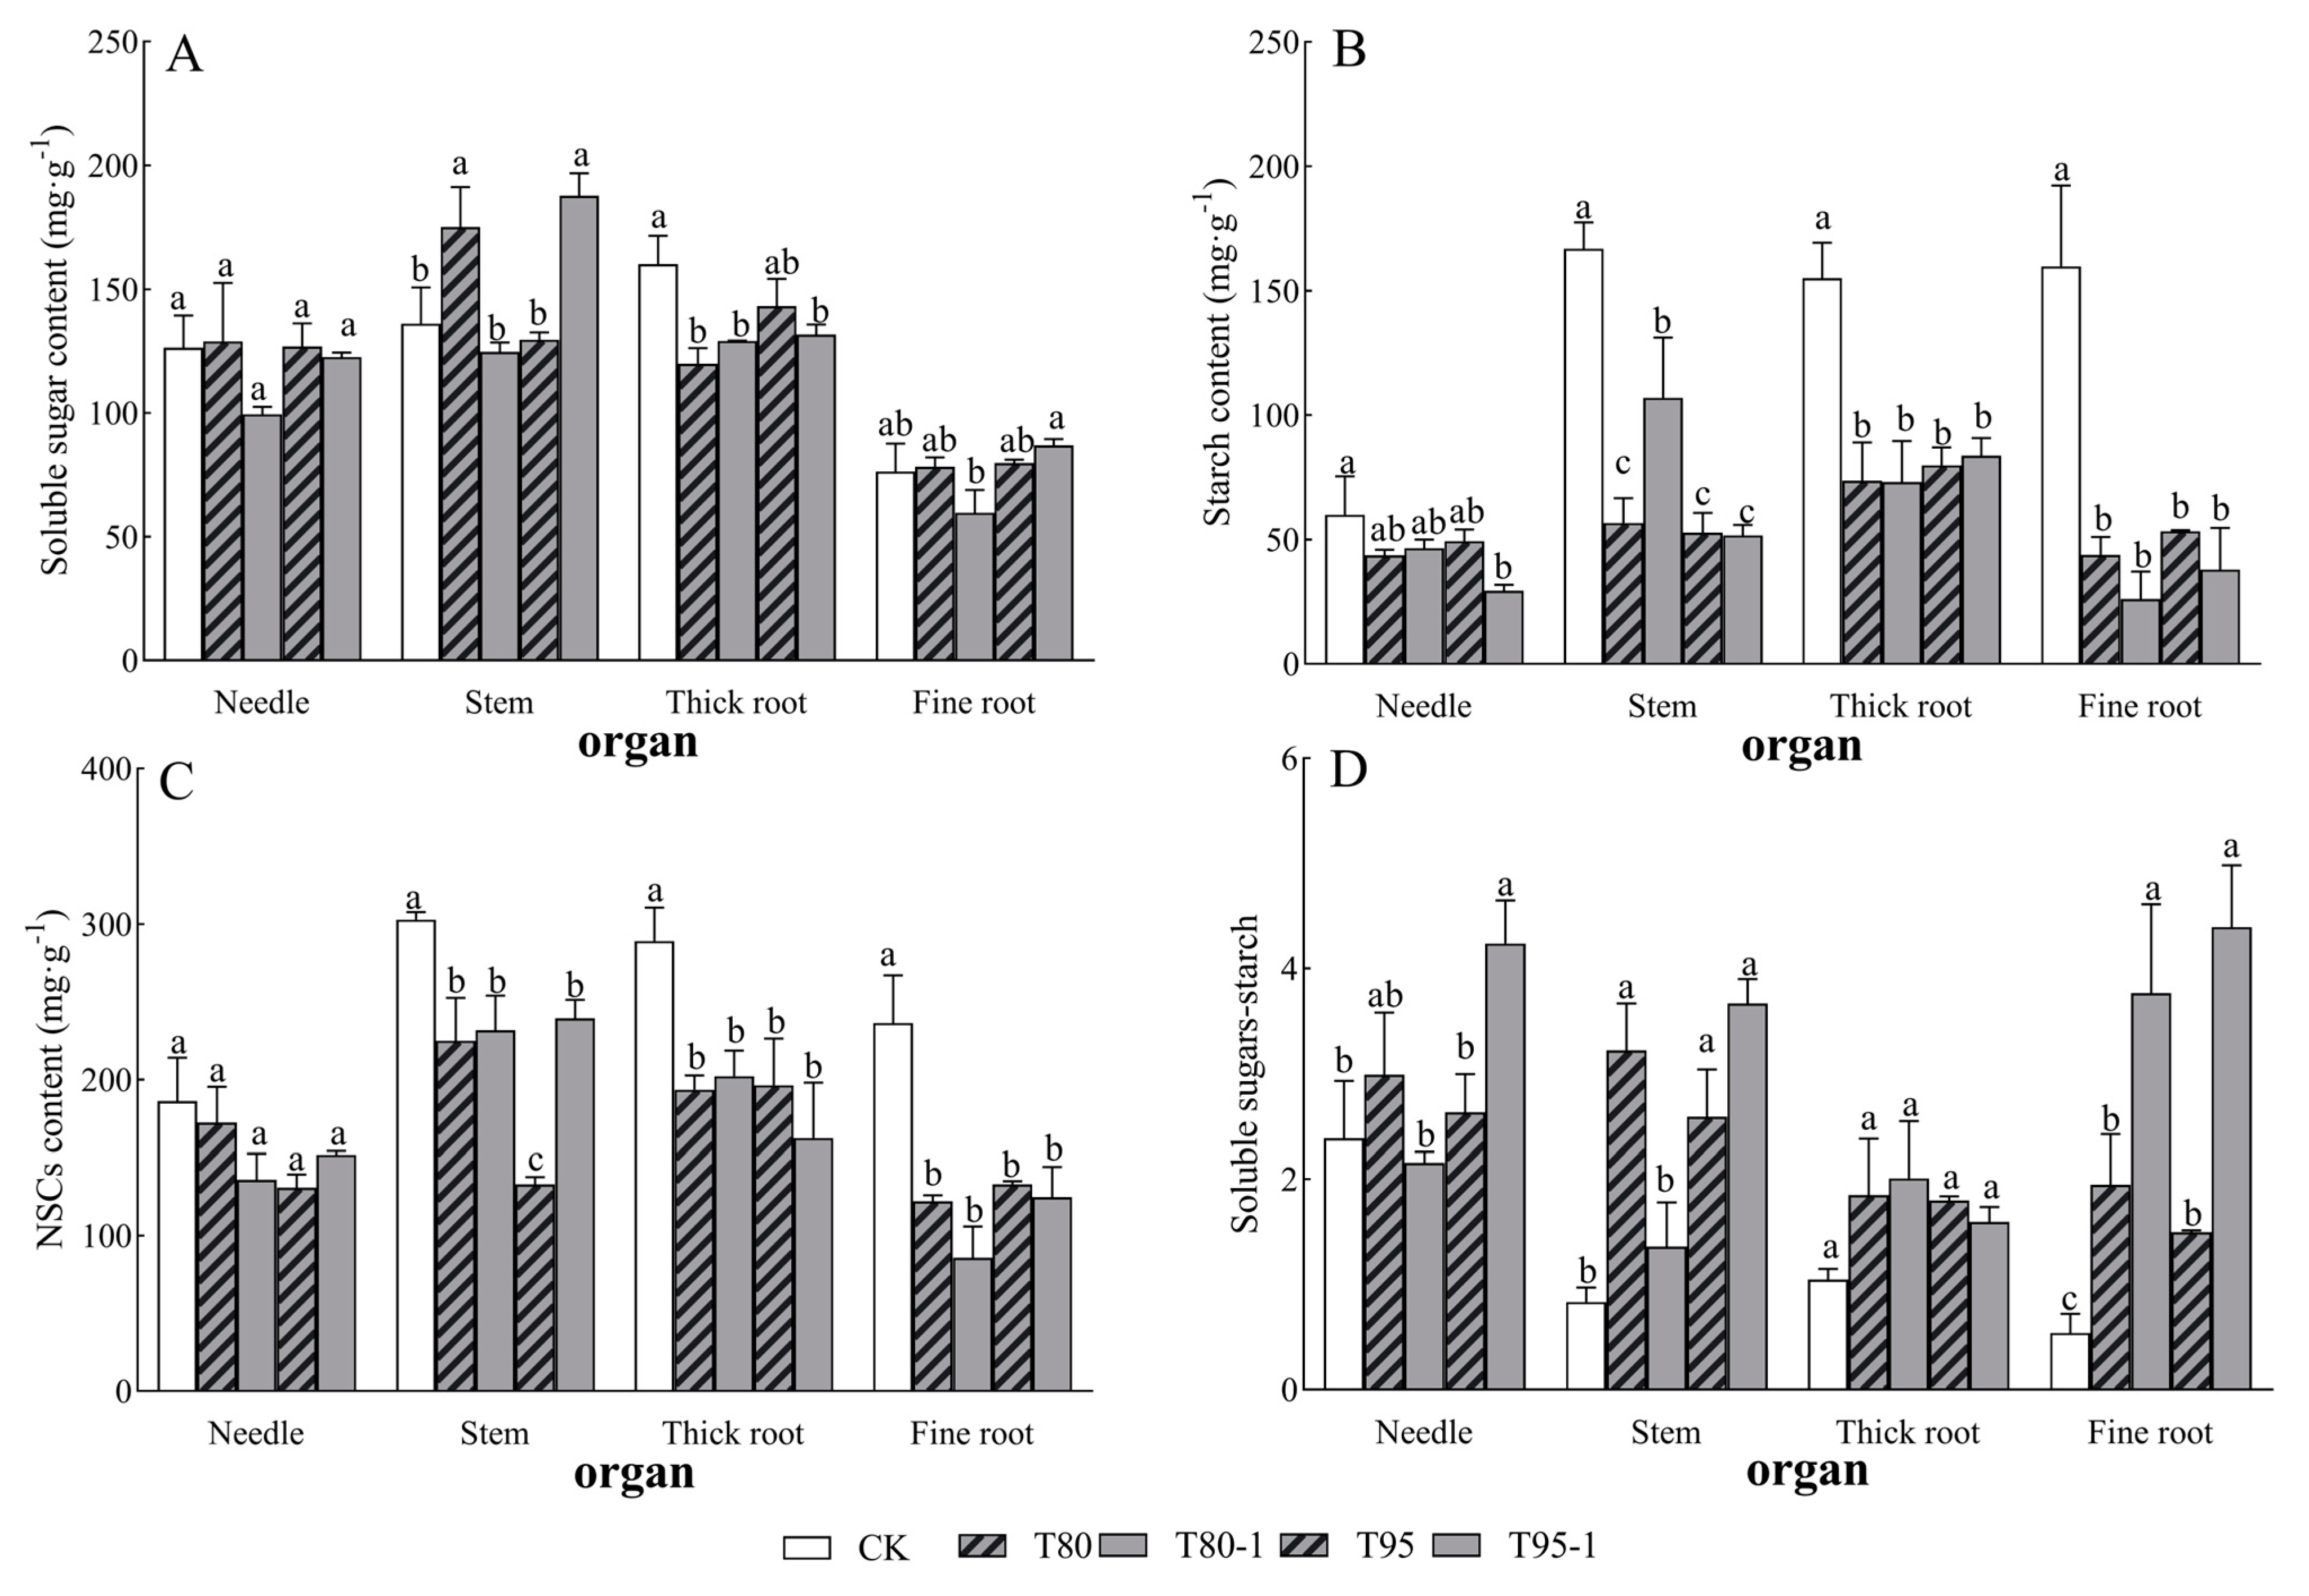
3.3. Effects of Different Shading and Simulated Sunfleck Treatments on P. yunnanensis Non-Structural Carbohydrates

Needle soluble sugars–starch, stem NSCs (including their fractions), thick root NSCs (including their fractions), fine root starch, and fine root NSCs in P. yunnanensis seedlings were significantly affected by light changes (Table 2). The soluble sugar content of each organ of P. yunnanensis seedlings increased and decreased with the increase in shading and simulated sunfleck treatments (Figure 3A), the starch content and NSCs content of each organ decreased (Figure 3B,C), and there was a tendency for the soluble sugar–starch ratio of each organ to increase (Figure 3D). Among them, the needle starch and NSCs contents of P. yunnanensis seedlings decreased by 27.32%, 22.54%, 17.78%, and 50.98% and 7.42%, 27.10%, 29.83%, and 18.46% with shading and simulated sunfleck treatments, respectively; the needle soluble sugar–starch ratios increased by 25.30%, 10.41%, and 77.43% under the T80, T95, and T95-1 treatments, respectively, compared to CK, while the needle soluble sugar–starch ratios decreased under the T80-1 treatment. The stem soluble sugars of P. yunnanensis seedlings significantly increased by 28.72% and 37.98% (p < 0.05) with shade and simulated sunfleck treatments under T80 and T95-1; the stem starch and NSCs content decreased by 66.11%, 35.89%, 68.42%, and 69.07% and 25.72%, 23.49%, 56.08%, and 21.00% (p < 0.05); and the stem soluble sugars–starch were elevated by 286.92%, 63.11%, 211.16%, and 340.64%. The thick root soluble sugars, starch, and NSCs contents showed significant decreases with shade and simulated sunfleck treatments; the stem soluble sugar–starch ratio showed an increase. The fine root soluble sugar content reached the minimum in T80-1 and the maximum in T95-1 with shading and simulated sunfleck treatments, with no significant difference among other treatments; the fine root starch content was reduced by 72.58%, 83.64%, 66.69%, and 76.32% and 48.29%, 63.70%, 43.68%, and 47.17%, respectively (p < 0.05).
Stem soluble sugar contents were higher under the T80 treatment compared to the simulated sunfleck treatments, and stem soluble sugar contents were significantly higher under the T95-1 treatment compared to T95. The stem starch content was significantly higher than that in T80 under the T80-1 treatment. The stem NSCs content was significantly higher than that in T95 under the T95-1 treatment. The needle and stem soluble sugar–starch ratio was significantly lower than that in T80 under the T80-1 treatment, and that in the T95-1 treatment was significantly higher than that in T95; meanwhile, the fine root soluble sugar–starch ratio was significantly higher in the sunfleck treatments (T80-1 and T90-1) than in the shade treatments (T80 and T90).

3.4. Distribution Pattern of Non-Structural Carbohydrates Under Shading and Simulated Sunfleck Treatments

The distribution patterns of soluble sugar, starch, and NSCs reserves in various organs of P. yunnanensis seedlings varied under different shading and simulated sunfleck treatments (Figure 4). The proportion of soluble sugar storage in the needles and fine roots of P. yunnanensis seedlings increased with shading and simulated sunfleck treatments, while the proportion of stems and thick roots decreased (Figure 4A). The proportion of starch storage in needles of P. yunnanensis seedlings increased with shading and simulated sunfleck treatments, while the proportion of starch storage in fine roots decreased, and the proportion of starch storage in stems and thick roots both increased and decreased (Figure 4B). The proportion of NSCs storage allocation in needles of P. yunnanensis seedlings increased with shading and simulated sunfleck treatments, while thick and fine roots showed a decrease, and the proportion of stem allocation increased and decreased (Figure 4C).
The proportion of soluble sugar, starch, and NSCs storage allocated to needles of P. yunnanensis seedlings was lower in T80-1 under the simulated sunfleck treatment than in T80 under the shade treatment. The proportion of soluble sugar, starch, and NSCs storage allocated to stems of P. yunnanensis seedlings was higher than that in the shade treatments (T80-1 and T95) under the simulated sunfleck treatments (T80-1 and T95), excepting that it was slightly lower than that in T80-1 under the T80 treatment. The proportion of soluble sugar, starch, and NSCs storage allocated to thick roots of P. yunnanensis seedlings was higher than that in T80 under the T80-1 treatment and lower than that in T90 under T90-1. The proportion of fine root storage allocation increased and decreased between the T95 and T95-1 treatments, but the differences were not significant.

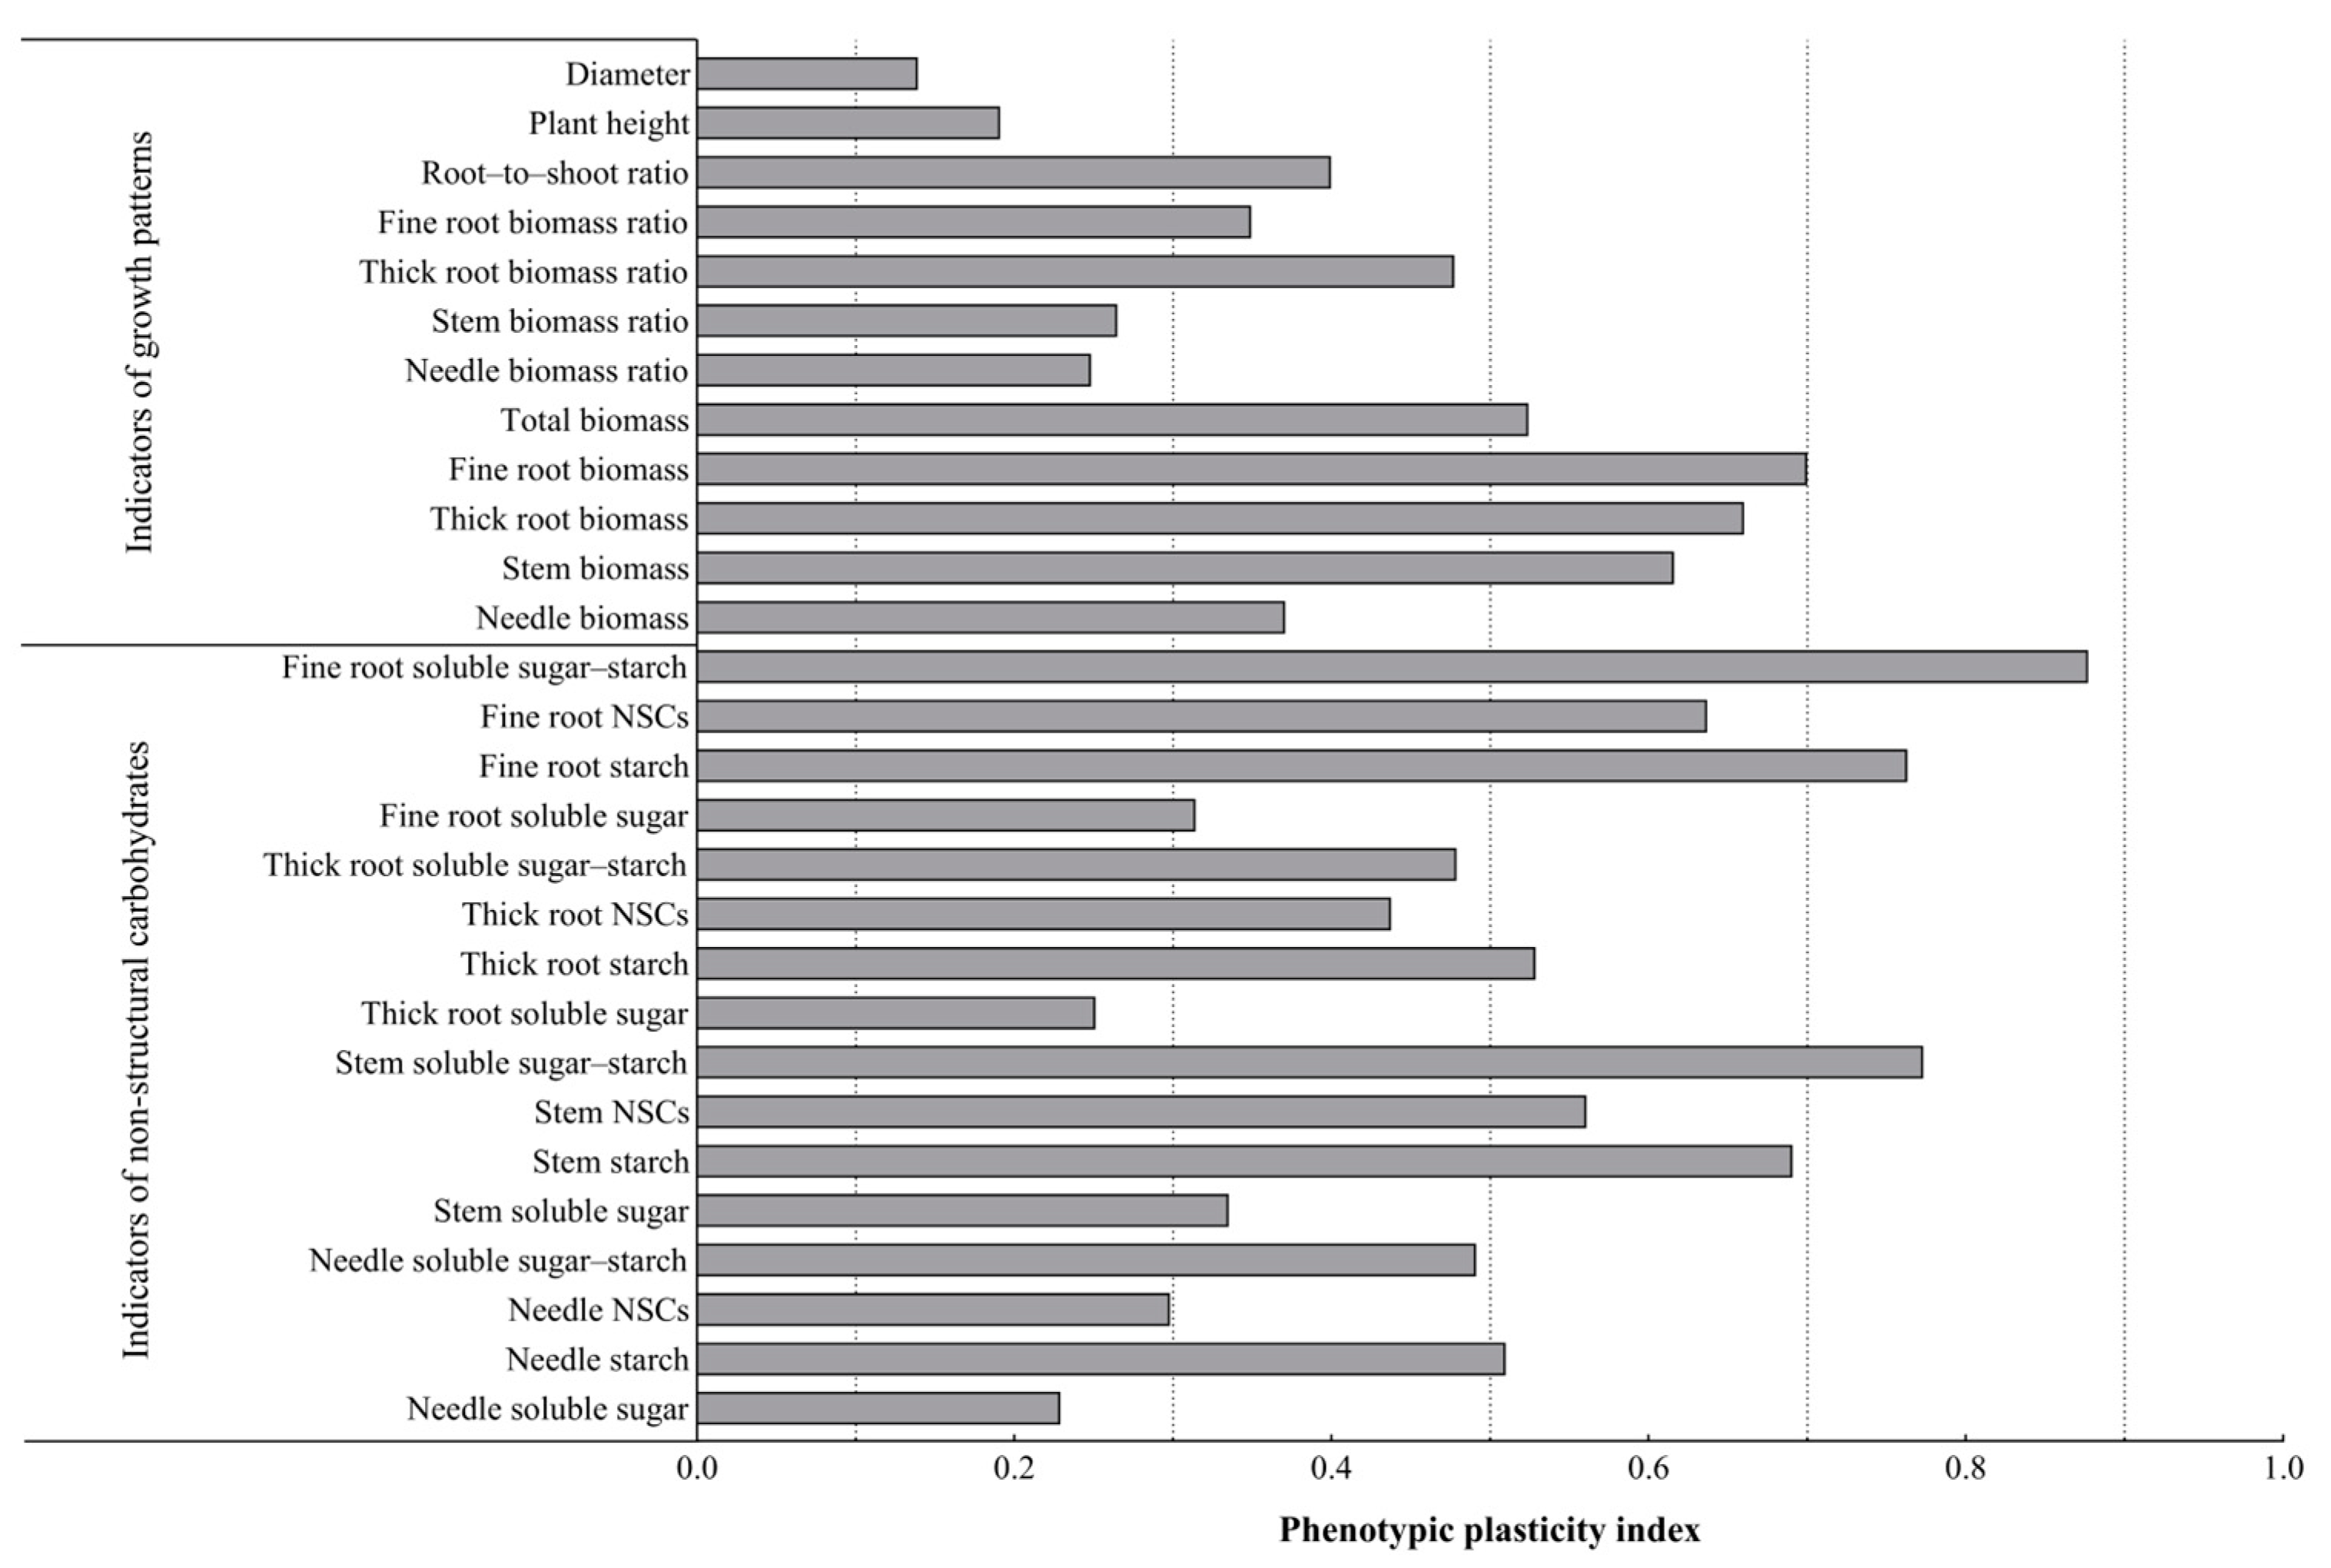
3.5. Phenotypic Plasticity Analysis of P. yunnanensis Seedling Growth and NSCs of Each Organ Under Different Light Conditions

As can be seen from Figure 5, among all the plasticity indexes, the fine root soluble sugar–starch plasticity index was the largest; from the three aspects of morphological characteristics (plant height, diameter), growth characteristics (biomass), and non-structural carbohydrate characteristics, no parameter in the morphological characteristics had a plasticity index of more than 0.5, and they had the lowest plasticity. The parameters of the growth characteristics and NSCs characteristics had higher plasticity indexes, and their plasticity was the greatest. Among them, the plasticity indexes of the fine root–biomass and thick root–biomass ratios were all larger; there were three parameters with larger plasticity indexes in the NSCs characteristics, namely the stem starch content, stem soluble sugar–starch, and needle soluble sugar–starch, and the stem starch content had the greatest plasticity, with a value of 0.571. In addition, the needle NSCs content had the least plasticity. These results indicate that P. yunnanensis seedlings responded to light changes mainly by changing the fine root biomass, thick root biomass, fine root NSCs (transformation), and stem NSCs (storage).

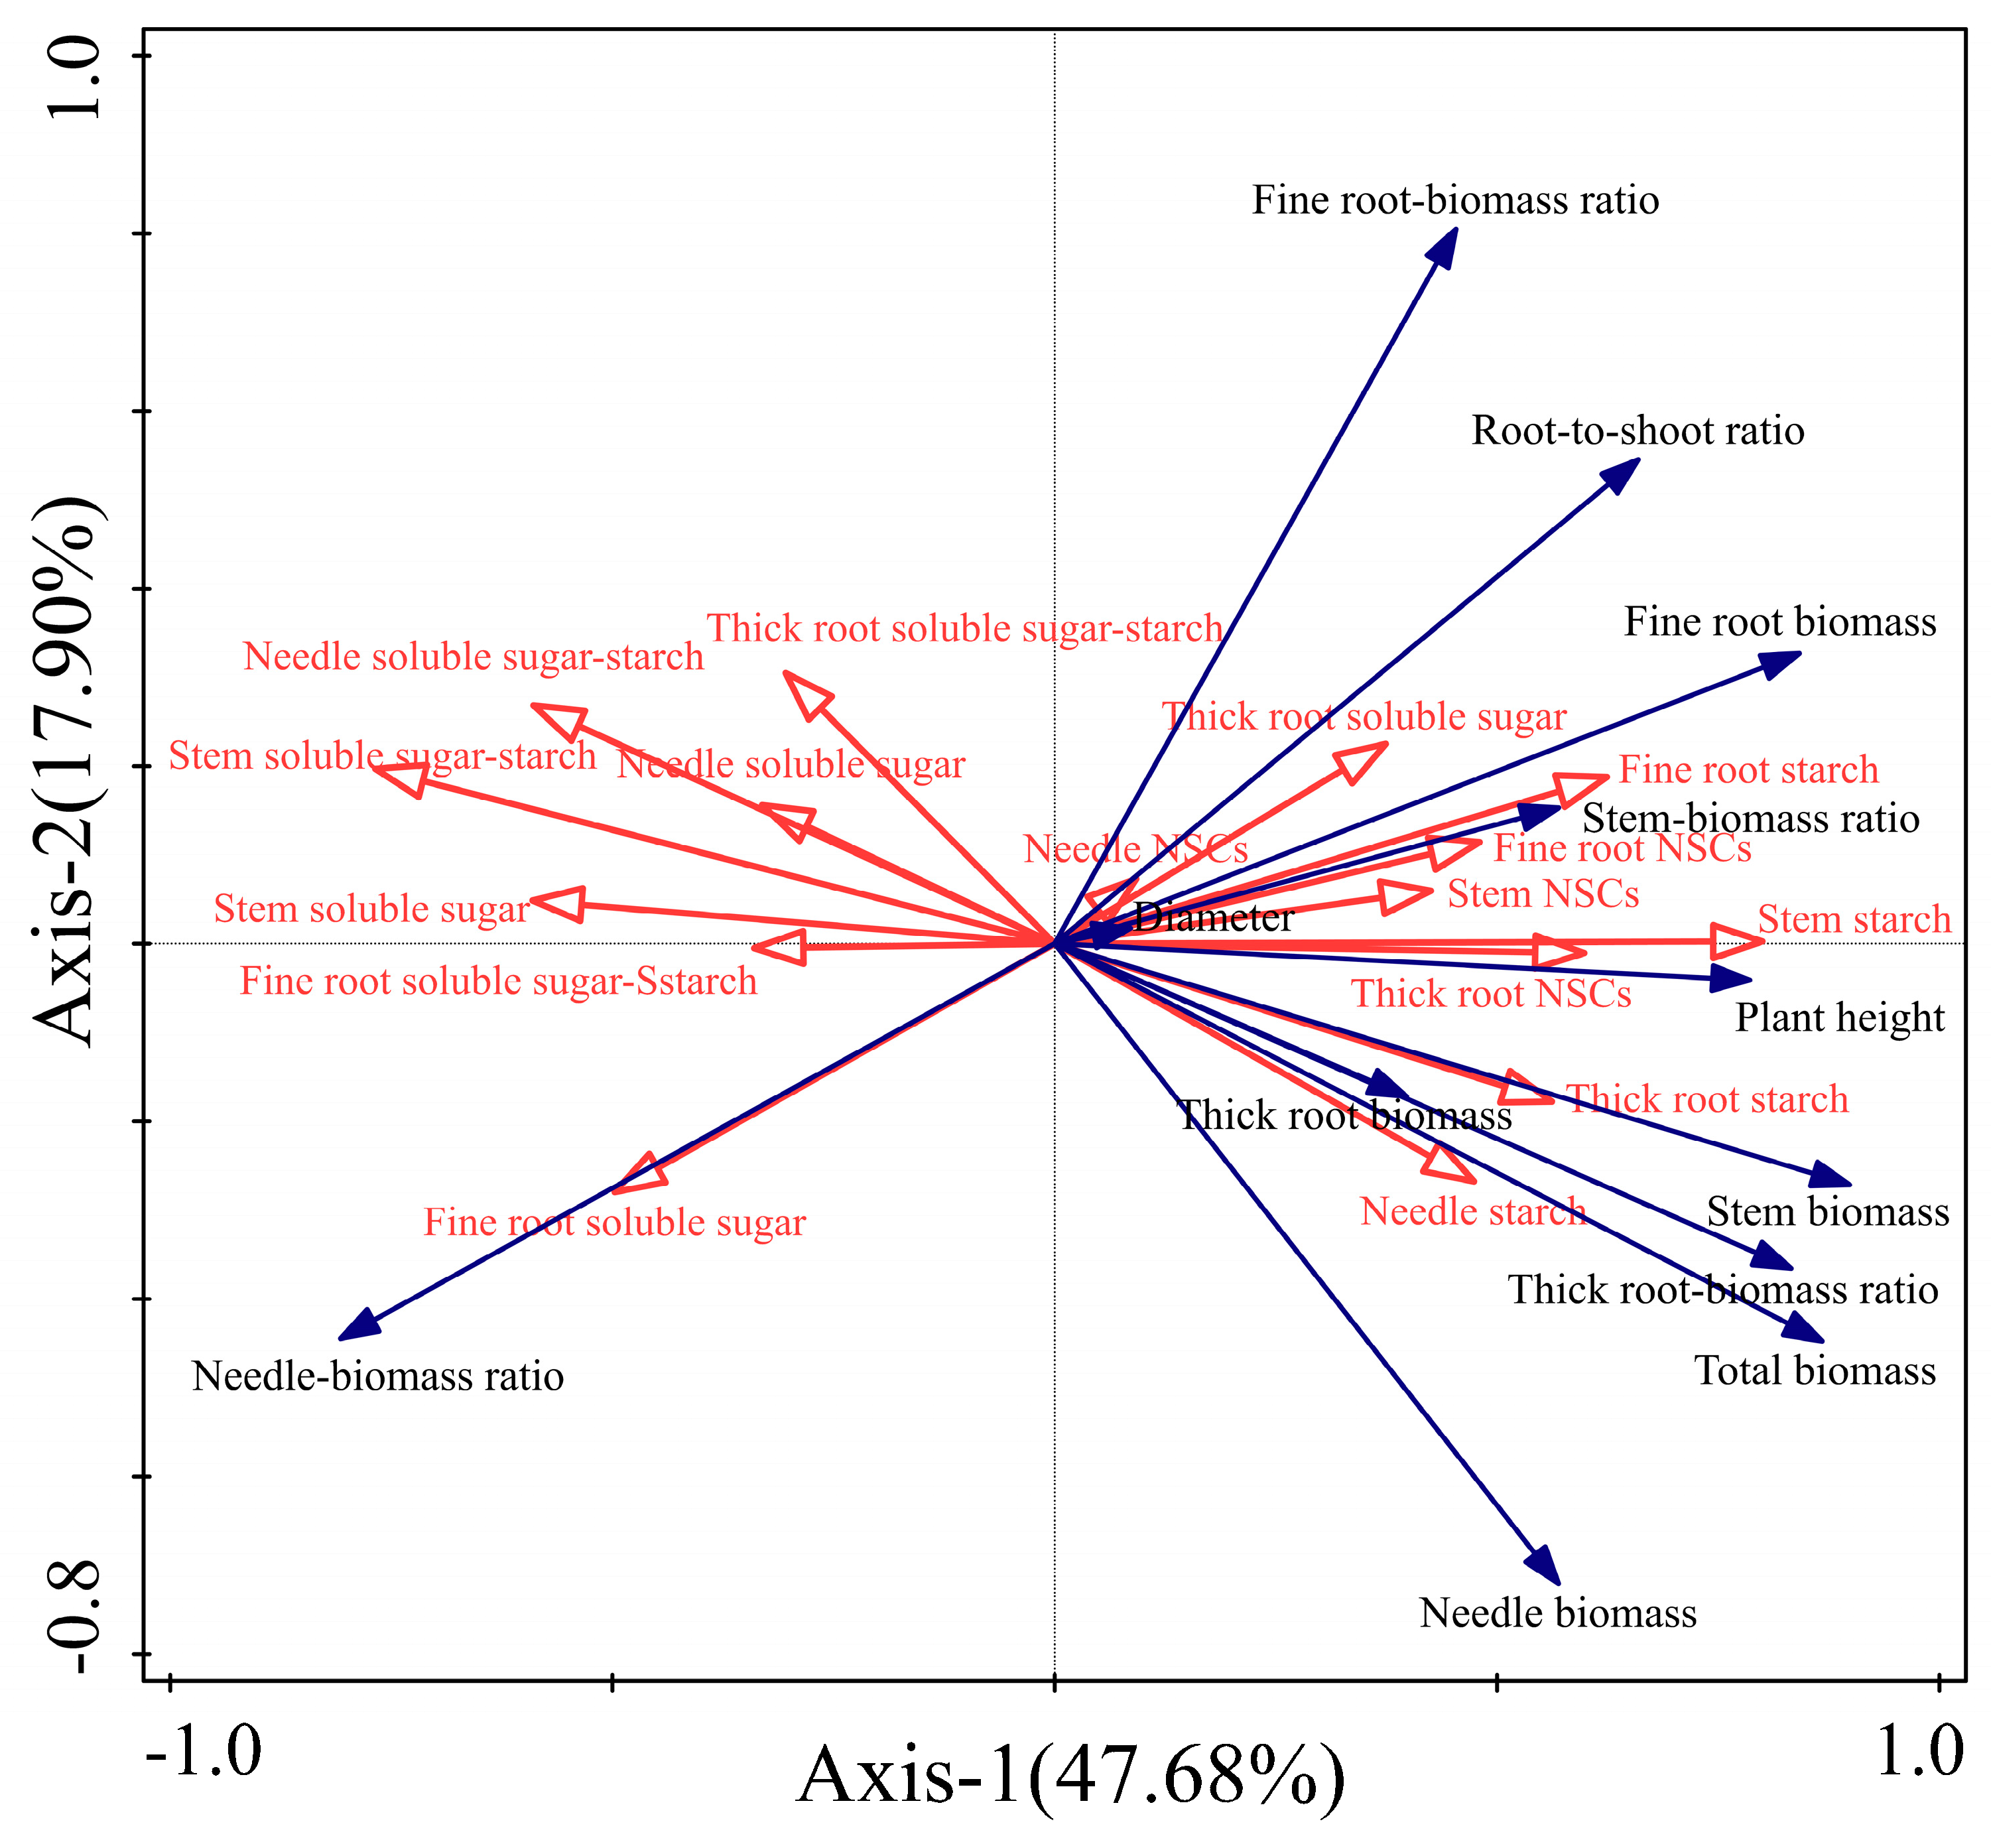
3.6. Relationship Between Non-Structural Carbohydrate Characteristics and Morphological Characteristics of P. yunnanensis Seedlings

Our RDA analysis of the non-structural carbohydrates indexes and growth characteristics indexes of each organ of P. yunnanensis seedlings explained that the first two axes of explanatory variables accounted for 65.58% of the total variance (Figure 6). Stem starch content was the main factor affecting the growth characteristic indexes of P. yunnanensis seedlings, and the explanation rate of the morphological indexes was 32.4% (p < 0.05). Among them, the ratio of soluble sugar–starch, needles soluble sugar, stem soluble sugar, and fine root soluble sugar of each organ of the P. yunnanensis seedlings were positively correlated with the ratio of needle–biomass and negatively correlated with other growth characteristic indexes. Stem starch, thick root starch, and fine root starch were positively correlated with the growth indicators (except for the needle–biomass ratio).

4. Discussion

4.1. Growth and Biomass Allocation of P. yunnanensis Seedlings in Response to Shading and Simulated Sunfleck

Seedling growth under shading conditions best reflects the adaptive strategies of plants to the light environment, and it has been shown that proper shading helps plant growth and the natural regeneration capacity of forests, while plant growth capacity is generally reduced under excessive shading conditions [25,30]. It is generally believed that the increment in the stem height of seedlings of shade-intolerant plants under shading conditions is larger, while the increment in ground diameter is smaller. The reason for this phenomenon may be that shade-intolerant plants under shading treatments use more energy for vertical growth and correspondingly less for lateral growth, which favours seedlings to break through the shady environment as much as possible to obtain more light energy [31,32]. In this study, it was found that the shading treatment led to a decrease in the seedling height and diameter growth of P. yunnanensis seedlings, and simulated sunfleck treatment was used in the simulated sunfleck treatment group, which led to a certain elevation in the growth of P. yunnanensis seedlings compared to the shading group (Table 1). This indicates that P. yunnanensis seedlings were more sensitive to the shading environment, and the growth of P. yunnanensis seedlings was inhibited in environments with shading higher than 80% (T80 and T95), which is in line with the findings of Pires et al. [33] that Passiflora palmeri var. sublanceolata is significantly limited under heavy shading. However, the stem growth of P. yunnanensis seedlings increased under the simulated sunfleckssunfleckstreatment, suggesting a higher sensitivity to light. This suggests that this understorey light patch environment had a positive effect on the growth of P. yunnanensis seedlings, which could improve the growth inhibition of P. yunnanensis seedlings due to excessive shading in the mature forest environment.
Through the accumulation of biomass and biomass distribution of different organs under different light intensities, plants can show the ability of the effective use of resources and supply of environmental resources, thus reflecting the adaptive characteristics of plants under different light intensities to compensate for the shortage of resources and thus improve the ability to obtain further resources [34]. In this study, the biomass of each organ of P. yunnanensis seedlings decreased under both shade and sunfleck treatments. The stem biomass, thick root biomass, and total biomass were significantly higher under the simulated sunfleck treatment in the T80-1 treatment compared to the T80 treatment, whereas the thick root biomass and total biomass were significantly lower under the T95-1 treatment compared to the T95 treatment (Figure 1). This showed that the over-shaded environment led to a decrease in the biomass of all organs of P. yunnanensis seedlings, which had a significant inhibitory effect on the biomass accumulation of P. yunnanensis seedlings, indicating that high light favoured the accumulation of biomass of P. yunnanensis seedlings, whereas in the low-light environment, P. yunnanensis seedlings adopted a conservative strategy to carry out the slow acquisition and consumption of resources so that the biomass accumulation was lower, and the biomass of P. yunnanensis seedlings’ roots, stems, and needles were all greatest in the full-light environment. The increase in the root biomass was beneficial to maintain normal water absorption and transpiration and a high photosynthetic rate, while the increase in the stem biomass was beneficial to the construction of the support structure and transport structure of P. yunnanensis seedlings. Moreover, in the 80% sunfleck environment, P. yunnanensis seedlings had an increased stem and thick root biomass to alleviate this shade environment, while in the 95% sunfleck environment, the P. yunnanensis thick root and total biomass decreased significantly. This suggests that P. yunnanensis seedlings in 80% light-patch conditions also allocated some biomass to underground thick roots to increase their own nutrient storage and transport functions, whereas in 95% light-patch conditions, P. yunnanensis seedlings allocated only the biomass that could be allocated back above ground to resist the external defect of insufficient photosynthesis products for themselves. In most woody plants, the pattern of biomass allocation is the variable that best reflects the environmental conditions in which they are placed and the competition from surrounding vegetation [35]. Optimal allocation theory suggests that plants adapt to different environmental conditions by adjusting allocation ratios among organs and that, in order to obtain the most growth-limiting environmental resources, plants always allocate biomass to the organs used to obtain the scarcest resources [36]. Under shading conditions, in order to obtain more light resources, plant seedling biomass allocation is shifted to above-ground parts, reducing the accumulation of underground storage material [37]. In this study, the needle–biomass ratio increased to some extent with the shade treatment and sunfleck treatment, while the fine root–biomass ratio and root–crown ratio decreased. In the simulated sunfleck treatment, the needle–biomass ratio and fine root–biomass ratio decreased significantly under the T80-1 treatment compared with the T80 treatment, while the stem–biomass ratio, thick root–biomass ratio, and root–crown ratio increased significantly under the T80-1 treatment compared with the T80 treatment. While thick root–biomass ratio and root–crown ratio of P. yunnanensis seedlings decreased significantly under the T95-1 treatment compared with the T95 treatment, other sunfleck treatments had no significant effect on the biomass ratio of each organ of P. yunnanensis seedlings (Figure 2). This indicates that under the shade treatment, P. yunnanensis seedlings allocated more resources to the above-ground parts in the low-light environment, increased light energy capture capacity by increasing needle biomass allocation, achieved a higher growth rate [36], and improved their light competition ability and survival fitness [38]. Under the 80% shading treatment, P. yunnanensis seedlings put more biomass into stems and thick roots, which increased the carbon uptake capacity of the needles and improved the strategy of the thick roots for nutrient and water storage in the P. yunnanensis seedlings in the shading environment. In contrast, the biomass allocation ratio and biomass changes in P. yunnanensis seedlings in the 95% sunfleck environment both consistently increased the above-ground biomass to improve carbon acquisition capacity, which is in line with the functional balance hypothesis [39], i.e., when plant growth is constrained by a certain resource, carbon assimilates are preferentially allocated to the organs that take up that resource.

4.2. Response of Non-Structural Carbohydrates in Various Organs of P. yunnanensis Seedlings to Shading and Simulated Sunfleck

The distribution pattern of plant NSCs is the result of the integrated action of multiple physiological and ecological processes, and the content of starch and soluble sugar in each organ in the plant body as well as the change in their ratio show different dynamic changes under different environmental conditions [40]. In general, NSCs in plants are usually in a dynamic balance of income and expenditure, and once this state is broken and the NSCs content in the plant body drops to a certain threshold, the plant may die due to carbon starvation [9]. Soluble sugars can be used as osmoregulatory substances to reduce the water potential of forest trees and maintain cell expansion pressure, which in turn promotes the adaptation of forest trees in adverse environments [41]. In this study, the soluble sugar content of each organ of P. yunnanensis seedlings increased and decreased with the increase in the shading and simulated sunfleck treatments, among which the soluble sugar content of P. yunnanensis stems was higher under T80 and T95-1, the soluble sugar content of thick roots decreased, and the soluble sugar of fine roots was the lowest under the treatment of T80-1 and were the highest under T95-1 (Figure 3A). This indicates that under shading conditions, P. yunnanensis seedlings allocated more soluble sugars to the stems; this finding is similar to that of a previous study [42] that maximised light interception by increasing the functional adaptation of physiological activities for vertical growth, i.e., shading escape. In this study, the starch content and NSCs content of all seedling organs of Yunnan pine decreased under the shading treatment (Figure 3B; Figure 3C). Starch is a storage substance in plants, suggesting that the reduced level of carbon assimilation in P. yunnanensis seedlings under shading resulted in an increase in carbon consumption [43]; or, possibly, reduced photosynthesis and enhanced respiration, resulting in the catabolism of starch content, also resulted in a decrease in the NSCs content [44], suggesting that P. yunnanensis did not use the carbohydrates for storage at 80% and 95% shading levels [44,45]. The soluble sugar–starch ratio tended to increase in all organs (Figure 3D), indicating that photosynthesis was inhibited in P. yunnanensis seedlings, but as the shade level increased, a large amount of soluble sugar was needed to help them maintain normal cellular tension [46], resulting in a significant increase in the ratio of soluble sugar to starch in needles of P. yunnanensis seedlings in the shaded environment. It has been suggested that the utilisation of photosynthetic products in forest trees conforms to the principle of ‘last in, first out’, i.e., forest trees tend to utilise newly synthesised photosynthetic products first [47], and soluble sugars, as the only form that can be utilised and transported by forest trees, are also the first to be utilised by newly synthesised or transported soluble sugars. Therefore, the increase in the ratio of soluble sugar to starch content in P. yunnanensis seedlings in shade may be more inclined to be dominated by the inhibition of the conversion of newly transported soluble sugars to starch.
Compared with the simulated sunfleck treatment, under 80% shade with simulated sunflecks, P. yunnanensis seedlings had increased needle soluble sugar, stem soluble sugar, and fine root soluble sugar contents; increased stem starch contents and fine root soluble sugar–starch ratios; decreased fine root starch contents and needle and stem soluble sugar–starch ratios; and decreased needle soluble sugar, starch, and NSCs storage. It was shown that under the 80% simulated sunfleck treatment, P. yunnanensis seedlings increased the osmoregulation and growth and development capacity of the above-ground parts of P. yunnanensis seedlings by increasing the soluble sugar content of needles, stems, and fine roots, as well as increasing the storage of starch by stems and converting more NSCs to soluble sugars, buffering the asynchrony of carbon supply and carbon demand among different organs of trees under shading environment [8]. In contrast, under the 95% simulated sunfleck treatment, the needle starch content and fine root starch content decreased, the stem NSCs content increased, and the needle, stem, and fine root soluble sugar–starch ratios increased (Figure 3D). The carbon consumption strategies exhibited were also consistent, i.e., under the 95% simulated sunfleck treatment, all organs except the coarse roots mitigated the lack of carbon uptake due to the low-light environment by decomposing their own stored starch as well as soluble sugars synthesised by the needles and leaves during the exposure process. Although the relative distribution of NSCs in each organ changed due to different shading and sunfleck treatments, P. yunnanensis seedlings did not die, suggesting that P. yunnanensis seedlings combine above-ground carbon-source organs (needles) as well as below-ground carbon pools [48] and nutrient-uptake organs (roots) during simulated sunflecks to regulate this deficit of long-term light insufficiency. This survival strategy is consistent with the shade avoidance response of plants, i.e., plants sense the change in signals from the surrounding light environment and convert the light signals into a series of biochemical reactions to achieve signal transmission and ultimately achieve the purpose of regulating their own physiological morphology to adapt to the surrounding environment [49]. This is a plastic response of plants to shade and other light stresses and is also a strategy for plants to compete for light resources in order to obtain more light for photosynthesis [50].

4.3. Effects of Non-Structural Carbohydrates Characteristics of Various Organs of P. yunnanensis Seedlings on Morphological Characteristics

In this study, a significant negative correlation between the growth and NSCs of P. yunnanensis seedlings under different shading treatments prevailed (Figure 6). These findings suggest that the trade-off between growth and NSCs storage is different when carbon supply in P. yunnanensis seedlings is limited by light conditions. Plants have continuously adapted to their surroundings by selecting traits and being selected over a long period of evolutionary time and have gradually developed many intrinsic physiological and extrinsic morphological adaptive strategies, and these ecological adaptive performance traits are called plant traits [51]. Plants rely on their phenotypic plasticity to adjust their acquisition and consumption of various resources in nature to maintain their normal growth and metabolism in response to different environmental conditions [25,52]. In the RDA analysis, stem starch content was the main factor affecting the growth characteristics of P. yunnanensis seedlings, with an explanation rate of 32.4% for the morphological indicators. The ratio of soluble sugar–starch, needle soluble sugar, stem soluble sugar, and fine root soluble sugar of each organ of P. yunnanensis seedlings were positively correlated with the ratio of needle–biomass and negatively correlated with other growth indicators. And the fine root biomass, thick root biomass, fine root NSCs, and stem NSCs plasticity indexes were higher in the phenotypic plasticity analysis (Figure 5). This indicated that in 80% and 95% shading environments, the carbon consumption of each organ of P. yunnanensis seedlings increased, and the biomass of each of their organs also increased and their growth was restricted, and P. yunnanensis seedlings adapted to this low-light environment by adjusting the ratio of soluble sugar to starch in each organ. In addition, NSCs storage can also prevent carbohydrate depletion and acute carbon starvation in adverse conditions [53]. When P. yunnanensis seedlings were exposed to low light, the NSCs content of each organ decreased, but the ratio increased, which is a reliable ‘conservative’ mechanism. This is similar to the case of NSCs changes in sun-loving plants, where understorey shade environments tend to limit carbon acquisition by young trees, and seedlings of sun-loving species are susceptible to death due to carbon starvation [15,54], whereas shade-tolerant species have higher NSCs content or carbon pools in the understorey and have higher survival rates [15,54].

5. Conclusions

The results showed that shading treatments significantly affected the growth form of P. yunnanensis seedlings as well as the non-structural carbohydrates content of each organ. Overall, 80% and 90% shading significantly inhibited the growth status of P. yunnanensis seedlings and reduced the biomass of each organ. The needle–biomass ratio increased with increasing shade and shading treatments, while the fine root–biomass ratio and root–crown ratio decreased. The soluble sugar content of each organ of P. yunnanensis seedlings increased slightly, and the starch content and NSCs content of each organ decreased, and the soluble sugar–starch ratio of each organ tended to increase. Under the simulated sunfleck treatment, the carbon assimilation capacity of shaded seedlings under brief high light intensity significantly improved. Relative to those in the always-shaded treatment, other P. yunnanensis seedlings had increased stem growth, which resulted in a significantly higher above-ground NSCs content, and a reduced thick root starch content and transported as much thick root-stored carbon as possible to the above-ground portion in order to mitigate the detrimental effect of shading on the seedlings’ carbon reserves. From the perspective of carbon economy, it was proved that photosynthesis under short-term strong light was favourable to seedling NSCs content increase and survival. When cultivating P. yunnanensis forests, it is recommended that branches within the canopy of large trees are pruned to increase forest light penetration (it is suggested that pruning so that the understorey light penetration is between 70% and 80% increases the regeneration capacity of P. yunnanensis seedlings) and to increase the density of light patches in the understorey, which can help to improve the regeneration capacity of Yunnan pothos P. yunnanensis forests.

Author Contributions

J.W.: Conceptualization, Data curation, Funding acquisition, Project administration, Writing—original draft, Writing—review and editing; W.Z., C.D. and C.L.: Conceptualization, Data curation, Investigation, Methodology, Software, Writing—original draft; Y.L.: Conceptualization, Data curation, Formal analysis, Investigation, Methodology, Software, Writing—original draft. All authors have read and agreed to the published version of the manuscript.

Funding

This work was co-supported by the National Natural Science Foundation of China (31960306).

Data Availability Statement

The datasets used during the current study are available from the corresponding author on reasonable request.

Acknowledgments

The authors would like to express their gratitude to the Southwest Forestry University for providing the necessary facilities to conduct this research.

Conflicts of Interest

The authors declare no conflicts of interest.

References

  1. Evans, J.R.; Poorter, H. Photosynthetic acclimation of plants to growth irradiance: The relative importance of specific leaf area and nitrogen partitioning in maximizing carbon gain. Plant Cell Environ. 2001, 24, 755–767. [Google Scholar] [CrossRef]
  2. Falster, D.S.; Westoby, M. Leaf size and angle vary widely across species: What consequences for light interception? New Phytol. 2003, 158, 509–525. [Google Scholar] [CrossRef]
  3. Poorter, L. Growth responses of 15 rain-forest tree species to a light gradient: The relative importance of morphological and physiological traits. Funct. Ecol. 2002, 13, 396–410. [Google Scholar] [CrossRef]
  4. Walters, M.B.; Reich, P.B. Are Shade Tolerance, Survival, and Growth Linked? Low Light and Nitrogen Effects on Hardwood Seedlings. Ecology 1996, 77, 841–853. [Google Scholar] [CrossRef]
  5. Mokany, K.; Raison, R.J.; Prokushkin, A.S. Critical analysis of root: Shoot ratios in terrestrial biomes. Glob. Change Biol. 2006, 12, 84–96. [Google Scholar] [CrossRef]
  6. Veneklaas, E.J.; Ouden, F. Dynamics of non-structural carbohydrates in two Ficus species after transfer to deep shade. Environ. Exp. Bot. 2005, 54, 148–154. [Google Scholar] [CrossRef]
  7. Li, W.; Chen, G.; Fang, Y.; Wang, T.; Wu, Y.; Wu, Y.; Liu, X.; Jiang, B. Hydrogen peroxide as a systemic messenger in the photosynthetic induction of mulberry leaves. J. For. Res. 2021, 32, 945–952. [Google Scholar] [CrossRef]
  8. O’Brien, M.; Leuzinger, S.; Philipson, C.; Tay, J.; Hector, A. Drought survival of tropical tree seedlings enhanced by non-structural carbohydrate levels. Nat. Clim. Change 2014, 4, 710–714. [Google Scholar] [CrossRef]
  9. Mcdowell, N.G. Mechanisms Linking Drought, Hydraulics, Carbon Metabolism, and Vegetation Mortality. Plant Physiol. 2011, 155, 1051–1059. [Google Scholar] [CrossRef]
  10. Reichenbacker, R.R.; Schultz, R.C.; Elwood, R.; Hart, E.R. Artificial defoliation effect on Populus growth, biomass production, and total nonstructural carbohydrate concentration. Environ. Entomol. 1996, 25, 632–642. [Google Scholar] [CrossRef]
  11. Dietze, M.C.; Sala, A.; Carbone, M.S.; Czimczi, C.I.; Mantooth, J.A.; Richardson, A.D.; Vargas, D. Nonstructural carbon in woody plants. Annu. Rev. Plant Biol. 2014, 65, 667–687. [Google Scholar] [CrossRef] [PubMed]
  12. Kozlowski, T. Carbohydrate sources and sinks in woody plants. Bot. Rev. 1992, 58, 107–222. [Google Scholar]
  13. Koch, K. Carbohydrate-modulated gene expression in plants. Annu. Rev. Plant Physiol. Plant Mol. Biol. 1996, 47, 509–540. [Google Scholar] [CrossRef]
  14. Chapin, F.S.I.; Schulze, E.; Mooney, H.A. The ecology and economics of storage in plants. Annu. Rev. Ecol. Syst. 1990, 21, 423–447. [Google Scholar] [CrossRef]
  15. Myers, J.A.; Kitajima, K. Carbohydrate storage enhances seedling shade and stress tolerance in a neotropical forest. J. Ecol. 2007, 95, 383–395. [Google Scholar] [CrossRef]
  16. Jacquet, J.S.; Bosc, A.; O’Grady, A.; Jacte, H. Combined effects of defoliation and water stress on pine growth and non-structural carbohydrates. Adv. Eng. Softw. 2014, 34, 367–376. [Google Scholar] [CrossRef] [PubMed]
  17. Quentin, A.G.; Pinkard, E.A.; Ryan, M.G. Non-structural carbohydrates in woody plants compared among laboratories. Tree Physiol. 2015, 35, 1146–1165. [Google Scholar] [CrossRef]
  18. Shi, C.; Silva, L.C.R.; Zhang, H.; Zheng, Q.; Xiao, B.; Wu, N.; Sun, G. Climate warming alters nitrogen dynamics and total non-structural carbohydrate accumulations of perennial herbs of distinctive functional groups during the plant senescence in autumn in an alpine meadow of the Tibetan Plateau, China. Agric. For. Meteorol. 2015, 200, 21–29. [Google Scholar] [CrossRef]
  19. Liu, W.; Su, J.; Li, S.; Lang, X.; Huang, X.; Zhang, Z. Variation of Non-Structural Carbohydrates for the Dominant Species in a Monsoon Broad-Leaved Evergreen Forest in Pu’Er, Yunnan Province. Sci. Silvae Sin. 2017, 53, 1–9. [Google Scholar]
  20. Liu, Y.; Xiao, J.; Sun, J.; Zhao, Z.; Deng, X.; Wu, J.; Zhang, D.; Bao, Y. Seasonal variation in C:N:P stoichiometry, nonstructural carbohydrates, and carbon isotopes of two coniferous pioneer tree species in subtropical China. Front. Plant Sci. 2023, 27, 1225436. [Google Scholar] [CrossRef]
  21. Shen, J.; Li, Z.; Gao, C.; Li, S.; Huang, X.; Lang, X.; Su, J. Radial growth response of Pinus yunnanensis to rising temperature and drought stress on the Yunnan Plateau, southwestern China. For. Ecol. Manag. 2020, 474, 118357. [Google Scholar] [CrossRef]
  22. Xu, Y.; Woeste, K.; Cai, N.; Kang, X.; Li, G.; Chen, S.; Duan, A. Variation in needle and cone traits in natural populations of Pinus yunnanensis. J. For. Res. 2016, 27, 41–49. [Google Scholar] [CrossRef]
  23. Su, W.; Yu, J.; Zhang, S.Z.; Wang, L.; Zhao, G.; Zhou, R. Comparison of the canopy and soil seed banks of Pinus yunnanensis in central Yunnan, China. For. Ecol. Manag. 2019, 437, 41–48. [Google Scholar] [CrossRef]
  24. Wang, X.Z.; Wang, L.F.; Wang, Y.; Huang, Y.; Ding, Z.; Zhou, J.; Gou, D. Identification and genetic analysis of the pinewood nematode Bursaphelenchus xylophilus from Pinus yunnanensis. For. Pathol. 2015, 45, 388–399. [Google Scholar] [CrossRef]
  25. Liu, Y.X.; Wu, J.W.; Jing, H.Q. Non-structural carbohydrate (NSC) content and C:N:P stoichiometry of Pinus yunnanensis seedling needles in response to shade treatment. Ind. Crop Prod. 2024, 210, 118138. [Google Scholar] [CrossRef]
  26. Yang, Y.; Luo, Y. Carbon: Nitrogen stoichiometry in forest ecosystems during stand development. Glob. Ecol. Biogeogr. 2011, 20, 354–361. [Google Scholar] [CrossRef]
  27. Frey, B.R.; Ashton, M.S. Growth, survival and sunfleck response of underplanted red oaks (Quercus spp.; section Erythrobalanus) along a topographic gradient in southern New England. For. Ecol. Manag. 2018, 30, 419–420. [Google Scholar] [CrossRef]
  28. Wagner, A.; McGraw, J.B. Sunfleck effects on physiology, growth, and local demography of American ginseng (Panax quinquefolius L.). For. Ecol. Manag. 2013, 291, 220–227. [Google Scholar] [CrossRef]
  29. Zhao, S.J. The Experimental Guide for Plant Physiology, 3rd ed.; Science Press: Beijing, China, 2002. [Google Scholar]
  30. Katahata, S.; Naramoto, M.; Kakubari, Y.; Mukai, Y. Photosynthetic capacity and nitrogen partitioning in foliage of the evergreen shrub Daphniphyllum humile along a natural light gradient. Tree Physiol. 2007, 27, 199–208. [Google Scholar] [CrossRef] [PubMed]
  31. Liu, B.; Liu, Q.; Daryanto, S.; Guo, S.; Huang, Z.; Wang, Z.; Wang, L.; Ma, X. Responses of Chinese fir and Schima superba seedlings to light gradients: Implications for the restoration of mixed broadleaf-conifer forests from Chinese fir monocultures. For. Ecol. Manag. 2018, 419–420, 51–57. [Google Scholar] [CrossRef]
  32. Niinemets, Ü. A review of light interception in plant stands from leaf to canopy in different plant functional types and in species with varying shade tolerance. Ecol. Res. 2010, 25, 693–714. [Google Scholar] [CrossRef]
  33. Pires, M.V.; Almeida, A.A.F.; Figueiredo, A.L. Photosynthetic characteristics of ornamental passion flowers grown under different light intensities. Photosynthetica 2011, 49, 593–602. [Google Scholar] [CrossRef]
  34. Poorter, H.; Nagel, O. The role of biomass allocation in the growth response of plants to different levels of light, CO2, nutrients and water: A quantitative review. Aust. J. Plant Physiol. 2000, 27, 595–607. [Google Scholar]
  35. Poorter, L.; Hayashida-Oliver, Y. Effects of seasonal drought on gap and understorey seedlings in Bolivian moistforest. J. Trop. Ecol. 2000, 16, 481–498. [Google Scholar] [CrossRef]
  36. Mediavilla, S.; Escudero, A. Differences in biomass allo-cation patterns between saplings of two co-occurring Mediterranean oaks as reflecting different strategies in the use of light and water. Eur. J. For. Res. 2010, 129, 697–706. [Google Scholar] [CrossRef]
  37. Portsmuth, A.; NiinemetsI, Ü. Structural and physiological plasticity in response to light and nutrients in five temperate deciduous woody species of contrasting shade tolerance. Funct. Ecol. 2007, 21, 61–77. [Google Scholar] [CrossRef]
  38. McConnaughay, K.D.M.; Coleman, J.S. Biomass allocation in plants: Ontogeny or optimality? A test along three resource gradients. Ecology 1999, 80, 2581–2593. [Google Scholar] [CrossRef]
  39. Deng, X.X.; Xiao, W.F.; Shi, Z.; Zeng, L.X.; Lei, L. Combined effects of drought and shading on growth and Non-Structural carbohydrates in Pinus massoniana Lamb. Seedlings. Forests 2019, 11, 18. [Google Scholar] [CrossRef]
  40. Liu, Q.Q.; Huang, Z.J.; Wang, Z.N.; Chen, Y.F.; Wen, Z.M.; Liu, B.; Mulualem, T. Responses of leaf morphology, NSCs contents and C:N:P stoichiometry of Cunninghamia lanceolata and Schima superba to shading. BMC Plant Biol. 2020, 20, 354. [Google Scholar] [CrossRef]
  41. Silva, E.N.; Ferreira-Silva, S.L.; Viégas, R.A.; Silveira, J.A. The role of organic and inorganic solutes in the osmotic adjustment of drought-stressed Jatropha curcas plants. Environ. Exp. Bot. 2010, 69, 279–285. [Google Scholar] [CrossRef]
  42. Bllaré, C.L.; Scopel, A.L.; Sànchez, R.A. Foraging for light: Photosensory ecology and agricultural implications. Plant Cell Environ. 1997, 20, 820–825. [Google Scholar] [CrossRef]
  43. Wei, C.; Li, Y.; Jin, Z.; Luo, G.; Chen, C.; Shan, F. Effects of Shading on Photosynthetic Characteristics and Non-structural Carbohydrate Content of Heptacodium miconioides Seedlings. Bull. Bot. Res. 2022, 42, 10. [Google Scholar]
  44. Zhang, L.; Zhang, D. Gender Differences in Growth and Physiological Respond of Phellodendron amurense Rupr. in Condition of Overshadow. Bull. Bot. Res. 2020, 40, 735–742. [Google Scholar]
  45. Yin, D.; Shen, H.; Wei, X. Effects of Shading on Physocarpus amurensis Seedlings Photosynthetic Ability and Carbohydrate Accumulation. Bull. Bot. Res. 2017, 37, 841–847. [Google Scholar]
  46. Piper, F.I. Drought induces opposite changes in the concentration of non-structural carbohydrates of two evergreen Nothofagus species of differential drought resistance. Ann. For. Sci. 2011, 68, 415–424. [Google Scholar] [CrossRef]
  47. Petrussa, E.; Boscutti, F.; Vianello, A.; Casolo, V. “Last in-first out”: Seasonal variations of non-structural carbohydrates, glucose-6-phospate and ATP, in tubers of two Arum species. Plant Biol. 2017, 20, 346–356. [Google Scholar] [CrossRef]
  48. Eissenstat, D.M.; Yanai, R.D. The ecology of root lifespan. Adv. Ecol. Res. 1997, 27, 1–60. [Google Scholar]
  49. Galvão, V.C.; Fankhauser, C. Sensing the light environment in plants: Photoreceptors and early signaling steps. Curr. Opin. Neurobiol. 2015, 34, 46–53. [Google Scholar] [CrossRef]
  50. Kebrom, T.H.; Brutnell, T.P.; Finlayson, S.A. Suppression of sorghum axillary bud outgrowth by shade, phyB and defoliation signalling pathways. Plant Cell Environ. 2010, 33, 48–58. [Google Scholar] [CrossRef]
  51. Bradshaw, A.D. Unravelling phenotypic plasticity why should we bother. New Phytol. 2006, 170, 644–648. [Google Scholar] [CrossRef]
  52. Se, H.P.; Jae, H.L.; Sang, Y.N. An Analysis of the Growth and Photosynthetic Responses of Potted Veronica pusanensis Y.N. Lee according to the Shading Levels. J. People Plants Environ. 2023, 26, 219–231. [Google Scholar]
  53. Smith, A.M.; Stitt, M. Coordination of carbon supply and plant growth. Plant Cell Environ. 2007, 30, 1126–1149. [Google Scholar] [CrossRef] [PubMed]
  54. Poorter, L.; Kitajima, K. Carbohydrate storage and light requirements of tropical moist and dry forest tree species. Ecology 2007, 88, 1000–1011. [Google Scholar] [CrossRef] [PubMed]
Figure 1. Changes in the biomass of P. yunnanensis seedlings with different shading and simulated sunfleck treatments. Needle biomass (A), stem biomass (B), thick root biomass (C), fine root biomass (D), and total biomass (E). The error bars indicate the standard deviation of the mean (n = 5). Different letters indicate significant differences (p < 0.05) with LSD multiple-range tests. CK: full sun; T80: 80% shade at all times; T80-1: 80% shade with the shed open for 1 h at noon; T95: 95% shade at all times; T95-1: 95% shade with the shed open for 1 h at noon.
Forests 16 00522 g001
Figure 2. Changes in the biomass allocation of P. yunnanensis seedlings by different shading and simulated sunfleck treatments. The needle–biomass ratio (A), stem–biomass ratio (B), thick root–biomass ratio (C), fine root–biomass ratio (D), and root-to-shoot ratio (E). The error bars indicate the standard deviation of the mean (n = 5). Different letters indicate significant differences (p < 0.05) with LSD multiple-range tests. CK: full sun; T80: 80% shade at all times; T80-1: 80% shade with the shed open for 1 h at noon; T95: 95% shade at all times; T95-1: 95% shade with the shed open for 1 h at noon.
Forests 16 00522 g002
Figure 3. Changes in non-structural carbohydrates in P. yunnanensis under shading and simulated sunfleck treatments. Soluble sugar content (A), starch content (B), NSCs content (C), and soluble sugar–starch (D). The error bars indicate the standard deviation of the mean (n = 5). Different letters indicate significant differences (p < 0.05) with LSD multiple-range tests. CK: full sun; T80: 80% shade at all times; T80-1: 80% shade with the shed open for 1 h at noon; T95: 95% shade at all times; T95-1: 95% shade with the shed open for 1 h at noon.
Forests 16 00522 g003
Figure 4. Effects of shading and simulated sunfleck treatments on non-structural carbohydrate storage of P. yunnanensis. Soluble sugar stock allocation ratio (A); starch stock allocation ratio (B); NSCs stock allocation ratio (C). CK: full sun; T80: 80% shade at all times; T80-1: 80% shade with the shed open for 1 h at noon; T95: 95% shade at all times; T95-1: 95% shade with the shed open for 1 h at noon.
Forests 16 00522 g004
Figure 5. Plasticity indexes of the performance of shading and simulated sunfleck treatments on the growth of P. yunnanensis seedlings and non-structural carbohydrates in various organs.
Forests 16 00522 g005
Figure 6. Redundancy analysis of non-structural carbohydrates traits (red arrows) and morphological traits (blue arrows) in P. yunnanensis seedlings with different shading and simulated sunfleck treatments. The percentages of the two RDA axes refer to the amount of explanation from the non-structural carbohydrates indexes and growth characteristics indexes.
Forests 16 00522 g006
Table 1. Effects of the same shade and simulated sunfleck treatments on the growth indexes of P. yunnanensis seedlings.
TreatmentsPlant Height/cmDiameter/mm
Before TreatmentAfter TreatmentIncrementBefore TreatmentAfter TreatmentIncrement
CK6.79 ± 0.06 a10.43 ± 0.02 a3.65 ± 0.06 a8.72 ± 0.09 a12.21 ± 0.16 a3.49 ± 0.15 a
T806.32 ± 0.07 c8.89 ± 0.03 b2.57 ± 0.04 c8.77 ± 0.03 a10.87 ± 0.12 b2.10 ± 0.10 c
T80-16.06 ± 0.03 d8.86 ± 0.02 b2.80 ± 0.04 b8.50 ± 0.05 ab10.86 ± 0.17 b2.36 ± 0.21 bc
T956.51 ± 0.05 b8.43 ± 0.02 c1.92 ± 0.06 e8.61 ± 0.06 a10.45 ± 0.08 c1.84 ± 0.10 c
T95-16.61 ± 0.04 b8.82 ± 0.02 b2.21 ± 0.06 d8.06 ± 0.29 b10.89 ± 0.05 b2.83 ± 0.27 b
Note: Lowercase letters indicate significant differences between treatments at the same time. CK indicates normal light; T80 indicates 80% shade; T80-1 indicates 80% shade with simulated sunflecks; T95 indicates 95% shade; and T95-1 indicates 95% shade with simulated sunflecks.
Table 2. One-way ANOVA of morphological indicators and non-structural carbohydrates in P. yunnanensis seedlings with different shade treatments.
FactorFp
Needle soluble sugar0.8980.501
Needle starch2.1530.148
Needle NSCs1.7070.225
Needle soluble sugar–starch3.5050.049
Stem soluble sugar7.0940.006
Stem starch14.3620.000
Stem NSCs12.8610.001
Stem soluble sugar–starch11.1680.001
Thick root soluble sugar3.8340.039
Thick root starch7.4960.005
Thick root NSCs3.7530.041
Thick root soluble sugar–starch1.1440.390
Fine root soluble sugar2.1670.147
Fine root starch9.7680.002
Fine root NSCs9.1260.002
Fine root soluble sugar–starch1.2430.354
Needle biomass1.2160.363
Stem biomass5.4200.014
Thick root biomass15.7910.000
Fine root biomass3.0680.068
Total biomass5.0790.017
Needle–biomass ratio3.9720.035
Stem–biomass ratio1.6580.235
Thick root–biomass ratio4.0890.032
Fine root–biomass ratio0.6500.639
Root-to-shoot ratio1.6440.239
Note: F indicates the effect of shading treatment on each indicator; p > 0.05 means no significant effect; p < 0.05 means a significant difference; p < 0.01 means a highly significant difference.
Disclaimer/Publisher’s Note: The statements, opinions and data contained in all publications are solely those of the individual author(s) and contributor(s) and not of MDPI and/or the editor(s). MDPI and/or the editor(s) disclaim responsibility for any injury to people or property resulting from any ideas, methods, instructions or products referred to in the content.

